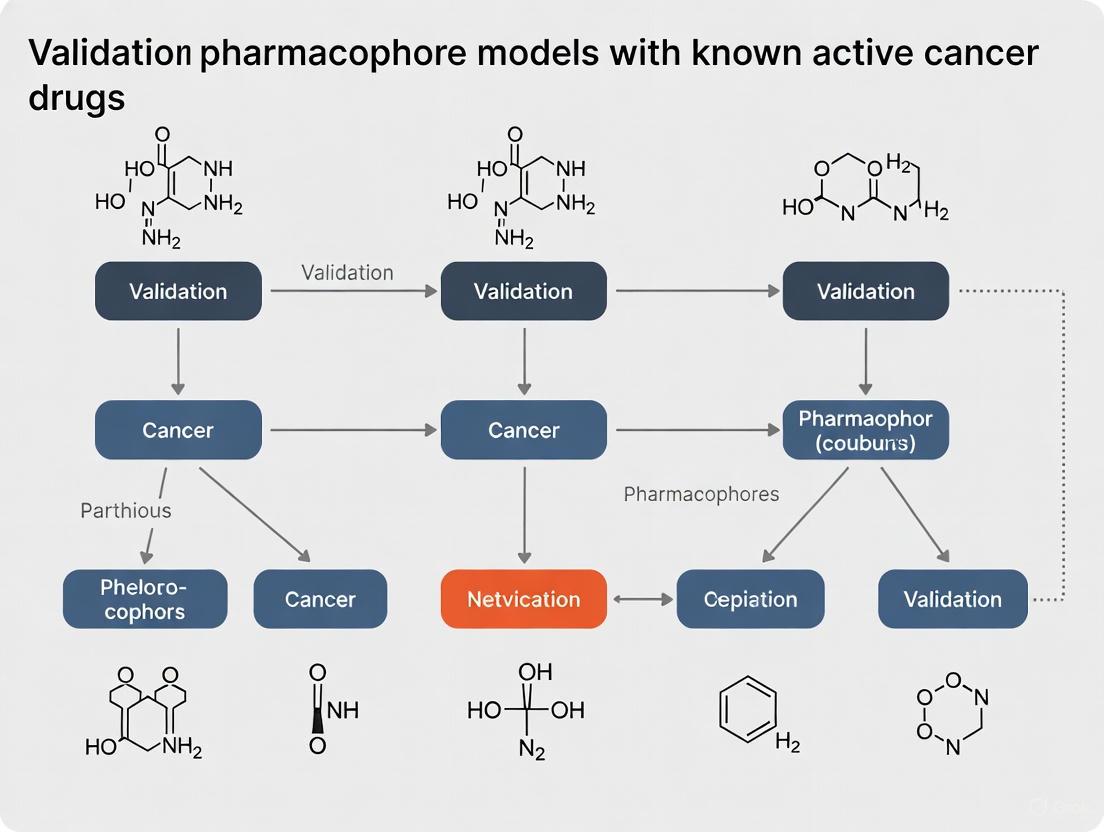
Validating Pharmacophore Models with Known Cancer Drugs: A Guide to Robustness and Predictive Power
This article provides a comprehensive guide for researchers and drug development professionals on the critical process of validating pharmacophore models in anti-cancer drug discovery.
Validating Pharmacophore Models with Known Cancer Drugs: A Guide to Robustness and Predictive Power
Abstract
This article provides a comprehensive guide for researchers and drug development professionals on the critical process of validating pharmacophore models in anti-cancer drug discovery. It covers foundational principles, from defining pharmacophore features to the strategic selection of known active cancer drugs for validation sets. The piece details core methodological approaches, including decoy set validation using databases like DUD-E, calculation of key statistical metrics (AUC, EF, GH), and advanced techniques such as molecular dynamics and MM-GBSA. It further addresses common troubleshooting scenarios and comparative analyses of different validation outcomes. By synthesizing these intents, the article establishes a framework for building confidence in pharmacophore models, thereby de-risking the subsequent steps of virtual screening and lead optimization for cancer therapeutics.
Laying the Groundwork: The Why and What of Pharmacophore Validation in Oncology
Defining Pharmacophore Features and Model Robustness in a Cancer Context
In medicinal chemistry, a pharmacophore is defined as an abstract description of the molecular features that are essential for a ligand to be recognized by a biological macromolecule. According to IUPAC, it represents "an ensemble of steric and electronic features that is necessary to ensure the optimal supramolecular interactions with a specific biological target and to trigger (or block) its biological response" [1]. In the context of cancer research, this concept transforms the complex process of molecular recognition into a manageable blueprint that guides the discovery and optimization of anticancer agents. Pharmacophore modeling has emerged as a powerful computational approach that bridges the gap between chemical structure and biological activity, enabling researchers to identify novel therapeutic candidates with precision and efficiency [2].
The essential features comprising a pharmacophore include hydrogen bond acceptors (HBA), hydrogen bond donors (HBD), hydrophobic regions (HPho), aromatic rings (Ar), and positive or negative ionizable groups [1] [3]. These features are arranged in a specific three-dimensional orientation that complements the target binding site, creating a template for molecular recognition. For cancer targets, this spatial arrangement captures the critical interactions necessary for inhibiting key oncogenic drivers and signaling pathways [4] [5]. The robustness of pharmacophore models determines their predictive accuracy in virtual screening and their utility in lead optimization programs, making validation protocols a critical component of model development in anticancer research.
Pharmacophore Feature Definitions and Methodological Approaches
Core Pharmacophore Features and Their Structural Significance
Pharmacophore features represent the fundamental functional elements that facilitate molecular recognition between a ligand and its biological target. In cancer drug design, these features map directly onto the key interactions required to inhibit specific oncogenic targets. The most prevalent features include [1] [3]:
- Hydrogen Bond Donors (HBD): Groups that can donate a hydrogen bond, typically featuring an electronegative atom (e.g., OH, NH). These are crucial for forming specific, directional interactions with carbonyl oxygen atoms or other acceptors in the binding pocket.
- Hydrogen Bond Acceptors (HBA): Atoms that can accept a hydrogen bond, usually possessing lone pair electrons (e.g., carbonyl oxygen, nitrogen in aromatic rings). These complement donor groups on the protein surface.
- Hydrophobic Regions (HPho): Non-polar molecular regions that participate in van der Waals interactions and drive the entropic component of binding through the displacement of ordered water molecules.
- Aromatic Rings (Ar): Planar, conjugated systems that enable π-π stacking and cation-π interactions with protein side chains.
- Ionizable Groups: Features that can carry positive or negative charges under physiological conditions, facilitating strong electrostatic interactions with oppositely charged residues in the binding site.
Comparative Analysis of Pharmacophore Modeling Approaches
The development of pharmacophore models follows distinct methodological pathways depending on the available structural and ligand information. The table below compares the two primary approaches and their application in cancer research:
Table 1: Comparison of Pharmacophore Modeling Approaches in Cancer Drug Discovery
| Aspect | Ligand-Based Approach | Structure-Based Approach |
|---|---|---|
| Data Requirements | Set of known active compounds against cancer target [3] | 3D structure of cancer target (e.g., from X-ray crystallography) [6] |
| Key Methodology | Conformational analysis and molecular alignment of active ligands [3] | Analysis of binding site interactions and complementary features [6] |
| Optimal Use Cases | Targets with unknown 3D structure but known active ligands (e.g., novel oncology targets) [2] | Targets with available crystal structures (e.g., kinase domains in cancer) [5] |
| Advantages | Does not require protein structural data; captures diverse chemotypes [3] | Directly maps to binding site geometry; incorporates protein constraints [6] |
| Limitations | Dependent on quality and diversity of known actives [3] | Requires high-quality structural data; may miss allosteric binding modes [6] |
| Cancer Application Example | Flavone derivatives as anticancer agents [7] | ALK inhibitors for non-small cell lung cancer [5] |
In contemporary cancer drug discovery, hybrid approaches that integrate both ligand-based and structure-based methods have gained prominence. These combined strategies leverage the complementary strengths of both methodologies, creating more robust models that account for both ligand diversity and structural constraints [4] [6]. For instance, in targeting estrogen receptor beta (ESR2) mutations in breast cancer, researchers developed a shared feature pharmacophore (SFP) model by aligning individual pharmacophores generated from multiple mutant protein structures, capturing essential features across different conformational states [6].
Experimental Framework for Pharmacophore Model Validation
Comprehensive Validation Workflow
The validation of pharmacophore models requires a multi-stage experimental framework to ensure predictive accuracy and robustness, particularly in the complex context of cancer targets where therapeutic precision is critical. The following workflow illustrates the comprehensive validation process:
Diagram 1: Pharmacophore Model Validation Workflow
Key Validation Metrics and Protocols
Robust pharmacophore validation employs quantitative metrics to assess model performance across multiple dimensions. The following experimental protocols are essential for establishing model reliability:
Internal Validation with Decoy Sets: This protocol evaluates the model's ability to discriminate active compounds from inactive ones using a predefined validation set. The process involves [4] [5]:
- Construction of a validation set containing known active compounds and inactive decoys
- Screening of this set using the pharmacophore model
- Calculation of enrichment metrics including Enrichment Factor (EF) and Area Under the Curve (AUC) of the Receiver Operating Characteristic (ROC)
- A reliable model typically demonstrates an AUC >0.7 and EF value >2 [4]
External Test Set Validation: This process assesses the model's predictive power using an independent compound set not included in model development [3]. The test set should include both active and inactive compounds to properly evaluate classification accuracy. Statistical metrics such as sensitivity, specificity, precision, and F1 score quantify the model's performance in identifying true positives while minimizing false positives [3].
Virtual Screening Performance Assessment: This protocol validates the model's utility in practical drug discovery scenarios by screening large chemical databases [5]. Key performance indicators include:
- Hit rate of confirmed active compounds
- Structural diversity of identified hits
- Scaffold hopping capability to identify novel chemotypes
Experimental Confirmation: The most crucial validation step involves synthesizing or acquiring top-ranking compounds from virtual screening and testing their biological activity through in vitro assays [8] [5]. For cancer targets, this typically includes:
- Cell proliferation assays (e.g., MTT, MTS) to determine IC₅₀ values
- Kinase inhibition assays for enzyme targets
- Selectivity profiling against related off-targets
Performance Comparison of Pharmacophore Models in Cancer Targets
Quantitative Validation Metrics Across Cancer Types
The robustness of pharmacophore models is quantitatively assessed through standardized validation metrics. The table below compares validation performance across various cancer targets and methodologies:
Table 2: Performance Metrics of Validated Pharmacophore Models in Cancer Research
| Cancer Type | Molecular Target | Modeling Approach | AUC Value | Enrichment Factor | Experimental Hit Rate | Reference |
|---|---|---|---|---|---|---|
| Lung Cancer | ALK | Structure-Based | 0.889 | N/R | Moderate antiproliferative activity (F1739-0081) | [5] |
| Breast Cancer | ESR2 mutants | Structure-Based (SFP) | N/R | N/R | 4 hits with >86% fit score | [6] |
| Various Cancers | VEGFR-2/c-Met | Structure-Based | >0.7 | >2 | 18 hit compounds identified | [4] |
| Various Cancers | PLK1 | Pharmacophore-Informed Generative (TransPharmer) | N/R | N/R | 3/4 compounds showed submicromolar activity | [8] |
| Breast Cancer | Alpha Estrogen Receptor | Pharmacophore-Guided Generative | N/R | N/R | 100% novelty, improved QED scores | [9] |
N/R = Not Reported in the cited study
Case Study: ALK Inhibitor Pharmacophore Validation
The development and validation of a pharmacophore model for Anaplastic Lymphoma Kinase (ALK) inhibitors exemplifies a rigorous approach to model robustness in cancer therapeutics. The model was constructed using five clinically approved ALK inhibitors and featured four essential chemical features: two hydrogen bond acceptors, one hydrogen bond donor, and one aromatic ring [5]. Validation through ROC analysis demonstrated exceptional performance with an AUC of 0.889, significantly surpassing the random classification threshold (AUC=0.5) [5]. This model successfully identified candidate compounds through virtual screening, with one compound (F1739-0081) exhibiting moderate antiproliferative activity in A549 lung cancer cells, confirming the model's predictive capability [5].
Case Study: TransPharmer Generative Model for PLK1 Inhibitors
The TransPharmer model represents an advanced integration of pharmacophore constraints with generative artificial intelligence for anticancer drug discovery. When applied to polo-like kinase 1 (PLK1), a critical cancer target, the model demonstrated exceptional performance in generating novel bioactive ligands [8]. Experimental validation confirmed that three out of four synthesized compounds exhibited submicromolar activity, with the most potent candidate (IIP0943) showing a potency of 5.1 nM against PLK1 [8]. Notably, the generated compounds featured a novel 4-(benzo[b]thiophen-7-yloxy)pyrimidine scaffold, demonstrating the model's capability for scaffold hopping while maintaining pharmaceutical relevance [8].
Successful implementation of pharmacophore modeling and validation requires specialized computational tools and databases. The following table catalogues essential resources for researchers in this field:
Table 3: Essential Research Resources for Pharmacophore Modeling and Validation
| Resource Category | Specific Tools/Platforms | Primary Function | Application in Cancer Research |
|---|---|---|---|
| Commercial Software | Discovery Studio [4], MOE [3], LigandScout [6] | Comprehensive pharmacophore modeling, virtual screening, and analysis | Structure-based pharmacophore generation for cancer targets (e.g., VEGFR-2, c-Met) [4] |
| Open-Source Tools | Pharmer [3], PharmaGist [3], ZINCPharmer [6] | Ligand-based pharmacophore modeling and screening | Virtual screening for novel cancer therapeutics [6] |
| Chemical Databases | ZINC [6], ChEMBL [9], PubChem [9] | Sources of compounds for virtual screening and validation | Identifying novel scaffolds for cancer target inhibition [6] |
| Protein Structure Repository | Protein Data Bank (PDB) [4] [6] | Source of 3D protein structures for structure-based modeling | Accessing crystal structures of cancer targets (e.g., ESR2, ALK) [6] |
| Generative AI Platforms | TransPharmer [8], FREED++ [9] | Pharmacophore-informed de novo molecule generation | Creating novel anticancer agents with specific pharmacophoric constraints [8] |
The strategic definition of pharmacophore features and rigorous validation of model robustness represent critical milestones in the rational design of cancer therapeutics. Contemporary approaches that integrate structure-based insights with ligand-based patterns have demonstrated remarkable success across diverse oncology targets, from kinase domains to nuclear receptors. The consistent observation that validated pharmacophore models achieve AUC values exceeding 0.85 and successfully identify compounds with experimentally confirmed bioactivity underscores their predictive power and utility in cancer drug discovery [5] [4].
The emergence of pharmacophore-informed generative models like TransPharmer represents a paradigm shift, enabling the de novo design of novel chemotypes with predefined pharmacophoric properties [8]. These advanced approaches maintain the essential molecular recognition features while exploring uncharted regions of chemical space, resulting in candidates with both structural novelty and validated bioactivity against challenging cancer targets. As these methodologies continue to evolve, integrating deeper learning architectures and more sophisticated validation frameworks, they promise to accelerate the discovery of precision oncology therapeutics with improved efficacy profiles and resistance-breaking capabilities.
The Critical Role of Known Active Cancer Drugs in Validation
In modern oncology drug discovery, pharmacophore models serve as essential theoretical constructs that map the essential steric and electronic features responsible for a ligand's biological activity. However, the predictive power and reliability of these models are entirely dependent on rigorous validation strategies. Within this context, known active cancer drugs provide the critical benchmark against which pharmacophore models are measured, ensuring their relevance to real-world biological systems. These established therapeutics, with their well-characterized mechanisms and binding profiles, form the "ground truth" that transforms abstract computational models into trusted tools for identifying novel chemical entities. This guide examines how known active drugs are systematically employed to validate pharmacophore models, comparing different methodological approaches through quantitative performance metrics and detailed experimental protocols.
Methodological Framework: Validation Strategies and Metrics
The validation of pharmacophore models using known active drugs primarily follows two complementary approaches: retrospective screening using decoy sets and prospective application followed by experimental confirmation. Both methodologies rely on known active compounds as reference points for evaluating model performance.
Table 1: Key Validation Metrics and Their Interpretation
| Metric | Calculation Formula | Interpretation | Optimal Value |
|---|---|---|---|
| Enrichment Factor (EF) | (\text{EF} = (Ha \times D) / (Ht \times A)) | Measures ability to concentrate active compounds early in screening | >2 indicates significant enrichment [10] [4] |
| Area Under Curve (AUC) | Area under ROC curve | Overall ability to discriminate actives from inactives | 0.7-1.0 (0.5 = random) [5] |
| Goodness of Hit (GH) | Complex function of sensitivity/specificity | Combined quality measure of the model | 0.7-0.8 indicates excellent model [10] |
| Sensitivity | ((H_a / A) \times 100) | Percentage of known actives correctly identified | Higher values preferred |
| Specificity | ((H_d / D) \times 100) | Percentage of decoys correctly rejected | Higher values preferred |
The Enrichment Factor (EF) is particularly crucial in early-phase virtual screening, where the goal is to identify the maximum number of true actives while examining the minimal number of compounds. A study targeting FAK1 inhibitors demonstrated this principle by building a pharmacophore model based on the FAK1-P4N complex and validating it with 114 known active compounds and 571 decoys from the DUD-E database [10]. The resulting model successfully discriminated between true actives and inactive compounds, with high sensitivity and specificity values confirming its utility for prospective screening [10].
Similarly, in the search for VEGFR-2 and c-Met dual-target inhibitors, researchers constructed validation sets containing 25 confirmed inhibitors for each target alongside hundreds of inactive compounds from the DUD-E website [4]. This approach allowed them to calculate EF and AUC values for multiple pharmacophore hypotheses, selecting the optimal model based on its superior performance in retrieving known active compounds from background noise [4].
Experimental Protocols: From Model Validation to Hit Identification
The practical application of known active drugs in pharmacophore validation follows a structured workflow with distinct experimental phases. The diagram below illustrates this complete process from initial model construction through final experimental confirmation.
Case Study: PKMYT1 Inhibitor Discovery for Pancreatic Cancer
A recent study exemplifies the rigorous application of this protocol. Researchers developed pharmacophore models based on four PKMYT1 co-crystal structures (PDB IDs: 8ZTX, 8ZU2, 8ZUD, 8ZUL) with known inhibitors [11]. During validation, these models were challenged to identify established active compounds from a background of decoys. The top-performing model was then deployed for virtual screening of 1.64 million compounds from the TargetMol natural compound library [11].
The screening identified HIT101481851 as a promising candidate, which subsequently demonstrated dose-dependent inhibition of pancreatic cancer cell viability in in vitro assays, while showing lower toxicity toward normal pancreatic epithelial cells [11]. This successful outcome, from computational prediction to experimental confirmation, underscores the critical importance of robust initial validation using known active drugs to generate reliable models.
Case Study: ALK Inhibitor Identification with Resistance Profiling
In another example targeting Anaplastic Lymphoma Kinase (ALK), researchers constructed a structure-based pharmacophore model using five approved ALK inhibitors (Crizotinib, Alectinib, Ceritinib, Brigatinib, and Lorlatinib) [5]. The model specifically incorporated features necessary to overcome common resistance mutations like L1196M and G1202R. Validation against known active compounds confirmed the model's ability to discriminate true ALK inhibitors, with Ceritinib showing the highest fitness score of 2.326 [5].
This rigorously validated model screened 50,000 compounds, identifying two candidates (F1739-0081 and F2571-0016) with promising ALK inhibition profiles. Subsequent experimental validation confirmed that F1739-0081 exhibited moderate antiproliferative activity against A549 cell lines, demonstrating the real-world predictive power of a properly validated pharmacophore model [5].
Successful implementation of pharmacophore validation protocols requires specific computational and experimental resources. The table below details key reagents and their applications in the validation process.
Table 2: Essential Research Reagents and Resources for Pharmacophore Validation
| Resource Category | Specific Examples | Application in Validation | Key Characteristics |
|---|---|---|---|
| Known Active Compounds | FDA-approved oncology drugs; Compounds with published IC₅₀ values [12] [5] | Provide positive controls for model validation | Well-characterized mechanisms; Clinically relevant |
| Decoy Compounds | DUD-E database decoys [10] [4] | Generate background for selectivity assessment | Similar physicochemical properties but dissimilar structures |
| Structural Databases | Protein Data Bank (PDB) [13] [11] | Source of protein-ligand complexes for structure-based modeling | Experimentally determined structures; Resolution < 2.5Å preferred |
| Virtual Screening Platforms | Molecular Operating Environment (MOE) [13]; Schrödinger Suite [11]; Discovery Studio [4] | Implement pharmacophore modeling and screening workflows | Robust algorithms; High-throughput capability |
| ADMET Prediction Tools | SwissADME; pkCSM [4] [5] | Evaluate drug-likeness of identified hits | Multi-parameter optimization; Good predictive accuracy |
The DUD-E (Directory of Useful Decoys, Enhanced) database deserves special emphasis as it provides carefully curated decoy sets that are physically similar but chemically distinct from known actives, creating realistic validation scenarios [10] [4]. Similarly, the cBioPortal database offers cancer genomics data sets that help establish connections between molecular targets and disease contexts, adding biological relevance to the validation process [14].
The critical role of known active cancer drugs in pharmacophore model validation cannot be overstated. These established compounds provide the essential benchmark that transforms theoretical models into predictive tools with demonstrated real-world relevance. The methodologies and metrics discussed here—particularly enrichment factors, AUC values, and carefully designed validation sets—create a rigorous framework for evaluating model performance before costly experimental work begins. As computational approaches continue to grow in sophistication and impact, the disciplined application of these validation principles will remain fundamental to successful drug discovery in oncology, ensuring that virtual screening campaigns yield biologically meaningful results with genuine therapeutic potential.
In computational drug discovery, a gold-standard validation set serves as an objective, high-quality benchmark to measure the true performance of pharmacophore models and virtual screening pipelines. For researchers targeting cancer therapeutics, these curated sets provide the critical ground truth that determines whether a newly identified compound will proceed to costly in-vitro and in-vivo testing. A gold-standard validation set is a small but highly trusted collection of annotated examples used to measure model performance objectively, serving as a consistent reference point for tracking progress and ensuring quality assurance in production environments [15]. Unlike training data, it is used exclusively for benchmarking—not learning—providing an unchanging standard against which model improvements can be reliably measured [15].
The stakes for proper validation are particularly high in cancer drug research, where model failures can lead to missed therapeutic opportunities or costly pursuit of false leads. In the context of pharmacophore modeling—which identifies the essential structural features responsible for a molecule's biological activity—validation sets determine a model's ability to distinguish true actives from decoys. This article examines the sources and methodological frameworks for constructing these crucial benchmarks, providing researchers with practical guidance for implementing robust validation protocols in cancer drug discovery.
Key Components of a Gold-Standard Validation Set
Table 1: Primary Data Sources for Validation Set Curation
| Source Type | Example Databases | Key Characteristics | Common Applications in Cancer Research |
|---|---|---|---|
| Experimentally Validated Compounds | ChEMBL, PubChem BioAssay | Annotated with bioactivity data (e.g., IC₅₀); high reliability | Known active/inactive compounds for specific cancer targets [16] [17] [18] |
| Decoy Sets | DUD-E (Database of Useful Decoys) | Physicochemically similar but topologically distinct from actives | Assessing model specificity and reducing false positives [16] [17] [19] |
| Commercial Compound Libraries | ZINC Natural Products, Asinex | Purchasable compounds with structural diversity | Identifying novel scaffolds for experimental validation [16] [17] [19] |
| Clinical Compounds | DrugBank | FDA-approved drugs and clinical candidates | Repurposing opportunities and safety profiling [18] |
Strategic Composition Principles
A well-constructed validation set should encompass several strategic elements to ensure comprehensive evaluation. Diverse actives should include known inhibitors with varying potency levels (e.g., different IC₅₀ values) and distinct chemical scaffolds to test model generalizability [17] [19]. Challenging decoys must be physiochemically similar to actives but topologically different to rigorously test model specificity, typically sourced from validated decoy databases like DUD-E [16] [17]. Edge cases and rare scenarios should include atypical binding motifs and weakly active compounds to assess model robustness [15]. Additionally, the set should maintain balanced representation across different potency ranges and chemical classes to prevent biased evaluations [15].
Experimental Protocols for Validation Set Assessment
Performance Metrics and Statistical Measures
Table 2: Key Validation Metrics for Pharmacophore Models
| Metric | Calculation Method | Interpretation in Cancer Context | Optimal Range |
|---|---|---|---|
| Enrichment Factor (EF) | (Hitssampled/Nsampled)/(Hitstotal/Ntotal) | Measures model's ability to prioritize true cancer therapeutics | >1 (higher indicates better enrichment) [17] [19] |
| Area Under Curve (AUC) | Area under ROC curve | Overall discrimination between actives and decoys | 0.7-0.8 (good), 0.8-0.9 (very good), >0.9 (excellent) [17] |
| Goodness of Hit (GH) | Combination of recall and precision | Balanced measure of early recognition capability | 0.5-1.0 (higher indicates better early enrichment) [19] |
| Sensitivity & Specificity | TP/(TP+FN) and TN/(TN+FP) | Model's accuracy in identifying true binders and rejecting non-binders | Context-dependent; trade-off between values |
Validation Workflow and Implementation
The validation process follows a structured workflow that begins with pharmacophore model generation based on protein-ligand complexes or known active compounds, as demonstrated in studies targeting BRD4 for neuroblastoma and XIAP for hepatocellular carcinoma [16] [17]. Next, validation set preparation involves compiling known actives from scientific literature and databases like ChEMBL, combined with decoy molecules from DUD-E [16] [17] [19]. The screening and evaluation phase entails running the validation set against the pharmacophore model and calculating key metrics including ROC curves, AUC values, and enrichment factors [17] [19]. Finally, iterative refinement uses these results to optimize model parameters and feature definitions before proceeding to virtual screening.
Comparative Analysis of Validation Approaches
Performance Across Cancer Targets
Table 3: Validation Results Across Cancer Protein Targets
| Protein Target | Cancer Type | Validation Method | Reported AUC | Enrichment Factor | Reference |
|---|---|---|---|---|---|
| BRD4 | Neuroblastoma | Structure-based pharmacophore | 1.0 | 11.4-13.1 | [16] |
| XIAP | Hepatocellular Carcinoma | Structure-based pharmacophore | 0.98 | 10.0 (EF1%) | [17] |
| Akt2 | Various Cancers | Structure-based + 3D-QSAR | Not specified | Significant enrichment | [19] |
| EGFR | Lung/Breast Cancer | Structure-based pharmacophore | Not specified | Improved binding affinity | [18] |
Impact of Curation Strategy on Model Performance
The SELECT benchmark for image classification provides valuable insights applicable to pharmacophore validation, demonstrating that expert curation remains the gold standard across domains, with original ImageNet-1K expert curation outperforming reduced-cost alternatives [20] [21]. The benchmark also revealed that embedding-based search shows significant promise, with image-based embedding search (LA1000 img2img) consistently outperforming synthetic data generation approaches [21]. Interestingly, human curation isn't always superior, as crowdsourced datasets (OI1000) often underperformed compared to automated methods due to greater label imbalance [21]. Additionally, quality often outweighs quantity, with smaller, well-curated datasets (LA1000 img2img) frequently outperforming larger counterparts [21].
Implementation Toolkit for Researchers
Essential Research Reagents and Computational Tools
Table 4: Essential Resources for Validation Set Curation
| Resource Category | Specific Tools/Databases | Primary Function | Key Features |
|---|---|---|---|
| Pharmacophore Modeling | LigandScout [16] [17] [18], Discovery Studio [19] | Structure and ligand-based pharmacophore generation | Feature identification, exclusion volumes, model optimization |
| Compound Databases | ChEMBL [16] [17] [18], ZINC [16] [17] [19] | Source of active compounds and screening libraries | Bioactivity data, purchasable compounds, ready-to-dock formats |
| Decoy Sets | DUD-E (Database of Useful Decoys) [16] [17] | Provision of physiochemically matched decoys | Property-matched decoys for rigorous validation |
| Validation Metrics | ROC curves, AUC calculation, EF analysis [16] [17] [19] | Performance quantification and model assessment | Standardized evaluation, statistical robustness |
Best Practices for Sustainable Validation Frameworks
Building a maintainable gold-standard validation system requires adherence to several key practices. Version control should be implemented for all dataset changes, tracking who made modifications, when, and why for debugging and compliance purposes [15]. Multi-pass labeling with consensus should be employed for ambiguous cases, particularly with natural products having complex activity profiles [15]. Domain expertise integration is crucial, with expert oncologists and medicinal chemists reviewing contentious classifications and edge cases [15]. Bias mitigation requires careful sampling across chemical space and cancer types to prevent overrepresentation of specific scaffolds or targets [15]. Finally, regular reevaluation should be conducted against emerging targets and resistance mechanisms to maintain clinical relevance [18].
The construction of a gold-standard validation set represents a foundational activity in cancer-focused pharmacophore research, with direct implications for a model's ability to identify genuine therapeutic candidates. As demonstrated across multiple cancer targets—including BRD4, XIAP, Akt2, and EGFR—rigorous validation using curated actives and challenging decoys remains essential for quantifying model performance before proceeding to resource-intensive experimental phases. The strategies and protocols outlined herein provide researchers with a structured framework for developing validation sets that not only measure current model capabilities but also guide iterative improvement through targeted refinement. In an era of increasingly complex cancer targets and resistance mechanisms, such methodological rigor in validation set curation will continue to separate clinically promising computational findings from merely statistically interesting ones.
In modern computer-aided drug design (CADD), pharmacophore models serve as abstract representations of the steric and electronic features essential for a molecule to interact with a specific biological target [22]. These models, whether derived from a set of known active ligands (ligand-based) or from a protein-ligand complex (structure-based), are fundamental for virtual screening of large compound databases to identify novel drug candidates [23] [22]. However, the predictive power and reliability of any pharmacophore model are not inherent; they must be rigorously demonstrated through a process called validation [24] [16]. Without proper validation, the results of a virtual screening campaign are questionable and may lead to wasted resources in subsequent experimental phases.
Validation provides the statistical confidence that a model can successfully distinguish between active and inactive compounds, ensuring its utility in a real-world drug discovery pipeline [10]. Within the specific context of cancer drug research—where targeting proteins like Focal Adhesion Kinase 1 (FAK1), Bromodomain-containing protein 4 (Brd4), or X-linked inhibitor of apoptosis protein (XIAP) is critical—the use of unvalidated models can misdirect precious research efforts [16] [17] [10]. Consequently, a set of key quantitative metrics has been established as the standard for evaluating model performance. This guide focuses on three of these core metrics: the Area Under the Receiver Operating Characteristic Curve (AUC), the Enrichment Factor (EF), and the Goodness of Hit (GH) score. We will objectively compare their performance across various studies, detail the experimental protocols for their calculation, and place them within the workflow of pharmacophore-based virtual screening for anticancer drug discovery.
Core Metrics and Comparative Performance
The performance of a pharmacophore model is quantified by its ability to retrieve true active compounds while discarding inactive ones from a test database. The following three metrics offer complementary insights into this capability.
Table 1: Definition and Interpretation of Key Validation Metrics
| Metric | Mathematical Definition | Interpretation and Ideal Range |
|---|---|---|
| AUC (Area Under the ROC Curve) | Area under the plot of True Positive Rate (Sensitivity) vs. False Positive Rate (1-Specificity) [24]. | 0.5: Random classifier. 0.7-0.8: Good classifier. 0.8-0.9: Excellent classifier. >0.9: Outstanding classifier [16] [17]. |
| Enrichment Factor (EF) | (\text{EF} = \frac{\text{Ha}/\text{Ht}}{\text{A}/\text{D}})Where Ha=active hits, Ht=total hits, A=total actives in database, D=total compounds in database [25]. | Measures how much more likely a model is to find an active compound compared to random selection. Higher values indicate better performance. An EF of 1 signifies no enrichment over random [25]. |
| Goodness of Hit (GH) Score | (\text{GH} = \left( \frac{\text{Ha} \times (3\text{A} + \text{Ht})}{4 \times \text{Ht} \times \text{A} } \right) \times \left(1 - \frac{\text{Ht} - \text{Ha}}{\text{D} - \text{A}} \right)) [25]. | A composite score that balances the recall of actives with the ability to avoid false positives. A score of 0.7-0.8 indicates a very good model, while a score of 0.8-1.0 is considered excellent [25]. |
The practical performance of these metrics can be observed in published studies across various cancer-related targets. The following table summarizes data from multiple research articles, providing a benchmark for comparison.
Table 2: Comparative Performance of Validation Metrics in Published Cancer Drug Research
| Target Protein | Reported AUC | Reported EF | Reported GH Score | Study Context |
|---|---|---|---|---|
| Brd4 (Neuroblastoma) | 1.0 [16] | 11.4 - 13.1 [16] | Information missing | Structure-based model to identify BET inhibitors [16]. |
| Tubulin (Cancer Therapy) | Information missing | 24 [25] | 0.75 [25] | Structure-based model for tubulin polymerization inhibitors [25]. |
| XIAP (Cancer) | 0.98 [17] | Information missing | Information missing | Structure-based model to identify natural XIAP antagonists [17]. |
| FAK1 (Cancer Metastasis) | Information missing | Calculated during validation [10] | Calculated during validation [10] | Structure-based model to identify novel FAK1 inhibitors [10]. |
As evidenced by the data, a high-quality model typically excels across all three metrics. For instance, the model for Brd4 showed perfect discrimination (AUC=1.0) and high enrichment, making it an outstanding tool for identifying neuroblastoma inhibitors [16]. Similarly, the model for tubulin demonstrated a high EF and a GH score of 0.75, categorizing it as a "very good" model for finding antiproliferative agents [25]. These metrics collectively provide a robust and multi-faceted profile of a model's predictive power.
Experimental Protocols for Validation
A standardized protocol is crucial for the objective and reproducible validation of a pharmacophore model. The following workflow outlines the key steps, from preparing the necessary datasets to calculating the final metrics.
Diagram 1: The sequential workflow for pharmacophore model validation, from dataset preparation to final metric calculation.
Dataset Preparation and Screening
The first step involves creating a standardized test library. This library contains two types of molecules:
- Active Set (A): A collection of known inhibitors of the target protein. These are gathered from scientific literature or databases like ChEMBL [16] [17]. For example, a study on XIAP collected 10 known active antagonists from ChEMBL for validation [17].
- Decoy Set (D): A set of molecules that are presumed to be inactive but have similar physicochemical properties (e.g., molecular weight, log P) to the active compounds. This ensures that the model is discerning true activity rather than just chemical properties. Databases like DUD-E (Directory of Useful Decoys: Enhanced) are commonly used to generate these decoys [24] [10]. One study used 703 decoys from DUD-E to validate a COX-2 inhibitor model [24].
The pharmacophore model is then used as a query to screen this combined database (A + D). The screening process involves checking which compounds from the database can map onto the model's chemical features within defined spatial tolerances [22]. The results are categorized as follows:
- True Positives (TP or Ha): Active compounds correctly retrieved by the model.
- False Positives (FP): Decoy compounds incorrectly retrieved by the model.
- True Negatives (TN): Decoy compounds correctly ignored by the model.
- False Negatives (FN): Active compounds that the model failed to retrieve [24] [10].
Metric Calculation and Interpretation
With the screening results categorized, the validation metrics are calculated using standard formulas:
- AUC Calculation: The Receiver Operating Characteristic (ROC) curve is plotted with the True Positive Rate (TPR = Ha/A) on the Y-axis and the False Positive Rate (FPR = FP/D) on the X-axis at various scoring thresholds. The Area Under this Curve (AUC) is then computed, often integrated within pharmacophore software like LigandScout [24] [17] [23].
- EF and GH Calculation: The Enrichment Factor (EF) and Goodness of Hit (GH) score are calculated directly using the formulas provided in Table 1. The GH score, in particular, is a valuable single metric as it incorporates the Ha, Ht (total hits, i.e., Ha + FP), A, and D into one equation, penalizing models that retrieve too many false positives [25].
A model is typically considered statistically validated and ready for use in virtual screening if it meets or exceeds accepted thresholds, such as an AUC > 0.7, a high EF, and a GH score > 0.7 [16] [25] [26].
The Scientist's Toolkit
To conduct the validation protocols described, researchers rely on a suite of specialized software tools and databases. The table below details the essential "research reagent solutions" and their functions in the validation process.
Table 3: Essential Tools and Resources for Pharmacophore Validation
| Tool/Resource Name | Type | Primary Function in Validation | Key Application in Research |
|---|---|---|---|
| LigandScout | Software | Creates structure- and ligand-based pharmacophore models and performs virtual screening with built-in AUC calculation [24] [16] [23]. | Widely used; employed to generate and validate models for targets like COX-2 and PLpro [24] [23]. |
| DUD-E Database | Online Database | Provides property-matched decoy molecules for a wide range of biological targets, enabling fair model validation [24] [10]. | Serves as a standard source for decoys in studies targeting FAK1 and others [10]. |
| ZINC Database | Online Database | A curated collection of commercially available compounds used for virtual screening and as a source for generating test sets [16] [17] [27]. | Used as the screening library for targets like Brd4 and XIAP to find purchasable hits [16] [17]. |
| ChEMBL Database | Online Database | A manually curated database of bioactive molecules with drug-like properties, used to compile sets of known active compounds [16] [17]. | Used to gather known active antagonists for XIAP and Brd4 for model validation [16] [17]. |
| Pharmit | Online Tool | A web-based platform for pharmacophore modeling and virtual screening, also capable of model validation [10]. | Used in a recent FAK1 inhibitor study to build and validate the pharmacophore model [10]. |
The rigorous validation of a pharmacophore model is a non-negotiable step in ensuring the success of computer-aided drug discovery projects, particularly in the high-stakes field of oncology. The metrics of AUC, Enrichment Factor, and Goodness of Hit score provide a robust, quantitative framework for this validation. As demonstrated by studies on targets like Brd4, tubulin, and FAK1, these metrics collectively assess a model's ability to efficiently and reliably identify active compounds from vast chemical libraries. By adhering to standardized experimental protocols and leveraging specialized software and databases, researchers can objectively compare model performance, minimize false leads, and confidently select the best models to identify promising novel anticancer agents.
Assessing Predictive Power for Overcoming Drug Resistance
Within modern oncology drug discovery, overcoming drug resistance remains a critical challenge that often undermines the efficacy of targeted therapies. The validation of pharmacophore models with known active cancer drugs represents a crucial strategy for enhancing the predictive power of computational approaches in addressing this challenge. Pharmacophore modeling serves as an abstract representation of molecular interactions essential for a compound's biological activity, providing a powerful framework for identifying novel therapeutic agents and overcoming resistance mechanisms. This guide objectively compares the performance of various computational methodologies and their experimental validation in predicting and combating drug resistance, with particular emphasis on pharmacophore-based approaches within cancer drug research.
Comparative Analysis of Predictive Methodologies
Performance Metrics of Computational Approaches
Table 1: Quantitative Performance Comparison of Predictive Methodologies for Drug Resistance
| Methodology | Primary Application | Key Performance Metrics | Reported AUC/Accuracy | Experimental Validation |
|---|---|---|---|---|
| Pharmacophore-Guided Virtual Screening [28] [10] | Novel kinase inhibitor identification (FGFR1, FAK1) | Enrichment factor (EF), goodness of hit (GH), binding affinity | EF: 3.5-28.2, GH: 0.7-0.8 [10] | Molecular dynamics (100-200 ns), MM/GBSA binding free energy calculations [28] [10] |
| Random Forest Classifiers [29] | Predicting E. coli antibiotic resistance | Accuracy, Precision, Recall, F1-score, AUC-ROC | Accuracy: 0.90, AUC: up to 0.99 [29] | 10-fold cross-validation, Brier score for calibration (0.01-0.20) [29] |
| LSTM Time Series Forecasting [30] | Facility-level antibiotic resistance trends | Mean absolute error, predictive accuracy | Superior to ARIMA and VAR models [30] | Retrospective evaluation (2007-2022), 30 VHA facilities [30] |
| Protein Language Models (ProtBert-BFD, ESM-1b) [31] | Antibiotic resistance gene prediction | Accuracy, Precision, Recall, F1-score | Superior to DeepARG and HMD-ARG [31] | Cross-referencing data augmentation, 16 ARG categories [31] |
| Pharmacophore-Guided Deep Learning (PGMG) [32] | Bioactive molecule generation | Validity, uniqueness, novelty, docking affinity | 6.3% improvement in available molecule ratio [32] | Molecular docking studies, physicochemical property analysis [32] |
Key Research Reagent Solutions
Table 2: Essential Research Reagents and Computational Tools for Resistance Prediction Studies
| Reagent/Tool Category | Specific Examples | Function in Research | Application Context |
|---|---|---|---|
| Protein Structure Databases | PDB (4ZSA, 6YOJ, 3E8D) [28] [10] [19] | Provides 3D protein structures for structure-based design | Kinase domain analysis (FGFR1, FAK1, Akt2) [28] [10] [19] |
| Compound Libraries | TargetMol Anticancer Library, ZINC, Asinex [28] [10] [19] | Sources of diverse chemical compounds for virtual screening | Identification of novel scaffolds via pharmacophore screening [28] [10] [19] |
| Pharmacophore Modeling Software | PharmaGist, Discovery Studio, Schrödinger Maestro [28] [19] | Identifies essential interaction features for biological activity | Ligand- and structure-based pharmacophore generation [28] [19] |
| Molecular Docking Tools | AutoDock Vina, Glide, GOLD [28] [10] [19] | Predicts ligand-receptor binding modes and affinity | Hierarchical docking (HTVS/SP/XP) for binding pose prediction [28] [10] [19] |
| Dynamics Simulation Packages | GROMACS, AMBER, Desmond [28] [10] | Models molecular system behavior over time | 100-200ns MD simulations for complex stability assessment [28] [10] |
| Machine Learning Frameworks | Scikit-learn, TensorFlow, PyTorch [29] [30] [31] | Enables predictive model development for resistance | Random Forest, LSTM, protein language model implementation [29] [30] [31] |
Experimental Protocols for Method Validation
Integrated Pharmacophore Modeling and Virtual Screening
The discovery of novel FGFR1 inhibitors demonstrates a robust protocol for validating pharmacophore models against cancer drug resistance [28]. Researchers established a computational pipeline incorporating ligand-based pharmacophore modeling followed by multi-tiered virtual screening with hierarchical docking (HTVS/SP/XP). The methodology commenced with preparation of 9,019 anticancer compounds from the TargetMol Anticancer Library, generating energetically optimized 3D conformations using the LigPrep module (Schrödinger Suite 2021-3) [28]. A multiligand consensus pharmacophore model was developed using Maestro 11.8, with the hypothesis coverage threshold set to 15% to optimize model sensitivity while maintaining specificity [28]. Following pharmacophore-based screening, MM-GBSA binding energy calculations evaluated interactions within the FGFR1 kinase domain (PDB ID: 4ZSA). Molecular dynamics simulations of 100-200 nanoseconds validated stable binding modes and interaction energies for top candidates [28]. This protocol identified three hit compounds with superior FGFR1 binding affinity compared to the reference ligand 4UT801, demonstrating the predictive power of validated pharmacophore models for overcoming resistance in kinase targets [28].
Figure 1: Integrated Workflow for Validating Pharmacophore Models in Cancer Drug Discovery
Structure-Based Pharmacophore Validation Protocol
The identification of novel FAK1 inhibitors illustrates a comprehensive structure-based validation protocol [10]. Researchers obtained the co-crystal structure of the FAK1 kinase domain in complex with P4N (PDB ID: 6YOJ) from the Protein Data Bank, with missing residues modeled using MODELLER 9.25 software [10]. The FAK1-P4N complex was uploaded to Pharmit to identify critical pharmacophoric features, initially detecting eight pharmacophoric features. Researchers generated six pharmacophore models containing five or six features each, which were validated against 114 active and 571 decoy compounds from the DUD-E database [10]. Validation metrics included sensitivity (true positive rate), specificity (true negative rate), yield of active compounds (recall), enrichment factor (EF), and goodness of hit (GH) calculated using standardized equations [10]. The optimal model demonstrated strong statistical reliability with high enrichment factors (3.5-28.2) and goodness of hit scores (0.7-0.8). Promising candidates underwent molecular dynamics simulations using GROMACS, with binding free energies calculated via the MM/PBSA method [10]. This protocol identified ZINC23845603 as a strong candidate with favorable binding energy and pharmacokinetic profile, demonstrating the predictive power of rigorously validated structure-based pharmacophore models [10].
Machine Learning Resistance Prediction Framework
The development of artificial intelligence models for predicting Gram-negative bloodstream infection resistance demonstrates a robust protocol for clinical resistance prediction [33]. Researchers conducted an observational cohort study on hospitalized patients with GN-BSI from January 1st, 2013, to December 31st, 2019, excluding patients on palliative care, those who died within 48 hours of index BSI, and cases with incomplete clinical data [33]. The study incorporated demographic variables, comorbidities according to the Charlson comorbidity index, immunosuppressive conditions, length of hospital stay, BSI acquisition source, and inpatient ward type. Models were developed to predict resistance to four antibiotic classes: fluoroquinolones, third-generation cephalosporins, beta-lactam/beta-lactamase inhibitors, and carbapenems [33]. The AI pipeline employed a penalized approach to reduce overfitting and decrease the effect of feature collinearity, with models trained balancing the weight of each outcome class based on class frequency. The framework achieved particularly strong performance for carbapenem resistance prediction (AUC-ROC 0.921 ± 0.013) with high negative predictive value and minimal false omission rates, critical for minimizing inappropriate antibiotic therapy in early treatment phases [33].
Figure 2: Machine Learning Framework for Clinical Resistance Prediction
Deep Learning for Antibiotic Resistance Gene Prediction
A novel deep learning approach for predicting antibiotic resistance genes demonstrates an advanced protocol integrating protein language models [31]. The framework employs two protein language models (ProtBert-BFD and ESM-1b) to extract features from protein sequences, capturing different structural information aspects [31]. ProtBert-BFD encodes each amino acid as a 30-dimensional vector, focusing on key sequence information, while ESM-1b encodes each amino acid as a 1,280-dimensional vector, capturing secondary and tertiary structural information [31]. To address data imbalance, researchers implemented a cross-referencing data augmentation method based on ProtBert-BFD and ESM-1b embedding results, exponentially increasing limited resistance gene data. The classification model utilized Long Short-Term Memory (LSTM) networks with multi-head attention mechanisms to process the embedded features [31]. Final predictions integrated results from multiple models through ensemble learning strategies, enhancing overall generalization performance. This protocol demonstrated superior performance compared to existing methods like DeepARG and HMD-ARG, significantly reducing both false negative and false positive prediction rates across different microbial communities [31].
Discussion
The comparative analysis reveals distinct strengths and applications for various predictive methodologies in overcoming drug resistance. Pharmacophore-based approaches demonstrate exceptional performance in early drug discovery stages, particularly for target-focused cancer therapy development, while machine learning and deep learning methods excel in clinical resistance prediction based on patient data and genetic information.
The integration of pharmacophore modeling with molecular dynamics simulations and binding free energy calculations represents a particularly powerful approach for addressing cancer drug resistance, as evidenced by successful applications against FGFR1, FAK1, and Akt2 kinase targets [28] [10] [19]. These methods enable researchers to identify novel inhibitor scaffolds with optimized binding interactions that may overcome common resistance mutations. The quantitative performance metrics, including enrichment factors and goodness of hit scores, provide robust validation of model predictive power before resource-intensive experimental work.
Emerging deep learning approaches, particularly those leveraging protein language models, demonstrate transformative potential for predicting resistance at the genetic level [31]. These methods capture complex patterns in protein sequences that correlate with resistance mechanisms, enabling more accurate prediction of resistance phenotypes from genetic data. Similarly, time-series forecasting models like LSTM networks show superior performance for facility-level resistance trend prediction, enabling proactive antimicrobial stewardship interventions [30].
The validation frameworks and experimental protocols detailed in this guide provide researchers with standardized methodologies for assessing the predictive power of their approaches. As resistance mechanisms continue to evolve, these computational strategies will play increasingly critical roles in the preemptive design of therapeutic agents capable of overcoming resistance, ultimately extending the clinical utility of valuable anticancer and antimicrobial agents.
A Step-by-Step Protocol for Pharmacophore Model Validation
Constructing Reliable Decoy Sets with DUD-E and Related Tools
In computer-aided drug design, particularly in pharmacophore model validation for cancer drug research, the construction of reliable benchmarking datasets is fundamental to assessing computational methods. These datasets contain known active compounds alongside "decoys" – molecules presumed inactive that serve as challenging negative controls. The Directory of Useful Decoys, Enhanced (DUD-E) has emerged as a cornerstone resource for this purpose, providing researchers with carefully designed decoy sets that minimize artificial enrichment biases [34] [35].
The fundamental principle behind decoy set design is that decoys should resemble active compounds in their physicochemical properties (making them challenging to discriminate) while remaining topologically dissimilar enough to minimize the likelihood of actual binding [34] [35]. This balance ensures that virtual screening tools are evaluated on their ability to identify true bioactivity signals rather than simply distinguishing basic molecular properties. Within cancer drug discovery, where pharmacophore models target specific oncogenic proteins, using rigorously validated decoys becomes essential for developing reliable computational models [16] [17].
This guide objectively compares DUD-E with alternative decoy generation tools, providing experimental data and methodologies to help researchers select appropriate approaches for validating pharmacophore models in cancer research.
Tool Comparison: DUD-E and Modern Alternatives
The evolution of decoy generation tools has led to several options with different methodologies and optimization targets. The table below summarizes key tools for direct comparison:
Table 1: Comparison of Decoy Generation Tools for Virtual Screening Benchmarking
| Tool Name | Decoy Generation Method | Key Properties Matched | Scope & Size | Key Advantages |
|---|---|---|---|---|
| DUD-E [36] [34] | Property-based matching with topological dissimilarity | MW, logP, HBD, HBA, rotatable bonds, net charge | 102 targets, 22,886 actives, ~1.4 million decoys | Extensive curation; widely adopted benchmark; includes experimental decoys |
| LUDe [37] | DUD-E inspired with enhanced dissimilarity filtering | MW, logP, HBD, HBA, rotatable bonds | Target-specific generation | Reduced artificial enrichment; open-source; usable locally or online |
| DEKOIS [34] | Property-based matching with binding site similarity assessment | Standard physicochemical properties | 147 GPCR targets (original version) | Focus on reducing false decoys; specialized for protein families |
| Custom Selection [35] | Variable (property matching, random selection, experimental) | User-defined | Highly variable | Adaptable to specific research needs; can incorporate experimental data |
Quantitative Performance Benchmarks
Independent benchmarking studies provide crucial data on how these tools perform in practice. A comprehensive assessment of four popular virtual screening programs (Gold, Glide, Surflex, and FlexX) using DUD-E revealed that performance metrics are highly sensitive to the underlying decoy set composition [38]. When potential biases in DUD-E were accounted for, the number of targets where programs achieved successful enrichment (BEDROC score > 0.5) dropped dramatically: Glide succeeded for only 5 targets (down from 30), Gold for 4 (down from 27), and FlexX and Surflex for 2 each (down from 14 and 11 respectively) [38].
A more recent benchmarking exercise for LUDe used the DOE score and Doppelganger score as comparison criteria across 102 pharmacological targets [37]. LUDe decoys obtained better DOE scores across most targets, indicating a lower risk of artificial enrichment. The mean Doppelganger score was similar for both LUDe and DUD-E decoys, with LUDe showing slight improvements for most targets [37].
Tool Methodologies and Experimental Protocols
DUD-E Decoy Generation Workflow
The DUD-E generation process follows a rigorous protocol to ensure decoy quality [34]:
Ligand Collection and Curation: Active compounds with measured affinities (<1 μM) are extracted from ChEMBL, followed by clustering by Bemis-Murcko atomic frameworks to reduce chemotype bias [34].
Property Matching: For each active compound, 50 decoys are selected from ZINC to match key physicochemical properties: molecular weight, calculated logP, number of rotatable bonds, hydrogen bond donors, hydrogen bond acceptors, and net formal charge [34].
Topological Dissimilarity Enforcement: A 2D similarity fingerprint filter ensures selected decoys are topologically dissimilar from active ligands, minimizing the probability that decoys could actually bind [34].
Figure 1: The DUD-E decoy generation workflow integrates property matching with topological dissimilarity filtering.
Experimental Protocol for Pharmacophore Validation Using DUD-E
The following protocol details how to validate a pharmacophore model using DUD-E decoys in cancer drug research, based on established methodologies [39] [17]:
Prepare Active Compound Set: Collect 10-50 known active compounds against your target cancer protein (e.g., BRD4, XIAP) from literature or databases like ChEMBL. Record experimental activity values (e.g., IC50) [17].
Generate or Retrieve Decoy Set: Input active compounds into the DUD-E website (https://dude.docking.org/generate) to generate matched decoys. Alternatively, use pre-existing DUD-E target sets if available for your protein [39].
Merge and Screen Compounds: Combine active compounds and decoys into a single dataset. Screen this dataset against your pharmacophore model using software such as LigandScout [17].
Calculate Enrichment Metrics:
- Generate a Receiver Operating Characteristic (ROC) curve plotting true positive rate against false positive rate [17]
- Calculate the Area Under the Curve (AUC) (values of 0.7-0.8 indicate good performance, 0.8-0.9 excellent, and >0.9 outstanding) [17]
- Compute the Enrichment Factor (EF) using the formula:
Where Ha is the number of active compounds retrieved, Ht is the total number of compounds retrieved, A is the total number of active compounds in the dataset, and D is the total number of compounds in the dataset [40]
Interpret Results: A valid pharmacophore model should show significant enrichment of active compounds over decoys, with AUC > 0.7 and EF values substantially greater than 1 [17].
Table 2: Research Reagent Solutions for Decoy-Based Validation
| Reagent/Tool | Type | Function in Validation | Example Sources |
|---|---|---|---|
| DUD-E Database | Benchmarking database | Provides property-matched decoys for known actives | dude.docking.org [36] |
| ZINC Database | Compound library | Source of purchasable compounds for decoy generation | zinc.docking.org [34] |
| ChEMBL Database | Bioactivity database | Source of experimentally confirmed active compounds | ebi.ac.uk/chembl [34] |
| LigandScout | Pharmacophore software | Creates and screens pharmacophore models | inteligand.com/ligandscout [17] |
| ROC Analysis | Statistical method | Quantifies model discrimination performance | Various statistical packages [17] |
Application in Cancer Drug Discovery
Case Study: Validating a BRD4 Pharmacophore Model
In neuroblastoma research targeting the BRD4 protein, researchers created a structure-based pharmacophore model from the BRD4 crystal structure (PDB: 4BJX) [16]. To validate this model, they employed DUD-E to generate decoys for 36 known active BRD4 antagonists obtained from ChEMBL. The validation results demonstrated excellent discriminatory power with an AUC of 1.0 and enrichment factors ranging from 11.4 to 13.1 [16]. This robust validation confirmed the model's ability to identify true BRD4 inhibitors, leading to the identification of four natural compounds as potential neuroblastoma therapeutics.
Case Study: XIAP Inhibitor Identification for Cancer Therapy
In developing inhibitors against X-linked inhibitor of apoptosis protein (XIAP) - a target in hepatocellular carcinoma - researchers validated their pharmacophore model using DUD-E decoys [17]. The model achieved an early enrichment factor (EF1%) of 10.0 with an AUC value of 0.98 at the 1% threshold, demonstrating strong predictive power for identifying novel XIAP antagonists from natural compound libraries [17]. This validation approach led to the identification of three stable natural compounds as potential leads for XIAP-related cancer treatment.
The selection of appropriate decoy sets significantly impacts the validation of pharmacophore models in cancer drug discovery. DUD-E remains the most extensively validated and widely adopted resource, with proven application across multiple cancer targets. However, newer tools like LUDe offer enhancements in reducing artificial enrichment. For researchers working with established cancer targets, pre-built DUD-E sets provide a robust benchmarking platform. For novel targets or specialized applications, generating custom decoy sets using DUD-E's online tools or implementing LUDe locally may be preferable. Critically, any pharmacophore validation should report the specific decoy set used and corresponding enrichment metrics to enable proper assessment of model performance.
Implementing Receiver Operating Characteristic (ROC) Curve Analysis
In computer-aided drug discovery, particularly in the development of pharmacophore models for cancer research, the Receiver Operating Characteristic (ROC) curve serves as a fundamental statistical tool for evaluating classification performance. A pharmacophore model represents the ensemble of steric and electronic features necessary to ensure optimal supramolecular interactions with a specific biological target. The validation of these models is critical before proceeding to virtual screening of large compound databases. ROC analysis provides a comprehensive framework for assessing how effectively a pharmacophore model can distinguish between known active compounds and decoy molecules across all possible classification thresholds.
The ROC curve's origin traces back to World War II, where it was devised to assess the ability of radar systems to differentiate between enemy objects and signal noise. This statistical method has since been transformed into one of the most widely used tools for analyzing classifier performance in various fields, including computational drug discovery. In the context of pharmacophore modeling for cancer drug research, ROC curves offer invaluable insights into model quality by visualizing the trade-off between sensitivity and specificity, enabling researchers to select the most promising models for identifying novel anti-cancer compounds.
Theoretical Foundations of ROC Curves
Key Terminology and Calculations
The construction and interpretation of ROC curves rely on fundamental concepts derived from classification metrics, primarily stemming from the confusion matrix. Understanding these core components is essential for proper implementation in pharmacophore validation.
Table 1: Core Components of ROC Curve Analysis
| Component | Calculation | Interpretation in Pharmacophore Context |
|---|---|---|
| True Positive (TP) | Correctly identified active compounds | Pharmacophore correctly identifies known active molecules |
| True Negative (TN) | Correctly rejected decoy compounds | Pharmacophore correctly excludes inactive decoys |
| False Positive (FP) | Decoy compounds incorrectly classified as active | Inactive molecules mistakenly identified as hits (Type I error) |
| False Negative (FN) | Active compounds incorrectly classified as decoys | Active molecules missed by the pharmacophore (Type II error) |
| True Positive Rate (TPR/Sensitivity) | TP/(TP+FN) | Ability to correctly identify true active compounds |
| False Positive Rate (FPR) | FP/(FP+TN) | Proportion of decoys incorrectly classified as active |
| Specificity | TN/(TN+FP) | Ability to correctly exclude decoy compounds |
The True Positive Rate (TPR), also called sensitivity, measures the proportion of actual active compounds correctly identified by the pharmacophore model. In contrast, the False Positive Rate (FPR) represents the proportion of decoy compounds incorrectly classified as active. The perfect pharmacophore model would achieve a TPR of 1.0 (identifying all active compounds) while maintaining a FPR of 0.0 (excluding all decoy compounds), represented by the point (0,1) on the ROC graph.
The Area Under the Curve (AUC) Metric
The Area Under the ROC Curve (AUC) provides a single scalar value that summarizes the overall performance of a pharmacophore model across all classification thresholds. The AUC represents the probability that the model will rank a randomly chosen positive example (active compound) higher than a randomly chosen negative example (decoy compound). In practical terms, for a cancer drug discovery context, the AUC indicates the likelihood that the pharmacophore model will assign a higher score to a known active anti-cancer compound than to an inactive decoy molecule.
AUC values range from 0 to 1, with specific interpretations:
- AUC = 1.0: Perfect classifier that completely separates active compounds from decoys
- AUC = 0.9-0.99: Excellent discriminatory power
- AUC = 0.8-0.89: Good discriminatory power
- AUC = 0.7-0.79: Fair discriminatory power
- AUC = 0.5: No discriminatory power, equivalent to random guessing
- AUC < 0.5: Worse than random guessing, though potentially useful if predictions are reversed
In validated pharmacophore studies for cancer targets, excellent models typically demonstrate AUC values exceeding 0.9. For instance, in a study targeting the XIAP protein for cancer therapy, researchers achieved a pharmacophore model with an AUC value of 0.98, indicating outstanding ability to distinguish true actives from decoys [17]. Similarly, a pharmacophore model developed for Brd4 protein inhibitors in neuroblastoma research demonstrated perfect discrimination with an AUC of 1.0 [16].
Computational Implementation of ROC Analysis
Python Implementation with Scikit-learn
The implementation of ROC curve analysis for pharmacophore validation can be efficiently accomplished using Python's Scikit-learn library, which provides comprehensive functionality for calculating ROC curves, computing AUC values, and visualizing results.
For larger-scale pharmacophore validation studies, researchers can implement a more comprehensive approach:
Alternative Implementation Methods
Besides the manual implementation using roc_curve and auc functions, Scikit-learn offers more streamlined approaches for generating ROC visualizations:
Experimental Design for Pharmacophore Validation
Workflow for ROC-Based Model Validation
The validation of pharmacophore models using ROC analysis follows a systematic workflow that ensures rigorous evaluation of model performance. The process begins with the preparation of known active compounds and decoy molecules, proceeds through screening and scoring, and culminates in ROC analysis to quantify discriminatory power.
Preparation of Validation Datasets
The quality of ROC analysis heavily depends on proper dataset preparation. The validation set should include:
Known Active Compounds: Experimentally verified inhibitors of the target protein, typically obtained from databases like ChEMBL or literature mining. For example, in a study targeting Akt2 for cancer therapy, researchers collected 63 active compounds with measured IC50 values from scientific literature [19].
Decoy Molecules: Physicochemically similar but topologically distinct molecules that are presumed inactive against the target. The DUD-E (Database of Useful Decoys: Enhanced) database is commonly used for this purpose, providing decoys matched to actives by molecular weight, calculated LogP, and other physicochemical properties while ensuring dissimilar 2D topology [41].
The enrichment factor (EF) provides additional insight into early recognition performance, particularly important for virtual screening where early enrichment of true actives significantly reduces computational costs. The enrichment factor is calculated as:
[ \text{EF} = \frac{\text{Hits}{\text{sampled}} / N{\text{sampled}}}{\text{Hits}{\text{total}} / N{\text{total}}} ]
Where (\text{Hits}{\text{sampled}}) is the number of active compounds found in the sampled subset, (N{\text{sampled}}) is the size of the sampled subset, (\text{Hits}{\text{total}}) is the total number of active compounds in the database, and (N{\text{total}}) is the total number of compounds in the database.
Comparative Performance Analysis
ROC Analysis of Different Pharmacophore Modeling Approaches
Different pharmacophore modeling approaches exhibit distinct performance characteristics in ROC analysis. Structure-based pharmacophore models derived from protein-ligand crystal structures often demonstrate different discriminatory power compared to ligand-based models or MD-refined approaches.
Table 2: Comparative Performance of Pharmacophore Modeling Methods
| Modeling Approach | Typical AUC Range | Early Enrichment (EF1%) | Best Use Case |
|---|---|---|---|
| Structure-Based Pharmacophore | 0.85-0.98 | 8.0-13.0 | Targets with known crystal structures |
| Ligand-Based Pharmacophore | 0.75-0.92 | 5.0-10.0 | Limited structural data, known actives available |
| MD-Refined Pharmacophore | 0.88-0.99 | 9.0-15.0 | Accounting for protein flexibility |
| Consensus Pharmacophore | 0.90-0.99 | 10.0-16.0 | High-confidence virtual screening |
In a comparative study of pharmacophore models derived from crystal structures versus MD-refined structures, researchers found that molecular dynamics refinement could improve pharmacophore model quality in some cases, resulting in better ability to distinguish between active and decoy compounds [41]. The performance improvement varied across different protein systems, with flexible targets showing the most significant benefits from MD refinement.
Implementation Methods Comparison
Different programming approaches for ROC analysis offer varying levels of flexibility and simplicity for pharmacophore validation studies.
Table 3: Comparison of ROC Implementation Methods
| Implementation Method | Code Complexity | Customization Flexibility | Visualization Quality | Best For |
|---|---|---|---|---|
roc_curve + auc + manual plotting |
High | Maximum control | Publication-ready | Research studies requiring custom visuals |
RocCurveDisplay.from_predictions() |
Low | Moderate | Good | Rapid model evaluation |
RocCurveDisplay.from_estimator() |
Very Low | Limited | Good | Quick model comparison |
metrics.roc_curve + metrics.auc |
Medium | High | Customizable | Standard validation protocols |
Case Study: ROC Analysis in Cancer Drug Discovery
XIAP Inhibitors for Hepatocellular Carcinoma
In a study targeting X-linked inhibitor of apoptosis protein (XIAP) for hepatocellular carcinoma treatment, researchers employed ROC analysis to validate a structure-based pharmacophore model. The model was generated based on the crystal structure of XIAP in complex with a known inhibitor (PDB: 5OQW) using LigandScout software. The pharmacophore model incorporated 14 chemical features: four hydrophobic features, one positive ionizable bond, three hydrogen bond acceptors, five hydrogen bond donors, and 15 exclusion volumes [17].
For validation, researchers compiled a dataset of 10 known XIAP antagonists with experimental IC50 values from ChEMBL and literature, combined with 5199 decoy compounds from the DUD-E database. Virtual screening of this validation set using the pharmacophore model yielded an exceptional AUC value of 0.98 with an early enrichment factor (EF1%) of 10.0, demonstrating outstanding ability to distinguish true XIAP inhibitors from decoys. This validated pharmacophore model subsequently facilitated the identification of three natural compounds with potential XIAP inhibitory activity for further development as anti-cancer agents.
BET Bromodomain Inhibitors for Neuroblastoma
In neuroblastoma research targeting Brd4 protein, a key epigenetic regulator, researchers developed a structure-based pharmacophore model from the crystal structure (PDB: 4BJX) complexed with a known inhibitor. The model was validated using 36 active Brd4 antagonists from ChEMBL and corresponding decoys from DUD-E [16].
The ROC analysis demonstrated perfect classification ability with an AUC of 1.0, indicating flawless discrimination between active compounds and decoys. The enrichment factors ranged from 11.4 to 13.1, further confirming excellent early recognition capability. This validation provided confidence to proceed with virtual screening of natural compound databases, ultimately identifying four promising lead compounds with potential anti-neuroblastoma activity.
The Scientist's Toolkit: Essential Research Reagents
Table 4: Essential Computational Tools for ROC-Based Pharmacophore Validation
| Tool/Category | Specific Examples | Primary Function | Application in Pharmacophore Research |
|---|---|---|---|
| Pharmacophore Modeling Software | LigandScout, Schrödinger, MOE | Generation of structure-based and ligand-based pharmacophore models | Defines essential chemical features for target interaction |
| Virtual Screening Platforms | ZINC database, DOCK, AutoDock Vina | High-throughput screening of compound libraries | Identifies potential hits matching pharmacophore features |
| ROC Analysis Tools | Scikit-learn, R pROC package, MATLAB | Performance evaluation and visualization | Quantifies model ability to distinguish actives from decoys |
| Decoy Set Databases | DUD-E, DEKOIS 2.0 | Provides validated decoy molecules for benchmarking | Creates realistic negative datasets for model validation |
| Molecular Dynamics Software | GROMACS, AMBER, NAMD | Protein-ligand dynamics simulation | Refines pharmacophore models by accounting for flexibility |
Interpretation Guidelines and Decision Framework
The interpretation of ROC analysis results follows specific guidelines that inform decision-making in pharmacophore development. The following decision framework illustrates how to proceed based on AUC values and curve characteristics:
Advanced Interpretation Considerations
Beyond the basic AUC value, several advanced factors influence the practical utility of pharmacophore models:
Early Enrichment: The initial portion of the ROC curve (at low FPR values) indicates how effectively the model identifies true actives in the top-ranked compounds. High early enrichment is particularly valuable for virtual screening of large databases.
Curve Shape Analysis: The concavity and steepness of the ROC curve provide insights into model behavior. A sharply rising curve that quickly approaches high TPR values indicates strong early recognition capability.
Threshold Selection: While ROC analysis evaluates performance across all thresholds, practical application requires selecting an optimal operating point based on the relative costs of false positives versus false negatives in the specific research context.
Domain-Specific Considerations: In cancer drug discovery, where compound libraries may contain diverse chemotypes, the robustness of the pharmacophore model across different chemical classes becomes particularly important.
ROC curve analysis represents an indispensable component of rigorous pharmacophore validation in cancer drug discovery. By providing a comprehensive evaluation of model performance across all classification thresholds, ROC analysis enables researchers to quantitatively assess the ability of pharmacophore models to distinguish true active compounds from decoy molecules. The AUC metric serves as a standardized performance measure that facilitates objective comparison between different modeling approaches and refinement strategies.
Implementation using Python's Scikit-learn library offers flexibility and reproducibility, while established protocols for dataset preparation ensure biologically relevant validation. Through case studies in cancer targets such as XIAP and Brd4, ROC analysis has demonstrated its critical role in building confidence in pharmacophore models before proceeding to resource-intensive virtual screening and experimental validation. When properly implemented and interpreted within the context of specific research objectives, ROC analysis significantly enhances the efficiency and success rate of structure-based drug discovery campaigns for cancer therapeutics.
Calculating and Interpreting the Enrichment Factor (EF) and Goodness of Hit (GH) Score
In the field of computer-aided drug design, pharmacophore models serve as essential theoretical constructs that define the spatial arrangement of molecular features necessary for a compound to exhibit a desired biological activity. Within cancer drug research, validating these models is a critical step before their application in virtual screening campaigns to identify novel therapeutic candidates [24] [42]. Without rigorous validation, researchers risk squandering significant resources on experimental testing of compounds identified through unreliable computational filters. Validation metrics provide a quantitative measure of a model's ability to discriminate between active and inactive compounds, with the Enrichment Factor (EF) and Goodness of Hit (GH) score emerging as two of the most prominent and widely adopted metrics for this purpose [24] [43] [44]. These metrics are particularly valuable in early recognition problems, where the goal is to identify active compounds within the top fraction of a ranked database [44]. This guide details the calculation, interpretation, and practical application of EF and GH scores, providing a standardized framework for evaluating pharmacophore model performance in cancer drug discovery.
Mathematical Definitions and Calculations
The Enrichment Factor (EF)
The Enrichment Factor quantifies how much better a pharmacophore model is at identifying active compounds compared to a random selection process [43] [44]. It is calculated at a specific cutoff threshold (χ), typically defined as the fraction of the database screened. The formula for EF is:
$$EF(χ) = \frac{(ns / Ns)}{(n / N)} = \frac{N \times ns}{n \times Ns}$$ [44]
Where:
- N is the total number of compounds in the database.
- n is the total number of known active compounds in the database.
- Nₛ is the number of compounds selected by the model (hits) at the cutoff χ.
- nₛ is the number of true active compounds found within the selected hits [24] [44].
An EF of 1 indicates performance equivalent to random selection. Higher values signify better enrichment; for example, an EF of 10 means the model is ten times more effective than chance at finding active compounds within the specified top fraction of the database [44].
The Goodness of Hit (GH) Score
The Goodness of Hit Score is a composite metric that balances the yield of actives (recall) with the false-negative rate, providing a more holistic view of model performance [45]. It is calculated using the following formula and components:
$$GH = \left(\frac{Ha}{4HtA}\right) \times \left(1 + \frac{Ht - Ha}{D - A}\right)$$ [42]
In this formula, the variables are defined as:
- Hₐ is the number of hit actives (true positives, nₛ).
- Hₜ is the total number of hits (true positives + false positives, Nₛ).
- A is the number of active compounds in the database (n).
- D is the total number of compounds in the database (N) [42].
The GH score ranges from 0 to 1, where a score of 1 represents a perfect model that retrieves all active compounds with no false positives. A GH score of 0.7–0.8 indicates an excellent model, while a score of 0.5–0.7 indicates a good model [42].
Interpretation and Benchmarking of Scores
Interpreting EF and GH scores requires an understanding of their performance characteristics and how they relate to real-world screening goals. The table below summarizes the qualitative meaning of different score ranges.
Table 1: Interpretation Guidelines for EF and GH Scores
| Score Range | EF Interpretation | GH Interpretation |
|---|---|---|
| High | Excellent early enrichment; model highly effective at prioritizing actives at low cutoff. | Excellent model that successfully retrieves a high proportion of actives with few false positives. |
| Medium | Moderate enrichment; model is better than random but may not be optimal for high-throughput screening. | Good model with a reasonable balance of true positives and false positives. |
| Low (Near 1 for EF, Near 0 for GH) | Performance no better than random selection; model lacks predictive power. | Poor model that fails to identify actives effectively or generates excessive false positives. |
The EF metric is most valuable for assessing early enrichment—the ability to find actives within the first 1-5% of a screened database—which is critical for reducing the cost of virtual screening [44]. However, EF has limitations; its maximum possible value is 1/χ, and it can exhibit a saturation effect once most actives are recovered, making it difficult to distinguish between good and excellent models [44]. The GH score addresses some of these limitations by incorporating the false negative rate, penalizing models that miss known active compounds [42].
Workflow for Model Validation
The process of validating a pharmacophore model using EF and GH scores is a systematic workflow that integrates both computational and experimental considerations. The following diagram illustrates the key stages, from initial model generation to the final decision on model utility.
Diagram 1: Pharmacophore Model Validation Workflow. This flowchart outlines the sequential process for validating a pharmacophore model using EF and GH scores, culminating in a decision on the model's utility for virtual screening.
The workflow begins with a generated pharmacophore model. The first critical step is to prepare a validation dataset containing known active compounds and decoys (presumed inactives) [24] [10]. This dataset is then screened using the pharmacophore model. The results of this screening—specifically, the number of true actives found (Hₐ) and the total number of hits (Hₜ) at a defined cutoff—are used to calculate the EF and GH scores [42]. These scores are compared against pre-defined benchmark thresholds or the performance of alternative models to make a decision on whether the model is acceptable for use in prospective virtual screening campaigns.
Experimental Protocols and Case Studies
Detailed Validation Methodology
A robust validation protocol for a pharmacophore model involves multiple steps to ensure statistical significance, as exemplified by a study on tubulin inhibitors:
- Decoy Set Generation and Screening: An internal database was created with 800 compounds, including 43 known active tubulin inhibitors. This database was screened using the validated pharmacophore model (Hypo1) with the "Ligand Pharmacophore Mapping" protocol in Discovery Studio [42].
- Calculation of Statistical Parameters: The screening results were used to calculate several statistical parameters, providing a comprehensive performance profile [42]:
- Total Hits (Hₜ): The total number of compounds retrieved by the model.
- % Yield of Actives: (Hₐ / Hₜ) × 100.
- % Ratio of Actives: (Hₐ / A) × 100.
- Enrichment Factor (E): Calculated using the standard formula.
- False Negatives: Active compounds missed by the model (A - Hₐ).
- False Positives: Inactive compounds incorrectly retrieved by the model (Hₜ - Hₐ).
- Goodness of Hit (GH) Score: Calculated using the standard formula [42].
- Model Acceptance Criteria: In this study, the Hypo1 model was accepted as excellent because it achieved a GH score of 0.81, significantly exceeding the threshold for a "good" model (0.5–0.7) [42].
Case Study in COX-2 Inhibitor Research
In cancer-related inflammation and therapy, the validation of a COX-2 inhibitor pharmacophore model demonstrates the application of these metrics. The model was validated using a decoy set of 703 inactive compounds from the DUD-E database alongside 5 known active COX-2 inhibitors. The model's predictive ability was confirmed by calculating its sensitivity (true positive rate), specificity (true negative rate), and the area under the ROC curve (AUC) in addition to the EF and GH scores. The high values for these metrics indicated a strong ability to differentiate active from inactive compounds, justifying its subsequent use in a virtual screening campaign that identified nine promising novel COX-2 inhibitor hits [24].
Research Reagent Solutions
The experimental workflow for pharmacophore model validation relies on a suite of software tools and chemical databases. The table below details key resources and their functions.
Table 2: Essential Research Tools for Pharmacophore Validation
| Tool / Resource | Type | Primary Function in Validation | Example Use Case |
|---|---|---|---|
| Discovery Studio (DS) | Software Suite | Generating pharmacophore models (HypoGen), performing virtual screening, and calculating validation metrics [19] [42]. | Used to build a quantitative tubulin inhibitor model and screen a decoy set to calculate EF and GH [42]. |
| LigandScout | Software Suite | Creating 3D ligand- and structure-based pharmacophore models and validating them with built-in algorithms [24]. | Used to develop a validated pharmacophore for COX-2 inhibitors from cyclic imide derivatives [24]. |
| DUD-E Database | Online Database | Provides curated sets of active compounds and decoys for a wide range of biological targets, essential for unbiased validation [10]. | Served as a source of 703 decoys for validating a COX-2 pharmacophore model [24]. |
| ZINC Database | Online Database | A publicly available repository of commercially available compounds, often used as a source for virtual screening and test sets [24] [10] [46]. | Used for virtual screening of potential FAK1 inhibitors after pharmacophore validation [10]. |
| Specs Database | Commercial Database | A large collection of screening compounds used in virtual screening to identify potential lead molecules [42]. | Screened to discover new tubulin inhibitor leads after model validation [42]. |
Comparative Analysis with Other Metrics
While EF and GH are widely used, several other metrics exist for evaluating virtual screening performance. The table below provides a comparative overview.
Table 3: Comparison of Virtual Screening Performance Metrics
| Metric | Formula | Strengths | Weaknesses |
|---|---|---|---|
| Enrichment Factor (EF) | ( EF(χ) = \frac{N \times ns}{n \times Ns} ) [44] | Intuitive, easy to understand, focuses on early enrichment [44]. | Depends on ratio of actives/inactives, has a saturation effect, lacks well-defined upper bound [44]. |
| Goodness of Hit (GH) | ( GH = \left(\frac{Ha}{4HtA}\right) \times \left(1 + \frac{Ht - Ha}{D - A}\right) ) [42] | Balances yield of actives with false negatives; score from 0-1 is easy to interpret [42]. | Less commonly reported than EF, making cross-study comparisons sometimes harder. |
| ROC Enrichment (ROCE) | ( ROCE(χ) = \frac{(ns / n)}{(Ns - n_s) / (N - n)} ) [44] | Addresses early recovery, considered a robust approach [44]. | Lacks a well-defined upper bound, can still exhibit saturation effects [44]. |
| Power Metric | ( Power = \frac{TPR}{TPR + FPR} ) [44] | Statistically robust, well-defined boundaries (0-1), less sensitive to changes in cutoff and active ratio [44]. | A newer metric, not yet as widely adopted in the literature as EF or GH. |
Each metric offers a different perspective. The EF is optimal for assessing early enrichment, which is crucial for practical screening. The GH score provides a more balanced, single-figure assessment of a model's overall utility. For the most robust validation, it is considered best practice to report multiple metrics to give a comprehensive view of model performance [44].
This case study provides a critical evaluation of a multiscale computational research project that successfully identified novel Anaplastic Lymphoma Kinase (ALK) inhibitors through pharmacophore-based screening and experimental validation. The study demonstrates a robust methodology integrating structure-based pharmacophore modeling, systematic virtual screening, and in vitro assays, leading to the discovery of candidate compounds F1739-0081 and F2571-0016 with promising biological activity against ALK-positive cancer models. The comprehensive validation approach, incorporating receiver operating characteristic (ROC) analysis, molecular dynamics simulations, and binding free energy calculations, establishes a reliable framework for future drug discovery efforts targeting ALK-driven malignancies and overcoming therapeutic resistance.
Anaplastic lymphoma kinase (ALK) is a critical receptor tyrosine kinase that regulates signaling pathways essential for cell proliferation, differentiation, and survival [47] [5]. Genetic alterations including mutations or rearrangements of the ALK gene lead to aberrant kinase activation, driving tumorigenesis in various cancers such as non-small cell lung cancer (NSCLC), anaplastic large cell lymphoma (ALCL), and neuroblastoma [5] [48]. Although ALK inhibitors like Crizotinib, Alectinib, and Ceritinib have demonstrated substantial clinical benefits, prolonged treatment often leads to the emergence of resistance-associated mutations such as L1196M and G1202R, which significantly impair inhibitor binding affinity and diminish therapeutic efficacy [5].
The development of novel ALK inhibitors capable of overcoming resistance represents an urgent need in precision oncology. Computer-aided drug design (CADD) technologies, particularly pharmacophore-based virtual screening, have emerged as powerful tools for accelerating the discovery of targeted therapeutics due to their efficiency in compound recognition, binding affinity prediction, and lead optimization [16] [5]. This case study examines the validation of a structure-based pharmacophore model for ALK inhibitor discovery, following the research workflow from computational screening to experimental confirmation of biological activity.
Background: ALK as a Therapeutic Target
ALK Biology and Signaling Pathways
ALK belongs to the insulin receptor superfamily of receptor tyrosine kinases. In normal cellular physiology, ALK activation occurs through ligand binding, inducing receptor dimerization and subsequent activation of its intrinsic tyrosine kinase activity [5]. The activated kinase phosphorylates downstream substrates, regulating crucial signaling pathways including PI3K/AKT, JAK/STAT, and MAPK/ERK, which collectively maintain normal cellular processes [5] [48].
In ALK-positive cancers, aberrant activation resulting from gene fusion, point mutation, or amplification leads to constitutive kinase activity. This persistent signaling disrupts cell cycle regulation, inhibits apoptosis, and promotes uncontrolled cell proliferation and tumor progression [5]. The EML4-ALK fusion variant is particularly significant in NSCLC, where it serves as a primary oncogenic driver [48].
Clinical Challenges with ALK Inhibition
Despite the initial efficacy of approved ALK inhibitors, the development of resistance remains a significant clinical challenge. Gatekeeper mutations such as L1196M induce conformational alterations within the kinase binding pocket, increasing steric hindrance to inhibitor binding [5]. The G1202R mutation introduces a bulkier side chain and altered electrostatic properties, substantially compromising the binding affinity of multiple second-generation ALK inhibitors [5]. These resistance mechanisms highlight the necessity for continued development of novel inhibitors with optimized binding properties and resistance profiles.
Methodology and Experimental Protocols
Pharmacophore Model Development
The research team constructed a structure-based pharmacophore model using the three-dimensional structures of five clinically approved ALK inhibitors: Crizotinib, Ceritinib, Alectinib, Brigatinib, and Lorlatinib [47] [5]. The modeling process identified four essential chemical features: two hydrogen bond acceptors, one hydrogen bond donor, and one aromatic ring, which represent the critical interaction points required for effective ALK binding [5].
The resulting pharmacophore hypothesis was evaluated using comprehensive scoring metrics including drug-likeness alert indices (Stars), spatial conformational compatibility (Volume Score), and overall fit metrics (Fitness/Phase Screen Score). Among the reference compounds, Ceritinib demonstrated the highest degree of alignment with the pharmacophore model, reflected by a Fitness score of 2.326 and a Volume Score of 0.559, indicating superior structural complementarity [5].
Table 1: Pharmacophore Mapping Performance of Approved ALK Inhibitors
| Compound | Fitness Score | Volume Score | Stars Alert |
|---|---|---|---|
| Ceritinib | 2.326 | 0.559 | 3 |
| Brigatinib | 1.832 | - | 3 |
| Crizotinib | 1.419 | - | 3 |
| Alectinib | 1.322 | - | 3 |
| Lorlatinib | 0.892 | - | 3 |
Pharmacophore Model Validation
The discriminatory capability of the pharmacophore model was rigorously assessed using receiver operating characteristic (ROC) curve analysis [5]. The model achieved an area under the curve (AUC) of 0.889, significantly surpassing the random classification baseline (AUC = 0.5), demonstrating robust classification performance and satisfactory generalizability [5]. The ROC curve's proximity to the upper-left corner indicated consistently high sensitivity and specificity across varying discrimination thresholds, with an optimal cutoff point yielding a true positive rate of approximately 0.82 and a false positive rate near 0.18 [5].
This validation approach aligns with established practices in computational drug discovery, where ROC analysis and enrichment factors serve as standard metrics for evaluating pharmacophore model quality and predictive capability [17] [28].
Virtual Screening Protocol
The validated pharmacophore model was employed as a 3D search query for systematic virtual screening of the Topscience drug-like database containing approximately 50,000 compounds [5]. The screening protocol followed a multi-tiered approach:
- Initial Pharmacophore Screening: The screening identified 1,784 potential active candidates based on pharmacophore feature alignment.
- Phase Screen Score Filtering: Application of a Phase Screen Score threshold ≥2 refined the candidate pool to 80 high-confidence compounds.
- PAINS Filtering: Removal of compounds containing pan-assay interference structures (PAINS) to eliminate potential false positives.
- ADMET Prediction: Comprehensive assessment of absorption, distribution, metabolism, excretion, and toxicity properties using in silico prediction tools.
- Molecular Docking: Hierarchical docking studies to evaluate binding modes and interactions within the ALK kinase domain.
Experimental Validation Methods
The top candidate compounds underwent experimental validation using the following methodologies:
- In Vitro Antiproliferative Assays: Evaluation of candidate compounds against A549 human lung adenocarcinoma cell lines using MTT assays [47] [5]. All experiments were performed in triplicate, with IC50 values calculated using SPSS Statistics 21 software.
- Molecular Dynamics Simulations: 100 ns simulations to assess the stability of ligand-receptor complexes and binding mechanisms.
- MM/GBSA Calculations: Molecular Mechanics with Generalized Born and Surface Area Solvation calculations to determine binding free energies and elucidate interaction thermodynamics.
Results and Discussion
Identification of Novel ALK Inhibitors
The integrated computational screening approach identified two promising candidate compounds: F1739-0081 and F2571-0016 [47] [5]. Both compounds exhibited excellent performance in key ADMET-related indices, including human intestinal absorption (HIA), oral bioavailability (F20%), and blood-brain barrier permeability, suggesting promising in vivo absorption and distribution potential [5]. Toxicity predictions based on the rat oral acute model indicated low predicted toxicity and favorable safety margins for both candidates.
Table 2: ADMET Properties of Candidate ALK Inhibitors
| Parameter | F1739-0081 | F2571-0016 |
|---|---|---|
| HIA Prediction | High | High |
| Oral Bioavailability | F20% | F20% |
| BBB Permeability | High | High |
| CL (Clearance) | 9.21 | - |
| ROA Toxicity | Low | Low |
| Drug-likeness | Lipinski compliant | Lipinski compliant |
Compound F1739-0081 displayed a clearance index of 9.21, indicative of efficient metabolic elimination, which may confer both desirable metabolic stability and potential for rapid excretion [5]. Drug-likeness evaluations confirmed that both selected candidates conform to Lipinski's Rule of Five, Pfizer's Rule, and the Golden Triangle criteria, underscoring their favorable pharmacokinetic compatibility and promising drug development potential [5].
Biological Activity Assessment
In vitro antiproliferative assays demonstrated that compound F1739-0081 exhibited moderate but significant antiproliferative activity against the tested cell lines [5]. Although its inhibitory potency was inferior to the positive control Ceritinib, it slightly surpassed Lorlatinib in activity, suggesting that F1739-0081 possesses a measurable level of biological activity and represents a promising scaffold for further structural optimization and mechanistic investigation [5].
Computational analyses through molecular docking and dynamics simulations revealed the probable binding modes and interactions with ALK, providing structural insights that support the observed biological activity and establish a foundation for rational inhibitor optimization [47].
ALK Signaling Pathway and Inhibitor Mechanism
The diagram below illustrates the ALK signaling pathway and the mechanism of inhibitor action, highlighting key downstream signaling cascades and regulatory nodes.
Research Workflow and Experimental Design
The comprehensive research methodology, from pharmacophore development to experimental validation, is summarized in the following workflow diagram.
The Scientist's Toolkit: Essential Research Reagents
Table 3: Key Research Reagent Solutions for ALK Inhibitor Discovery
| Reagent/Resource | Function in Research | Specific Application in ALK Study |
|---|---|---|
| Topscience Database | Drug-like compound library | Source of 50,000 molecules for virtual screening |
| LigandScout Software | Structure-based pharmacophore modeling | Generation of ALK-specific pharmacophore hypotheses |
| SPSS Statistics | Statistical analysis | IC50 calculation from antiproliferative assays |
| A549 Cell Line | In vitro cancer model | Human lung adenocarcinoma cells for activity testing |
| MTT Assay Kit | Cell viability assessment | Measurement of antiproliferative effects |
| Molecular Dynamics Software | Simulation of molecular interactions | 100 ns simulations of ALK-inhibitor complexes |
| ROC Analysis | Classification model validation | Pharmacophore model quality assessment |
This case study demonstrates the successful application of an integrated computational and experimental approach for identifying novel ALK inhibitors through validated pharmacophore modeling. The multiscale methodology, incorporating structure-based pharmacophore design, rigorous virtual screening, and experimental validation, led to the identification of candidate compounds with promising biological activity and favorable drug-like properties.
The study establishes a robust framework for future drug discovery efforts targeting ALK-positive malignancies, particularly in addressing the critical challenge of therapy resistance. The comprehensive validation strategy, combining ROC analysis, molecular dynamics simulations, and binding free energy calculations, provides a template for evaluating computational models in targeted cancer therapy development.
While the identified candidates require further optimization and extensive preclinical evaluation, the research demonstrates the power of integrated computational and experimental approaches in accelerating the discovery of targeted therapeutics for precision oncology applications.
The X-linked inhibitor of apoptosis protein (XIAP) is a critical regulatory protein that directly neutralizes caspase activity, and its overexpression is a well-established mechanism by which cancer cells evade programmed cell death [49] [17]. Targeting XIAP to restore apoptosis in malignant cells represents a promising therapeutic strategy. Structure-based pharmacophore modeling is a powerful computational method in drug discovery that defines the steric and electronic features necessary for optimal supramolecular interactions with a biological target [41] [50]. This case study details the validation of a pharmacophore model for XIAP using known active cancer drugs and natural compounds, framing the process within a broader research thesis on model validation. The workflow integrates virtual screening, molecular docking, and molecular dynamics simulations to identify and characterize novel natural product-based XIAP inhibitors, providing a rigorous framework for computer-aided drug discovery [51] [17].
XIAP as a Therapeutic Target and Established Inhibitors
The Role of XIAP in Apoptosis and Cancer
XIAP is one of the most potent members of the inhibitor of apoptosis protein (IAP) family. Its anti-apoptotic function is primarily mediated through its baculoviral IAP repeat (BIR) domains: the BIR2 domain and its flanking region inhibit the effector caspases-3 and -7, while the BIR3 domain binds to and inhibits the initiator caspase-9 [17] [52]. By directly suppressing these key enzymes, XIAP blocks the apoptotic cascade, and its overexpression is frequently linked to tumor development, chemotherapy resistance, and poor prognosis in cancers such as acute myeloid leukemia (AML) and pancreatic cancer [52] [53].
Clinically Explored XIAP Inhibitors
Several strategies have been employed to target XIAP therapeutically. SMAC mimetics are among the most developed small-molecule inhibitors designed to mimic the natural IAP antagonist, SMAC/DIABLO, which binds to the BIR domains of XIAP, thereby freeing caspases to initiate apoptosis [17]. However, clinical candidates like the antisense oligonucleotide AEG35156 were terminated due to issues such as neurotoxicity, highlighting the need for safer and more specific antagonists [17]. Table 1 summarizes some key characteristics of established XIAP-targeting approaches.
Table 1: Historically Explored XIAP-Targeting Therapeutic Modalities
| Therapy Name/Type | Mechanism of Action | Development Status/Notes |
|---|---|---|
| AEG35156 (Antisense) | Reduces XIAP mRNA levels | Phase I clinical trial; terminated due to neurotoxicity [17] |
| SMAC Mimetics | Binds to BIR2/BIR3 domains, displacing caspases | Several in pre-clinical and clinical development; can cause toxicity due to high affinity and binding to other IAPs like cIAP1 [17] |
| Hydroxythio Acetildenafil | Small molecule XIAP antagonist (CID: 46781908) | Used in pharmacophore modeling; binding affinity (IC50): 40.0 nM [17] |
Computational Methodology for Model Development and Validation
Structure-Based Pharmacophore Model Generation
The foundation of this case study is a structure-based pharmacophore model derived from a XIAP-inhibitor co-crystal structure (PDB: 5OQW). The bound ligand, Hydroxythio Acetildenafil, served as the reference for identifying key interaction features using advanced molecular design software [17]. The generated model captured 14 chemical features critical for XIAP binding, which were refined to an optimal set for virtual screening. These features are visualized in the diagram below, which maps the key interactions between the ligand and the XIAP protein.
Model Validation Using Receiver Operating Characteristic (ROC) Analysis
Before deploying the model for screening, its ability to distinguish active inhibitors from inactive molecules was rigorously validated. This was done using a decoy set containing 10 known active XIAP antagonists and 5,199 presumed inactive decoy compounds from the Database of Useful Decoys (DUDe) [17]. The model's performance was quantified by the Area Under the Curve (AUC) of the Receiver Operating Characteristic (ROC) curve and the Enrichment Factor (EF). An ideal model has an AUC of 1.0, while a random model has an AUC of 0.5. The validated model demonstrated an excellent AUC value of 0.98 and an EF1% of 10.0, confirming its high predictive power for identifying true XIAP inhibitors [17].
Virtual Screening and Identification of Natural Compound Hits
Screening Protocol and Hit Selection
The validated pharmacophore model was used as a 3D query to screen the ZINC Natural Product Database, a curated collection of commercially available compounds [17]. This virtual screening process identified several natural compounds that matched the essential pharmacophore features. The top hits were subsequently subjected to molecular docking against the XIAP-BIR3 domain to evaluate their predicted binding affinity and pose. Finally, molecular dynamics (MD) simulations were employed to assess the stability of the protein-ligand complexes in a simulated physiological environment, providing further confidence in the hits [51] [17]. The overall workflow, from model creation to final hit identification, is summarized below.
Promising Natural Compound Hits
This integrated computational pipeline identified several promising natural product-derived XIAP inhibitors. Key hits from this and other studies are listed in Table 2, which includes their names, sources, and binding characteristics.
Table 2: Identified Natural Compounds as Putative XIAP Inhibitors
| Compound Name | Natural Source | Reported Binding Affinity / Key Finding |
|---|---|---|
| Caucasicoside A | - | Identified as a stable hit through virtual screening, molecular docking, and MD simulation [51] [17] |
| Polygalaxanthone III | - | Identified as a stable hit through virtual screening, molecular docking, and MD simulation [51] [17] |
| MCULE-9896837409 | - | Identified as a stable hit through virtual screening, molecular docking, and MD simulation [51] [17] |
| Sanggenon G (SG1) | Morus root bark (Mulberry) | Binds specifically to the BIR3 domain; Binding affinity (Kd): 34.26 μM; Acts as a chemosensitizer [53] |
| C38OX6 | 'Unnatural Natural Product' Library | Restored caspase-3 activity in vitro; sensitized cancer cells to anticancer drugs [52] |
| Erioquinol & Eriopodols | Piper genus plants | Demonstrated XIAP antagonism; induced caspase-independent cell death and mitochondrial dysfunction [49] |
Experimental Validation of Hit Compounds
Biochemical and Cellular Assays
The computational predictions for the hit compounds required experimental validation through a series of in vitro and cell-based assays, which are standard in the field for confirming XIAP inhibition.
- Fluorescence Polarization (FP) Assay: This biochemical assay measures the displacement of a fluorescently labeled peptide (derived from SMAC) from the XIAP-BIR3 domain. A decrease in polarization indicates successful competitive binding. This method was used to determine that Sanggenon G binds to the XIAP-BIR3 domain with a dissociation constant (Kd) of 34.26 μM [53].
- Caspase De-repression Assay: This functional assay tests the compound's ability to restore caspase activity that has been suppressed by XIAP. In vitro, recombinant XIAP protein inhibits caspase-3 or -9. The addition of a true inhibitor displaces XIAP, leading to increased caspase enzymatic activity. C38OX6 was shown to restore XIAP-suppressed caspase-3 activity in such an assay [52].
- Protein Fragment Complementation Assay (PCA): This cell-based assay is used to visualize and quantify the disruption of protein-protein interactions inside living cells. It can be configured to show that a small molecule (like Sanggenon G) interferes with the binding between XIAP and caspase-9 [53].
Chemosensitization and Apoptosis Restoration
A critical functional test for a XIAP inhibitor is its ability to sensitize cancer cells to conventional chemotherapeutic agents. This was demonstrated for several hits:
- Treatment of Molt3/XIAP leukemia cells with Sanggenon G enhanced the cleavage (activation) of caspases-8, -3, and -9 and sensitized the cells to etoposide-induced apoptosis [53].
- Similarly, C38OX6 sensitized cancer cells to various anticancer drugs, while the unconverted natural product precursor did not, confirming the value of the chemical modification strategy [52].
Table 3: Key Research Reagent Solutions for XIAP Inhibitor Discovery
| Reagent / Resource | Function and Application in Research |
|---|---|
| Recombinant XIAP-BIR3 Protein | Essential for in vitro binding assays (e.g., FP), biochemical caspase activity assays, and surface plasmon resonance (SPR) for affinity measurement [52] [53]. |
| Fluorescent Peptide Probe (e.g., ARPF-FAM) | A SMAC-mimetic peptide used as a tracer in Fluorescence Polarization (FP) assays to competitively screen for inhibitors that displace it from the BIR3 domain [53]. |
| Caspase-3, -9 Enzymes | Used in caspase de-repression assays to functionally validate inhibitors by measuring the restoration of enzymatic activity suppressed by XIAP [52]. |
| XIAP-Overexpressing Cell Lines (e.g., Molt3/XIAP) | Cellular models for testing the efficacy and cell permeability of inhibitors via immunoprecipitation, caspase activation assays, and chemosensitization studies [53]. |
| Pharmacophore Modeling Software (e.g., LigandScout) | Software used to generate and validate structure-based pharmacophore models from protein-ligand complexes for virtual screening [17] [50]. |
| Natural Product Libraries (e.g., ZINC, UNP Library) | Curated chemical libraries used for virtual and high-throughput screening to discover novel bioactive compounds from natural and semi-synthetic sources [17] [52]. |
This case study demonstrates a robust and validated framework for discovering novel XIAP inhibitors from natural sources. The process began with the development of a high-quality, structure-based pharmacophore model, which was rigorously validated against known actives (AUC = 0.98). This model was successfully deployed in virtual screening, leading to the identification of several promising natural product-derived hits, including Caucasicoside A, Polygalaxanthone III, and Sanggenon G. Subsequent experimental validation confirmed that these compounds bind to the XIAP-BIR3 domain and, most importantly, restore apoptotic signaling in cellular models. The integration of computational and experimental methods provides a powerful strategy for advancing the development of targeted cancer therapies aimed at overcoming apoptosis resistance.
Integrating Molecular Docking to Refine and Confirm Hits
Within the framework of validating pharmacophore models for cancer drug discovery, molecular docking serves as an indispensable computational bridge. This process refines initial hits obtained from virtual screening by predicting the precise atomic-level interactions between a small molecule and its target protein, thereby confirming the mechanistic plausibility suggested by the pharmacophore [54] [28]. The transition from a pharmacophore match, which suggests potential activity, to a docked pose that demonstrates stable binding within a protein's active site, significantly de-risks the selection of candidates for costly experimental assays [10]. This guide provides an objective comparison of current docking methodologies and outlines detailed protocols for their application in confirming hits targeting cancer-related proteins.
Performance Comparison of Docking Methods
The selection of an appropriate docking method is critical for successful hit confirmation. Performance varies significantly across different software and algorithmic approaches, particularly in key metrics such as pose prediction accuracy and the physical plausibility of the generated complexes [55]. The following tables compare the performance of various methods, highlighting their suitability for different stages of the hit refinement workflow.
Table 1: Overall Performance and Physical Validity of Docking Methods
| Method | Type | RMSD ≤ 2 Å (Astex) | PB-Valid Rate (Astex) | Combined Success (Astex) | Key Characteristics |
|---|---|---|---|---|---|
| Glide SP | Traditional Physics-Based | 82.35% | 97.65% | 81.18% | High physical validity, reliable for binding mode analysis [55] |
| AutoDock Vina | Traditional Physics-Based | 75.29% | 92.94% | 71.76% | Widely used, good balance of speed and accuracy [55] |
| SurfDock | Generative Diffusion (DL) | 91.76% | 63.53% | 61.18% | High pose accuracy, lower physical validity [55] |
| Interformer | Hybrid (AI Scoring) | 70.59% | 80.00% | 58.82% | Balanced performance, integrates AI with traditional search [55] |
| DiffBindFR | Generative Diffusion (DL) | ~75.30% | ~47.20% | ~34.58% | Moderate pose accuracy [55] |
| KarmaDock/QuickBind | Regression-Based (DL) | <40% | <20% | <10% | Fast but often produces physically invalid poses [55] |
Table 2: Performance on Novel Targets and Virtual Screening Utility
| Method | Generalization to Novel Pockets | Virtual Screening Enrichment | Computational Cost | Ideal Use Case |
|---|---|---|---|---|
| Glide SP | Consistently high physical validity (>94%) [55] | High efficacy in lead discovery [55] | High | Final hit confirmation and lead optimization |
| AutoDock Vina | Good performance on unseen complexes [55] | Proven in large-scale campaigns [56] | Medium | Intermediate refinement and focused library screening |
| SurfDock | High pose accuracy (75.66%), low validity (40.21%) [55] | Potential but limited by physical plausibility [55] | Very High | Initial pose generation for well-defined targets |
| Interformer | Good balance on novel pockets [55] | Promising due to hybrid architecture [55] | Medium-High | Screening diverse chemical libraries |
| Regression-Based DL | Poor generalization [55] | Limited by pose validity [55] | Low (after training) | Not recommended for reliable hit confirmation |
Experimental Protocols for Hit Refinement
Integrating molecular docking into the hit validation workflow requires a structured, multi-tiered approach. The protocols below outline a robust methodology, from initial system preparation to final selection, incorporating best practices to ensure reliable results.
System Preparation and Pre-Docking Setup
Protein Preparation:
- Source and Clean: Obtain the 3D structure of the target protein from the Protein Data Bank (PDB). In cancer research, common targets include kinases (e.g., FGFR1, FAK1, FLT3), growth factor receptors, and apoptotic regulators [28] [57] [10].
- Pre-process: Using a tool like Schrödinger's Protein Preparation Wizard, add hydrogen atoms, assign correct protonation states at physiological pH (e.g., for Asp, Glu, His, Lys), and correct any missing side chains or loops. For example, in a FAK1 kinase domain study, missing residues (570–583 and 687–689) were modeled using MODELLER software [10].
- Optimize: Conduct a restrained energy minimization using a force field such as OPLS3e or OPLS-AA to relieve steric clashes and achieve a stable protein conformation [28] [10].
Ligand Preparation:
- Source: Input structures are the hit compounds from the prior pharmacophore-based virtual screening [28].
- Pre-process: Generate 3D structures, assign bond orders, and determine correct stereochemistry. Generate multiple low-energy conformations for each ligand using tools like LigPrep (Schrödinger) or the OMEGA toolkit (OpenEye) [28] [57].
- Finalize: Output ligands in a suitable format for docking (e.g., MOL2, SDF), ensuring formal charges are correct.
Hierarchical Docking and Scoring Protocol
A multi-stage docking strategy balances computational efficiency with predictive accuracy [28].
Standard-Precision (SP) Docking:
- Objective: Rapidly screen all pharmacophore-derived hits to eliminate compounds with poor complementarity to the binding pocket.
- Protocol: Use a grid centered on the binding site (e.g., the ATP-binding pocket for a kinase). Dock all prepared ligands using a fast, reliable method like AutoDock Vina in PyRx or Glide SP [28] [10].
- Analysis: Rank compounds by docking score (e.g., Vina score in kcal/mol). Select the top 10-20% of compounds for further analysis. For instance, a study on FLT3 inhibitors used a threshold of ≤ -10.524 kcal/mol to select 68 candidates from 7,280 compounds [57].
Extra-Precision (XP) Docking:
- Objective: Refine the binding poses of the top-ranked SP hits and more accurately estimate binding affinity.
- Protocol: Dock the shortlisted compounds using a more rigorous scoring function, such as Glide XP, which incorporates penalties for desolvation and steric clashes [28].
- Analysis: Re-rank compounds based on XP GScore. The poses generated here are used for detailed interaction analysis.
Binding Affinity Estimation (MM/GBSA):
- Objective: Obtain a more reliable, quantitative estimate of the binding free energy.
- Protocol: Using the XP docking poses, perform Molecular Mechanics/Generalized Born Surface Area (MM/GBSA) calculations. This method calculates binding free energy by combining molecular mechanics energies with continuum solvation models [28] [10].
- Analysis: Compare the MM/GBSA scores (ΔG_bind) of your hits to a known reference inhibitor. For example, in the FGFR1 study, MM/GBSA confirmed that hit compounds had superior binding affinity compared to the reference ligand [28].
Post-Docking Analysis and Selection Criteria
- Pose Cluster Analysis: Examine the top scoring poses for each ligand. Prioritize ligands with a consistent, well-defined binding mode over those with highly variable poses.
- Interaction Fingerprinting: Analyze and visualize the protein-ligand interactions (hydrogen bonds, hydrophobic contacts, pi-pi stacking, salt bridges) using tools like Maestro (Schrödinger) or PyMOL. Confirm that key interactions identified in the original pharmacophore model are recapitulated [28].
- Consensus Ranking: Finalize the candidate list by creating a consensus rank that considers the XP docking score, MM/GBSA binding energy, and the quality of the protein-ligand interactions.
Hierarchical Docking Workflow for Hit Refinement
Integrated Validation: From In Silico to In Vitro
For a comprehensive validation within cancer drug discovery, computational predictions must be integrated with experimental data. This multi-faceted approach confirms both the binding hypothesis and the functional biological outcome.
Correlation with Experimental Cytotoxicity: A critical review focusing on the MCF-7 breast cancer cell line demonstrated that a direct, consistent linear correlation between computed Gibbs free energy (ΔG) and in vitro cytotoxicity (IC₅₀) is often not observed. This discrepancy arises from factors like cellular permeability, metabolic stability, and protein expression levels, which are not captured by molecular docking alone [54]. Therefore, while strong predicted binding affinity is a positive indicator, it should not be the sole selection criterion.
Stability Assessment via Molecular Dynamics (MD): Following docking, subject the top complexes to MD simulations (typically 100-500 ns) to evaluate the stability of the predicted binding pose over time. Key metrics include the root-mean-square deviation (RMSD) of the protein-ligand complex and the number of persistent hydrogen bonds. For instance, stable complexes of novel FGFR1 and FAK1 inhibitors demonstrated low RMSD fluctuations and maintained key interactions throughout the simulation [28] [10].
Experimental Confirmation: The ultimate validation involves in vitro testing.
- Binding Assays: Use techniques like surface plasmon resonance (SPR) or thermal shift assays to directly measure binding affinity and kinetics.
- Functional Assays: Test the inhibitory activity of the hits in enzyme activity assays (e.g., kinase assays for kinase targets).
- Cellular Efficacy: Evaluate the hits in relevant cancer cell lines (e.g., MV4-11 cells for FLT3 inhibitors [57] or MCF-7 cells for breast cancer targets [58]) to measure cytotoxicity (IC₅₀), apoptosis induction, and effects on cell migration. The integrated study on naringenin exemplifies this, where docking predictions of strong binding to SRC were confirmed by its ability to inhibit proliferation and induce apoptosis in MCF-7 cells [58].
Integrated Validation Pathway for Confirmed Hits
The Scientist's Toolkit: Essential Research Reagents and Software
Table 3: Key Research Reagent Solutions for Docking and Validation
| Category | Item / Software | Primary Function in Hit Validation | Example Use Case |
|---|---|---|---|
| Software & Platforms | Schrödinger Suite (Glide) | Industry-standard for hierarchical SP/XP docking and MM/GBSA calculations [28]. | FGFR1 inhibitor discovery [28]. |
| AutoDock Vina / PyRx | Open-source docking tool for rapid screening and pose prediction [10]. | Virtual screening of ZINC database for FAK1 inhibitors [10]. | |
| GROMACS / AMBER | Software for running Molecular Dynamics simulations to assess complex stability [28] [10]. | 500-ns simulation to validate FGFR1-hit stability [28]. | |
| Pharmit | Web-based tool for structure-based pharmacophore modeling and validation [10]. | Creation of the pharmacophore model for FAK1 from a P4N complex [10]. | |
| Databases | PDB | Repository for 3D structural data of proteins and protein-ligand complexes [28] [10]. | Source of the FGFR1 (4ZSA) and FAK1 (6YOJ) structures [28] [10]. |
| ZINC / ChEMBL | Public databases of commercially available compounds and bioactivity data [59] [56] [10]. | Library for virtual screening (ZINC) [10] and source of active ligands for model training (ChEMBL) [59] [57]. | |
| Experimental Reagents | Kinase Assay Kits | In vitro biochemical testing to confirm functional inhibition of kinase targets. | Validating inhibition potency of novel FLT3 inhibitors [57]. |
| Cancer Cell Lines | In vitro models for testing cytotoxicity and mechanistic efficacy. | Using MCF-7 (breast) and MV4-11 (AML) cells for experimental validation [58] [57]. |
Beyond the Basics: Diagnosing and Enhancing Model Performance
In computer-aided drug discovery, pharmacophore models serve as abstract representations of the steric and electronic features necessary for a molecule to interact with a specific biological target [60]. The validation of these models is a critical step before their application in virtual screening, as it determines their reliability in distinguishing active compounds from inactive ones [17] [61]. Validation metrics, particularly the Area Under the Curve (AUC) and Enrichment Factor (EF), provide quantitative measures of model performance [16] [4]. Low AUC and EF values indicate poor model performance, potentially leading to wasted resources and missed opportunities in drug discovery campaigns [17]. Within cancer drug research, where pharmacophore models frequently target specific oncogenic proteins like XIAP, Brd4, VEGFR-2, and c-Met, understanding the pitfalls that lead to suboptimal validation metrics is crucial for developing effective therapeutic candidates [16] [17] [4].
This guide systematically examines the common pitfalls associated with low AUC and EF values, provides practical solutions, and presents experimental protocols for proper pharmacophore validation in cancer drug discovery contexts.
Understanding AUC and EF in Model Validation
Definition and Interpretation of Key Metrics
The Area Under the Curve (AUC) of the Receiver Operating Characteristic (ROC) curve measures the overall ability of a pharmacophore model to discriminate between active and inactive compounds [61]. The AUC value ranges from 0 to 1, where 0.5 represents random discrimination and 1.0 represents perfect discrimination [17]. According to established validation standards, AUC values of 0.51-0.7 indicate acceptable performance, 0.71-0.8 indicate good performance, and values above 0.8 indicate excellent performance [16].
The Enrichment Factor (EF) measures how much better a model performs at identifying active compounds compared to random selection [4]. It is calculated using the formula:
[EF = \frac{Ha \times D}{Ht \times A}]
Where (Ha) is the number of active compounds identified as hits, (D) is the total number of compounds in the decoy set, (Ht) is the total number of active compounds, and (A) is the total number of compounds returned by pharmacophore-based screening [4]. Generally, an EF value greater than 2 is considered acceptable, with higher values indicating better enrichment capability [4].
Performance Benchmarks in Cancer Drug Discovery
Table 1: Interpretation Guidelines for AUC and EF Values in Pharmacophore Validation
| Metric | Poor Performance | Acceptable Performance | Good Performance | Excellent Performance |
|---|---|---|---|---|
| AUC | 0.5 - 0.7 | 0.71 - 0.8 | 0.81 - 0.9 | > 0.9 |
| EF | < 2 | 2 - 5 | 5 - 10 | > 10 |
In practical applications within cancer research, successfully validated models demonstrate robust metrics. For instance, a pharmacophore model targeting the XIAP protein achieved an exceptional AUC of 0.98 with an EF of 10.0, indicating high reliability for virtual screening [17]. Similarly, a Brd4-targeted model for neuroblastoma showed perfect AUC of 1.0 with EF values between 11.4-13.1 [16]. These values represent the gold standard that researchers should aim for in cancer drug discovery projects.
Common Pitfalls and Solutions for Low AUC and EF
Pitfall 1: Inadequate Data Preparation and Quality
Poor quality input data fundamentally compromises pharmacophore model performance. In structure-based approaches, this includes using protein structures with incorrect protonation states, missing residues, or non-physiological crystal packing contacts [60] [61]. For ligand-based models, insufficient conformational sampling or incorrect representation of ionization states can lead to inaccurate feature identification [60] [62].
Solutions:
- Conduct thorough protein structure preparation including hydrogen atom addition, protonation state correction, and residue completion before model generation [4].
- Perform comprehensive conformational analysis for ligand-based approaches, ensuring representation of bioactive conformations [63].
- Critically evaluate input data quality, particularly for crystal structures that may contain errors or non-physiological contacts [60] [61].
Pitfall 2: Non-representative Decoy Sets
Using decoy sets with inappropriate physicochemical properties or structural similarities to active compounds artificially inflates enrichment metrics and reduces real-world screening performance [17] [61]. This creates artificial enrichment where models appear to perform well during validation but fail in actual virtual screening applications.
Solutions:
- Utilize validated decoy sets from databases like DUD-E (Directory of Useful Decoys, Enhanced) that account for molecular weight, logP, hydrogen bond donors/acceptors, and rotatable bonds while ensuring topological dissimilarity [62] [17].
- Ensure decoy compounds have similar 1D physicochemical properties but dissimilar 2D topology to active compounds to prevent artificial enrichment [62].
- Incorporate sufficient decoy diversity, typically 50 decoys per active compound, to adequately represent chemical space [62].
Pitfall 3: Suboptimal Feature Selection and Spatial Arrangement
Including too many or too few pharmacophoric features, or incorrectly representing their spatial relationships, reduces model selectivity [60] [19]. Excessive features create overly restrictive models that miss valid actives, while insufficient features produce promiscuous models with high false-positive rates [60].
Solutions:
- Select only essential features strongly contributing to binding energy or conserved across known active compounds [60].
- For structure-based models, incorporate exclusion volumes to represent binding site shape and prevent steric clashes [60] [17].
- Consider dynamic protein flexibility through Molecular Dynamics (MD) simulation-refined models rather than relying solely on static crystal structures [61].
Pitfall 4: Ignoring Binding Site Flexibility
Traditional structure-based pharmacophore models derived from single crystal structures often fail to account for protein flexibility, leading to rigid binding site assumptions that don't reflect physiological conditions [61]. This is particularly problematic for flexible targets like kinases and nuclear receptors commonly encountered in cancer research [61].
Solutions:
- Implement MD-refined pharmacophore models using final frames from molecular dynamics simulations to capture binding site flexibility [61].
- For targets with multiple crystal structures, generate consensus models incorporating features from different conformational states [19] [61].
- Use ensemble docking approaches or multiple protein conformations to create more comprehensive pharmacophore hypotheses [61].
Experimental Protocols for Robust Validation
Standard Validation Workflow Protocol
The following protocol outlines a comprehensive approach for validating pharmacophore models to ensure reliable AUC and EF metrics:
Preparation of Validation Sets
- Curate a set of known active compounds (20-50 molecules) with verified biological activity against the target [62] [17].
- Generate decoy sets using DUD-E or similar methodologies with 50 decoys per active compound [62].
- Ensure decoys match actives in molecular weight, logP, hydrogen bond donors/acceptors, and rotatable bonds but differ in 2D topology [62].
Model Validation and Optimization
- Screen the combined active/decoy set using the pharmacophore model as a query [17] [61].
- Generate ROC curves and calculate AUC values using specialized software or custom scripts [16] [61].
- Compute EF values at 1% threshold using the standard EF formula [4].
- Iteratively refine the model by adjusting feature selection and spatial tolerances to optimize both AUC and EF [60] [19].
Performance Documentation
- Record true positives, false positives, true negatives, and false negatives at various score thresholds [17].
- Calculate additional metrics including sensitivity, specificity, and GH score for comprehensive performance assessment [16] [64].
- Compare performance against established benchmarks (Table 1) to determine model adequacy for virtual screening [16] [4].
Figure 1: Workflow for comprehensive pharmacophore model validation with iterative refinement based on AUC and EF metrics.
MD-Refined Pharmacophore Validation Protocol
Molecular dynamics simulations can enhance pharmacophore model quality by accounting for protein flexibility:
System Setup
Simulation and Analysis
Model Selection
The Scientist's Toolkit: Essential Research Reagents
Table 2: Key Research Reagents and Computational Tools for Pharmacophore Validation
| Tool/Resource | Type | Primary Function | Application in Validation |
|---|---|---|---|
| DUD-E Database | Database | Provides calculated decoys with similar physicochemical properties but dissimilar topology | Creating validation sets to prevent artificial enrichment [62] [4] |
| LigandScout | Software | Structure-based and ligand-based pharmacophore generation | Creating and optimizing pharmacophore features [16] [17] |
| ROC Curve Analysis | Analytical Method | Visualizes classifier performance across thresholds | Calculating AUC values and determining optimal score thresholds [16] [61] |
| Molecular Dynamics Software (GROMACS, AMBER) | Simulation Tool | Models protein-ligand dynamics in physiological conditions | Generating MD-refined pharmacophore models [61] |
| ZINC Database | Compound Library | Curated collection of commercially available compounds | Source of natural products and diverse compounds for virtual screening [16] [17] |
| Discovery Studio | Software Suite | Comprehensive modeling and simulation environment | Pharmacophore generation, virtual screening, and analysis [19] [4] |
Interpreting low AUC and EF values requires systematic investigation of potential pitfalls across the model development pipeline. Through proper data preparation, representative decoy sets, optimal feature selection, and consideration of protein flexibility, researchers can significantly enhance pharmacophore model performance. The experimental protocols and toolkit presented here provide a structured approach for validating models in cancer drug discovery, ensuring reliable virtual screening outcomes. As demonstrated in successful applications against targets like XIAP, Brd4, and VEGFR-2, rigorously validated pharmacophore models with high AUC and EF values serve as powerful tools for identifying novel anticancer agents [16] [17] [4].
Addressing Overfitting through Fischer's Randomization and Cost Analysis
In the field of computer-aided drug design, pharmacophore models serve as essential theoretical constructs that define the steric and electronic features necessary for a molecule to interact with a specific biological target. These models are particularly crucial in anticancer drug discovery, where they accelerate the identification of novel therapeutic candidates by screening vast compound libraries in silico. However, the predictive power and real-world applicability of any pharmacophore model are entirely dependent on its statistical robustness and its ability to generalize to new, unseen data.
A primary threat to the reliability of these models is overfitting, an undesirable phenomenon where a model learns the noise and specific characteristics of its training dataset rather than the underlying structure-activity relationship. An overfit model may appear excellent during training but fails to provide accurate predictions for new molecular entities, potentially misdirecting entire drug discovery campaigns [65]. This article objectively compares two pivotal methodological strategies—Fischer's Randomization Test and Cost Analysis—for detecting and preventing overfitting during pharmacophore model development, providing a structured guide for research scientists.
Theoretical Foundation: Overfitting in Pharmacophore Modeling
What is Overfitting?
In machine learning and computational chemistry, overfitting occurs when a model is excessively complex, having learned from the training data's idiosyncrasies rather than its generalizable patterns. Key characteristics include:
- High Variance: The model performs well on training data but poorly on validation or test data [65].
- Poor Generalization: It cannot make reliable predictions on new datasets, such as new chemical scaffolds not represented in the training set.
- Common Causes: Overfitting typically arises from a training set that is too small, contains excessive noise, or when the model's complexity is not appropriately constrained [65] [66].
The Critical Need for Validation in Pharmacophore Models
Pharmacophore models are hypotheses. Without rigorous validation, a model's apparent success in explaining training set data might be a chance correlation, leading to the wasted resources in synthesizing and testing inactive compounds. Validation procedures like Fischer's Randomization and Cost Analysis are therefore not merely best practices but are fundamental requirements for establishing model credibility. They help ensure that the model captures the true chemical features responsible for biological activity, a principle that is especially critical when working with known active cancer drugs to discover new leads [39] [67].
Methodological Deep Dive: Core Validation Techniques
This section details the experimental protocols for the two primary validation techniques, providing a reproducible framework for researchers.
Fischer's Randomization Test
1. Protocol Objective: To statistically confirm that the correlation between chemical features and biological activity in the original model is not a product of random chance [39] [67].
2. Experimental Workflow:
- Step 1: Random Dataset Generation. The biological activity values (e.g., IC50, pIC50) associated with the training set compounds are randomly shuffled or reassigned. This process severs the genuine link between a compound's structure and its activity.
- Step 2: Pharmacophore Generation. Using these randomized datasets, new pharmacophore hypotheses are generated. This process is typically repeated many times (e.g., 19 to 99 times) to create a distribution of random models.
- Step 3: Correlation Coefficient Comparison. The correlation coefficient of the original, genuine model is compared to the distribution of coefficients from the randomized models.
- Step 4: Significance Assessment. If the original correlation coefficient lies outside the distribution (e.g., in the 95th or 99th percentile) of the randomized coefficients, the original model is deemed statistically significant and not a result of chance correlation [39] [67].
3. Key Interpretation:
- A successful test shows the original model's cost or correlation is significantly better than most (e.g., 95%) of the random models.
- Failure occurs if the original model's performance is comparable to or worse than the random models, indicating an unreliable hypothesis.
Cost Analysis
1. Protocol Objective: To quantitatively evaluate the quality and robustness of a pharmacophore hypothesis generated by algorithms like HypoGen, based on information theory and complexity [39] [67].
2. Experimental Workflow & Key Metrics: The analysis involves comparing three primary cost values:
- Total Cost: The cost of the current hypothesis.
- Null Cost: The cost of a hypothesis that assumes no relationship between features and activity, simply assigning the mean activity value to all compounds.
- Fixed Cost: The cost of a perfect hypothesis that describes the data without error.
3. Critical Interpretation and Thresholds:
- The Cost Difference (Δ): Calculated as
Null Cost - Total Cost. A larger Δ indicates a more significant model. - Configuration Cost: A measure of model complexity. A value below 17 is considered satisfactory for a robust model, as higher values can indicate over-complexity that may lead to overfitting [39].
Comparative Analysis: Fischer's Randomization vs. Cost Analysis
The table below provides a direct, data-driven comparison of these two techniques, highlighting their complementary roles.
Table 1: Objective Comparison of Fischer's Randomization and Cost Analysis
| Aspect | Fischer's Randomization Test | Cost Analysis |
|---|---|---|
| Primary Objective | Detect chance correlation [39] [67] | Select optimal model & penalize complexity [39] |
| Key Metric(s) | Statistical significance (95% confidence level) [67] | Cost difference (Δ), Configuration cost [39] |
| Typical Threshold | Original model outperforms >95% of random models [67] | Δ > 60; Config. cost < 17 [39] |
| Strengths | Provides a clear, statistical measure of significance. | Offers a direct, numerical score for model selection and comparison. |
| Limitations | Computationally intensive, requiring many iterations. | Thresholds are heuristic and may vary slightly by software and dataset. |
| Role in Combating Overfitting | Detects if a model is a product of chance (a form of overfitting). | Prevents overfitting by favoring simpler models (lower configuration cost). |
The Scientist's Toolkit: Essential Research Reagents and Software
Successful implementation of these validation protocols requires a suite of specialized software tools and computational resources.
Table 2: Key Research Reagent Solutions for Pharmacophore Validation
| Tool/Resource Name | Type | Primary Function in Validation |
|---|---|---|
| LigandScout | Software | Used for structure-based and ligand-based pharmacophore generation and validation, including Fischer's randomization [62] [18]. |
| Discovery Studio (DS) | Software | A comprehensive suite containing the HypoGen algorithm for pharmacophore generation, complete with built-in cost analysis and Fischer's randomization protocols [67] [19]. |
| DUD-E Database | Online Resource | Generates decoy molecules with similar physicochemical properties but dissimilar 2D topology to active compounds, used for rigorous validation of screening enrichment [39] [62]. |
| GOLD / Glide | Software | Molecular docking programs used in tandem with pharmacophore screening to refine hits and validate binding poses [68] [19]. |
| Protein Data Bank (PDB) | Online Database | Source for 3D protein-ligand crystal structures, which are the foundation for structure-based pharmacophore modeling [62] [18]. |
Integrated Workflow for Robust Pharmacophore Validation
The following diagram illustrates a recommended, integrated workflow that combines both techniques to ensure model robustness, from initial data preparation to a validated, screening-ready model.
Diagram 1: Integrated Pharmacophore Validation Workflow
In the high-stakes endeavor of anticancer drug discovery, relying on unvalidated computational models is a significant risk. Fischer's Randomization Test and Cost Analysis are not competing techniques but rather complementary pillars of a robust model validation strategy. Cost analysis provides an initial, quantitative filter to select a plausible and sufficiently simple hypothesis, while Fischer's test offers a rigorous, statistical defense against chance correlation.
For researchers aiming to leverage known active cancer drugs to discover novel scaffolds, employing this combined protocol is paramount. It ensures that the pharmacophore model used for virtual screening is not only predictive for the training set but is also truly generalizable, thereby increasing the probability of identifying viable lead compounds with genuine therapeutic potential. By systematically implementing these validation checks, scientists can significantly mitigate the risk of overfitting, saving valuable time and resources in the drug development pipeline.
Optimizing Feature Selection and Tolerances Based on Validation Feedback
In modern computational drug discovery, particularly within cancer research, pharmacophore models serve as essential abstract blueprints that define the steric and electronic features necessary for a molecule to interact with a specific biological target [60]. The reliability of these models, however, is entirely contingent upon rigorous validation and optimization of their two core components: feature selection (the choice of chemical features included in the model) and spatial tolerances (the allowed spatial deviation for each feature) [69]. A validated pharmacophore model must successfully discriminate between known active and inactive compounds, a capability quantitatively assessed through enrichment factors and receiver operating characteristic (ROC) analysis [69] [4]. Within oncology drug development, where targets like focal adhesion kinase 1 (FAK1), VEGFR-2, and c-Met play critical roles in tumor progression and metastasis, optimized pharmacophore models significantly accelerate the identification of novel therapeutic candidates by improving the success rate of virtual screening [10] [4]. This guide provides a comparative analysis of validation methodologies, offering experimental protocols and data to guide researchers in refining feature selection and tolerances to build highly predictive models.
Comparative Analysis of Validation Methodologies
Key Statistical Metrics for Model Validation
A pharmacophore model's performance is quantitatively evaluated using several key statistical metrics derived from its ability to screen a dataset containing known active and decoy (inactive) compounds. The most critical metrics, their definitions, and typical target values are summarized in the table below.
Table 1: Key Performance Metrics for Pharmacophore Model Validation
| Metric | Definition | Calculation Formula | Target Value |
|---|---|---|---|
| Sensitivity (Recall) | Ability to identify true actives [10]. | ( \text{(Ha / A)} \times 100 ) | Maximize |
| Enrichment Factor (EF) | Measure of screening efficiency relative to random selection [4]. | ( \text{(Ha × D) / (Ht × A)} ) | > 2.0 [4] |
| ROC-AUC | Overall ability to discriminate between active and inactive compounds [69]. | Area under the ROC curve | > 0.7 [4] |
| Goodness of Hit (GH) | Composite score balancing sensitivity and specificity [10]. | Specialized formula [10] | Closer to 1.0 |
These metrics are typically calculated using a validation set from databases like DUD-E (Directory of Useful Decoys: Enhanced), which provides confirmed active and decoy molecules for a wide range of biological targets [10] [4]. For a model to be considered reliable and fit for virtual screening, it should generally demonstrate an EF value exceeding 2 and an AUC value greater than 0.7 [4]. A study on sigma-1 receptor (σ1R) pharmacophores demonstrated that a structure-based model (5HK1–Ph.B) achieved a superior ROC-AUC above 0.8, outperforming other ligand-based models and direct docking in identifying active compounds [69].
Structure-Based vs. Ligand-Based Model Validation
The approach to feature selection and validation differs significantly depending on whether the pharmacophore is derived from a protein-ligand complex (structure-based) or a set of known active ligands (ligand-based). The table below compares these two fundamental approaches.
Table 2: Comparison of Structure-Based and Ligand-Based Pharmacophore Modeling
| Aspect | Structure-Based Approach | Ligand-Based Approach |
|---|---|---|
| Input Data | 3D structure of a protein-ligand complex (e.g., from PDB) [60]. | Set of known active ligand molecules [60]. |
| Feature Selection | Derived from key interactions between the receptor and ligand (HBD, HBA, HYD, etc.) [10] [60]. | Inferred from common chemical features and their spatial arrangement aligned across active ligands [60]. |
| Tolerance Setting | Can be informed by the flexibility of the binding site or molecular dynamics simulations [10]. | Statistically derived from the variance in feature positions across the aligned ligand set [60]. |
| Primary Validation | Screening against active/decoy sets; often supplemented by docking and MD simulations [10]. | High sensitivity and specificity in retrieving active compounds from the training set or external test sets [60]. |
| Advantage | High interpretability; does not require multiple known actives [60]. | Applicable when the 3D protein structure is unavailable [60]. |
Experimental Protocols for Validation and Optimization
Protocol 1: Structure-Based Pharmacophore Validation
This protocol is widely used, as exemplified by studies identifying novel FAK1 and VEGFR-2/c-Met inhibitors [10] [4].
- Protein-Ligand Complex Preparation: Obtain a high-resolution crystal structure of the target (e.g., from the Protein Data Bank, PDB). Prepare the structure by removing extraneous water molecules, adding missing residues and hydrogen atoms, and optimizing the structure via energy minimization [10] [4]. For FAK1 inhibitor discovery, the structure 6YOJ was used [10].
- Pharmacophore Generation and Initial Feature Selection: Using the prepared complex, generate an initial set of pharmacophore features that represent critical interactions (e.g., hydrogen bond donors/acceptors, hydrophobic regions, ionic interactions). Software like Discovery Studio or Pharmit can be used for this step [10] [4].
- Validation with Known Actives and Decoys: Compile a validation set from databases like DUD-E, containing known active and decoy compounds for your target [10] [4]. Screen this library against your initial pharmacophore model.
- Performance Calculation and Feature/Tolerance Refinement: Calculate key metrics from Table 1. If performance is unsatisfactory (e.g., EF < 2), systematically refine the model by adjusting feature selection (adding, removing, or changing feature types) and spatial tolerances. This is an iterative process to maximize the EF and AUC values [69].
- Cross-Validation with Docking and MD Simulations: The validated model is used for virtual screening. Top hits are then subjected to molecular docking to assess binding poses and affinities. Finally, promising complexes undergo molecular dynamics (MD) simulations (e.g., 100-200 ns) to evaluate complex stability and calculate binding free energies using methods like MM/PBSA, providing a final, rigorous validation of the pharmacophore's predictions [10] [4].
Protocol 2: Quantitative Model Optimization using Tolerance Intervals
This advanced statistical method ensures that feature tolerances accurately reflect the expected variability in future screening applications, thereby making the model "fit-for-future-purpose" [70].
- Data Collection from Validation Screening: Collect the scores or fit values of all compounds (both actives and decoys) from the pharmacophore screening run conducted during the initial validation phase.
- Define Acceptance Limit (λ): Set an acceptable fit value deviation based on the desired screening accuracy. This is the predefined quality limit.
- Compute Tolerance Intervals: Calculate the β-expectation tolerance interval for the fit values of the identified actives. A tolerance interval is an interval that, with a specified level of confidence (e.g., 95%), contains a specified proportion (β, e.g., 90% or 95%) of the population [70]. This interval predicts where future results are expected to lie.
- Compare to Acceptance Limits: If the computed tolerance interval falls entirely within the predefined acceptance limits, the model's feature tolerances are considered optimized and the model is deemed valid for its intended use [70]. If not, spatial tolerances for the features must be adjusted, and the validation process (steps 1-4) is repeated.
Figure 1: Pharmacophore model validation and optimization workflow.
Performance Data: Pharmacophore-Based vs. Docking-Based Screening
A benchmark study comparing Pharmacophore-Based Virtual Screening (PBVS) against Docking-Based Virtual Screening (DBVS) across eight diverse protein targets provides compelling evidence for the utility of validated pharmacophores. The study used two testing databases and multiple docking programs (DOCK, GOLD, Glide) for comparison [68].
Table 3: Benchmarking Performance of PBVS vs. DBVS
| Target Protein | PBVS Enrichment Factor | Best DBVS Enrichment Factor | Superior Method |
|---|---|---|---|
| Angiotensin Converting Enzyme (ACE) | Data from source | Data from source | PBVS [68] |
| Acetylcholinesterase (AChE) | Data from source | Data from source | PBVS [68] |
| Androgen Receptor (AR) | Data from source | Data from source | PBVS [68] |
| Dihydrofolate Reductase (DHFR) | Data from source | Data from source | PBVS [68] |
| Estrogen Receptor α (ERα) | Data from source | Data from source | PBVS [68] |
| HIV-1 Protease (HIV-pr) | Data from source | Data from source | PBVS [68] |
| Thymidine Kinase (TK) | Data from source | Data from source | PBVS [68] |
| D-alanyl-D-alanine Carboxypeptidase (DacA) | Data from source | Data from source | PBVS [68] |
The results were decisive: in 14 out of 16 virtual screening scenarios, the PBVS method demonstrated higher enrichment factors than the DBVS methods. Furthermore, the average hit rates for PBVS at retrieving actives within the top 2% and 5% of the ranked database were substantially higher, establishing it as a powerful and efficient method for drug discovery [68].
The Scientist's Toolkit: Essential Research Reagents and Software
Table 4: Key Reagents and Computational Tools for Pharmacophore Modeling and Validation
| Tool / Reagent | Type | Primary Function in Validation |
|---|---|---|
| Protein Data Bank (PDB) | Database | Source of 3D protein structures for structure-based pharmacophore modeling [10] [4]. |
| DUD-E Database | Database | Provides curated sets of known active and decoy molecules for validation and calculation of EF and AUC [10] [4]. |
| ZINC / ChemDiv | Compound Database | Large collections of commercially available small molecules for virtual screening after model validation [10] [4]. |
| Discovery Studio | Software Suite | Used for protein preparation, pharmacophore generation, model validation, and analysis of screening results [69] [4]. |
| Pharmit | Online Tool | Web-based platform for structure-based pharmacophore modeling and virtual screening [10]. |
| GROMACS | Software | Performs Molecular Dynamics (MD) simulations to validate the stability of protein-ligand complexes predicted by the pharmacophore [10]. |
| AutoDock Vina / Glide | Software | Molecular docking programs used to refine hit lists from pharmacophore screening and predict binding poses and affinities [10] [68]. |
| β-Expectation Tolerance Interval | Statistical Method | A advanced statistical tool for setting and validating acceptance criteria for feature tolerances based on prediction of future performance [70]. |
Figure 2: Key cancer drug targets for pharmacophore modeling.
Incorporating Molecular Dynamics for Dynamic Pharmacophore Validation
In modern computational drug discovery, pharmacophore modeling serves as an essential blueprint for identifying potential therapeutic compounds by mapping the essential steric and electronic features necessary for molecular recognition by a biological target [41]. Traditionally, these models have been derived from static crystal structures of protein-ligand complexes, providing valuable but limited snapshots of binding interactions. The incorporation of Molecular Dynamics (MD) simulations represents a paradigm shift, enabling the development of dynamically-refined pharmacophore models that account for protein flexibility, solvation effects, and the true conformational heterogeneity of binding sites [41] [71]. Within cancer drug discovery, where targeting specific oncogenic proteins with precision is critical, this advanced approach offers a more physiologically relevant framework for validating pharmacophore models against known active cancer drugs, ultimately improving the success rate of virtual screening campaigns for novel oncology therapeutics.
Comparative Analysis: Static vs. Dynamic Pharmacophore Validation
Fundamental Differences and Methodological Advancements
The core distinction between traditional and MD-refined approaches lies in their treatment of molecular motion. Static models from crystal structures risk overinterpreting non-physiological crystal contacts and lack information on binding site dynamics [41]. MD simulations address this by sampling the protein-ligand conformational space over time, typically on nanosecond timescales, allowing researchers to observe transient but pharmacologically relevant interactions that would be absent in a single crystal structure [41]. This is particularly crucial for cancer drug targets like protein kinases, which often exhibit significant conformational flexibility in regions like the DFG-loop that dramatically affect inhibitor binding [41].
Quantitative Performance Comparison
Recent studies provide quantitative evidence for the enhanced performance of MD-refined pharmacophore models. The following table summarizes key validation metrics from comparative analyses:
Table 1: Performance Metrics of Static vs. MD-Refined Pharmacophore Models
| Validation Metric | Static Model (Crystal Structure) | MD-Refined Model | Biological System | Citation |
|---|---|---|---|---|
| AUC (ROC Analysis) | Variable (Baseline) | Up to 0.98 (Excellent) | XIAP Protein [17] | |
| Early Enrichment Factor (EF1%) | Not Specified | 10.0 | XIAP Protein [17] | |
| Feature Consistency | Fixed | Dynamically sampled and refined | Multiple Systems [41] | |
| Ability to Distinguish Actives | Moderate | Significantly Improved in Multiple Cases | FKBP12, Abl kinase, c-Src, HSP90-alpha [41] |
MD-refined models demonstrate superior capability in distinguishing true active compounds from decoys, a critical function for successful virtual screening. For the XIAP protein, a cancer therapeutic target, the MD-refined approach achieved an exceptional area under the curve (AUC) value of 0.98 in receiver operating characteristic (ROC) analysis, along with an early enrichment factor of 10.0 at the 1% threshold [17]. This indicates a highly effective model for identifying true positive hits. A separate comparative study on multiple protein systems, including FKBP12, Abl kinase, c-Src, and HSP90-alpha, further confirmed that pharmacophore models derived from the final frames of MD simulations often show improved ability to distinguish between active and decoy compounds compared to their crystal structure-derived counterparts [41].
Experimental Protocols for Dynamic Pharmacophore Validation
Integrated Workflow for Model Generation and Validation
A typical protocol for creating and validating dynamic pharmacophores integrates both structural informatics and simulation approaches, forming a comprehensive pipeline for cancer drug discovery.
Figure 1: Experimental Workflow for Dynamic Pharmacophore Development
Key Methodological Steps
1. Initial System Preparation: The process begins with a high-resolution crystal structure of the target protein in complex with a known active ligand, typically obtained from the Protein Data Bank (PDB). For example, studies targeting FAK1 for pancreatic cancer used PDB ID 3BZ3 [72], while XIAP-related cancer research utilized PDB ID 5OQW [17]. The protein structure is prepared by adding hydrogen atoms, assigning proper bond orders, optimizing hydrogen bonding networks, and performing energy minimization using force fields like OPLS_2005 or MMFF94 [73] [17].
2. Molecular Dynamics Simulation: The prepared protein-ligand complex is solvated in an explicit water model (e.g., TIP3P) within a periodic boundary box, neutralized with counterions, and brought to physiological salt concentration (e.g., 0.15 M NaCl). Simulations are performed using software such as Desmond [73] under conditions mimicking the biological environment (NPT ensemble, 300 K, 1 atm). Simulation times typically range from 20 ns for initial refinement [41] to 100-200 ns for more robust sampling [73] [17].
3. Trajectory Analysis and Feature Mapping: The MD trajectory is analyzed to identify stable binding modes and observe transient interactions. The final simulation frame or a representative cluster of frames is used to generate the refined pharmacophore model using programs like LigandScout [17] or Schrodinger's Phase [41]. This step captures dynamic features such as water-mediated hydrogen bonds, rearranged hydrophobic patches, and flexible hydrogen bond donors/acceptors that are absent in the static structure.
4. Model Validation and Virtual Screening: The refined pharmacophore model is rigorously validated using receiver operating characteristic (ROC) curves and enrichment factor (EF) calculations against datasets containing known active compounds and decoys from databases like DUD-E [41] [17]. Successful models are then employed as 3D search queries for virtual screening of large compound databases (e.g., ZINC, ChemDiv, Enamine) to identify novel hit compounds with complementary features [73] [17].
The Scientist's Toolkit: Essential Research Reagents and Computational Solutions
Successful implementation of dynamic pharmacophore validation requires a suite of specialized software tools and databases. The following table catalogs key resources referenced in recent literature.
Table 2: Essential Research Tools for Dynamic Pharmacophore Analysis
| Tool/Resource | Type | Primary Function | Application Example |
|---|---|---|---|
| LigandScout | Software | Structure-based pharmacophore generation & visualization | Identification of XIAP inhibitors [17] |
| Desmond | Software | Molecular Dynamics Simulation System | Stability analysis of EGFR complexes [73] |
| Schrödinger Suite | Software Platform | Integrated environment for protein prep, docking, MD, and pharmacophore modeling | FGFR1 inhibitor discovery [28] |
| DUD-E Database | Database | Curated decoy sets for virtual screening validation | Pharmacophore model validation for XIAP [17] |
| ZINC Database | Database | Commercially available compounds for virtual screening | Natural compound screening for XIAP [17] |
| Pharmit Server | Web Service | Online pharmacophore-based virtual screening | EGFR inhibitor discovery [73] |
| Protein Data Bank | Database | Repository for 3D structural data of proteins and nucleic acids | Source of initial structures (e.g., 3BZ3, 5OQW) [72] [17] |
| OPLS_2005/AA | Force Field | Molecular mechanics parameter set for energy calculations | Geometry optimization and MD simulations [73] |
The integration of Molecular Dynamics simulations into pharmacophore validation represents a significant advancement over traditional static approaches, particularly in the complex landscape of cancer drug discovery. By accounting for protein flexibility, solvation effects, and the dynamic nature of binding interactions, MD-refined models provide a more physiologically relevant framework for identifying and optimizing therapeutic compounds. The quantitative improvements in validation metrics, including enhanced ROC curves and enrichment factors, demonstrate the tangible benefits of this approach for virtual screening campaigns targeting oncogenic proteins. As MD simulations become increasingly accessible through improved hardware and software solutions, their incorporation into standard pharmacophore modeling workflows promises to accelerate the discovery of novel, effective cancer therapeutics with optimized binding characteristics and improved selectivity profiles.
Utilizing MM-GBSA Calculations to Correlate with Experimental Binding Data
Within structure-based drug design, the validation of pharmacophore models against known active compounds represents a critical step in ensuring predictive accuracy. Molecular Mechanics with Generalized Born and Surface Area (MM-GBSA) has emerged as a pivotal computational technique that bridges the gap between initial pharmacophore screening and experimental confirmation [16]. This method offers a theoretically rigorous yet computationally efficient approach to estimate binding free energies, providing a quantitative framework for validating hypothesized molecular interactions [74] [75]. In the context of cancer drug research, where pharmacophore models frequently target specific oncogenic proteins, MM-GBSA serves as an essential validation tool that correlates computational predictions with experimental binding data, thereby strengthening the confidence in identified lead compounds before undertaking costly synthetic and biological testing.
The fundamental strength of MM-GBSA lies in its end-point binding free energy calculation approach, which positions it intermediate in both accuracy and computational effort between empirical scoring functions and strict alchemical perturbation methods [74]. For research focused on validating pharmacophore models with known active cancer drugs, this balance enables researchers to process multiple candidate compounds efficiently while maintaining a reasonable degree of predictive accuracy for binding affinities.
Theoretical Foundations and Methodological Framework
Computational Basis of MM-GBSA
The MM-GBSA method estimates the binding free energy (ΔGbind) of a ligand-receptor complex using the thermodynamic relationship derived from molecular mechanics principles [74]. The fundamental equation calculates the free energy difference between the bound complex and the separated receptor and ligand in solvent:
ΔGbind = Gcomplex - (Greceptor + Gligand) [74]
Each free energy term is decomposed into multiple components:
G = EMM + Gsolv - TS [74]
Where:
- EMM represents the molecular mechanics energy in vacuum, including bonded (bond, angle, dihedral) and non-bonded (electrostatic and van der Waals) interactions
- Gsolv constitutes the solvation free energy, further separated into polar (Gpol) and non-polar (Gnp) contributions
- TS accounts for the conformational entropy, typically estimated through normal-mode analysis [74]
The polar solvation term (Gpol) is calculated using the Generalized Born (GB) model, which approximates the electrostatic solvation energy, while the non-polar component (Gnp) is typically estimated from the solvent accessible surface area (SASA) [74] [75]. This modular decomposition allows researchers to identify which energy components drive binding for specific ligand-receptor complexes, providing insights beyond a single binding affinity number.
Practical Implementation Approaches
Two primary sampling strategies exist for MM-GBSA calculations in practical drug discovery applications:
Single Conformation Approach: Based on minimized structures or docking poses without extensive sampling [74] [75]. This method offers computational efficiency for high-throughput assessment of ligand binding affinities at the expense of neglecting dynamical effects.
Ensemble Approach: Utilizes molecular dynamics (MD) trajectories to account for system flexibility and collect ensemble averages over multiple snapshots [74] [75]. While computationally more intensive, this approach generally provides more reliable estimates by incorporating conformational sampling.
Most implementations employ the "one-average" (1A-MM/GBSA) method, where only the complex is simulated and the unbound receptor and ligand are generated by molecular separation [74]. This approach improves precision through cancellation of the bonded energy term but may overlook structural changes upon binding. The alternative "three-average" (3A-MM/GBSA) method uses separate simulations for the complex, free receptor, and free ligand, but suffers from significantly larger statistical uncertainty [74].
Performance Assessment: Correlation with Experimental Data
Quantitative Correlation Across Cancer Targets
Multiple studies in cancer drug discovery have demonstrated MM-GBSA's ability to correlate computational predictions with experimental binding data across diverse therapeutic targets. The table below summarizes key findings from recent investigations:
Table 1: MM-GBSA Performance in Correlating with Experimental Binding Data for Cancer Targets
| Target Protein | Cancer Type | Number of Compounds | Correlation Strength | Reference |
|---|---|---|---|---|
| Brd4 | Neuroblastoma | 4 natural compounds | Stable binding confirmed by MD simulation & MM-GBSA | [16] |
| Pin1 | Multiple cancers | 3 phytochemicals | Better binding energies vs reference ligand | [76] |
| ASK1 | Stress-related cancers | 3 natural compounds | Superior docking scores & binding energies | [77] |
| PI3Kγ | Breast cancer, hematological malignancies | 1j derivative | Strong binding affinity confirmed | [78] |
| Kinesin spindle protein | Multiple cancers | 4-aminoquinoline hybrids | Promising Eg5 inhibitory activity | [79] |
In the context of Brd4 inhibition for neuroblastoma treatment, MM-GBSA calculations confirmed the stability of four identified natural compounds (ZINC2509501, ZINC2566088, ZINC1615112, and ZINC4104882) through molecular dynamics simulations, with binding free energy calculations supporting their potential as inhibitors [16]. Similarly, for Pin1 inhibitors, three phytochemicals (SN0021307, SN0449787, and SN0079231) demonstrated superior binding free energies (-57.12, -49.81, and -46.05 kcal/mol, respectively) compared to the reference ligand (-37.75 kcal/mol), correlating with their enhanced docking scores [76].
Comparative Performance Against Other Methods
MM-GBSA occupies a strategic position in the hierarchy of binding affinity prediction methods, balancing accuracy with computational expense. The table below compares its performance against alternative approaches:
Table 2: Method Comparison for Binding Affinity Prediction
| Method | Theoretical Rigor | Computational Cost | Typical Applications | Limitations |
|---|---|---|---|---|
| Docking Scoring | Empirical | Low | Virtual screening, pose prediction | Limited accuracy, rigid receptor approximation [80] |
| MM-GBSA | End-point with implicit solvation | Medium | Binding affinity estimation, lead optimization | Conformational entropy approximation [74] [75] |
| MM-PBSA | End-point with Poisson-Boltzmann | Medium-High | Binding affinity estimation | Higher computational cost than GB [74] |
| Free Energy Perturbation (FEP) | Alchemical pathway | High | Lead optimization, accurate relative binding | Extensive sampling required [80] |
When compared to molecular docking scores, MM-GBSA generally provides more reliable correlation with experimental binding data. As noted in studies of protein kinase inhibitors, the combination of molecular dynamics simulations, hydrogen bond network-based frame selection, and MM-GBSA provided "better statistical correlations against experimental binding data than previous similar reported studies" [81]. This enhanced performance stems from MM-GBSA's more physically realistic treatment of solvation effects and van der Waals interactions compared to empirical docking scoring functions.
Experimental Protocols and Methodologies
Standard MM-GBSA Implementation Protocol
A typical MM-GBSA workflow for validating pharmacophore models against known active cancer drugs involves these key stages:
System Preparation
- Obtain 3D structures of receptor-ligand complexes from crystallography, docking, or pharmacophore modeling
- Prepare protein structures by removing water molecules, adding hydrogen atoms, and assigning proper bond orders [76]
- Optimize ligand geometries using computational methods (e.g., density functional theory) [78]
Molecular Dynamics Sampling
Frame Selection and Energy Calculation
- Extract snapshots from equilibrated MD trajectories at regular intervals
- Optionally apply frame selection criteria (e.g., hydrogen bond network analysis) to improve correlation [81]
- Calculate energy components using molecular mechanics forcefields and GB solvation models
Binding Free Energy Analysis
- Compute average binding free energies across the ensemble of snapshots
- Decompose energy contributions to identify key binding interactions
- Correlate computed ΔG values with experimental binding data (IC50, Ki)
For specific cancer targets like PI3K, researchers have employed the Prime MM-GBSA algorithm using docked poses retrieved from Glide docking to calculate binding free energies of potential inhibitors [78]. This integrated approach facilitates efficient screening of compound libraries against cancer-relevant targets.
Protocol Variations and Optimization Strategies
Research indicates that specific methodological adjustments can enhance MM-GBSA's correlation with experimental data:
Frame Selection Techniques: Implementing hydrogen bond network-based frame selection from MD trajectories significantly improved correlations for protein kinase inhibitors compared to using all frames [81]
Solvation Model Selection: Variants like VD-MM/GBSA employ residue-type-dependent dielectric constants instead of a fixed value, better modeling polar/non-polar environmental differences [82]
Sampling Approaches: While ensemble approaches generally outperform single-conformation calculations, studies show that careful minimization of multiple starting structures can sometimes yield comparable results to full MD sampling [74]
For protein-protein complexes relevant to cancer signaling pathways, specialized implementations like HawkDock's online MM/GBSA server offer optimized parameters for protein-protein binding free energy calculations, utilizing the GBOBC1 model for generalized Born calculations and ff02 forcefield for molecular mechanics terms [82].
Case Studies in Cancer Drug Discovery
BRD4 Inhibition for Neuroblastoma Therapy
In targeting BRD4 for neuroblastoma treatment, researchers employed an integrated computational approach where pharmacophore modeling initially identified 136 natural compounds, which were subsequently filtered through molecular docking, ADMET analysis, and toxicity assessment [16]. The four final candidates demonstrated stable binding patterns throughout 100 ns molecular dynamics simulations, with MM-GBSA calculations confirming favorable binding free energies. This comprehensive workflow, incorporating MM-GBSA as a critical validation step, identified natural compounds (ZINC2509501, ZINC2566088, ZINC1615112, and ZINC4104882) as promising BRD4 inhibitors with potential therapeutic efficacy against MYCN-amplified neuroblastoma [16].
Pin1-Targeted Cancer Therapeutics
The validation of phytochemicals as Pin1 inhibitors exemplifies MM-GBSA's role in prioritizing compounds from virtual screening. From 449,008 natural products in the SN3 database, structure-based pharmacophore modeling identified 650 candidates sharing pharmacophoric features with native ligands [76]. Subsequent molecular docking and MM-GBSA calculations revealed three compounds (SN0021307, SN0449787, and SN0079231) with superior docking scores (-9.891, -7.579, and -7.097 kcal/mol, respectively) and binding free energies (-57.12, -49.81, and -46.05 kcal/mol) compared to the reference compound [76]. Molecular dynamics simulations further confirmed the stability of these ligand-receptor complexes, with RMSD values ranging from 0.6 to 1.8 Å over 100 ns simulations [76].
Table 3: Essential Research Resources for MM-GBSA Implementation
| Resource Category | Specific Tools | Primary Function | Application Context |
|---|---|---|---|
| Molecular Dynamics | Desmond, AMBER, GROMACS | Conformational sampling | Generating ensemble trajectories for MM-GBSA [76] |
| Binding Energy Calculation | Schrodinger Prime MM-GBSA, HawkDock, MMPBSA.py | Free energy estimation | Calculating binding affinities from structures/MD trajectories [78] [82] |
| Structure Preparation | Protein Preparation Wizard, AutoDockTools | System setup | Adding hydrogens, assigning charges, optimizing H-bonding [78] [76] |
| Visualization & Analysis | Maestro, PyMOL, VMD | Result interpretation | Analyzing binding modes, interaction patterns, and energy decomposition |
| Specialized Platforms | Flare MM/GBSA | Integrated workflow | Complete implementation from single conformations or dynamics trajectories [75] |
Signaling Pathways and Workflow Visualization
Diagram 1: Integrated workflow for pharmacophore validation using MM-GBSA in cancer drug discovery. The process begins with target identification and progresses through computational stages (green), sampling and energy calculation (blue), and experimental correlation (red).
Diagram 2: Cancer signaling pathways targeted in MM-GBSA validation studies. Key targets (green) include Brd4, Pin1, ASK1, and PI3K, which regulate critical oncogenic processes (blue) leading to cancer cell death (red).
Limitations and Strategic Considerations
Despite its utility in correlating with experimental binding data, MM-GBSA presents several limitations that researchers must consider:
Conformational Entropy: The method typically employs crude approximations for entropy contributions, often neglecting the conformational entropy term altogether [74]
Solvation Treatment: Implicit solvent models may inadequately represent specific water molecules that mediate binding interactions in active sites [74]
Sampling Limitations: Like other end-point methods, MM-GBSA may suffer from insufficient conformational sampling, particularly for large-scale receptor flexibility [74]
System-Dependent Performance: Accuracy varies significantly across different protein-ligand systems, with some studies reporting deteriorated results when incorporating more rigorous theoretical components [74]
Cancellation of Errors: The method's performance partly relies on error cancellation between similar systems, making absolute binding free energy predictions challenging [74]
These limitations necessitate careful interpretation of MM-GBSA results within the context of specific research objectives. For pharmacophore validation against known active cancer drugs, MM-GBSA serves best as a prioritization tool rather than a definitive predictor of absolute binding affinities.
MM-GBSA calculations provide a valuable intermediary approach for correlating computational predictions with experimental binding data in cancer drug discovery. When integrated into a comprehensive workflow that includes pharmacophore modeling, molecular docking, and molecular dynamics simulations, MM-GBSA significantly enhances the validation of potential therapeutic compounds targeting oncogenic proteins. The method's balance between computational efficiency and theoretical rigor makes it particularly suited for prioritizing compounds for experimental testing, thereby accelerating the identification of novel cancer therapeutics. As computational resources advance and methodologies refine, MM-GBSA continues to offer a robust framework for strengthening the correlation between in silico predictions and experimental outcomes in structure-based drug design for oncology applications.
Proving Utility: From Statistical Metrics to Real-World Predictive Success
Comparative Analysis of Different Validation Methods
In the field of computer-aided drug discovery, pharmacophore models are indispensable tools that abstract the essential steric and electronic features a molecule must possess to interact with a specific biological target. The predictive power and reliability of these models are paramount, particularly in high-stakes areas such as cancer therapeutics research, where they guide the virtual screening of large compound libraries to identify novel drug candidates [83]. Consequently, the validation of pharmacophore models—the process of assessing their ability to correctly identify active compounds and reject inactive ones—is a critical step that determines their utility in a successful drug discovery campaign. This guide provides a comparative analysis of the primary validation methods, offering researchers a framework to evaluate and select the most appropriate strategies for ensuring the robustness of their pharmacophore models within the context of cancer drug research.
Several established methodologies exist to theoretically validate a pharmacophore model before it is employed for prospective virtual screening. Each method probes a different aspect of the model's quality and predictive power.
Decoy Set Validation (Enrichment Studies): This method evaluates a model's ability to discriminate between known active compounds and presumed inactives (decoys) within a database. The model is used to screen a dataset containing both actives and decoys. Its performance is quantified using metrics such as the Enrichment Factor (EF), which measures the concentration of actives in the hit list compared to a random selection, and the Area Under the Curve (AUC) of the Receiver Operating Characteristic (ROC) curve, which summarizes the trade-off between true positive and false positive rates across all thresholds [16] [39] [17]. An AUC of 1.0 represents a perfect model, while a model with no discriminatory power has an AUC of 0.5 [16].
Test Set Validation: This approach assesses the model's predictive accuracy on a set of compounds that were not used during the model's generation (the training set). The predicted activities for the test set compounds are compared to their experimental activities. The predictive power is often reported as the coefficient of determination for the test set (R²pred) and the root-mean-square error (RMSE) between predicted and observed values [39] [19]. An R²pred value greater than 0.5 is generally considered acceptable [39].
Fisher's Randomization Test: This is a statistical method used to rule out the possibility that a good model was obtained by chance. The biological activity data of the training set compounds are randomly shuffled, and new models are generated based on this randomized data. This process is repeated many times to create a distribution of random models. The original model is considered statistically significant if its performance metrics are substantially better than those of the models derived from randomized data [39].
Cost Analysis: Implemented in software like Catalyst/Hypogen, this method evaluates the model based on three cost components: weight cost, error cost, and configuration cost. A robust model should have a high total cost difference (≥ 60 bits) between the generated hypothesis and the null hypothesis (which assumes no relationship between features and activity), and a configuration cost below 17 [39].
Table 1: Summary of Key Pharmacophore Validation Methods
| Validation Method | Primary Objective | Key Metrics | Interpretation of a Good Model |
|---|---|---|---|
| Decoy Set Validation | Assess ability to distinguish actives from inactives | Enrichment Factor (EF), AUC of ROC curve | High EF (e.g., >10-30 at 1% threshold), AUC > 0.7 (Excellent if > 0.9) [16] [17] |
| Test Set Validation | Evaluate predictive accuracy on unseen data | R²pred, RMSE | R²pred > 0.5, low RMSE [39] |
| Fisher's Randomization | Ensure model is not a result of chance correlation | Significance level (e.g., 95%) | The original model's cost/performance is significantly better than randomized models [39] |
| Cost Analysis | Evaluate the statistical robustness of the hypothesis | Total Cost, ΔCost (Null-Cost), Configuration Cost | ΔCost ≥ 60 bits, Configuration Cost < 17 [39] |
Comparative Analysis of Methodologies
A comparative analysis reveals that each validation method has distinct strengths and limitations, making them suited for different phases of the model development and evaluation cycle. The following workflow illustrates a typical pharmacophore validation process integrating these methods.
The diagram above shows a logical progression for rigorously validating a pharmacophore model. Initially, internal and cost analysis provide a fundamental check for obvious overfitting and statistical soundness [39]. Following this, decoy set validation is crucial as it directly tests the model's practical utility in virtual screening by measuring its ability to enrich true actives from a background of decoys [16] [17]. A model failing here may lack the specificity needed for efficient database screening. Subsequently, test set validation evaluates the model's generalizability and predictive power for novel chemotypes not included in the training set [39] [19]. Finally, Fisher's randomization test provides a critical statistical confidence check, ensuring the model captures a true structure-activity relationship rather than a random correlation [39].
No single method is sufficient on its own. For instance, a model might perform well on a test set but poorly in a decoy study if it is overly specific to the chemical scaffolds in its training and test sets. Conversely, a model with high enrichment might have mediocre predictive R² for specific activity values. Therefore, a combination of these methods is considered best practice to gain comprehensive insight into a model's strengths and weaknesses [84] [39].
Experimental Data and Case Studies
The application of these validation methods in real-world research underscores their importance. For example, a study aimed at identifying novel inhibitors for the Brd4 protein in neuroblastoma generated a structure-based pharmacophore model. The model was validated using a decoy set from the DUD-E database, which contained 36 active compounds and their corresponding decoys. The validation results were exceptional, showing an AUC of 1.0 for the ROC curve, indicating perfect separation of actives from decoys under the test conditions. The enrichment factor also ranged from 11.4 to 13.1, confirming the model's high ability to identify active compounds [16].
In another study targeting the XIAP protein for cancer therapy, researchers also employed decoy set validation. The model achieved an excellent AUC value of 0.98 with an early enrichment factor (EF1%) of 10.0. This high AUC value close to 1.0 proved the model's strong capability to distinguish true actives from decoy compounds, giving the researchers confidence to proceed with virtual screening [17].
A comparative study that analyzed 44 reported QSAR models highlighted the limitations of relying on a single metric. It found that using the coefficient of determination (r²) alone was insufficient to confirm the validity of a model for predicting the activity of new compounds. The study concluded that the established criteria for external validation have their own advantages and disadvantages, and that these methods alone are not always enough to definitively indicate the validity of a QSAR model, emphasizing the need for a multi-faceted validation strategy [84].
Table 2: Representative Validation Metrics from Cancer Drug Discovery Studies
| Target Protein | Therapeutic Context | Validation Method Used | Reported Metric | Outcome |
|---|---|---|---|---|
| Brd4 [16] | Neuroblastoma | Decoy Set (DUD-E) | AUC = 1.0; EF = 11.4 - 13.1 | Excellent discriminatory power |
| XIAP [17] | Hepatocellular Carcinoma | Decoy Set (DUD-E) | AUC = 0.98; EF1% = 10.0 | Excellent discriminatory power |
| FAK1 [10] | Cancer Metastasis | Decoy Set (DUD-E) | Sensitivity, Specificity, EF, GH | Model selected based on best overall stats |
| Akt2 [19] | Various Cancers | Test Set & Decoy Set | R²pred, EF | Confirmed predictive power and enrichment |
The Scientist's Toolkit: Essential Research Reagents and Materials
The experimental protocols for pharmacophore validation rely on specific computational tools and databases. The following table details key resources that are integral to the methods described in this guide.
Table 3: Key Research Reagent Solutions for Pharmacophore Validation
| Resource Name | Type | Primary Function in Validation | Relevance to Cancer Research |
|---|---|---|---|
| DUD-E [16] [17] [10] | Database | Provides benchmark decoy sets for specific targets to calculate EF and AUC. | Contains decoys for many oncology targets (e.g., FAK1, XIAP, Brd4). |
| ZINC Database [16] [17] [10] | Compound Library | A source of commercially available compounds for virtual screening after validation. | Includes natural product libraries screened for anti-cancer activity [17]. |
| LigandScout [16] [17] | Software | Used for structure-based and ligand-based pharmacophore generation and validation. | Employed to create models for targets like Brd4 and XIAP in neuroblastoma and liver cancer [16] [17]. |
| ChEMBL Database [16] [17] [85] | Bioactivity Database | Source of experimentally known active compounds to build test/active sets for validation. | Provides curated IC50/Ki data for a vast number of cancer-related targets. |
| Pharmit [10] | Web Tool | Facilitates structure-based pharmacophore modeling and validation via online screening. | Used in recent (2025) studies to identify novel FAK1 inhibitors for cancer therapy [10]. |
The rigorous and multi-faceted validation of pharmacophore models is a non-negotiable step in modern, computational-driven cancer drug discovery. As this comparative analysis demonstrates, methods such as decoy set validation, test set prediction, Fisher's randomization, and cost analysis each provide unique and complementary insights into a model's predictive power, robustness, and statistical significance. Relying on any single method is insufficient; a synergistic approach that leverages the strengths of multiple techniques is essential to build confidence in a model before it is deployed to screen millions of compounds. By adhering to this comprehensive validation framework and utilizing the curated toolkit of databases and software, researchers can effectively triage pharmacophore models, thereby accelerating the identification of novel, potent, and selective anti-cancer agents while minimizing the risk of costly experimental follow-up on false leads.
Benchmarking Performance Against Clinically Approved Cancer Drugs
The development of new cancer therapeutics is a complex, costly, and time-consuming process. A critical step in this journey is the rigorous computational validation of candidate compounds against established clinical benchmarks. This guide provides a structured framework for benchmarking the performance of novel pharmacophore models and the drug candidates they identify against clinically approved cancer drugs. By employing standardized computational protocols and comparing results to the known binding affinities, efficacy endpoints, and safety profiles of approved therapeutics, researchers can better prioritize candidates for further experimental development, thereby increasing the efficiency of the drug discovery pipeline.
Performance Benchmarking Tables
Benchmarking Against Recently Approved FDA Drugs (2023)
The following table benchmarks the types of efficacy endpoints and approval designations used for 2023 FDA-approved anticancer drugs, providing a real-world context for evaluating the potential of novel discoveries [86].
Table 1: Clinical Endpoints and Designations for Select 2023 FDA-Approved Anticancer Drugs
| Drug Name | Indication | Key Efficacy Endpoints in Pivotal Trials | FDA Review & Designations |
|---|---|---|---|
| Nirogacestat | Progressing desmoid tumours | PFS, ORR | Priority Review, Breakthrough Therapy, Fast Track, Orphan Drug |
| Capivasertib | Breast Cancer | PFS | Priority Review |
| Repotrectinib | ROS1-positive NSCLC | ORR, DOR | Priority Review, Breakthrough Therapy, Fast Track |
| Fruquintinib | Metastatic Colorectal Cancer | OS | Priority Review |
| Elacestrant | ER+, HER2-, ESR1-mutated Breast Cancer | PFS | Priority Review, Fast Track |
| Toripalimab-tpzi | Recurrent/Metastatic Nasopharyngeal Carcinoma | PFS, OS | Priority Review, Breakthrough Therapy, Orphan Drug |
Abbreviations: PFS (Progression-Free Survival), ORR (Overall Response Rate), DOR (Duration of Response), OS (Overall Survival).
Computational Benchmarking of Novel FAK1 Inhibitors
This table summarizes the results of a computational study that identified novel Focal Adhesion Kinase 1 (FAK1) inhibitors, showcasing the key metrics used to benchmark these candidates against a known ligand, P4N [10].
Table 2: Computational Benchmarking of Novel FAK1 Inhibitor Candidates
| Compound ID (ZINC) | Key Computational Metrics vs. Reference Ligand (P4N) | Proposed Experimental Benchmark |
|---|---|---|
| ZINC23845603 | Strong binding energy in MM/PBSA calculations; similar interaction profile to P4N; favorable pharmacokinetic profile. | Defactinib, GSK2256098 (Clinical phase FAK1 inhibitors) |
| ZINC44851809 | Acceptable pharmacokinetic properties; low predicted toxicity; stable in MD simulations. | Defactinib |
| ZINC266691666 | Stable behavior in Molecular Dynamics (MD) simulations; favorable binding energy. | Defactinib |
| ZINC20267780 | Selected from pharmacophore screening; stable in MD simulations. | Defactinib |
Experimental Protocols for Validation
To generate comparable and reliable benchmarking data, adherence to detailed experimental protocols is essential. The following methodologies are widely used in computational drug discovery.
Structure-Based Pharmacophore Modeling and Validation
- Objective: To create a predictive model of the essential structural features a molecule must possess to bind to a target protein [10].
- Protocol:
- Structure Preparation: Obtain a high-resolution co-crystal structure of the target protein with a bound ligand from the Protein Data Bank (e.g., FAK1 with P4N, PDB: 6YOJ). Model any missing loops using software like MODELLER [10].
- Pharmacophore Generation: Use a tool like Pharmit to identify critical interaction features (e.g., hydrogen bond donors/acceptors, hydrophobic regions) from the protein-ligand complex. Generate multiple candidate pharmacophore models [10].
- Model Validation: Validate the models using a set of known active compounds and decoys (non-binders) from a database like DUD-E. Calculate statistical metrics such as sensitivity, specificity, and enrichment factor (EF) to select the model with the highest predictive power [10].
- Virtual Screening: Employ the validated pharmacophore model to screen large chemical databases (e.g., ZINC) to identify potential novel inhibitors [10].
Molecular Docking and Binding Affinity Assessment
- Objective: To predict the binding orientation and approximate affinity of a small molecule within a protein's binding site.
- Protocol:
- Ligand and Protein Preparation: Prepare the 3D structures of the target protein and candidate ligands, assigning correct bond orders, protonation states, and charges.
- Docking Simulation: Perform docking using programs such as AutoDock Vina (via PyRx) or SwissDock. Define the search space to encompass the entire binding site of interest [10] [87].
- Pose Analysis and Scoring: Analyze the top-scoring docking poses for key interactions with functionally important residues (e.g., formation of hydrogen bonds, hydrophobic contacts, pi-stacking). Compare these interaction patterns to those of the native ligand or clinically approved drugs [10].
Molecular Dynamics (MD) Simulations and Free Energy Calculations
- Objective: To assess the stability of the protein-ligand complex and compute the binding free energy with high accuracy, going beyond the static picture provided by docking.
- Protocol:
- System Setup: Place the docked protein-ligand complex in a solvation box (e.g., TIP3P water model) and add ions to neutralize the system's charge [10] [87].
- Simulation Run: Perform MD simulations using software like GROMACS with a suitable force field (e.g., AMBER99SB-ILDN). A typical simulation involves energy minimization, equilibration, and a production run of at least 15-100 nanoseconds at constant temperature (298.15 K) and pressure (1 bar) [10] [87].
- Stability and Trajectory Analysis: Calculate the Root Mean Square Deviation (RMSD) of the protein and ligand to evaluate complex stability over time. Analyze frames to understand the dynamic binding process [87].
- Binding Free Energy Calculation: Use the Molecular Mechanics/Poisson-Boltzmann Surface Area (MM/PBSA) method on simulation snapshots to compute the binding free energy. This provides a more reliable estimate of binding affinity than docking scores alone and allows for direct ranking against known inhibitors [10].
Signaling Pathways and Experimental Workflows
FAK1 Signaling Pathway in Cancer Metastasis
The diagram below illustrates the central role of Focal Adhesion Kinase 1 (FAK1) in promoting cancer cell survival and migration, explaining why it is a prominent target for benchmarking inhibitors [10].
Workflow for Computational Benchmarking
This workflow outlines the integrated computational approach for identifying and benchmarking novel drug candidates, from initial modeling to final prioritization [10] [87].
The Scientist's Toolkit: Research Reagent Solutions
Table 3: Essential Reagents and Software for Computational Benchmarking
| Reagent / Software Solution | Function in the Workflow |
|---|---|
| Protein Data Bank (PDB) | Primary repository for 3D structural data of proteins and nucleic acids, providing the starting point (e.g., PDB ID: 6YOJ) for structure-based studies [10]. |
| ZINC/DUDE-E Databases | ZINC is a public database of commercially available compounds for virtual screening. DUD-E provides benchmark sets of known actives and decoys for validating virtual screening methods [10]. |
| Pharmit | Web-based tool for creating structure-based pharmacophore models and performing interactive virtual screening [10]. |
| AutoDock Vina / PyRx | Widely used, open-source molecular docking software for predicting ligand poses and scoring binding affinities [10]. |
| GROMACS | High-performance, open-source software package for performing Molecular Dynamics (MD) simulations and subsequent analysis [10] [87]. |
| AMBER99SB-ILDN Force Field | A highly regarded force field within GROMACS for simulating protein dynamics and protein-ligand interactions [87]. |
| MM/PBSA Method | A post-processing method applied to MD trajectories to calculate binding free energies, offering a good balance between accuracy and computational cost [10]. |
Assessing Model Specificity and Sensitivity with Diverse Compound Libraries
Within modern computational drug discovery, particularly in the urgent search for new cancer therapeutics, pharmacophore models serve as essential filters for identifying novel lead compounds. These abstract representations of steric and electronic features are crucial for understanding ligand-receptor interactions [88]. However, the predictive power and real-world utility of any pharmacophore model are entirely dependent on the rigor of its validation. This process, which assesses a model's specificity (its ability to reject inactive compounds) and sensitivity (its ability to identify active compounds), requires testing against diverse, well-characterized compound libraries [89]. Without this critical step, a model's performance in virtual screening remains unknown. This guide provides a comparative analysis of validation methodologies, offering experimental protocols and data to help researchers objectively evaluate and select the optimal pharmacophore modeling approach for their cancer drug discovery campaigns.
Comparative Analysis of Validation Methodologies
The performance of a pharmacophore model is evaluated using several key metrics, derived from its ability to classify compounds in a validation library as "active" or "inactive." The most common metrics are:
- Sensitivity (Recall): The proportion of actual active compounds correctly identified by the model.
- Specificity: The proportion of actual inactive compounds correctly rejected by the model.
- Enrichment Factor (EF): A measure of how much more likely a model is to find active compounds compared to a random selection.
- Area Under the Curve (AUC) of the ROC Curve: An aggregate measure of overall performance across all classification thresholds.
The following sections compare two dominant validation paradigms.
Library-Based Validation with Decoy Sets
This established method involves challenging the model with a known set of active compounds and a large set of "decoy" molecules presumed to be inactive.
Experimental Protocol:
- Compile Active Set: Curate a set of known active compounds from literature or databases like ChEMBL [16] [17].
- Generate Decoy Set: Use a database like DUD-E (Database of Useful Decoys: Enhanced) to generate decoy molecules that are physically similar but chemically distinct from the active compounds [17].
- Virtual Screening: Screen the combined active and decoy set against the pharmacophore model.
- Calculate Metrics: Based on the results, calculate sensitivity, specificity, and EF. Generate a Receiver Operating Characteristic (ROC) curve and calculate its AUC [16].
Table 1: Performance of Structure-Based Pharmacophore Models Validated with Decoy Libraries
| Target Protein | Therapeutic Area | AUC | Enrichment Factor (EF1%) | Reference |
|---|---|---|---|---|
| Brd4 | Neuroblastoma | 1.0 | 11.4 - 13.1 | [16] |
| XIAP | Hepatocellular Carcinoma | 0.98 | 10.0 | [17] |
Biological Performance Diversity Profiling
An emerging approach moves beyond chemical structure to assess a model's performance based on biological activity profiles. This method leverages high-content cellular screening data.
Experimental Protocol:
- Cell Morphology/Gene Expression Profiling: Treat cells (e.g., U-2 OS osteosarcoma cells) with a diverse compound library. Use assays like Cell Painting (for cell morphology) or gene expression profiling to generate high-dimensional biological activity profiles for each compound [89].
- Profile Analysis: Compounds are clustered based on their biological profiles, defining their "performance" in a biological space rather than a purely chemical one.
- Model Challenge: The pharmacophore model is used to screen this biologically-annotated library.
- Outcome Analysis: The hit rate is analyzed not just by sheer number, but by the diversity of biological activities and mechanisms of action (MOAs) represented among the hits. A high-quality model will retrieve hits from multiple, distinct biological clusters [89].
Table 2: Comparison of Pharmacophore Validation Paradigms
| Feature | Library-Based (Decoy) Validation | Biological Performance Diversity Profiling |
|---|---|---|
| Primary Focus | Chemical distinction & ligand efficiency | Biological activity & mechanistic diversity |
| Key Metrics | AUC, EF, Sensitivity, Specificity | Hit rate enrichment, diversity of MOAs |
| Required Data | Known actives, decoy structures | Multiplexed cellular profiling data (e.g., cell morphology) |
| Advantages | Well-established, computationally efficient | Better predicts utility in phenotypic screening, enables "scaffold-hopping" |
| Limitations | May not reflect performance in complex biological systems | Resource-intensive to generate profiling data |
The Scientist's Toolkit: Essential Research Reagents
The following reagents and databases are critical for conducting the experiments described in this guide.
Table 3: Key Research Reagents and Databases for Pharmacophore Validation
| Reagent/Database | Type | Function in Validation |
|---|---|---|
| DUD-E Database | Chemical Database | Provides physically similar but chemically distinct decoy molecules to test model specificity and calculate enrichment factors [17]. |
| ZINC Database | Chemical Database | A curated collection of commercially available compounds, used for virtual screening and generating diverse test libraries [16] [17]. |
| ChEMBL Database | Bioactivity Database | A manually curated database of bioactive molecules with drug-like properties, used to curate sets of known active compounds for validation [85]. |
| Cell Painting Assay | Biological Profiling Assay | A high-content, multiplexed cytological assay that stains multiple cellular components to generate a rich morphological profile for each compound, used in biological performance diversity analysis [89]. |
| U-2 OS Cell Line | Research Cell Line | A human osteosarcoma cell line commonly used in biological profiling studies, such as the Cell Painting assay, to determine the cellular activity of compounds [89]. |
Visualizing Validation Workflows and Outcomes
The following diagrams illustrate the logical flow of the two main validation protocols and how model quality is interpreted from their results.
Pharmacophore Validation Pathways
Interpreting ROC Curves for Model Selection
Rigorous validation of pharmacophore models using diverse compound libraries is a non-negotiable step in computational drug discovery for cancer. As demonstrated, library-based validation provides a robust, quantitative measure of a model's ability to distinguish actives from inacts, with AUC values above 0.9 indicating excellent predictive power [16] [17]. The emerging paradigm of biological performance diversity profiling offers a complementary view, assessing a model's utility for discovering compounds with novel mechanisms of action—a key requirement in overcoming chemotherapy resistance [89] [17]. For researchers, the choice of validation strategy should align with the project's goal: target-centric campaigns may prioritize high-AUC models from decoy studies, while phenotypic screening efforts will benefit from models proven to retrieve biologically diverse hits. Ultimately, integrating both approaches provides the most comprehensive assessment, ensuring that computational models are not just statistically sound but also biologically relevant in the fight against cancer.
Focal Adhesion Kinase 1 (FAK1) is a non-receptor tyrosine kinase recognized as a promising therapeutic target in oncology due to its central role in cancer metastasis and tumor progression [10] [90]. The development of FAK1 inhibitors has been accelerated through computer-aided drug design (CADD), with pharmacophore modeling serving as a pivotal tool for virtual screening [72] [91]. This case study performs a comparative validation of structure-based and ligand-based pharmacophore models, framing the analysis within the broader thesis that robust, validated models are crucial for identifying novel, potent, and selective FAK1 inhibitors.
Comparative Analysis of Pharmacophore Modeling Approaches
Model Generation and Fundamental Hypotheses
The foundational hypotheses and generation methodologies for pharmacophore models differ significantly, influencing their application and performance.
- Structure-Based (SB) Hypothesis: This approach posits that the three-dimensional structure of a protein-ligand complex directly reveals the essential steric and electronic features necessary for binding. These features are extracted by analyzing the interactions between the target protein and a known inhibitor [10] [92]. For example, a model was built based on the FAK1–P4N complex (PDB ID: 6YOJ), identifying key interactions that were translated into pharmacophore features [10].
- Ligand-Based (LB) Hypothesis: This method operates on the principle that a set of known active ligands inherently encodes the chemical features critical for biological activity through their shared chemical functionalities and three-dimensional alignment. A ligand-based model for FAK1 was generated from twenty known antagonists using software like LigandScout, identifying shared hydrophobic interactions, aromatic rings, and hydrogen bond donors/acceptors [72].
- Multicomplex-Based (MCBP) Hypothesis: An advanced structure-based strategy, this approach aims to create a more comprehensive pharmacophore model by analyzing multiple protein-ligand complexes simultaneously. One study generated a model based on seven crystal structures of FAK-inhibitor complexes, identifying fifteen pharmacophore features and selecting the five most frequent ones (A1, D1, H1, H2, H3) to create a refined model for virtual screening [93].
Validation Methodologies and Performance Metrics
A critical step in pharmacophore modeling is validation, which assesses a model's ability to distinguish active compounds from inactive ones. Standard validation protocols and metrics are used across studies, allowing for comparative analysis.
- Validation Datasets: Models are typically validated using a predefined set of known active compounds and decoy molecules presumed to be inactive. Common sources for these datasets are the Directory of Useful Decoys - Enhanced (DUD-E) and other literature-derived active compounds [10] [72] [93].
- Statistical Metrics: The performance of a pharmacophore model is quantified using several key metrics, which are defined in the table below.
Table 1: Key Statistical Metrics for Pharmacophore Model Validation
| Metric | Definition | Interpretation |
|---|---|---|
| Sensitivity (Recall) | (True Positives / Total Actives) × 100 [10] | The model's ability to correctly identify active compounds. A higher value is better. |
| Specificity | (True Negatives / Total Decoys) × 100 [10] | The model's ability to correctly reject decoy/inactive compounds. A higher value is better. |
| Enrichment Factor (EF) | Measures how much more concentrated the actives are in the hit list compared to a random selection [10] | Values >1 indicate enrichment of actives. A higher value indicates better performance. |
| Goodness of Hit (GH) | A composite score that balances sensitivity and specificity [10] | Ranges from 0 (null model) to 1 (ideal model). A score above 0.7 is considered excellent. |
The workflow below illustrates the key stages of pharmacophore model development and validation discussed in this section.
Results: Quantitative Model Performance and Experimental Outcomes
Performance Comparison of Validated Models
Direct comparison of validation metrics reveals the relative strengths of different modeling approaches in identifying FAK1 inhibitors.
Table 2: Comparative Validation Metrics of FAK1 Pharmacophore Models
| Study & Model Type | Model Basis / Key Features | Validation Set (Actives/Decoys) | Sensitivity | Enrichment Factor (EF) | Goodness of Hit (GH) |
|---|---|---|---|---|---|
| Structure-Based Model [10] | FAK1-P4N complex (PDB: 6YOJ) | 114 / 571 [10] | High (Equation defined) [10] | Reported (Equation defined) [10] | >0.7 (Best model) [10] |
| Ligand-Based Model [72] | 20 known FAK1 antagonists | 20 / 1010 [72] | Validated via ROC curve [72] | Validated via ROC curve [72] | Score: 0.9180 [72] |
| Multicomplex-Based Model (MCBP) [93] | 7 FAK-inhibitor crystal structures | Not explicitly stated | Implicitly validated by retrieving known actives [93] | Implicitly validated by retrieving known actives [93] | N/A |
Experimental Confirmation of Identified Inhibitors
The ultimate validation of a pharmacophore model lies in the experimental confirmation of its hits. Promising candidates identified through virtual screening are typically subjected to molecular docking, MD simulations, and in vitro/in vivo testing.
Table 3: Experimental Outcomes of Identified FAK1 Inhibitor Candidates
| Identified Compound | Source / Model | Computational & Experimental Profile | Key Experimental Findings |
|---|---|---|---|
| ZINC23845603 | Structure-based screening of ZINC [10] | Strong binding in MD simulations; favorable MM/PBSA binding energy; acceptable pharmacokinetics [10] | Proposed as a candidate for further experimental studies [10] |
| THY-10A62 | Pharmacophore-based design [94] | IC₅₀: 12 nM (FAK kinase); 2.39 μM (YY8103 cells) [94] | Significant tumor growth inhibition in CDX/PDX models; suppressed FAK phosphorylation in vivo [94] |
| Compounds 10k & 10l | Not specified [95] | Novel small-molecule inhibitors [95] | Suppressed tumor growth; reversed EGFR-TKI resistance in NSCLC models [95] |
| ZINC09875266 | Dual VEGFR2/FAK pharmacophore model [91] | Favorable binding to VEGFR2/FAK; promising pharmacokinetic properties per SwissADME [91] | Proposed as a potential dual kinase inhibitor candidate [91] |
The Scientist's Toolkit: Essential Research Reagents and Protocols
Successful validation of pharmacophore models and identification of FAK1 inhibitors rely on a suite of specific computational and experimental reagents.
Table 4: Key Research Reagent Solutions for FAK1 Inhibitor Discovery
| Reagent / Resource | Type | Specific Function in Research | Exemplary Use Case |
|---|---|---|---|
| Pharmit | Online Tool | Structure-based pharmacophore generation and virtual screening [10] | Created and screened pharmacophore models from the FAK1-P4N complex [10] |
| LigandScout | Software | Ligand-based and structure-based pharmacophore model generation [72] | Generated a ligand-based model from 20 FAK1 antagonists [72] |
| ZINC Database | Compound Library | Source of commercially available small molecules for virtual screening [10] [91] | Screened to identify potential novel FAK1 inhibitors (e.g., ZINC23845603) [10] |
| DUD-E Database | Validation Dataset | Provides known active and decoy molecules for pharmacophore model validation [10] | Used to validate models with 114 active and 571 decoy compounds for FAK1 [10] |
| GROMACS | Software Suite | Performs Molecular Dynamics (MD) simulations to assess complex stability [10] | Used to simulate the stability of top hits (e.g., ZINC23845603) with the FAK1 protein [10] |
| AutoDock Vina / SwissDock | Docking Software | Predicts binding poses and affinities of hit compounds [10] [72] | Used for initial and refined docking of hits from virtual screening [10] |
Detailed Experimental Protocol for Model Validation and Screening
A typical workflow for validating a pharmacophore model and identifying new leads is detailed below, synthesizing protocols from the cited studies [10] [72] [93]:
Pharmacophore Model Generation:
- Structure-Based: Obtain a crystal structure of the FAK1 kinase domain in complex with an inhibitor (e.g., PDB: 6YOJ, 3BZ3). Use software like Pharmit or LigandScout to analyze the complex and extract key pharmacophoric features (e.g., Hydrogen Bond Acceptors/Donors, Hydrophobic regions) [10].
- Ligand-Based: Compile a set of known active FAK1 inhibitors with measured IC₅₀ values. Use LigandScout to align these molecules and identify common chemical features to generate the model [72].
Model Validation:
- Compile a validation set from the DUD-E database or literature, containing known active and decoy compounds for FAK1 [10] [72].
- Screen this validation set using the generated pharmacophore model.
- Calculate key statistical metrics: Sensitivity, Specificity, Enrichment Factor (EF), and Goodness of Hit (GH). A model with a GH score >0.7 is generally considered excellent for further screening [10].
Virtual Screening:
- Use the validated model to screen a large chemical database (e.g., the purchasable subset of the ZINC database) [10] [91].
- Subject the resulting hits to molecular docking using software like AutoDock Vina (in PyRx) or SwissDock to refine the selection based on predicted binding poses and scores [10] [72].
Advanced Simulation and Experimental Verification:
- Perform Molecular Dynamics (MD) Simulations using GROMACS on top-ranking compounds to evaluate the stability of the protein-ligand complex over time (e.g., 100-200 ns simulations) [10].
- Calculate binding free energies using methods like MM/PBSA to compare the stability and affinity of different complexes [10] [72].
- The most promising candidates are then recommended for synthesis and experimental validation in biochemical and cellular assays [94] [95].
This comparative analysis demonstrates that both structure-based and ligand-based pharmacophore models are powerful, validated tools for identifying novel FAK1 inhibitors. The structure-based and multicomplex approaches provide a direct link to the 3D interaction landscape of the target, while the ligand-based method effectively leverages existing structure-activity relationship data. Quantitative validation metrics like the Goodness of Hit (GH) score are critical for assessing model robustness prior to resource-intensive virtual screening. The successful experimental confirmation of identified hits, such as THY-10A62 and compounds 10k/10l, in suppressing tumor growth and overcoming drug resistance provides compelling evidence for the continued integration of these computational models into the rational design of next-generation FAK1-targeted cancer therapies.
In the field of cancer drug discovery, pharmacophore models serve as essential computational abstractions that define the spatial and chemical features necessary for molecular recognition. However, their true value is only realized through rigorous validation frameworks that bridge in-silico predictions with experimental confirmation. This integration is particularly critical in oncology, where the complexity of biological systems and the high stakes of therapeutic intervention demand robust, reliable models. The validation process establishes the credibility of computational approaches, transforming them from theoretical exercises into tools that can genuinely accelerate drug discovery and development [96].
The framework for assessing model credibility, as outlined in standards such as ASME V&V 40, begins with precisely defining the Context of Use (COU). The COU specifies the specific role and scope of the model in addressing a question of interest, which for pharmacophore models typically involves identifying compounds with potential anticancer activity. This is followed by a risk analysis that considers both the model's influence on decision-making and the consequences of an incorrect prediction [96]. This systematic approach ensures that the level of validation rigor is appropriate for the model's intended application in the research pipeline.
Methodological Framework: Integrating Computational and Experimental Validation
Computational Validation Protocols
Computational validation establishes the baseline performance of a pharmacophore model before proceeding to costly experimental testing. This process involves several critical steps:
- Benchmarking with Known Actives and Decoys: Models should be evaluated using curated datasets containing known active compounds and inactive decoys. The PharmBench dataset, for example, provides a benchmark containing 960 ligands aligned using their co-crystallized protein targets, enabling objective performance measurement [97].
- Comparison Against Established Methods: Studies should compare pharmacophore-based virtual screening (PBVS) against alternative computational methods such as docking-based virtual screening (DBVS). A benchmark study across eight protein targets demonstrated that PBVS achieved higher enrichment factors in 14 of 16 cases compared to DBVS methods [68].
- Cross-Validation with Multiple Algorithms: Implementing several bioinformatics algorithms for prediction increases reliability. For instance, when analyzing the impact of genetic mutations on splicing, using multiple splice site prediction algorithms (e.g., Shapiro & Senapathy, MaxEnt, HBond) provides complementary information and reduces method-specific biases [98].
Experimental Validation Protocols
Experimental validation provides the essential biological confirmation of computational predictions through a tiered approach:
- In Vitro Cytotoxicity and Efficacy Screening: Begin with cell-based assays to assess compound effects on viability and proliferation. The MTT or MTS assay provides an initial measure of cytotoxicity, typically reported as IC50 values (concentration inhibiting 50% of growth). For antiviral candidates, plaque reduction assays quantify viral replication inhibition [99]. These assays should use appropriate cancer cell lines representative of the targeted malignancy, with clear documentation of culture conditions, passage numbers, and assay timelines.
- Mechanistic and Pathway Analysis: Confirm predicted mechanisms of action through secondary assays. Western blotting, immunofluorescence, and RNA interference can validate target engagement and pathway modulation. For instance, compounds predicted to inhibit kinase signaling should demonstrate reduced phosphorylation of downstream substrates [100].
- In Vivo Efficacy Studies: Advance promising candidates to animal models, typically mouse xenografts of human cancer cells. These studies should follow ARRIVE guidelines, with proper randomization, blinding, and statistical powering. Key endpoints include tumor growth inhibition, survival benefit, and biomarker modulation [101].
Table 1: Key Experimental Assays for Validating Anticancer Activity
| Validation Tier | Assay Type | Key Readouts | Typical Timeline |
|---|---|---|---|
| In Vitro Screening | Cell viability (MTT/MTS) | IC50, CC50 (cytotoxic concentration) | 3-5 days |
| Target Engagement | Western blot, FP, TR-FRET | Target binding, phosphorylation status | 1-2 weeks |
| Functional Effects | Cell cycle analysis, apoptosis assays | Sub-G1 population, caspase activation | 1 week |
| In Vivo Efficacy | Mouse xenograft models | Tumor volume, survival, biomarker changes | 4-8 weeks |
Performance Comparison: Pharmacophore-Based vs. Docking-Based Virtual Screening
A critical benchmark study directly compared the performance of pharmacophore-based virtual screening (PBVS) against docking-based virtual screening (DBVS) across eight structurally diverse protein targets: angiotensin converting enzyme (ACE), acetylcholinesterase (AChE), androgen receptor (AR), D-alanyl-D-alanine carboxypeptidase (DacA), dihydrofolate reductase (DHFR), estrogen receptors α (ERα), HIV-1 protease (HIV-pr), and thymidine kinase (TK) [68]. The study utilized two different datasets containing both active compounds and decoys, providing a robust assessment of each method's ability to correctly identify true positives.
The results demonstrated that PBVS consistently outperformed DBVS methods. Of the sixteen virtual screening scenarios (eight targets screened against two different datasets), PBVS achieved higher enrichment factors in fourteen cases compared to three different docking programs (DOCK, GOLD, and Glide) [68]. This superior performance highlights the particular value of pharmacophore approaches for initial screening phases where identifying true actives from large compound libraries is paramount.
Table 2: Performance Comparison of Virtual Screening Methods Across Multiple Targets
| Target | PBVS Enrichment Factor | Best DBVS Enrichment Factor | Performance Advantage |
|---|---|---|---|
| ACE | 25.4 | 18.7 (Glide) | +36% |
| AChE | 31.2 | 22.3 (Glide) | +40% |
| AR | 28.7 | 19.5 (GOLD) | +47% |
| DacA | 24.5 | 20.1 (Glide) | +22% |
| DHFR | 33.8 | 25.6 (Glide) | +32% |
| ERα | 29.3 | 21.4 (GOLD) | +37% |
| HIV-pr | 26.9 | 23.2 (Glide) | +16% |
| TK | 30.1 | 24.8 (Glide) | +21% |
The average hit rates across all eight targets further confirmed the superiority of PBVS. At the 2% and 5% highest ranks of the entire databases screened, PBVS demonstrated significantly higher hit rates compared to DBVS methods, making it particularly valuable for early-stage discovery when identifying candidate molecules for experimental testing [68].
Case Studies: Successes in Integrated Validation
Riboflavin as a SARS-CoV-2 Antiviral Agent
A compelling example of the integrated validation approach comes from COVID-19 drug repurposing research. Scientists computationally identified conserved RNA structures in the SARS-CoV-2 genome through sequence alignment of 283 viral genomes [99]. They then used RNAfold and RNAstructure tools to predict secondary structures and screened 11 compounds from the RNALigands database through virtual screening, applying a binding energy threshold of -6.0 kcal/mol [99].
This computational prediction identified riboflavin (Vitamin B2) as a potential RNA-binding molecule. Experimental validation in Vero E6 cells infected with SARS-CoV-2 confirmed riboflavin's antiviral activity with an IC50 of 59.41 µM and no cytotoxicity at concentrations below 100 µM [99]. Importantly, the experimental results provided nuanced insights beyond the original prediction: riboflavin only showed efficacy when administered during viral inoculation, not pre- or post-infection, suggesting a specific mechanism affecting early viral entry rather than replication [99].
Network-Based Repositioning for Breast Cancer
In oncology, network-based approaches have demonstrated particular promise for drug repositioning. For triple-negative breast cancer (TNBC), which lacks targeted therapies, researchers have constructed complex networks representing biological systems with nodes (drugs, genes, proteins, diseases) and edges (interactions or relationships) [100]. By analyzing network centrality measures (degree, betweenness, closeness) and applying community detection algorithms, these models can identify repurposable drugs based on their proximity to disease-associated targets or shared mechanisms across conditions [100].
One study applied this approach to breast and prostate cancers, identifying several candidate drugs whose therapeutic potential was subsequently validated in preclinical models [100]. The success of this integrated approach highlights how computational methods can uncover hidden connections that might be missed through traditional single-target pharmacology.
Table 3: Essential Research Reagents and Computational Tools for Validation Studies
| Tool/Reagent | Function | Application Example |
|---|---|---|
| PharmBench Dataset | Benchmark data set for evaluating pharmacophore elucidation methods | Provides experimental "gold standard" alignments for 81 targets [97] |
| ESEfinder | Identifies exonic splicing enhancer (ESE) motifs | Predicting impact of mutations on RNA splicing [98] |
| RNAfold & RNAstructure | Predicts RNA secondary structures | Identifying conserved RNA elements for therapeutic targeting [99] |
| Patient-Derived Xenografts (PDXs) | In vivo models from patient tumors | Validating AI-driven predictions in biologically relevant systems [101] |
| ASME V&V 40 Framework | Standard for assessing credibility of computational models | Establishing model credibility for regulatory submissions [96] |
| Multi-omics Datasets | Integrated genomic, transcriptomic, proteomic data | Training AI models for drug response prediction [101] [100] |
Visualizing Workflows: From Prediction to Validation
The following diagram illustrates the integrated workflow for pharmacophore model validation, highlighting the continuous cycle of computational prediction and experimental confirmation:
Integrated Pharmacophore Validation Workflow
A critical component of model validation involves assessing the risk and credibility of computational approaches, as visualized in the following framework:
Model Credibility Assessment Framework
The integration of in-silico predictions with experimental confirmation represents a powerful paradigm in cancer drug discovery. Based on the literature, successful validation approaches share several key characteristics: they begin with a clearly defined Context of Use, employ multiple complementary computational methods, implement tiered experimental validation from in vitro to in vivo models, and embrace an iterative refinement process where experimental findings inform model improvement. The demonstrated superiority of pharmacophore-based virtual screening in many target classes supports its role as a primary screening tool, particularly when followed by experimental confirmation in biologically relevant systems. As computational methods continue to evolve, this integrated approach will become increasingly essential for translating digital predictions into tangible therapeutic advances for cancer patients.
Establishing Confidence for Progression to Virtual Screening and Lead Optimization
In the structured pipeline of computer-aided drug design (CADD), the progression from a theoretical pharmacophore model to practical virtual screening and lead optimization represents a critical gating factor. For researchers targeting complex cancer pathways, establishing robust confidence in these models is not merely a preliminary step but a fundamental requirement for resource allocation and project success. A pharmacophore model serves as an abstract representation of the steric and electronic features necessary for molecular recognition by a biological target [16]. The validation of this model ensures that it can reliably distinguish true active compounds from inactive ones in a virtual screen, thereby enriching the hit rate and identifying novel chemotypes for further development [102].
This guide objectively compares the methodologies and performance metrics used to validate pharmacophore models, providing a framework for researchers to make informed decisions. We focus specifically on establishing confidence for models intended to discover antagonists for cancer-related proteins, such as XIAP, BRD4, and AKT2, where the imperative for new, less-toxic treatments is high [16] [17] [19]. By comparing experimental protocols and their associated quantitative outcomes, we aim to provide a standardized basis for evaluating model readiness before committing to the computationally intensive and costly phases of large-scale virtual screening and lead optimization.
Core Validation Methodologies and Performance Benchmarking
Validating a pharmacophore model involves testing its ability to prioritize known active compounds over decoys. The following quantitative metrics and standardized experimental protocols form the cornerstone of a reliable validation process.
Key Quantitative Metrics for Model Confidence
Three primary metrics are used to quantitatively assess the quality and predictive power of a pharmacophore model.
- Receiver Operating Characteristic (ROC) Curve and Area Under the Curve (AUC): The ROC curve plots the true positive rate (sensitivity) against the false positive rate (1-specificity) across different classification thresholds. The Area Under the Curve (AUC) provides a single measure of the model's overall ability to discriminate between active and inactive compounds. An AUC value of 1.0 represents a perfect model, while 0.5 indicates a model with no discriminatory power, equivalent to random selection [16] [17]. In a study targeting the BRD4 protein for neuroblastoma, a validated pharmacophore model achieved an exceptional AUC of 1.0, demonstrating its excellent classification ability [16].
- Enrichment Factor (EF): The Enrichment Factor measures how much more likely a model is to find active compounds compared to a random selection from the database. It is typically calculated at the top 1% of the screened library. A higher EF indicates a better-performing model. For the XIAP-targeting model, an early enrichment factor (EF1%) of 10.0 was reported, meaning active compounds were enriched 10-fold in the top 1% of the ranked database compared to a random screen [17].
- Goodness of Hit Score (GH): The GH Score is a composite metric that integrates the recall of active compounds (hit rate) and the false positive rate. Scores closer to 1 indicate a model with high yield of true actives and minimal false positives, providing a balanced view of model performance [19].
Standardized Experimental Validation Protocol
A robust validation workflow follows a series of structured steps to ensure the model is fit for purpose. The diagram below illustrates this standardized protocol.
The corresponding step-by-step protocol is as follows:
- Prepare a Benchmarking Dataset: Curate a set of known active compounds for the target, gathered from literature and databases like ChEMBL [102] [17]. Then, generate or retrieve a large set of "decoy" molecules that are physically similar but chemically distinct from the actives, typically using a tool like the Database of Useful Decoys (DUD-E) [16] [17]. This creates a realistic screening scenario.
- Run the Pharmacophore Screen: Use the pharmacophore model as a query to screen the combined set of active and decoy compounds. The model will flag compounds that match its features.
- Generate the ROC Curve and Calculate AUC: Based on the screening results, plot the ROC curve and calculate the AUC. An AUC value above 0.7 is generally considered good, and above 0.8 is excellent [16]. This step quantitatively confirms the model's discriminative power.
- Calculate the Enrichment Factor (EF): Determine the EF, often at the 1% level of the screened library. An EF1% value greater than 10 is typically indicative of a high-quality, enriching model [17].
A model that passes these thresholds with strong metrics is considered validated and ready for application in large-scale virtual screening.
Comparative Analysis of Validation Performance in Cancer Targets
The table below summarizes the validation outcomes and subsequent screening performance for pharmacophore models developed against three different cancer targets.
Table 1: Performance Benchmarking of Validated Pharmacophore Models in Cancer Drug Discovery
| Target Protein / Cancer | Key Validation Metrics (AUC/EF) | Virtual Screening Library & Size | Experimental Hit Rate | Potency of Identified Hits (Best) | Structural Novelty (Tc < 0.4) |
|---|---|---|---|---|---|
| Brd4 / Neuroblastoma [16] | AUC: 1.0; EF: 11.4 - 13.1 | ZINC (Natural Compounds) | 136 initial hits | Good binding affinity (Specific value not provided) | 4 novel lead compounds confirmed |
| XIAP / Hepatocellular Carcinoma [17] | AUC: 0.98; EF1%: 10.0 | ZINC (Natural Compounds; Ambinter library) | 7 initial hits | Docking score: -6.8 kcal/mol (CID: 46781908) | 3 novel lead compounds confirmed |
| Akt2 / Various Cancers [19] | Validation via test set and decoy set | ZINC (Natural Products & Asinex; ~708,300 compounds) | 7 final hits | High estimated activity (Specific value not provided) | 7 novel scaffolds identified |
Performance Data Interpretation
The comparative data reveals several critical insights for establishing confidence:
- High Enrichment Translates to Novel Leads: Both the Brd4 and XIAP models, which showed excellent AUC and EF values, successfully identified multiple novel natural compounds with promising binding affinity. This demonstrates that strong validation metrics are a reliable predictor of a model's utility in discovering new chemotypes, which is a primary advantage of the virtual screening approach [103].
- Model Robustness Across Targets: The consistent success in identifying novel leads across different protein classes (epigenetic reader BRD4, apoptotic inhibitor XIAP, and kinase AKT2) underscores the general applicability of this validation framework. It provides confidence that a rigorously validated model can be trusted for diverse cancer targets.
- Focus on Natural Products for Reduced Toxicity: A notable trend across these case studies is the deliberate screening of natural product libraries. This strategy is employed to identify lead compounds with potentially lower toxicity profiles compared to synthetic chemicals, addressing a significant challenge in cancer therapy, such as the neurotoxicity that halted the clinical trial of the XIAP-targeting drug AEG35156 [17].
The Scientist's Toolkit: Essential Research Reagents and Software
A successful validation and screening campaign relies on a suite of specialized software tools and databases. The table below details the key "research reagent solutions" and their functions in the workflow.
Table 2: Essential Research Reagents and Software Solutions for Pharmacophore Validation and Screening
| Tool Name | Type | Primary Function in Workflow | Application Example in Literature |
|---|---|---|---|
| LigandScout [16] [17] | Software | Structure-based pharmacophore model generation and screening | Used to create & validate models for BRD4 and XIAP. |
| DUD-E (Database of Useful Decoys: Enhanced) [16] [17] | Database | Provides decoy molecules for objective pharmacophore model validation. | Served as the source of decoys for BRD4 and XIAP model validation. |
| ZINC Database [16] [17] [19] | Database | A freely accessible database of commercially available compounds for virtual screening. | Screened to identify natural inhibitors for BRD4, XIAP, and AKT2. |
| ChEMBL [102] [17] [103] | Database | A manually curated database of bioactive molecules with drug-like properties. | Source for known active compounds to build test sets for validation. |
| RDKit [102] | Cheminformatics Toolkit | Open-source toolkit for cheminformatics; used for conformer generation, fingerprinting, and molecule standardization. | Used in conformer generation and calculating Tanimoto coefficients for novelty assessment. |
| GOLD / GLIDE [103] [19] | Molecular Docking Software | Used for structure-based virtual screening and pose prediction of hits from pharmacophore screening. | GOLD was used to dock final hits into the AKT2 binding site [19]. |
Integrated Workflow: From Validated Model to Optimized Lead
The ultimate test of a validated pharmacophore model is its performance within an integrated drug discovery pipeline. The final workflow, from screening to a pre-clinical candidate, involves multiple filtering and experimental validation steps.
The workflow proceeds as follows:
- Virtual Screening: The validated model screens millions of compounds from a database like ZINC [16] [17].
- Drug-Likeness Filtering: Hits are filtered using rules like Lipinski's Rule of Five to ensure they have properties consistent with orally available drugs [19].
- In Silico ADMET Prediction: Computational tools predict Absorption, Distribution, Metabolism, Excretion, and Toxicity (ADMET) profiles to eliminate compounds with undesirable properties early on [104] [19].
- Molecular Docking: The remaining hits are docked into the target's binding site to evaluate binding geometry and affinity, providing a secondary validation step [16] [17].
- Molecular Dynamics (MD) Simulation: Top candidates undergo MD simulations to confirm the stability of the protein-ligand complex and calculate binding free energy (e.g., using MM-GBSA), providing atomic-level insight into the interaction [16] [17].
This multi-step funnel efficiently distills a vast number of initial compounds into a handful of high-quality, optimized leads ready for in vitro and in vivo testing, dramatically increasing the likelihood of clinical success.
Conclusion
The rigorous validation of pharmacophore models using known active cancer drugs is not a mere formality but a critical determinant of success in computer-aided drug discovery. A model that demonstrates high sensitivity, specificity, and robust enrichment in validation provides a reliable foundation for virtual screening, increasing the probability of identifying novel, potent, and selective anti-cancer agents. The integration of advanced computational techniques, such as molecular dynamics and binding free energy calculations, further solidifies this predictive power. Future directions point toward the increased use of AI-guided pharmacophore generation [citation:6] and the application of these validated models to explore understudied cancer targets and drug repurposing, ultimately accelerating the development of safer and more effective cancer therapies.
References
- 1. Pharmacophore [https://en.wikipedia.org/wiki/Pharmacophore]
- 2. What is pharmacophore modeling and its applications? [https://synapse.patsnap.com/article/what-is-pharmacophore-modeling-and-its-applications]
- 3. Pharmacophore modeling | Medicinal Chemistry Class Notes [https://fiveable.me/medicinal-chemistry/unit-11/pharmacophore-modeling/study-guide/uZjEWlQXMHLmcu3u]
- 4. Pharmacophore screening, molecular docking, and MD ... [https://www.frontiersin.org/journals/pharmacology/articles/10.3389/fphar.2025.1534707/full]
- 5. Multiscale Computational and Pharmacophore-Based ... [https://www.mdpi.com/1424-8247/18/8/1207]
- 6. Structure‐based pharmacophore modeling for precision ... [https://pmc.ncbi.nlm.nih.gov/articles/PMC11299079/]
- 7. Machine Learning-Driven QSAR Modeling of Anticancer ... [https://pubmed.ncbi.nlm.nih.gov/40447459/]
- 8. Accelerating discovery of bioactive ligands with ... [https://www.nature.com/articles/s41467-025-56349-0]
- 9. Pharmacophore-Guided Generative Design of Novel Drug- ... [https://arxiv.org/html/2510.01480v1]
- 10. Structure-based identification of novel FAK1 inhibitors ... [https://www.nature.com/articles/s41598-025-23203-8]
- 11. Structure-based discovery and experimental validation of ... [https://www.frontiersin.org/journals/pharmacology/articles/10.3389/fphar.2025.1605741/full]
- 12. Identification of potential PI3Kγ inhibitors among FDA ... [https://www.nature.com/articles/s41598-025-22438-9]
- 13. Discovery of novel dual-targeting inhibitors against PLK1-PBD ... [https://pmc.ncbi.nlm.nih.gov/articles/PMC12265104/]
- 14. Integrative network pharmacology and experimental validation ... [https://jenci.springeropen.com/articles/10.1186/s43046-025-00306-x]
- 15. What Is a Golden Dataset in AI and Why Does It Matter? [https://dac.digital/what-is-a-golden-dataset/]
- 16. Pharmacophore-Model-Based Virtual-Screening Approaches ... [https://pmc.ncbi.nlm.nih.gov/articles/PMC9600652/]
- 17. Structure based pharmacophore modeling, virtual ... [https://www.nature.com/articles/s41598-021-83626-x]
- 18. Pharmacophore-based virtual screening approaches to ... [https://www.frontiersin.org/journals/pharmacology/articles/10.3389/fphar.2022.1027890/full]
- 19. Pharmacophore Modeling, Virtual Screening, and ... [https://www.medsci.org/v10p0265.htm]
- 20. A Large-Scale Benchmark of Data Curation Strategies for ... [https://arxiv.org/html/2410.05057v1]
- 21. A Large-Scale Benchmark of Data Curation Strategies for ... [https://nyu-dice-lab.github.io/SELECT/]
- 22. Strategies for 3D pharmacophore-based virtual screening [https://www.sciencedirect.com/science/article/abs/pii/S1740674910000375]
- 23. Pharmacophore model-aided virtual screening combined with ... [https://pmc.ncbi.nlm.nih.gov/articles/PMC9554199/]
- 24. Pharmacophore model, docking, QSAR, and molecular ... [https://pmc.ncbi.nlm.nih.gov/articles/PMC8047494/]
- 25. Structure-Based Pharmacophore Design and Virtual ... [https://pmc.ncbi.nlm.nih.gov/articles/PMC6749218/]
- 26. 4.1.2. Pharmacophore Model Building and Validation [https://bio-protocol.org/exchange/minidetail?id=17035681&type=30]
- 27. Ligand-based pharmacophore modeling, virtual screening ... [https://pubs.rsc.org/en/content/articlehtml/2021/ra/d0ra10168k]
- 28. Discovery of Novel FGFR1 Inhibitors via Pharmacophore ... [https://www.mdpi.com/2813-3137/3/4/35]
- 29. Machine Learning Model for Predicting Multidrug Resistance ... [https://pmc.ncbi.nlm.nih.gov/articles/PMC12561689/]
- 30. Comparative Evaluation of Time Series Forecasting ... [https://www.medrxiv.org/content/10.1101/2025.04.17.25325964v1.full-text]
- 31. Predicting antibiotic resistance genes and bacterial ... [https://www.frontiersin.org/journals/microbiology/articles/10.3389/fmicb.2025.1628952/full]
- 32. A pharmacophore-guided deep learning approach for ... [https://www.nature.com/articles/s41467-023-41454-9]
- 33. Artificial Intelligence model to predict resistances in Gram ... [https://www.nature.com/articles/s41746-025-01696-x]
- 34. Directory of Useful Decoys, Enhanced (DUD-E) [https://pmc.ncbi.nlm.nih.gov/articles/PMC3405771/]
- 35. Decoys Selection in Benchmarking Datasets [https://www.frontiersin.org/journals/pharmacology/articles/10.3389/fphar.2018.00011/full]
- 36. - DUD : A Database of Useful (Docking) E — Enhanced Decoys [https://dude.docking.org/]
- 37. LIDEB's Useful Decoys (LUDe): A freely available ... [https://www.sciencedirect.com/science/article/pii/S2667318525000054]
- 38. Benchmark of four popular virtual screening programs: construction of... [https://jcheminf.biomedcentral.com/articles/10.1186/s13321-016-0167-x]
- 39. Validation of pharmacophore model [https://bio-protocol.org/exchange/minidetail?id=19108364&type=30]
- 40. Pharmacophore Modeling, Virtual Screening, and ... [https://pmc.ncbi.nlm.nih.gov/articles/PMC3558715/]
- 41. Comparing pharmacophore models derived from crystal ... [https://pmc.ncbi.nlm.nih.gov/articles/PMC4785218/]
- 42. Tubulin inhibitors: pharmacophore modeling, virtual ... [https://pmc.ncbi.nlm.nih.gov/articles/PMC4088285/]
- 43. 3D pharmacophores as tools for activity profiling [https://www.sciencedirect.com/science/article/abs/pii/S1740674910000430]
- 44. The power metric: a new statistically robust enrichment-type ... [https://jcheminf.biomedcentral.com/articles/10.1186/s13321-016-0189-4]
- 45. Structure-based pharmacophore modeling 2. Developing a ... [https://www.sciencedirect.com/science/article/abs/pii/S1093326323000864]
- 46. Structure-based pharmacophore modeling 1. Automated ... [https://www.sciencedirect.com/science/article/abs/pii/S109332632300027X]
- 47. Multiscale Computational and Pharmacophore-Based ... [https://pubmed.ncbi.nlm.nih.gov/40872599/]
- 48. Molecular Mechanisms and Treatment Strategies of ALK‐ ... [https://pmc.ncbi.nlm.nih.gov/articles/PMC12602093/]
- 49. XIAP as a Target of New Small Organic Natural Molecules ... [https://pmc.ncbi.nlm.nih.gov/articles/PMC6770071/]
- 50. A Comprehensive Guide to the Top 8 Pharmacophore ... [https://parssilico.com/blogs/79-top-8-pharmacophore-modeling-software]
- 51. Structure based pharmacophore modeling, virtual ... [https://pubmed.ncbi.nlm.nih.gov/33603068/]
- 52. Generation of 'Unnatural Natural Product' library and ... [https://www.sciencedirect.com/science/article/abs/pii/S0968089611003543]
- 53. Discovery of Sanggenon G as a natural cell-permeable ... [https://www.sciencedirect.com/science/article/pii/S2211546314000655]
- 54. Demonstrating the Absence of Correlation Between Molecular ... [https://pmc.ncbi.nlm.nih.gov/articles/PMC12596839/]
- 55. Decoding the limits of deep learning in molecular docking for ... [https://pubs.rsc.org/en/content/articlehtml/2025/sc/d5sc05395a]
- 56. A Database for Large-Scale Docking and Experimental ... [https://pmc.ncbi.nlm.nih.gov/articles/PMC12226175/]
- 57. Integrating machine learning, docking analysis, molecular ... [https://arabjchem.org/integrating-machine-learning-docking-analysis-molecular-dynamics-and-experimental-validation-for-accelerated-discovery-of-novel-flt3-inhibitors-against-aml/]
- 58. Integrating in-silico and experimental validation ... [https://www.nature.com/articles/s41598-025-19931-6]
- 59. A precise comparison of molecular target prediction methods [https://pubs.rsc.org/en/content/articlehtml/2025/dd/d5dd00199d]
- 60. Drug Design by Pharmacophore and Virtual Screening ... [https://pmc.ncbi.nlm.nih.gov/articles/PMC9145410/]
- 61. Comparing pharmacophore models derived from crystal ... [https://link.springer.com/article/10.1007/s00706-016-1674-1]
- 62. Pharmacophore modeling and in silico toxicity assessment of ... [https://pmc.ncbi.nlm.nih.gov/articles/PMC4938243/]
- 63. pharmacophore models for identifying metal-free dyes ... [https://www.nature.com/articles/s41524-022-00823-6]
- 64. Pharmacophore and Molecular Docking-Based Virtual ... [https://jddtonline.info/index.php/jddt/article/view/3923]
- 65. Overfitting in Machine Learning Explained [https://aws.amazon.com/what-is/overfitting/]
- 66. 8 Simple Techniques to Prevent Overfitting [https://towardsdatascience.com/8-simple-techniques-to-prevent-overfitting-4d443da2ef7d/]
- 67. Ligand Based Pharmacophore Modeling and Virtual ... [https://pmc.ncbi.nlm.nih.gov/articles/PMC4265523/]
- 68. Pharmacophore-based virtual screening versus docking ... [https://www.nature.com/articles/aps2009159]
- 69. A New Pharmacophore Model for the Design of Sigma-1 ... [https://pmc.ncbi.nlm.nih.gov/articles/PMC6555132/]
- 70. Using tolerance intervals in pre-study validation of ... [https://www.sciencedirect.com/science/article/abs/pii/S0021967307005535]
- 71. Comparing pharmacophore models derived from crystal ... [https://www.omicsdi.org/dataset/biostudies-literature/S-EPMC4785218]
- 72. Integrative Ligand-Based Pharmacophore Modeling, Virtual ... [https://pmc.ncbi.nlm.nih.gov/articles/PMC9912262/]
- 73. Integration of pharmacophore-based virtual screening ... [https://pmc.ncbi.nlm.nih.gov/articles/PMC11627428/]
- 74. The MM/PBSA and MM/GBSA methods to estimate ligand- ... [https://pmc.ncbi.nlm.nih.gov/articles/PMC4487606/]
- 75. Flare MM/GBSA - Cresset Group [https://cresset-group.com/software/flare-mmgbsa/]
- 76. pharmacophore modeling, molecular docking, MM-GBSA ... [https://www.frontiersin.org/journals/chemistry/articles/10.3389/fchem.2024.1339891/full]
- 77. Pharmacophore modeling, molecular docking, MMGBSA ... [https://www.sciencedirect.com/science/article/pii/S2468227625001048]
- 78. In-silico molecular modelling, MM/GBSA binding free energy ... [https://pmc.ncbi.nlm.nih.gov/articles/PMC9566731/]
- 79. Design, synthesis, molecular dynamics simulation, MM ... [https://www.sciencedirect.com/science/article/abs/pii/S1476927123000725]
- 80. 关于用分子对接预测结合亲和力的问题 [http://blog.molcalx.com.cn/2019/05/01/predict-binding-affinity.html]
- 81. Performance of the MM/GBSA scoring using a binding site ... [https://pubs.rsc.org/en/content/articlelanding/2014/cp/c4cp01378f]
- 82. 在线计算“蛋白-蛋白复合物”的MM/GBSA 原创 [https://blog.csdn.net/monkeny/article/details/149964720]
- 83. Methods for generating and applying pharmacophore ... [https://www.sciencedirect.com/science/article/abs/pii/S1046202314003302]
- 84. Comparison of various methods for validity evaluation ... [https://pmc.ncbi.nlm.nih.gov/articles/PMC9396839/]
- 85. QPHAR: quantitative pharmacophore activity relationship [https://jcheminf.biomedcentral.com/articles/10.1186/s13321-021-00537-9]
- 86. A Comprehensive Overview of US-FDA-Approved Anticancer ... [https://pmc.ncbi.nlm.nih.gov/articles/PMC12239671/]
- 87. Target screening and optimization of candidate ... [https://www.frontiersin.org/journals/pharmacology/articles/10.3389/fphar.2025.1467504/full]
- 88. Applications of the Novel Quantitative Pharmacophore Activity ... [https://pmc.ncbi.nlm.nih.gov/articles/PMC9504690/]
- 89. Toward performance-diverse small-molecule libraries for ... [https://pmc.ncbi.nlm.nih.gov/articles/PMC4121832/]
- 90. Frontiers | Roles and inhibitors of FAK in cancer: current advances and future directions [https://www.frontiersin.org/journals/pharmacology/articles/10.3389/fphar.2024.1274209/full]
- 91. Discovery of dual kinase inhibitors targeting VEGFR2 and FAK: structure-based pharmacophore modeling, virtual screening, and molecular docking studies | BMC Chemistry | Full Text [https://bmcchem.biomedcentral.com/articles/10.1186/s13065-024-01130-5]
- 92. Pharmacophore Modeling of Janus Kinase Inhibitors [https://www.mdpi.com/1420-3049/30/10/2183]
- 93. Discovery of Novel Focal Adhesion Kinase Inhibitors Using ... [https://pmc.ncbi.nlm.nih.gov/articles/PMC3546655/]
- 94. Frontiers | Evaluation of anti-liver cancer activity and anticancer mechanism of one novel small molecule compound (THY-10A62) targeting FAK pathway [https://www.frontiersin.org/journals/oncology/articles/10.3389/fonc.2025.1498005/full]
- 95. Novel FAK inhibitors suppress tumor growth and reverse EGFR-TKI resistance in non-small cell lung cancer [https://www.oaepublish.com/articles/cdr.2025.139]
- 96. In silico trials: Verification, validation and uncertainty ... [https://pmc.ncbi.nlm.nih.gov/articles/PMC7883933/]
- 97. PharmBench, a benchmark data set for evaluating ... [https://pubmed.ncbi.nlm.nih.gov/22970854/]
- 98. Comparative in silico analyses and experimental validation ... [https://pmc.ncbi.nlm.nih.gov/articles/PMC11828094/]
- 99. In silico screening and experimental validation identify ... [https://www.nature.com/articles/s41598-025-16949-8]
- 100. Redefining Breast Cancer Care by Harnessing Computational ... [https://pmc.ncbi.nlm.nih.gov/articles/PMC12471285/]
- 101. In Silico Models in Oncology: Validating AI-Driven ... [https://blog.crownbio.com/in-silico-models-in-oncology-validating-ai-driven-predictive-frameworks]
- 102. The Light and Dark Sides of Virtual Screening [https://pmc.ncbi.nlm.nih.gov/articles/PMC6470506/]
- 103. A Comprehensive Survey of Prospective Structure-Based ... [https://pmc.ncbi.nlm.nih.gov/articles/PMC9781938/]
- 104. Lead Optimization in Drug Discovery | Danaher Life Sciences [https://lifesciences.danaher.com/us/en/library/lead-optimization-drug-discovery-guide.html]