Structure-Based Pharmacophore Modeling in Discovery Studio: A Comprehensive Guide for Drug Discovery
This article provides a comprehensive guide to structure-based pharmacophore generation using BIOVIA Discovery Studio, a leading software platform in computer-aided drug design.
Structure-Based Pharmacophore Modeling in Discovery Studio: A Comprehensive Guide for Drug Discovery
Abstract
This article provides a comprehensive guide to structure-based pharmacophore generation using BIOVIA Discovery Studio, a leading software platform in computer-aided drug design. Aimed at researchers, scientists, and drug development professionals, it covers the foundational principles of pharmacophore modeling, detailed methodological workflows for virtual screening and lead optimization, strategies for troubleshooting and model refinement, and rigorous validation techniques. By integrating over 30 years of peer-reviewed research, Discovery Studio enables the efficient identification of novel therapeutic candidates through the abstraction of key steric and electronic features from protein-ligand complexes, significantly accelerating the drug discovery process from target identification to lead optimization.
Understanding Structure-Based Pharmacophore Modeling: Core Concepts and Discovery Studio's Role in CADD
The pharmacophore concept stands as one of the most enduring and influential paradigms in medicinal chemistry and computer-aided drug design. At its core, a pharmacophore represents the essential molecular framework responsible for a drug's biological activity. According to the modern IUPAC (International Union of Pure and Applied Chemistry) definition, a pharmacophore is "an ensemble of steric and electronic features that is necessary to ensure the optimal supramolecular interactions with a specific biological target and to trigger (or block) its biological response" [1]. This definition emphasizes the abstract nature of pharmacophores as patterns of features rather than specific chemical structures, enabling the identification of structurally diverse ligands that bind to a common receptor site [2].
The power of the pharmacophore concept lies in its ability to transcend specific molecular scaffolds and focus on the fundamental interactions necessary for biological activity. This abstraction enables researchers to navigate chemical space more efficiently, identifying novel active compounds through virtual screening and providing critical insights for lead optimization in drug discovery campaigns [3]. In the context of structure-based drug design using tools like Discovery Studio, pharmacophore modeling serves as a critical bridge between structural biology and medicinal chemistry, facilitating the rapid identification and optimization of potential therapeutic agents [4].
Historical Evolution of the Pharmacophore Concept
The conceptual foundation of pharmacophores has evolved significantly over more than a century, with contributions from multiple key researchers shaping our modern understanding.
Key Milestones in Pharmacophore History
Table 1: Historical Evolution of the Pharmacophore Concept
| Year | Researcher | Contribution | Conceptual Advancement |
|---|---|---|---|
| 1898 | Paul Ehrlich | Introduced concept of "molecular framework" carrying essential features for biological activity | Original concept of specific chemical groups responsible for therapeutic effects [5] |
| 1960 | F.W. Schueler | Used term "pharmacophoric moiety" and expanded to spatial patterns of abstract features | Bridge between original and modern concepts [2] [5] |
| 1967-1971 | Lemont B. Kier | Popularized the modern term "pharmacophore" in publications | Established widespread adoption of the term and concept [2] [5] |
| 1998 | IUPAC | Formal definition of pharmacophore in Recommendations 1998 | Standardized the modern abstract definition used today [2] [1] |
| 2000s-Present | Various Researchers | Computational implementation in software platforms | Transition from theoretical concept to practical drug discovery tool [3] |
The historical trajectory of the pharmacophore concept reveals a fascinating evolution from concrete chemical groups to abstract molecular patterns. Historical accounts frequently credited Paul Ehrlich with originating the concept in the early 1900s, though recent scholarship has revealed that this attribution stemmed from an erroneous citation in the 1960s [5]. While Ehrlich undoubtedly pioneered early concepts of structure-activity relationships, his work did not explicitly use the term "pharmacophore." Instead, contemporary researchers used the term to describe features responsible for biological effects, with Schueler (1960) and Kier (1967-1971) playing pivotal roles in refining and popularizing the modern concept [2] [5].
This historical clarification does not diminish Ehrlich's foundational contributions to medicinal chemistry but rather highlights how scientific concepts evolve through collaborative refinement across generations of researchers. The transition from specific chemical groups to abstract feature-based patterns has significantly expanded the utility of pharmacophores in contemporary drug discovery, particularly in scaffold hopping and de novo design applications [6].
Figure 1: Historical Evolution of the Pharmacophore Concept
Core Features and Methodological Approaches
Essential Pharmacophore Features
The steric and electronic features that comprise a pharmacophore represent the fundamental interactions necessary for molecular recognition and biological activity. These features are defined generically to enable recognition of diverse chemical groups with similar properties [2].
Table 2: Core Pharmacophore Features and Their Characteristics
| Feature Type | Geometric Representation | Complementary Feature | Interaction Type | Structural Examples |
|---|---|---|---|---|
| Hydrogen-Bond Acceptor (HBA) | Vector or Sphere | Hydrogen-Bond Donor | Hydrogen Bonding | Carbonyl groups, ethers, alcohols [6] |
| Hydrogen-Bond Donor (HBD) | Vector or Sphere | Hydrogen-Bond Acceptor | Hydrogen Bonding | Amines, amides, hydroxyl groups [6] |
| Hydrophobic (H) | Sphere | Hydrophobic | Hydrophobic Interactions | Alkyl chains, aromatic rings [2] |
| Positive Ionizable (PI) | Sphere | Negative Ionizable | Ionic Interactions | Ammonium ions, protonated amines [6] |
| Negative Ionizable (NI) | Sphere | Positive Ionizable | Ionic Interactions | Carboxylates, phosphates [6] |
| Aromatic (AR) | Plane or Sphere | Aromatic, Positive Ionizable | π-Stacking, Cation-π | Phenyl, pyridine rings [6] |
In addition to these chemical features, pharmacophore models often incorporate exclusion volumes to represent steric constraints of the binding site, preventing ligand atoms from occupying regions occupied by the receptor [6]. The balance between feature generality and specificity represents a critical consideration in model development—overly general features may increase false positives, while excessively specific definitions may miss structurally novel active compounds [7].
Pharmacophore Generation Methodologies
The generation of pharmacophore models generally follows two principal methodologies, each with distinct advantages and requirements.
Structure-Based Pharmacophore Modeling
Structure-based approaches derive pharmacophore models directly from the three-dimensional structure of a target protein, typically in complex with a ligand. This methodology leverages precise structural information from X-ray crystallography, NMR spectroscopy, or cryo-electron microscopy to identify key interaction points between the ligand and binding site [8]. The process involves:
- Analysis of ligand-receptor complex to identify key molecular interactions
- Feature mapping of complementary chemical features in the binding site
- Spatial relationship determination between identified features
- Exclusion volume assignment based on protein structure [6]
Structure-based pharmacophore generation provides critical insights into essential ligand-receptor interactions without requiring multiple known active compounds. This approach has been successfully applied in numerous drug discovery campaigns, such as the identification of novel PD-L1 inhibitors from marine natural products [8] and XIAP inhibitors for cancer therapy [9].
Ligand-Based Pharmacophore Modeling
When three-dimensional structural information of the target is unavailable, ligand-based approaches provide a powerful alternative. This methodology derives common chemical features from a set of structurally diverse known active compounds that bind to the same biological target [3]. The key steps include:
- Training set selection of structurally diverse active molecules
- Conformational analysis to explore accessible low-energy conformations
- Molecular superimposition to identify common spatial arrangements
- Feature abstraction to convert structural alignment to pharmacophore features [2]
Successful ligand-based pharmacophore modeling requires that all training set compounds bind to the same receptor site in a similar orientation, and the quality of the resulting model depends heavily on the structural diversity and accuracy of biological data for the training set molecules [7].
Experimental Protocol: Structure-Based Pharmacophore Modeling Using Discovery Studio
This protocol details the generation of structure-based pharmacophore models using Discovery Studio software, specifically tailored for researchers targeting biological macromolecules with known three-dimensional structures.
Receptor-Ligand Complex Preparation
Import Protein Structure: Retrieve the target protein structure from the Protein Data Bank (PDB) and import into Discovery Studio. For XIAP protein studies, PDB ID: 5OQW has been successfully utilized [9].
Structure Preparation:
- Remove extraneous water molecules, except those mediating critical ligand-receptor interactions
- Add missing hydrogen atoms and assign appropriate protonation states at physiological pH
- Repair missing side chains or loops using protein modeling tools
Ligand Preparation:
- Extract the native ligand from the binding site
- Ensure correct bond orders and formal charges
- Optimize geometry using molecular mechanics force fields
Pharmacophore Feature Generation and Model Validation
Feature Mapping:
- Access the pharmacophore generation module within Discovery Studio
- Select the prepared receptor-ligand complex as input
- Choose appropriate feature definitions based on expected interaction types
- Execute feature mapping to identify potential pharmacophore elements [4]
Model Generation:
- Generate multiple pharmacophore hypotheses from the feature map
- Select models with comprehensive feature representation while maintaining chemical relevance
- Incorporate exclusion volumes to represent binding site constraints
Model Validation:
- Employ receiver operating characteristic (ROC) curve analysis to evaluate model discrimination capability
- Calculate area under the curve (AUC) values, with values >0.7 indicating acceptable performance [9]
- Determine early enrichment factors (EF1%) to assess performance in identifying active compounds from decoy sets [9]
- Validate with known active and inactive compounds not included in model generation
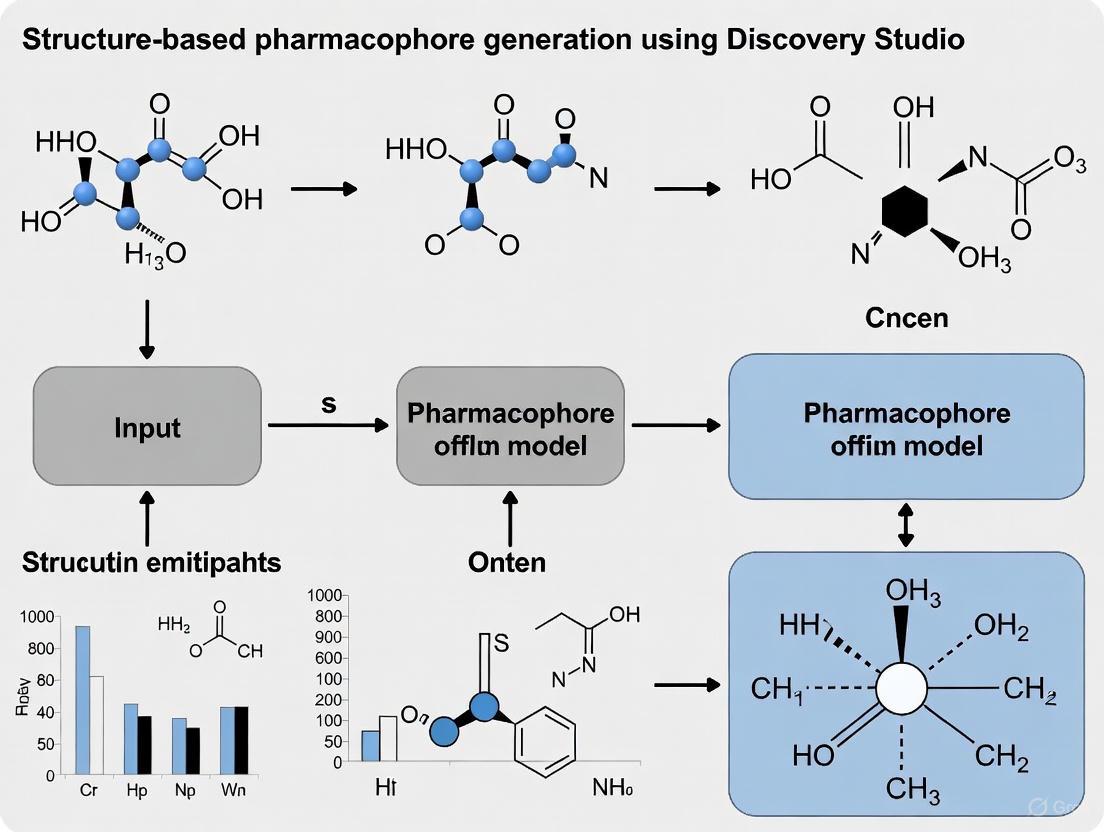
Figure 2: Structure-Based Pharmacophore Modeling Workflow in Discovery Studio
Virtual Screening and Hit Identification
Database Preparation:
- Curate 3D compound databases such as ZINC, Marine Natural Products, or in-house collections
- Generate multiple conformers for each compound to ensure comprehensive coverage
- Apply drug-like filters (e.g., Lipinski's Rule of Five) to focus on potentially viable compounds
Pharmacophore-Based Screening:
- Use the validated pharmacophore model as a 3D query against prepared databases
- Apply flexible search algorithms to account for ligand conformational flexibility
- Retrieve compounds matching pharmacophore features within spatial tolerance
Hit Prioritization:
Research Reagent Solutions for Pharmacophore Modeling
Table 3: Essential Research Tools for Pharmacophore Modeling and Applications
| Tool/Category | Specific Examples | Function/Application | Key Characteristics |
|---|---|---|---|
| Software Platforms | Discovery Studio [4], Catalyst [7], LigandScout [9] | Pharmacophore model generation, validation, and virtual screening | Automated feature identification, support for both structure-based and ligand-based approaches |
| Compound Databases | ZINC Database [9], Marine Natural Product Databases [8] | Sources of compounds for virtual screening | Curated collections with 3D structures, commercial availability information |
| Protein Structure Resources | Protein Data Bank (PDB) [9] | Source of 3D macromolecular structures for structure-based design | Experimentally validated structures with resolution quality metrics |
| Validation Tools | DUD/E Decoy Sets [9] | Pharmacophore model validation | Matched decoy compounds with similar physicochemical properties but dissimilar structures |
| Conformational Sampling Tools | CAESAR, Cyndi [3] | Generation of representative conformational ensembles | Efficient exploration of conformational space with various algorithms |
Applications in Modern Drug Discovery
The utility of pharmacophore modeling extends across multiple stages of the drug discovery pipeline, from initial hit identification to lead optimization campaigns.
Virtual Screening and Scaffold Hopping
Pharmacophore-based virtual screening represents one of the most successful applications of the concept, enabling efficient exploration of vast chemical spaces to identify novel bioactive compounds. Unlike structure-based docking methods, pharmacophore approaches reduce problems associated with explicit molecular flexibility and scoring function inaccuracies [3]. The inherent "scaffold hopping" capability of pharmacophore models allows identification of structurally diverse compounds that share essential interaction features, facilitating the discovery of novel chemotypes with reduced intellectual property constraints [6]. Successful applications include identification of novel Spleen Tyrosine Kinase inhibitors [3] and transforming growth factor-β inhibitors [3] using pharmacophore-based screening approaches.
De Novo Design and Lead Optimization
Pharmacophore models serve as valuable blueprints for de novo design programs, guiding the construction of novel molecular entities that satisfy essential interaction criteria. The NEWLEAD program represented one of the first examples of pharmacophore-based de novo design, generating novel structures that conform to pharmacophore constraints [3]. In lead optimization campaigns, pharmacophore models provide critical insights into structure-activity relationships, highlighting essential features that must be conserved versus regions amenable to modification for improving pharmacokinetic properties or reducing toxicity [3].
Multi-Target Drug Design
The emergence of polypharmacology and network pharmacology approaches has created new opportunities for pharmacophore modeling in multi-target drug design. By identifying common pharmacophore elements across different targets, researchers can design compounds with desired activity profiles against multiple therapeutic targets [3]. This approach is particularly valuable in complex diseases like cancer and neurological disorders, where modulating multiple pathways often produces superior therapeutic outcomes compared to single-target inhibition.
The pharmacophore concept has evolved significantly from its historical roots to become an indispensable tool in modern computer-aided drug design. The transition from concrete chemical groups to abstract feature patterns has expanded its utility in addressing contemporary drug discovery challenges, particularly in scaffold hopping and de novo design applications. Structure-based pharmacophore modeling using platforms like Discovery Studio provides a powerful methodology for leveraging structural biology information to guide efficient compound identification and optimization.
Despite considerable advances, pharmacophore approaches continue to face challenges related to conformational sampling, feature definition, and model validation that warrant ongoing methodological development. The integration of pharmacophore modeling with other computational approaches—including molecular dynamics simulations, machine learning, and free energy calculations—represents a promising direction for enhancing predictive accuracy and expanding applications in drug discovery. As structural information continues to grow through structural genomics initiatives and cryo-EM advancements, structure-based pharmacophore modeling is poised to play an increasingly central role in accelerating therapeutic development across diverse disease areas.
A pharmacophore is defined by the International Union of Pure and Applied Chemistry (IUPAC) as "the ensemble of steric and electronic features that is necessary to ensure the optimal supramolecular interactions with a specific biological target structure and to trigger (or to block) its biological response" [7] [10] [11]. It represents the fundamental molecular framework containing the essential chemical functionalities required for biological activity, independent of specific molecular scaffolds [10]. Pharmacophore models abstract specific atoms and functional groups into generalized chemical features, mapping them in three-dimensional space to define the optimal stereo-electronic arrangement for target binding [7] [10].
In modern computer-aided drug discovery (CADD), pharmacophore approaches serve as powerful tools for virtual screening, scaffold hopping, lead optimization, and multi-target drug design [10] [12]. By focusing on essential interaction features rather than specific chemical structures, pharmacophore models enable researchers to identify structurally diverse compounds that maintain the required binding capabilities, significantly accelerating the drug discovery process [12] [13].
Core Pharmacophoric Features and Their Geometric Representation
Fundamental Feature Definitions
The most critical pharmacophoric features include hydrogen bond acceptors (HBA), hydrogen bond donors (HBD), hydrophobic areas (H), and positively or negatively ionizable groups (PI/NI) [7] [10]. These features represent the key molecular interaction capabilities that facilitate binding between a ligand and its biological target through various non-covalent interactions [11].
Table 1: Core Pharmacophoric Features and Their Characteristics
| Feature Type | Chemical Groups | Target Interactions | Geometric Representation |
|---|---|---|---|
| Hydrogen Bond Acceptor (HBA) | Carbonyl oxygen, nitrogen in heterocycles, ether oxygen | Hydrogen bonding with donor groups | Vector or sphere projecting interaction direction |
| Hydrogen Bond Donor (HBD) | Amine groups, hydroxyl groups, amide NH | Hydrogen bonding with acceptor groups | Vector or sphere with projection point |
| Hydrophobic Area (H) | Alkyl chains, aromatic rings, steroid skeletons | Van der Waals interactions | Spheres representing hydrophobic volume |
| Positively Ionizable (PI) | Primary, secondary, tertiary amines | Ionic interactions with acidic groups | Sphere with positive charge indication |
| Negatively Ionizable (NI) | Carboxylic acids, tetrazoles, acidic heterocycles | Ionic interactions with basic groups | Sphere with negative charge indication |
| Aromatic Ring (AR) | Phenyl, pyridine, other aromatic systems | Cation-π, π-π stacking, hydrophobic interactions | Ring plane with centroid and normal vector |
Spatial Representation and Constraints
In computational implementations, these chemical features are represented as geometric entities—typically as spheres, vectors, or planes with specific spatial constraints [10]. For example, hydrogen bond donors and acceptors are often represented as vectors with specific directions and angles, while hydrophobic and ionizable features are represented as spheres with defined radii [7]. The spatial arrangement of these features creates a unique "fingerprint" that defines the complementary interaction pattern required for binding to a specific biological target [10] [11].
Additional spatial restrictions can be incorporated through exclusion volumes (XVOL), which represent forbidden areas that account for steric clashes with the target binding site [10]. These exclusion volumes are crucial for improving the selectivity of pharmacophore models by eliminating compounds that might have the correct chemical features but incorrect steric properties [10].
Structure-Based Pharmacophore Modeling in Discovery Studio
Theoretical Framework
Structure-based pharmacophore modeling utilizes the three-dimensional structure of a macromolecular target to derive essential interaction features [10]. This approach requires knowledge of the target's structure, obtained through experimental methods such as X-ray crystallography, cryo-electron microscopy, or NMR spectroscopy, or through computational techniques like homology modeling when experimental structures are unavailable [10] [11]. The recent advances in protein structure prediction, exemplified by tools like AlphaFold2, have significantly expanded the applicability of structure-based pharmacophore modeling to targets without experimentally solved structures [10].
The fundamental principle underlying structure-based pharmacophore generation is the identification of key interaction points within the target's binding site that are complementary to ligand functional groups [10]. These interaction points are then translated into pharmacophoric features that collectively define the optimal binding requirements for potential ligands [10].
Workflow for Structure-Based Pharmacophore Generation
The generation of structure-based pharmacophores in Discovery Studio follows a systematic workflow that ensures comprehensive analysis of the binding site and accurate feature identification [10] [12].
Diagram 1: Structure-based pharmacophore generation workflow in Discovery Studio
Protocol 1: Structure-Based Pharmacophore Generation from Protein Structures
Objective: To generate a comprehensive pharmacophore model from a prepared protein structure with a defined binding site.
Materials and Software:
- BIOVIA Discovery Studio 2025 [14] [12]
- Protein Data Bank (PDB) structure or homology model
- Validated binding site coordinates
Methodology:
Protein Structure Preparation
- Import the protein structure from PDB format or computational model
- Add hydrogen atoms appropriate for physiological pH (7.4)
- Optimize hydrogen bonding networks using Protonate protocol
- Remove crystallographic water molecules unless functionally important
- Energy minimization using CHARMm forcefield with implicit solvation
Binding Site Characterization
- Execute Binding Site Detection protocol to identify potential binding pockets
- Analyze pocket dimensions, hydrophobicity, and residue composition
- Select primary binding site based on biological relevance and pocket properties
- Generate exclusion volumes to represent protein steric constraints
Pharmacophore Feature Generation
- Run Receptor-Ligand Pharmacophore Generation protocol
- Select feature types: HBA, HBD, Hydrophobic, Ionizable, Aromatic
- Set feature tolerance radii to 1.0-1.5 Å for optimal matching
- Generate multiple hypothesis models with varying feature combinations
Feature Validation and Selection
- Evaluate generated features against known active ligands
- Remove redundant or sterically incompatible features
- Validate feature conservation across related protein structures if available
- Finalize minimal essential feature set for optimal selectivity
Expected Outcomes: A validated structure-based pharmacophore model containing 4-7 essential features with defined spatial relationships, suitable for virtual screening campaigns.
Advanced Applications and Case Studies
Virtual Screening with Pharmacophore Models
Pharmacophore models serve as powerful queries for virtual screening of large compound databases [10] [12]. The abstract nature of pharmacophore features enables identification of structurally diverse compounds that share essential binding characteristics, facilitating scaffold hopping and identification of novel chemotypes [10].
In Discovery Studio, the Pharmacophore Screening protocol allows efficient searching of large compound collections, with the capability to consider the full conformational space of database molecules [12]. The recent 2025 release includes enhancements to the PharmaDB database, which now contains approximately 240,000 receptor-ligand pharmacophore models built from and validated using the scPDB database [14] [12]. This extensive database enables comprehensive off-target activity profiling and drug repurposing studies [12].
Integration with Molecular Dynamics and MM-GBSA
Advanced pharmacophore applications in Discovery Studio integrate with molecular dynamics simulations and binding energy calculations [14]. The Dynamics (NAMD) protocol includes a new "Enable GPU-Resident Mode" parameter in the 2025 release, significantly improving performance on Linux systems for more efficient sampling of conformational dynamics [14].
The Calculate Mutation Energy protocols have been updated to reduce differences in energy values when running on different operating systems, providing more consistent results for binding affinity predictions [14]. These protocols enable refinement of pharmacophore models based on dynamic binding site behavior and energy decomposition analysis.
Research Reagents and Computational Tools
Table 2: Essential Research Reagents and Computational Tools for Pharmacophore Modeling
| Tool/Reagent | Type | Function in Pharmacophore Modeling | Discovery Studio Implementation |
|---|---|---|---|
| CATALYST Module | Software Algorithm | Pharmacophore model generation, validation, and screening | Core pharmacophore engine in Discovery Studio [12] |
| PharmaDB | Database | ~240,000 receptor-ligand pharmacophore models for virtual screening | Updated in DS 2025 based on scPDB 2024 [14] [12] |
| CHARMM Forcefield | Molecular Mechanics | Protein and ligand energy minimization and dynamics | Enhanced to handle systems up to 1 million atoms [14] |
| GOLD Docking | Docking Software | Validation of pharmacophore models through molecular docking | Supported in DS 2025 with improved torsion sampling [14] |
| ZDOCK | Protein-Protein Docking | Pharmacophore generation for protein-protein interaction inhibitors | GPU-accelerated in DS 2025 using CUDA 11.4 [14] |
| Exclusion Volumes | Modeling Feature | Represent steric constraints of binding pocket | Critical for structure-based pharmacophore specificity [10] |
Protocol 2: Ligand-Based Pharmacophore Generation
Objective: To develop a quantitative pharmacophore model from a set of known active compounds using ligand-based approaches when structural target information is unavailable.
Materials:
- Set of 15-30 compounds with known biological activities (IC50, Ki, or EC50 values)
- BIOVIA Discovery Studio with CATALYST module [12]
- Conformational models for all active compounds
Methodology:
Compound and Data Preparation
- Curate training set with minimum 3 orders of magnitude activity range
- Generate diverse conformational models for each compound using Generate Conformations protocol
- Define activity thresholds for active, moderately active, and inactive classifications
Common Feature Pharmacophore Generation
- Execute Common Feature Pharmacophore Generation protocol
- Select chemical features: HBA, HBD, Hydrophobic, Aromatic, Ionizable
- Set minimum and maximum features to identify (typically 3-5 features)
- Generate multiple hypotheses with varying feature combinations
Quantitative Pharmacophore Model (HypoGen)
- Run HypoGen Algorithm for quantitative model generation
- Input experimental activity values for all training set compounds
- Set statistical confidence level (typically 95-99%)
- Generate top 10 hypotheses ranked by correlation coefficient
Model Validation and Refinement
- Test hypothesis against test set compounds not used in training
- Evaluate predictive accuracy using correlation plot (experimental vs. predicted activity)
- Assess catScramble statistical significance (should exceed 95% confidence)
- Optimize feature tolerances based on validation results
Expected Outcomes: A validated quantitative pharmacophore model capable of predicting compound activity within 0.5 log units of experimental values, with defined feature contributions to binding affinity.
Recent Advances and Future Directions
Integration with Deep Learning Approaches
Recent advances combine traditional pharmacophore methods with deep learning architectures for improved bioactive molecule generation [13]. The Pharmacophore-Guided deep learning approach for bioactive Molecule Generation (PGMG) uses graph neural networks to encode spatially distributed chemical features and transformer decoders to generate molecules matching specific pharmacophores [13]. This approach addresses the challenge of data scarcity in drug discovery by using pharmacophore hypotheses as a bridge to connect different types of activity data [13].
Antibody Paratope Prediction
The Discovery Studio 2025 release introduces new capabilities for antibody paratope prediction, including the Predict Antibody Paratopes protocol and Antibody Paratopes Prediction component [14]. These tools predict antigen binding site residues in antibody CDR loops, extending pharmacophore concepts to biologics and antibody-drug conjugates [14].
Enhanced Molecular Dynamics and Free Energy Calculations
Recent improvements in molecular dynamics protocols in Discovery Studio enable more accurate assessment of binding interactions and free energy landscapes [14]. The Estimate Free Energy Landscape protocol now runs with CSV input data, while the Analyze Trajectory protocol returns non-bond interaction data for trajectories containing more than 10,000 frames [14]. These enhancements support more rigorous validation of pharmacophore models against dynamic binding processes.
The strategic application of pharmacophore modeling, focusing on key features including hydrogen bond acceptors/donors, hydrophobic areas, and ionizable groups, provides a powerful framework for structure-based drug design. Integration of these approaches within BIOVIA Discovery Studio, particularly with the recent 2025 enhancements, offers researchers comprehensive tools for efficient virtual screening and lead optimization. The continued evolution of pharmacophore methods, including integration with deep learning and enhanced dynamics capabilities, promises to further accelerate the drug discovery process across diverse target classes.
The Critical Role of Structure-Based Pharmacophores in Modern Drug Discovery
Structure-based pharmacophore modeling is an indispensable computational technique in modern drug discovery, enabling researchers to rapidly identify and optimize novel therapeutic candidates. A pharmacophore is defined as an abstract description of the steric and electrochemical features essential for a molecule to interact with a biological target and trigger a specific pharmacological response [12]. In structure-based approaches, these models are generated directly from the three-dimensional structure of a target protein, typically in complex with a ligand, mapping key interaction points within the binding site [9]. This methodology has transformed early drug discovery by providing a efficient framework for virtual screening and rational drug design, significantly accelerating the identification of promising lead compounds.
The integration of structure-based pharmacophore modeling into commercial software platforms like BIOVIA Discovery Studio has democratized access to these advanced computational techniques. Discovery Studio utilizes the CATALYST Pharmacophore Modeling and Analysis toolset, which supports comprehensive pharmacophore generation from receptor binding sites and receptor-ligand complexes [12]. The recently released 2025 version includes enhanced protocols such as the Interaction Pharmacophore Generation protocol, which now supports producing a diverse set of pharmacophores in addition to top-scoring pharmacophores, greatly expanding the utility of this approach for exploring multiple binding modes and mechanisms of action [14].
Key Methodological Approaches and Protocols
Structure-Based Pharmacophore Generation Workflow
The generation of a structure-based pharmacophore follows a systematic protocol that ensures comprehensive mapping of the protein-ligand interaction landscape. The standard workflow implemented in Discovery Studio begins with protein preparation, which involves adding hydrogen atoms, assigning partial charges, and optimizing the side-chain conformations of residues within the binding pocket. Following preparation, the pharmacophore features are identified based on the interaction patterns between the protein and a bound ligand. These features typically include hydrogen bond donors (HBD), hydrogen bond acceptors (HBA), hydrophobic regions (HyPho), aromatic moieties (Ar), and charged groups [15].
Advanced implementations, such as those described in recent scientific literature, employ sophisticated algorithms to enhance model quality. The O-LAP tool introduces a graph clustering approach where overlapping ligand atoms from multiple docked poses are clustered to form representative centroids, creating shape-focused pharmacophore models that significantly improve virtual screening enrichment [16]. Similarly, emerging AI-driven methods like PharmacoForge utilize diffusion models conditioned on protein pocket structures to generate pharmacophores with optimized properties for virtual screening [17].
Experimental Protocol: Structure-Based Pharmacophore Generation using Discovery Studio
Objective: To generate and validate a structure-based pharmacophore model from a protein-ligand complex for virtual screening applications.
Materials and Software Requirements:
- BIOVIA Discovery Studio 2025 or later
- Protein Data Bank (PDB) file of target protein in complex with a ligand
- High-performance computing workstation
Methodology:
Protein Structure Preparation:
- Import the PDB structure file (e.g., 5OQW for XIAP protein study) into Discovery Studio.
- Execute the "Prepare Protein" protocol to add hydrogen atoms, assign partial charges, and correct any missing residues or atoms.
- Remove crystallographic water molecules except those involved in key ligand-binding interactions.
Binding Site Analysis:
- Use the "Define and Edit Binding Site" tool to characterize the binding cavity based on the co-crystallized ligand position.
- Analyze key residues involved in ligand recognition and interaction.
Pharmacophore Feature Generation:
- Access the "Interaction Pharmacophore Generation" protocol within the "Ligand and Pharmacophore-based Design" module.
- Set parameters to include hydrogen bond donors/acceptors, hydrophobic features, aromatic rings, and charged groups.
- Generate multiple hypothesis models with diverse feature combinations.
Model Validation:
- Validate generated pharmacophore models using a set of known active compounds and decoy molecules.
- Employ receiver operating characteristic (ROC) curves and calculate enrichment factors (EF) at 1% threshold to quantify model performance.
- Select the optimal model based on AUC values (models with AUC >0.9 considered excellent) [9].
Troubleshooting Notes:
- If the generated model contains excessive features, adjust the feature tolerance parameters to merge proximal features of the same type.
- For models with poor enrichment factors, consider generating ensemble pharmacophores from multiple protein-ligand complexes.
Case Study: Application in XIAP-Targeted Cancer Therapy
Implementation and Results
A compelling application of structure-based pharmacophore modeling recently demonstrated its utility in targeting the X-linked inhibitor of apoptosis protein (XIAP) for cancer therapy. Researchers generated a pharmacophore model from the XIAP protein complex (PDB: 5OQW) with a known inhibitor, identifying 14 distinct chemical features including four hydrophobic regions, three hydrogen bond acceptors, five hydrogen bond donors, and one positive ionizable feature [9]. The model was rigorously validated using ROC curve analysis, achieving an exceptional AUC value of 0.98 with an early enrichment factor (EF1%) of 10.0, confirming its superior ability to distinguish active compounds from decoys.
Virtual screening of natural compound libraries against this pharmacophore model identified seven promising hit compounds, with four advancing to molecular dynamics simulations. Three compounds—Caucasicoside A, Polygalaxanthone III, and MCULE-9896837409—demonstrated stable binding profiles, suggesting their potential as lead compounds for XIAP-related cancer treatment [9]. This case study exemplifies the power of structure-based pharmacophore approaches in identifying novel chemotypes from natural product space, particularly for challenging targets like XIAP where conventional drug discovery has been hampered by toxicity issues.
Table 1: Key Research Reagent Solutions for Structure-Based Pharmacophore Modeling
| Research Reagent | Function in Workflow | Example Source/Format |
|---|---|---|
| Protein Data Bank (PDB) Structures | Source of experimentally determined protein-ligand complexes for model generation | RCSB PDB (e.g., 5OQW, 2FSZ, 7XVZ) [9] [15] |
| scPDB Database | Curated database of binding sites for pharmacophore generation; contains over 41,000 entries | PharmaDB in Discovery Studio, updated based on scPDB 2024 [14] |
| ZINC Database | Commercially available compound library for virtual screening; contains >230 million compounds | 3D formatted compounds for pharmacophore screening [9] |
| DUDE/DUD-E Database | Benchmarking sets with property-matched decoy compounds for model validation | Enhanced Database of Useful Decoys [9] [16] |
| LigandScout Software | Advanced platform for structure-based pharmacophore modeling and validation | Integrated protocol in Discovery Studio [9] [15] |
Advanced Protocol: Shared Feature Pharmacophore Modeling for Mutant Proteins
Objective: To generate a consensus pharmacophore model capturing essential features across multiple mutant forms of a target protein.
Rationale: This approach is particularly valuable for drug targets exhibiting mutation-driven resistance, such as estrogen receptor beta (ESR2) in breast cancer.
Methodology:
Multiple Structure Compilation:
- Curate multiple PDB structures of mutant variants (e.g., for ESR2: 2FSZ, 7XVZ, 7XWR) [15].
- Prepare each structure using standard protein preparation protocols.
Individual Pharmacophore Generation:
- Generate structure-based pharmacophores for each mutant protein-ligand complex.
- Record feature types and distributions for each model.
Shared Feature Analysis:
- Employ the "Alignment" tool in LigandScout to identify conserved pharmacophore features across all mutant models.
- Generate a Shared Feature Pharmacophore (SFP) model containing features present across multiple variants.
Combinatorial Screening:
- For complex SFP models with numerous features (e.g., 11 features across multiple types), use combinatorial approaches to create multiple query combinations.
- Implement an in-house Python script to distribute features using permutation formulas (e.g., 336 combinations from 11 features) [15].
- Screen compound libraries against all combinations to maximize identification of potential hits.
Key Outcomes: Application of this protocol to ESR2 mutants identified a consensus model with 2 HBD, 3 HBA, 3 hydrophobic, 2 aromatic, and 1 halogen bond donor feature. Virtual screening followed by molecular dynamics identified ZINC05925939 as a promising lead compound with stable binding to wild-type ESR2 [15].
Integration with Modern Computational Workflows
Synergy with Molecular Docking and Dynamics
Structure-based pharmacophore modeling demonstrates remarkable synergy with other computational approaches, creating integrated workflows that enhance virtual screening efficiency. Pharmacophore models serve as excellent pre-filters for molecular docking, significantly reducing the number of compounds that require computationally intensive docking simulations [17]. Recent advancements include shape-focused pharmacophore models that combine the strengths of both approaches by comparing docking poses against cavity-filling negative images of the binding site [16].
The O-LAP algorithm represents a significant innovation in this space, generating pharmacophore models through graph clustering of docked ligand poses. This approach fills the target protein cavity with flexibly docked active ligands, clusters overlapping atoms, and creates models that outperform default docking enrichment in rigorous benchmarking [16]. Similarly, the integration of pharmacophore screening with molecular dynamics (MD) simulations enables thorough evaluation of binding stability, as demonstrated in both the XIAP and ESR2 case studies where MD simulations spanning 200 ns confirmed the stability of identified lead compounds [9] [15].
Table 2: Performance Metrics of Structure-Based Pharmacophore Screening in Case Studies
| Study Target | Pharmacophore Features Identified | Validation Metrics | Virtual Screening Results | MD Simulation Outcomes |
|---|---|---|---|---|
| XIAP Protein [9] | 4 Hydrophobic, 3 HBA, 5 HBD, 1 Positive Ionizable | AUC: 0.98, EF1%: 10.0 | 7 initial hits from ZINC database | 3 compounds with stable binding |
| ESR2 Mutants [15] | 2 HBD, 3 HBA, 3 Hydrophobic, 2 Aromatic, 1 XBD | Fit score >86% for top compounds | 4 top hits satisfying Lipinski rules | 1 promising candidate (ZINC05925939) |
| Benchmark Targets [16] | Shape-focused models from docked poses | Improved enrichment vs default docking | Effective in both rescoring and rigid docking | High enrichment in DUDE-Z sets |
Advanced Visualization and Analysis Workflow
The analysis and prioritization of pharmacophore screening results requires sophisticated visualization and multi-parameter assessment to identify truly promising candidates.
Emerging Trends and Future Perspectives
The field of structure-based pharmacophore modeling is rapidly evolving with several emerging trends shaping its future development. Artificial intelligence and machine learning approaches are being increasingly integrated, as exemplified by PharmacoForge—a diffusion model that generates 3D pharmacophores conditioned on protein pocket structures [17]. These AI-generated models demonstrate competitive performance with traditional methods while offering substantial improvements in generation speed and automation.
The growing emphasis on shape-focused pharmacophore models represents another significant trend. Traditional feature-based models are being supplemented with shape-based approaches that better capture the volumetric aspects of binding sites, leading to improved enrichment in virtual screening [16]. Furthermore, the development of ensemble pharmacophore methods addresses the challenge of protein flexibility by incorporating multiple receptor conformations, providing more comprehensive coverage of potential binding modes.
Recent updates in commercial platforms like BIOVIA Discovery Studio reflect these advancements, with the 2025 release introducing new protocols for antibody paratope prediction and enhanced support for mmCIF file formats that facilitate working with complex structural data [14]. As structural biology continues to generate increasingly complex data on protein-ligand interactions, structure-based pharmacophore modeling remains an essential tool for translating this structural information into actionable drug discovery insights.
Structure-based pharmacophore modeling has established itself as a cornerstone technique in modern computational drug discovery, providing an effective framework for virtual screening and lead optimization. Through integration with structural biology data and advanced computational methods, this approach continues to evolve, addressing increasingly complex challenges in drug discovery. The documented success in targeting proteins like XIAP and mutant ESR2, coupled with ongoing methodological innovations in AI-driven pharmacophore generation and shape-based modeling, ensures that structure-based pharmacophore approaches will remain essential tools in the effort to accelerate therapeutic development and address unmet medical needs.
Discovery Studio's Integrated Environment for Molecular Modeling and Simulation
BIOVIA Discovery Studio provides a comprehensive modeling and simulation suite that integrates over 30 years of peer-reviewed research and world-class in silico techniques into a unified environment for life sciences research [18]. This integrated platform enables researchers to explore biological and physicochemical processes at the atomic level, accelerating drug discovery and development from target identification through lead optimization [19]. For researchers focused on structure-based pharmacophore generation, Discovery Studio offers a seamless workflow that combines molecular dynamics simulations, binding site analysis, and pharmacophore modeling within a single, collaborative environment.
The software brings together specialized modules for simulations, structure-based design, and ligand-based approaches, all accessible through a user-friendly interface with robust visualization capabilities [18] [19]. This integration is particularly valuable for pharmacophore model generation, where understanding dynamic protein-ligand interactions and binding site flexibility significantly enhances model accuracy and biological relevance. The environment supports the entire research workflow—from protein preparation and dynamics simulations to pharmacophore generation and virtual screening—without requiring researchers to master multiple disconnected tools or manage complex data transfer between applications [20] [12].
Core Modules Supporting Structure-Based Pharmacophore Generation
Simulations for Dynamic Binding Site Characterization
Molecular dynamics simulations within Discovery Studio provide critical insights into protein flexibility and binding site dynamics that directly inform pharmacophore model generation [20]. The platform utilizes best-in-class simulation programs including NAMD and CHARMm, with GPU acceleration for enhanced performance [20].
- Explicit Membrane Modeling: The Solvate with Explicit Membrane protocol enables researchers to simulate transmembrane proteins in physiologically relevant lipid bilayer environments, with recent enhancements improving equilibration reliability [21]. This is particularly crucial for generating accurate pharmacophore models for membrane-bound targets like GPCRs [22].
- Gaussian Accelerated MD (GaMD): This implementation allows for simultaneous unconstrained enhanced sampling and free energy calculations, helping researchers identify cryptic binding pockets and characterize protein flexibility relevant to pharmacophore feature placement [20].
- Trajectory Analysis: Built-in tools for analyzing MD trajectories enable researchers to identify conserved water molecules, map binding site flexibility, and determine stable interaction patterns that inform pharmacophore feature selection [20].
Table 1: Key Molecular Dynamics Simulation Capabilities
| Simulation Type | Application in Pharmacophore Generation | Key Features |
|---|---|---|
| Explicit Solvent MD | Characterizes solvation effects on binding sites | Solvation with optional counterions; Water molecule tracking |
| GaMD Simulations | Identifies low-frequency binding site conformations | Enhanced sampling without constraints; Free energy calculations |
| Explicit Membrane MD | Models membrane protein binding sites accurately | Pre-equilibrated lipid bilayers; Transmembrane protein solvation |
| QM/MM Simulations | Provides electronic property details for feature modeling | DMol3/CHARMm hybrid; Electronic structure analysis |
Structure-Based Design Tools
The structure-based design module offers specialized tools for binding site analysis and protein-ligand interaction mapping that directly support pharmacophore feature identification [19].
- Binding Site Analysis: Tools for identifying critical residues with non-bond interaction monitors help characterize the chemical environment of binding pockets [19].
- Protein-Ligand Docking: Protocols like CDOCKER provide CHARMm-based docking with flexible ligand refinement, generating protein-ligand complexes that serve as input for structure-based pharmacophore generation [19].
- Fragment-Based Screening: Multiple Copy Simultaneous Search (MCSS) places functional group fragments into binding sites to identify favorable interaction points—a method directly applicable to pharmacophore feature selection [22].
Pharmacophore Modeling and Analysis
The Catalyst pharmacophore modeling toolkit within Discovery Studio supports comprehensive structure-based pharmacophore generation through multiple approaches [12] [4].
- Receptor-Based Pharmacophores: Automatically generate pharmacophores from receptor binding sites by analyzing interaction potentials and feature complementarity [12].
- Complex-Based Pharmacophores: Create pharmacophores from receptor-ligand complexes by extracting key interaction features from solved structures [12].
- Ensemble Pharmacophores: Go beyond classical limitations by exploring multiple binding modes and protein conformations to create comprehensive pharmacophore models that account for structural flexibility [12].
- Diverse Pharmacophore Generation: Recent enhancements include methods for generating diverse pharmacophore models, improving coverage of different binding modes and interaction patterns [23].
Integrated Workflow for Structure-Based Pharmacophore Generation
The following diagram illustrates the comprehensive workflow for structure-based pharmacophore generation in Discovery Studio, integrating multiple modules into a cohesive research pipeline:
Workflow Overview: This integrated process begins with protein preparation and proceeds through dynamics simulations, binding site analysis, and automated pharmacophore generation, culminating in validated models ready for virtual screening applications.
Protocol: Structure-Based Pharmacophore Generation from Dynamics-Informed Binding Sites
Protein System Preparation
- Protein Structure Input: Begin with an experimentally determined or modeled structure (recent releases support AlphaFold2 and OpenFold for predicted structures) [23]. Use the Prepare Protein protocol to add missing atoms, predict ionization states, and assign appropriate protonation states at physiological pH.
- System Solvation: Employ the Explicit Solvation protocol to solvate the protein in a water box with appropriate counterions to neutralize the system. For membrane proteins, use the Solvate with Explicit Membrane protocol with pre-equilibrated lipid bilayers [20].
- System Minimization: Perform energy minimization using the CHARMm force field (CGenFF or charmm36) to relieve steric clashes and optimize hydrogen bonding networks [20].
Molecular Dynamics for Binding Site Characterization
- System Equilibration: Run a multi-stage equilibration protocol gradually relaxing positional restraints on the protein to achieve stable system density and temperature.
- Production Dynamics: Execute production MD simulations using either CHARMm or NAMD engines, with GPU acceleration via OpenMM for improved performance [20]. For enhanced sampling of binding site conformations, implement Gaussian accelerated MD (GaMD) protocols.
- Trajectory Analysis: Use the Measure Trajectory Features protocol to calculate RMSD, RMSF, and binding site volume fluctuations. Identify conserved water molecules and stable interaction grids within the binding site [21].
Pharmacophore Feature Identification and Model Generation
- Binding Site Analysis: Use the Binding Site analysis tool to characterize the chemical environment, identifying hydrophobic patches, hydrogen bond donors/acceptors, and charged regions.
- Fragment Placement: Run Multiple Copy Simultaneous Search (MCSS) to place functional group fragments in the binding site, identifying energetically favorable positions for key chemical features [22].
- Feature Selection: Based on MCSS results and trajectory analysis, select critical interaction points for inclusion in the pharmacophore model. The Feature Mapping protocol automates identification of possible interaction features within the binding site [4].
- Model Generation: Use the Common Feature Pharmacophore Generation protocol to create multiple pharmacophore hypotheses from the selected features. The algorithm generates and ranks models based on feature consensus and geometric complementarity [4].
Protocol Validation and Selection Framework
Recent research has established rigorous methodologies for validating and selecting optimal structure-based pharmacophore models [22]:
- Enrichment Factor Calculation: Validate models by screening databases containing known active ligands and decoys. Calculate enrichment factors (EF) to quantify performance compared to random selection.
- Cluster-then-Predict Workflow: Implement machine learning-based selection using K-means clustering followed by logistic regression classification to identify pharmacophore models likely to yield higher enrichment values [22].
- Performance Metrics: Evaluate models using AUC (Area Under Curve) values from ROC analysis, with AUC >0.9 indicating excellent discriminatory power [9].
Table 2: Quantitative Validation Metrics for Pharmacophore Models
| Validation Metric | Calculation Method | Performance Standard | Application in Model Selection |
|---|---|---|---|
| Enrichment Factor (EF) | (Hitssampled / Nsampled) / (Hitstotal / Ntotal) | EF1% > 10 indicates strong enrichment [9] | Primary metric for virtual screening performance |
| Goodness of Hit (GH) | Combines yield of actives and false negative rate | GH approaching 1.0 indicates ideal performance [22] | Balanced metric considering multiple factors |
| Area Under Curve (AUC) | Integral of ROC curve | AUC > 0.9 indicates excellent model discrimination [9] | Overall model quality assessment |
| Positive Predictive Value (PPV) | TP / (TP + FP) | PPV of 0.76-0.88 for high enrichment models [22] | Machine learning classifier performance |
Research Reagent Solutions for Structure-Based Pharmacophore Generation
Table 3: Essential Research Tools in Discovery Studio for Pharmacophore Modeling
| Research Reagent | Function in Pharmacophore Generation | Key Features |
|---|---|---|
| CHARMm Force Field | Empirical potential for molecular mechanics calculations | Parameterization for proteins, lipids, small molecules; CHARMM36 and CGenFF support [19] |
| MCSS (Multiple Copy Simultaneous Search) | Fragment placement for interaction mapping | Places functional groups in binding site; Identifies favorable interaction positions [22] |
| CATALYST Pharmacophore Engine | Pharmacophore model generation and screening | Geometric feature-based queries; Shape similarity; "Forbidden" space definition [12] |
| PharmaDB Database | Pharmacophore screening and off-target profiling | ~240,000 receptor-ligand pharmacophore models; Validated using scPDB [12] |
| ZDOCK Algorithm | Protein-protein docking for interface analysis | FFT-based shape complementarity; Predicts binding interfaces [19] |
| DMol3 Module | Quantum mechanical calculations | Density functional theory; Electronic property calculation [19] |
| DELPHI Solver | Electrostatic property calculation | Poisson-Boltzmann equation solver; pKa prediction [19] |
Advanced Applications and Case Studies
GPCR-Targeted Pharmacophore Modeling
G protein-coupled receptors represent a particularly challenging class of drug targets due to their membrane-bound nature and frequent lack of known ligands [22]. Discovery Studio's integrated environment enables successful pharmacophore generation for GPCRs through:
- Homology Modeling: For GPCRs without experimental structures, the MODELER algorithm generates reliable homology models using the integrated comparative modeling workflow [19].
- Membrane-Embedded Simulations: The explicit membrane modeling capabilities create physiologically relevant environments for GPCR binding site characterization [20].
- Fragment-Based Pharmacophore Generation: The score-based selection method applied to MCSS-placed fragments generates high-performing pharmacophore models even without known active ligands [22].
In a comprehensive study across 30 Class A GPCRs, this approach produced pharmacophore models exhibiting high enrichment factors when screening databases containing 569 known GPCR ligands. The machine learning-based selection workflow achieved 82% true positive identification of high-enrichment structure-based pharmacophore models [22].
XIAP Antagonist Identification Case Study
A recent study targeting the XIAP protein demonstrates the power of the integrated Discovery Studio environment for identifying natural anti-cancer agents [9]:
- Structure-Based Pharmacophore Generation: Researchers created a pharmacophore model from the XIAP protein active site complexed with a known inhibitor, identifying 14 chemical features including hydrophobic regions, hydrogen bond donors/acceptors, and positive ionizable features [9].
- Model Validation: The pharmacophore model demonstrated exceptional discriminatory power with an AUC value of 0.98 and early enrichment factor (EF1%) of 10.0, confirming its ability to distinguish active compounds from decoys [9].
- Virtual Screening: Application of the validated model to natural compound databases identified several promising XIAP antagonists with potential anti-cancer activity [9].
The following diagram illustrates the key protein-ligand interactions captured in the XIAP pharmacophore model, demonstrating how structural informatics guides feature selection:
Pharmacophore Feature Mapping: The XIAP case study demonstrates how binding site analysis translates specific protein-ligand interactions into pharmacophore features including hydrogen bond donors/acceptors, positive ionizable groups, hydrophobic regions, and exclusion volumes.
Recent Advancements and Future Directions
The Discovery Studio environment continues to evolve with significant enhancements in recent releases:
- AI Integration: The 2024 release incorporated AlphaFold2 and OpenFold for protein structure prediction, alongside RFDiffusion and ProteinMPNN for protein design, enabling more accurate structure determination for targets without experimental structures [23].
- Enhanced Simulation Protocols: Recent updates improved explicit membrane modeling equilibration and fixed issues with production dynamics on NVIDIA RTX A6000 GPUs, increasing reliability for membrane protein simulations [21].
- Democratized Machine Learning: New capabilities allow researchers to build and share custom machine learning and 3D models across team members, facilitating collaborative pharmacophore model refinement [23].
The integration of these advanced AI and simulation technologies within the unified Discovery Studio environment promises to further enhance the accuracy and efficiency of structure-based pharmacophore generation, solidifying its position as an essential platform for modern drug discovery research.
Within the framework of structure-based pharmacophore generation, the initial steps of procuring and refining a protein structure are foundational. A pharmacophore is defined as "the ensemble of steric and electronic features that is necessary to ensure the optimal supramolecular interactions with a specific biological target structure and to trigger (or to block) its biological response" [10]. Generating a reliable, structure-based pharmacophore model directly depends on the quality and biological relevance of the input protein structure [10]. This application note details the essential protocols within BIOVIA Discovery Studio for transitioning from a raw protein data bank (PDB) file to a fully prepared protein structure, ready for subsequent computational workflows such as pharmacophore modeling, molecular docking, and virtual screening.
Core Principles: The Importance of Protein Preparation
Protein structures sourced from the Protein Data Bank (PDB) are experimental snapshots and are not immediately suitable for computational analysis. Using a raw PDB file can introduce significant errors, including distorted binding predictions, false positive docking poses, and a general waste of computational resources [24]. Proper preparation ensures the accurate modeling of molecular interactions by addressing common issues such as missing atoms, incorrect protonation states, and the presence of non-essential crystallographic components [10] [24]. This process is not merely a formality but the cornerstone of meaningful and reproducible in silico research [24].
Experimental Protocol: A Step-by-Step Guide
The following protocol describes the standard workflow for protein preparation using BIOVIA Discovery Studio, ensuring the structure is optimized for structure-based pharmacophore generation.
Workflow Diagram
The logical flow of the protein preparation protocol is visualized below.
Detailed Methodologies
Step 1: Load Your Protein Structure
- Action: Within Discovery Studio, navigate to
File → Import → Molecule from PDB[24]. - Rationale: The initial acquisition of the protein structure.
- Protocol Note: It is critical to select a high-resolution structure related to your specific target. The quality of the input structure directly influences the quality of the final pharmacophore model [10] [24].
Step 2: Clean the Protein Structure
- Action: Utilize the "Clean Protein" tool in Discovery Studio [24].
- Rationale: To remove non-essential components that may interfere with subsequent calculations.
- Protocol Details:
- Removes unwanted water molecules, except those potentially involved in key interactions.
- Deletes extraneous ligands and heteroatoms not relevant to the study.
- Resolves alternate conformations of residues to a single, defined state [24].
- Output: A baseline cleaned protein structure.
Step 3: Prepare the Protein for Docking and Pharmacophore Modeling
- Action: Execute the "Prepare Protein" module [24].
- Rationale: To correct structural deficiencies and assign correct chemical properties.
- Protocol Details:
- Adds missing atoms and residues that are absent in the experimental structure.
- Correctly assigns bond orders for all atoms in the structure.
- Adds hydrogen atoms based on the specified physiological pH, which is crucial for correct protonation states of residues [24]. Discovery Studio includes tools for quick and accurate protein ionization and residue pK~a~ prediction for this purpose [20].
Step 4: Minimize the Structure (Optional but Recommended)
- Action: Use the "Minimize Energy" tool with the CHARMm force field [24].
- Rationale: To remove steric clashes and relieve residual structural strain introduced during the preparation steps.
- Protocol Details:
- Run a short, mild energy minimization.
- Critical Warning: Excessive minimization should be avoided to prevent significant deviation from the original, experimentally determined conformation [24].
Step 5: Define the Binding Site
- Action: Use binding site definition tools to specify the region of interest [24].
- Rationale: For structure-based pharmacophore generation, the model is built within the ligand-binding site [10].
- Protocol Details:
- From a Co-crystallized Ligand: If the PDB structure contains a bound ligand, the binding pocket can be defined directly from the ligand's location [24].
- From Prediction: If no ligand is present, use "Define and Edit Binding Site" or other bioinformatics tools (e.g., GRID, LUDI) to predict potential binding pockets based on geometric and energetic properties [10] [24].
Research Reagent Solutions
The following table catalogues the essential computational tools and their functions within the Discovery Studio environment for the protein preparation workflow.
Table 1: Key Research Reagent Solutions for Protein Preparation in Discovery Studio
| Tool/Feature Name | Function in Protein Preparation |
|---|---|
| Clean Protein Tool | Removes water molecules, extraneous ligands, and heteroatoms; resolves alternate conformations [24]. |
| Prepare Protein Module | Adds missing atoms/residues, assigns correct bond orders, and adds hydrogen atoms appropriate for the target pH [24]. |
| CHARMm Force Field | An empirical force field used for energy minimization to remove steric clashes and for molecular dynamics simulations [20] [19]. |
| Binding Site Definition Tools | Defines or predicts the ligand-binding pocket, which is a prerequisite for structure-based pharmacophore modeling and docking [24]. |
| pK~a~ Prediction Tools | Accurately predicts protein ionization and residue pK~a~ values to ensure correct protonation states during protein preparation [20]. |
Data Presentation and Analysis Parameters
The table below summarizes the key quantitative parameters and decisions involved in the protein preparation protocol, serving as a quick-reference guide for researchers.
Table 2: Critical Parameters and Options for Protein Preparation
| Preparation Step | Key Parameters & Options | Recommendation / Default Value |
|---|---|---|
| Structure Selection | PDB Resolution | Prefer higher resolution (e.g., < 2.5 Å) structures [24]. |
| Protein Cleaning | Water Removal | Remove all but functionally critical water molecules [24]. |
| Protein Preparation | pH for Protonation | Set to physiological pH (e.g., 7.4) unless specified otherwise [24]. |
| Energy Minimization | Force Field | CHARMm [20] [24]. |
| Energy Minimization | Algorithm & Steps | Use a mild minimization protocol to retain crystal structure integrity [24]. |
| Binding Site | Definition Method | From co-crystallized ligand (preferred) or computational prediction [10] [24]. |
A meticulous and systematic approach to protein structure retrieval and preparation is an indispensable prerequisite for successful structure-based pharmacophore generation. The protocols outlined herein, when executed using the robust tools within BIOVIA Discovery Studio, provide a reliable foundation for subsequent computational drug discovery efforts. A well-prepared protein structure ensures that the derived pharmacophore model—a spatial arrangement of features like hydrogen bond donors/acceptors, hydrophobic regions, and ionizable groups—accurately reflects the true interaction potential of the biological target [10]. This, in turn, increases the likelihood of identifying valid hit compounds through virtual screening, thereby accelerating the drug discovery pipeline.
A Step-by-Step Workflow: Building and Applying Pharmacophore Models in Discovery Studio
Within the framework of structure-based pharmacophore modeling, the initial preparation and validation of the protein-ligand complex is a critical foundational step. The accuracy and reliability of subsequent pharmacophore generation, virtual screening, and lead optimization in BIOVIA Discovery Studio are entirely contingent upon the structural and energetic soundness of this initial input complex [12]. This protocol details a comprehensive procedure for preparing and validating a protein-ligand complex using Discovery Studio 2025, ensuring the system is optimally configured for robust pharmacophore model generation [14].
Current Software Capabilities: Discovery Studio 2025
The 2025 release of BIOVIA Discovery Studio introduces several enhancements that directly improve the accuracy and efficiency of complex preparation. Key updates relevant to this protocol include:
- Advanced File Handling: Improved support for reading mmCIF file formats, including correct interpretation of biological assemblies and chemical component definitions (CCD), ensuring ligand bond orders and formal charges are assigned correctly from the outset [14].
- Enhanced Force Fields: Updates to underlying libraries and force fields, such as the MODELLER update to version 10.5, provide more accurate homology modeling and loop refinement for structures with missing residues [14].
- Performance Optimizations: GPU-resident mode for Dynamics (NAMD) protocols and the ability to handle systems with up to 1 million atoms in CHARMm enable the study of larger, more complex biological systems [14].
Experimental Protocol
Protein Preparation and Minimization
The following steps ensure the protein structure is structurally sound and ready for complex formation [25].
- Protein Selection and Import: Download the crystal structure of your target protein (e.g., PDB: 6M0J) from the RCSB Protein Data Bank. Import the structure into Discovery Studio.
- Initial Preparation: Execute the "Prepare Protein" protocol. This step automatically inserts missing loops, adds missing atoms, and standardizes residue names.
- Protonation: Apply the "Protonation" step to assign hydrogen atoms appropriate for physiological pH (pH 7.4). This step is crucial for correctly modeling hydrogen bonding and electrostatic interactions in the pharmacophore.
- Protein Minimization: Subject the prepared protein to a multi-stage energy minimization to relieve steric clashes and geometric strain using the CHARMm force field [20].
- Solvation: Solvate the protein with an explicit water model (e.g., TIP3P) using an explicit periodic boundary condition. Add counterions to neutralize the system's charge.
- Minimization Steps:
- Step 1: Fix the protein backbone and side chains, allowing only water molecules and hydrogen atoms to move. Use the Smart Minimizer algorithm, initiating with the Steepest Descent method until a gradient RMS of 3 is reached, followed by the Conjugate Gradient method.
- Step 2: Fix the protein backbone, allowing side chains, water, and hydrogens to move using the same Smart Minimizer protocol.
- Step 3: Allow the entire system to move without restrictions, applying the Smart Minimizer protocol to achieve a final energy-minimized structure.
- Desolvation: Remove water molecules and ions from the minimized system to obtain the prepared protein for docking or complex analysis.
Ligand Preparation
Concurrently, the small molecule ligand must be prepared to explore its relevant conformational and ionization states [25] [12].
- Ligand Input: Draw the ligand structure using ChemDraw or import a ligand structure from a database (e.g., scPDB, ZINC) in SDF or MOL2 format.
- Ligand Preparation Protocol: Use the "Ligand Preparation" protocol in Discovery Studio.
- Ionization and Tautomers: Set the ionization to generate possible states within a physiological pH range (e.g., 6.5–8.5). Generate canonical tautomers to ensure comprehensive chemical space coverage.
- Isomer Generation: For ligands with undefined stereochemistry, generate isomers for all chiral atoms. The molecular modeling in subsequent steps will identify the optimal isomer for binding.
Active Site Definition and Docking (If Applicable)
For structures where a ligand is not already co-crystallized, docking is required to generate a complex.
- Define Active Site: Based on the crystallographic ligand or known binding site residues, define the spherical docking region. The sphere should be large enough (e.g., 9.9–10 Å radius) to allow ligand flexibility [25].
- Perform Docking: Utilize a docking protocol such as CDOCKER [20] or Dock Ligands (GOLD) [14] to generate plausible binding poses.
- Pose Selection: Select the top-ranked pose based on a combination of docking scores, interaction analysis with key binding site residues, and visual inspection.
Complex Validation
Before proceeding to pharmacophore generation, validate the prepared complex.
- Structural Inspection: Visually inspect the complex for reasonable binding geometry, absence of severe steric clashes, and formation of key interactions (e.g., hydrogen bonds, hydrophobic contacts, pi-pi stacking).
- Energetic Plausibility: For critical complexes, consider running a short molecular dynamics (MD) simulation using the "Dynamics (NAMD)" protocol [14] [20] to assess the stability of the ligand pose and the complex.
Key Enhancements and Fixed Defects in Discovery Studio 2025
Table 1: Recent enhancements in BIOVIA Discovery Studio 2025 relevant to complex preparation and validation.
| Component | Enhancement | Benefit for Complex Preparation |
|---|---|---|
| File Format Support | Enhanced mmCIF reading; biological assemblies correctly named; missing residue info read [14]. | Improved handling of modern PDB entries and more accurate initial model building. |
| Ligand Chemistry | PDB Ligand Bond Orders script upgraded to use CCD files for all ligands from RCSB PDB [14]. | Correct assignment of bond orders and formal charges, critical for accurate electrostatics. |
| Force Field & Methods | MODELLER updated to v10.5; Solvate with Explicit Membrane protocol updated for better equilibration [14]. | More reliable homology models and membrane system preparation. |
| Performance | CHARMm can handle systems with up to 1 million atoms [14]. | Enables preparation and simulation of very large molecular systems. |
Table 2: Selected fixed defects in BIOVIA Discovery Studio 2025 improving reliability.
| Defect ID | Issue Fixed | Impact on Workflow |
|---|---|---|
| DSC-37615 | Simulation Time parameter can now exceed 200 ns in Dynamics protocols [14]. | Allows for longer, more biologically relevant simulation times. |
| DSC-37212 | Prepare Protein protocol no longer fails for inputs with >99999 atoms [14]. | Robust preparation of very large systems, such as multi-protein complexes. |
| DSC-38126 | Inserting a structure from mmCIF no longer creates spurious intermolecular bonds [14]. | Prevents introduction of artifacts during file import. |
Visualized Workflow
Below is a flowchart depicting the logical sequence of the protein-ligand complex preparation and validation protocol.
Workflow for Protein-Ligand Complex Preparation and Validation
Table 3: Key research reagent solutions and software resources for complex preparation.
| Resource / Reagent | Function / Description | Source / Example |
|---|---|---|
| RCSB Protein Data Bank (PDB) | Primary repository for 3D structural data of proteins and nucleic acids. | PDB ID: 6M0J (SARS-CoV-2 Spike RBD with ACE2) [25] |
| BIOVIA Discovery Studio | Integrated environment for protein preparation, simulation, and pharmacophore modeling. | BIOVIA Discovery Studio 2025 [14] |
| CHARMm Force Field | A widely used empirical energy function for molecular mechanics and dynamics simulations. | Integrated in Discovery Studio for minimization and MD [20] |
| scPDB / PharmaDB | A curated database of binding sites and pharmacophores derived from the PDB. | Contains >41,000 entries for pharmacophore-based screening [14] |
| ZINC Database | A freely available database of commercially available compounds for virtual screening. | Source for natural compounds and drug-like molecules [26] |
| PyMOL / DS Visualizer | Molecular visualization tools for analyzing and rendering prepared structures and complexes. | Used for interaction analysis and figure generation [27] |
Automated pharmacophore feature generation and mapping represents a pivotal phase in structure-based drug design, transforming complex structural data into actionable, three-dimensional chemical interaction models. Within BIOVIA Discovery Studio, this process leverages sophisticated algorithms to systematically detect and map critical interaction features directly from protein-ligand complexes or binding sites, providing researchers with powerful hypotheses for virtual screening and lead optimization [12]. This Application Note details the practical implementation of automated pharmacophore generation protocols within Discovery Studio, specifically focusing on the Receptor-Ligand Complex (E-Pharmacophore) and Annotate Binding Site workflows available to researchers.
The fundamental strength of automated pharmacophore generation lies in its ability to objectively identify essential molecular interactions—including hydrogen bond donors/acceptors, hydrophobic regions, charged centers, and exclusion volumes—while reducing subjective bias inherent in manual model development [28]. With the recent 2025 release of Discovery Studio incorporating enhanced pharmacophore capabilities and improved performance, researchers now have access to even more robust tools for accelerating drug discovery pipelines [14].
Core Capabilities of Automated Pharmacophore Generation in Discovery Studio
Table 1: Core Pharmacophore Generation Protocols in BIOVIA Discovery Studio
| Protocol Name | Input Requirements | Key Generated Features | Primary Applications |
|---|---|---|---|
| Receptor-Ligand Complex (E-Pharmacophore) | Prepared protein-ligand complex | Hydrogen Bond Donor/Acceptor, Hydrophobic, Ionic, Aromatic, Exclusion Volumes | Structure-based screening, Binding interaction analysis |
| Annotate Binding Site | Protein structure (apo or holo) | Putative interaction sites: Hydrogen Bond Donor/Acceptor, Hydrophobic Patches, Metal Coordination Sites | Target exploration, De novo design, Site characterization |
| Create Pharmacophore Manually | Pre-defined feature set | Customizable feature types with geometric constraints | Model refinement, Hypothesis testing |
Discovery Studio's automated pharmacophore generation modules incorporate multiple advanced algorithms for comprehensive feature detection. The Receptor-Ligand Complex protocol generates E-Pharmacophores by analyzing interaction energies and spatial configurations within protein-ligand complexes, automatically assigning pharmacophore features based on observed molecular interactions [28]. Concurrently, the Annotate Binding Site protocol identifies potential interaction sites in unbound protein structures, predicting favorable locations for specific pharmacophore features even without a bound ligand present [19].
Recent enhancements in Discovery Studio 2025 include improved handling of pharmacophore feature types in the Create Pharmacophore Manually tool panel and updated chemical component definition (CCD) records that enable more accurate assignment of ligand bond orders and formal charges when reading mmCIF structure files [14]. These advancements contribute to higher fidelity pharmacophore models that more accurately represent true molecular interactions.
Experimental Protocols
Protocol 1: Structure-Based Pharmacophore Generation from Protein-Ligand Complex
Objective: To generate an energy-optimized (E-Pharmacophore) model from a protein-ligand complex structure for virtual screening applications.
Required Materials and Software:
- BIOVIA Discovery Studio 2025 or later [14]
- Experimentally determined or modeled protein-ligand complex structure (PDB or mmCIF format)
- Protein Preparation Workflow tools
- Receptor-Ligand Complex pharmacophore generation protocol
Step-by-Step Procedure:
Structure Preparation:
- Import the protein-ligand complex structure file (PDB or mmCIF format) into Discovery Studio.
- Run the
Protein Preparationworkflow to add hydrogen atoms, assign partial charges, correct protonation states, and fix structural issues. - Ensure the bound ligand is properly defined with correct bond orders and formal charges.
Protocol Setup:
- Navigate to:
Tasks > Browse > Ligand-Based Virtual Screening > Develop Pharmacophore Hypothesis. - Select
Receptor-ligand complex (Workspace)under "Create pharmacophore model using". - Choose
Auto (E-Pharmacophore)as the generation method [28].
- Navigate to:
Parameter Configuration:
- Click
Hypothesis Settingsto access feature parameters. - In the
Featurestab, selectDonors as vectorsto treat hydrogen bond donors as directional features. - In the
Excluded Volumestab, enableCreate receptor-based excluded volumes shellto define steric constraints. - Accept remaining default parameters and save settings.
- Click
Job Execution and Results Analysis:
- Specify an appropriate job name (e.g., "lkha4epharmexvol") and click
Run. - Upon completion, visualize the generated pharmacophore overlaid with the input protein-ligand complex.
- Examine automatically identified features including hydrogen bond donors/acceptors, hydrophobic interactions, and ionic features.
- Validate feature assignments against observed protein-ligand interactions in the complex structure.
- Specify an appropriate job name (e.g., "lkha4epharmexvol") and click
Protocol 2: Binding Site Analysis and Pharmacophore Generation
Objective: To generate a structure-based pharmacophore model from an apo protein structure by analyzing potential interaction features within a defined binding site.
Required Materials and Software:
- BIOVIA Discovery Studio 2025 or later [14]
- Protein structure (with or without bound ligand)
- Define and Edit Binding Site tool
- Annotate Binding Site protocol
Step-by-Step Procedure:
Binding Site Definition:
- Import the protein structure and prepare using the
Protein Preparationworkflow. - If no ligand is present, use the
Define and Edit Binding Sitetool to specify the binding site location using known catalytic residues or cavity detection algorithms.
- Import the protein structure and prepare using the
Binding Site Annotation:
- Navigate to:
Tasks > Browse > Structure-Based Design > Annotate Binding Site. - Select the prepared protein structure and defined binding site as inputs.
- Run the protocol with default parameters to identify potential interaction features within the binding site.
- Navigate to:
Pharmacophore Feature Mapping:
- Review the automatically annotated features including hydrogen bond donors/acceptors, hydrophobic patches, and metal coordination sites.
- Manually refine the feature set if necessary using the
Create Pharmacophore Manuallytool to add missing features or adjust spatial constraints.
Model Validation:
- If known active ligands are available, validate the generated pharmacophore by verifying that key ligand functional groups align with corresponding pharmacophore features.
- Adjust feature tolerances based on binding site flexibility and known structure-activity relationships.
Workflow Visualization
Diagram 1: Automated pharmacophore generation from protein-ligand complexes.
Diagram 2: Binding site analysis and pharmacophore generation workflow.
Research Reagent Solutions
Table 2: Essential Research Reagents and Computational Tools for Automated Pharmacophore Generation
| Reagent/Tool | Specifications | Function in Workflow |
|---|---|---|
| BIOVIA Discovery Studio | Version 2025 or later with Ligand- and Pharmacophore-based Design module [12] | Primary software platform for all pharmacophore generation and analysis protocols |
| Protein Structures | Experimental (PDB) or modeled structures in PDB or mmCIF format; Prepared with hydrogen atoms and assigned partial charges | Input structures for pharmacophore generation from complexes or binding sites |
| PharmaDB Database | Contains ~240,000 receptor-ligand pharmacophore models; Updated based on scPDB release 2024 [14] [12] | Reference database for pharmacophore validation and screening context |
| CATALYST Pharmacophore Modeling | Algorithm integrated within Discovery Studio for feature detection and hypothesis generation [12] | Underlying engine for pharmacophore feature identification and mapping |
| MCSS (Multiple Copy Simultaneous Search) | Fragment-based sampling method for identifying favorable interaction points in binding sites [29] | Alternative approach for structure-based pharmacophore generation without known ligands |
Troubleshooting and Technical Notes
Common Challenges and Solutions:
Incomplete Feature Detection: If critical interaction features are missing from automatically generated pharmacophores, use the
Create Pharmacophore Manuallytool to add missing features. The manual interface now properly handles newer pharmacophore feature types (e.g., iHBA, iHalogen) following fixes in Discovery Studio 2025 [14].Excessive Exclusion Volumes: When exclusion volumes create overly restrictive models, adjust the
Excluded Volumesparameters inHypothesis Settingsor manually remove volumes using theManage Excluded Volumespanel to focus on essential steric constraints [28].Performance Optimization: For large-scale virtual screening applications, ensure proper preparation of screening libraries by generating 3D conformations and utilizing the updated PharmaDB database containing over 41,000 entries for enhanced profiling capabilities [14] [12].
Recent Enhancements:
Discovery Studio 2025 introduces several relevant improvements for pharmacophore workflows, including support for CCDC GOLD version 2024.1 with improved torsion sampling during docking, enhanced mmCIF file format support for better handling of structural data, and updated components for antibody paratope prediction that complement traditional small molecule pharmacophore approaches [14]. These advancements provide researchers with more accurate starting points for pharmacophore generation and broader application across different target classes.
In the workflow of structure-based pharmacophore generation, the step of selecting and refining essential features is a critical determinant of model quality and subsequent success in virtual screening. This step bridges the gap between the raw structural data of a protein-ligand complex and the abstract functional representation that will be used to identify new bioactive compounds. This Application Note details a standardized protocol for this crucial phase using BIOVIA Discovery Studio, enabling researchers to distill complex structural interactions into a refined set of pharmacophoric features with validated bioactivity contributions [10].
The core objective is to transform an over-represented set of initial interaction features—which may include redundant or energetically insignificant points—into a parsimonious pharmacophore hypothesis. This hypothesis must contain the steric and electronic features necessary to ensure optimal supramolecular interactions with a specific biological target and to trigger (or block) its biological response [10]. The procedure outlined herein leverages the computational tools within Discovery Studio to achieve this refinement through a combination of structural analysis, energetic considerations, and conservation metrics.
Theoretical Background
A pharmacophore is an abstract representation of molecular interactions, defined by the International Union of Pure and Applied Chemistry (IUPAC) as "the ensemble of steric and electronic features that is necessary to ensure the optimal supramolecular interactions with a specific biological target structure and to trigger (or to block) its biological response" [10]. In structure-based modeling, these features are derived directly from the 3D structure of a macromolecule target, typically obtained from X-ray crystallography, NMR spectroscopy, or computational models like AlphaFold2 [10] [30].
Table 1: Common Pharmacophore Feature Types in Discovery Studio
| Feature Type | Symbol | Description | Role in Molecular Recognition |
|---|---|---|---|
| Hydrogen Bond Acceptor | HBA | Atom that can accept a hydrogen bond | Forms electrostatic interactions with donor groups |
| Hydrogen Bond Donor | HBD | Atom that can donate a hydrogen bond | Forms electrostatic interactions with acceptor groups |
| Hydrophobic Area | H | Non-polar atom or region | Engages in van der Waals and desolvation interactions |
| Positively Ionizable | PI | Functional group that can carry a positive charge | Forms salt bridges with negative residues |
| Negatively Ionizable | NI | Functional group that can carry a negative charge | Forms salt bridges with positive residues |
| Aromatic Ring | AR | Pi-electron system | Engages in cation-pi and stacking interactions |
| Exclusion Volume | XVOL | Spatial constraint | Represents forbidden areas in the binding pocket |
The initial phase of structure-based pharmacophore generation typically identifies numerous potential features from the binding site. However, incorporating all these features into a final model can lead to over-constrained queries that fail to retrieve active compounds from databases. The selection and refinement process is therefore essential for creating a model that is both selective and sufficiently general to identify novel scaffolds while minimizing false positives [31].
Experimental Protocol
Prerequisites and Input Preparation
Software Requirements:
- BIOVIA Discovery Studio (2025 or later version recommended for access to the latest updates in pharmacophore modeling [14])
- Valid license for the Catalyst Pharmacophore Modeling and Analysis toolset [12]
Input Data Preparation:
- Protein-Ligand Complex: A high-resolution (preferably <2.5 Å) 3D structure of the target protein with a bound ligand, in PDB or mmCIF format. For mmCIF files, ensure ligand bond orders are correctly assigned using the updated PDB Ligand Bond Orders script [14].
- Prepared Structure: The complex must be pre-processed using the Prepare Protein protocol. This includes adding hydrogen atoms, assigning correct protonation states at biological pH (e.g., for Asp, Glu, His), and filling in any missing loops or side chains. The updated protocol in DS 2025 handles systems with over 99,999 atoms robustly [14].
Step-by-Step Workflow
The following workflow, also depicted in Figure 1, details the procedure for feature selection and refinement.
Figure 1. Workflow for pharmacophore feature selection and refinement in Discovery Studio.
Step 1: Generate Initial Pharmacophore Features
- Launch the Interaction Generation protocol within the Structure-Based Design module.
- Define the binding site region by selecting the co-crystallized ligand or by creating a binding site sphere centered on the ligand's centroid with a suitable radius (e.g., 7.0 Å to encompass all potential interaction points) [31].
- Run the protocol to map all potential interaction points. The output will be a feature-rich pharmacophore model containing hydrogen bond acceptors/donors, hydrophobic features, ionizable regions, and aromatic rings, often totaling 15-25 initial features.
Step 2: Cluster and Edit Redundant Features
- Open the generated model in the Pharmacophore Editor.
- Use the "Edit and Cluster Pharmacophores" tool to group redundant features. This tool clusters features of the same type based on spatial proximity, replacing multiple similar features with a single, representative feature [31].
- Manually inspect and remove any features that are:
- Located in solvent-accessible regions without clear protein interaction partners.
- Positioned on protein residues with high side-chain flexibility and unlikely interaction potential.
Step 3: Select Bioessential Features Using Hierarchical Filtering
This is the core refinement step. Systematically apply the following filters to select only features critical for bioactivity:
- Energetic Filtering: Analyze the binding site and remove features that do not contribute significantly to the binding free energy. This can be inferred from the interaction type (e.g., weak van der Waals contacts vs. strong hydrogen bonds or salt bridges).
- Conservation Filtering: If multiple complex structures are available, retain features that are conserved across different ligand-bound states. If sequence data is available, prioritize features from evolutionarily conserved residues or residues identified by site-directed mutagenesis as critical for function [10].
- Complex-based Filtering: Crucially, analyze the interaction pattern of the native ligand in the co-crystal structure. Prioritize pharmacophore features that are directly mapped by the functional groups of the ligand in its bioactive conformation [10] [31]. This ensures the model reflects a validated interaction mode.
Step 4: Add Exclusion Volumes
- Apply Exclusion Volumes (XVOL) to represent the steric constraints of the binding pocket. These are spheres where an atom from a potential ligand should not be located, mimicking the van der Waals surface of the protein atoms lining the pocket [10].
- In Discovery Studio, exclusion volumes can be automatically added around the protein atoms in the binding site. Adjust the density and radius of these spheres to accurately capture the pocket's shape without making the model overly restrictive.
Step 5: Validate the Refined Model
Before proceeding to virtual screening, perform initial validation:
- Check if the refined model can successfully map the original co-crystallized ligand.
- If data is available, test if the model can retrieve other known active ligands from a small set of decoys. A valid model should map known actives and reject inactive molecules [31].
Expected Outcomes and Interpretation
A successfully refined pharmacophore model should be composed of 4 to 7 essential features [31]. For example, in a study on Akt2 inhibitors, the final structure-based model (PharA) comprised seven features: two hydrogen-bond acceptors, one hydrogen-bond donor, and four hydrophobic features, along with exclusion volumes [31]. The model should present a clear spatial arrangement of these features that is logically consistent with the binding site geometry and the interactions formed by known active ligands.
Table 2: Case Study - Refined Pharmacophore for Akt2 Inhibitors [31]
| Feature ID | Feature Type | Proximal Protein Residue | Functional Role in Binding |
|---|---|---|---|
| HA1 | Hydrogen Bond Acceptor | Ala232 (backbone NH) | Critical for anchoring ligand |
| HA2 | Hydrogen Bond Acceptor | Phe294, Asp293 (backbone NH) | Stabilizes ligand orientation |
| HD1 | Hydrogen Bond Donor | Asp293 (side chain COO⁻) | Forms strong salt bridge/hydrogen bond |
| HY1 | Hydrophobic | Phe439, Met282, Ala178 | Engages in van der Waals interactions |
| HY2 | Hydrophobic | Gly159, Val166, Gly164, Gly161 | Fits into a hydrophobic subpocket |
| HY3 | Hydrophobic | Met229, Lys181 | Contributes to binding affinity |
| HY4 | Hydrophobic | Phe163, Lys181 | Defines ligand specificity |
The Scientist's Toolkit: Research Reagent Solutions
Table 3: Essential Resources for Feature Selection and Refinement in Discovery Studio
| Resource Name | Category | Function in Protocol | Access within Discovery Studio |
|---|---|---|---|
| Prepare Protein | Protocol | Pre-processes the input protein structure: adds hydrogens, assigns charges, and fixes missing atoms. | Protocols → Structure-Based Design |
| Interaction Generation | Protocol | Automatically maps all potential pharmacophoric features (HBA, HBD, H, etc.) within a defined binding site. | Protocols → Structure-Based Design |
| Edit and Cluster Pharmacophores | Tool | Groups redundant pharmacophore features based on spatial proximity, simplifying the initial model. | Pharmacophore Menu |
| Pharmacophore Editor | Tool | Manual visualization, editing, and refinement of features and exclusion volumes. | Tools → Pharmacophore |
| Exclusion Volumes | Constraint | Defines forbidden regions in space, mimicking the protein's steric boundaries. | Added via Pharmacophore Editor |
| PharmaDB | Database | Contains ~240,000 receptor-ligand pharmacophore models; useful for comparison and validation [12]. | Ligand- and Pharmacophore-based Design Module |
Troubleshooting and Best Practices
Problem: The refined model is too restrictive and fails to map known active compounds.
- Solution: Revisit the clustering step. Consider merging features with a larger distance tolerance or removing the least critical exclusion volumes. The goal is a model that captures the essential interaction pattern, not every possible contact.
Problem: The model retrieves too many false positives during screening.
- Solution: Apply stricter filtering in Step 3. Incorporate additional exclusion volumes to better define the binding site shape. Validate the model with a set of known inactive compounds to identify features that may lack selectivity.
Leverage Multi-Target Data: For challenging targets, the Ensemble Pharmacophores approach can be used to explore multiple potential interaction modes from very large or diverse compound sets [12].
Utilize Latest Enhancements: With Discovery Studio 2025, take advantage of the updated Solvate with Explicit Membrane protocol for membrane-bound targets and the improved performance of the Dynamics (NAMD) protocol on GPUs for assessing feature stability through molecular dynamics [14].
The meticulous selection and refinement of essential pharmacophore features from an overabundance of initial structural data is a cornerstone of effective structure-based drug design. This Application Note provides a definitive, step-by-step protocol within BIOVIA Discovery Studio to guide researchers through this critical process. By systematically applying energetic, conservation, and complex-based filtering, a robust and selective pharmacophore model can be achieved. This refined model serves as a powerful query for virtual screening, enabling the efficient identification of novel, bioactive chemical matter with a high probability of success in downstream experimental testing.
Within the structure-based pharmacophore generation workflow in BIOVIA Discovery Studio, the steps of conformation generation and energy threshold configuration are critical. These parameters directly determine the quality and chemical relevance of the generated ligand conformations, which in turn influences the accuracy and reliability of the resultant pharmacophore model [4]. This protocol provides a detailed, step-by-step guide for configuring these essential parameters, framed within the broader context of a comprehensive research thesis on structure-based pharmacophore generation.
Experimental Protocol
Detailed Methodology for Parameter Configuration
The following procedure is executed within the Common Feature Pharmacophore Generation module (also known as HipHop) in Discovery Studio [32].
- Access the Conformation Generation Parameters: Within the protocol's parameter window, locate and expand the
Conformation Generationparameter group [4]. - Set the Conformation Method: Click the grid to the right of the
Conformation Generationparameter and selectBESTfrom the dropdown menu. This method performs a systematic conformational search to ensure comprehensive coverage of the ligand's conformational space [4] [32]. - Define the Maximum Conformations: Set the
Maximum Conformationparameter to200. This value determines the maximum number of conformations that will be generated for each input ligand during the analysis [4] [32]. - Configure the Energy Threshold: Set the
Energy Thresholdparameter to10. This setting, typically in kcal/mol, defines the maximum energy difference allowed between the generated conformers and the calculated global energy minimum. Conformations with energy above this threshold are discarded [4] [32]. - Run the Protocol: After verifying all parameters, click the
Runbutton to execute the task. The generated pharmacophore models will be listed in the report page upon completion, ranked by their scoring value [4].
Key Parameter Specifications Table
The table below summarizes the core parameters and their recommended values for a standard pharmacophore generation protocol.
Table 1: Key Parameters for Conformation Generation in Discovery Studio
| Parameter Name | Recommended Value | Functional Description |
|---|---|---|
| Conformation Generation | BEST |
The algorithm used for conformational analysis. "BEST" ensures a thorough, systematic search [4] [32]. |
| Maximum Conformation | 200 |
The upper limit for the number of conformers generated per molecule to represent its flexible states [4] [32]. |
| Energy Threshold | 10 (kcal/mol) |
The energy window above the global minimum within which conformers are considered chemically relevant and are retained [4] [32]. |
| Principal Value | 2 |
An attribute assigned to training set ligands, where '2' denotes active, '1' moderately active, and '0' inactive [4] [32]. |
| MaxOmitFeat | 0 |
An attribute for training set ligands specifying the number of pharmacophore features a molecule is allowed to miss in the model [4]. |
The Scientist's Toolkit: Research Reagent Solutions
Table 2: Essential Materials and Software for Pharmacophore Modeling
| Item / Reagent | Function / Application in the Protocol |
|---|---|
| BIOVIA Discovery Studio | The primary software platform containing the Common Feature Pharmacophore Generation module and other necessary tools for structure-based drug design [4] [32]. |
| Ligand Dataset (SD File) | A set of active small molecules (e.g., 1A52_ligands.sd) used as the training set to elucidate common chemical features [4]. |
| CHARMM Force Field | Used within Discovery Studio for energy minimization and optimization of ligands and protein structures, ensuring conformations are energetically favorable [32]. |
| Feature Mapping Module | A preliminary tool used to identify and select relevant pharmacophore feature elements (e.g., HBA, HBD, Hydrophobic) present in the ligand set before model generation [4]. |
| Decoy Molecule Set | A collection of molecules with unknown or inactive properties against the target, used from resources like DUD-E to validate the predictive power and selectivity of the pharmacophore model [32] [33]. |
Workflow Visualization
The following diagram illustrates the logical workflow for the conformation generation and pharmacophore modeling process, showing how parameter configuration integrates with the broader procedure.
Technical Notes
Rationale Behind Parameter Selection
BESTConformation Method: This selection is critical for a comprehensive search. It employs a poling algorithm to ensure maximum diversity among the generated conformers, which is essential for capturing the full range of potential ligand-binding poses and for building a pharmacophore model that is not biased by a single, potentially non-representative, low-energy conformation.- Energy Threshold of 10 kcal/mol: This value represents a pragmatic balance between computational efficiency and chemical relevance. While the biologically active conformation of a ligand is often a low-energy state, it is rarely the absolute global minimum. A 10 kcal/mol window is sufficiently large to include a diverse set of plausible conformations that a flexible ligand might adopt when binding to a protein target, without incorporating high-energy, unrealistic states that would introduce noise into the model.
- Maximum Conformations of 200: This limit controls the computational scope of the conformational analysis. For most drug-like molecules, generating 200 conformations provides adequate coverage of their torsional space. Setting this limit prevents the calculation from becoming prohibitively long for large and highly flexible molecules, while still yielding a representative conformational ensemble.
Model Validation and Analysis
After the protocol runs, the results are presented in a report page listing up to 10 generated pharmacophore models [4]. Key columns for analysis include:
Features: The chemical features in the model (e.g., H: Hydrophobic, A: Hydrogen Bond Acceptor, D: Hydrogen Bond Donor, R: Aromatic Ring).Rank: A scoring value where a higher number indicates a better model.Direct Hit: A binary string indicating which training set molecules match all features of the model (a value of '1') and which do not ('0'). A model with a direct hit string of '111111' for a set of 6 molecules is ideal [4].
It is imperative to note that the ranking is automated and the top-ranked model may not always be the most biologically relevant. Subsequent validation steps, such as screening against a database of known active and inactive compounds, are essential to confirm the model's predictive power and avoid overfitting the training set data [33].
Virtual screening of large compound libraries is a critical step in structure-based drug discovery, serving as a computational analog to high-throughput biological screening [34]. This protocol details the application of this methodology within Discovery Studio software, focusing on the use of structure-based pharmacophore models to efficiently identify potential hit compounds from the ZINC database, a publicly accessible repository containing millions of commercially available compounds in ready-to-dock 3D format [9]. By using a pharmacophore as a 3D search query, researchers can rapidly filter vast chemical libraries to a manageable number of candidates that possess the essential features for binding to the target protein, significantly reducing the time and cost associated with experimental screening alone [8] [35]. This approach has proven effective in identifying novel bioactive molecules, including marine natural products as PD-L1 inhibitors and natural anti-cancer agents targeting the XIAP protein [8] [9].
Research Reagent Solutions
The following table lists the key software resources required to execute the virtual screening protocol described herein.
Table 1: Essential Software Tools for Virtual Screening
| Resource Name | Type/Provider | Primary Function in Virtual Screening |
|---|---|---|
| BIOVIA Discovery Studio | Software Suite (Dassault Systèmes) | Structure-based pharmacophore generation, model validation, and pharmacophore-based screening [36]. |
| ZINC Database | Public Compound Database | Source of millions of purchasable compounds for virtual screening [37] [9]. |
| AutoDock Vina/QuickVina 2 | Docking Software | Molecular docking to evaluate binding affinity and pose prediction of hit compounds [8] [37]. |
| MGLTools (AutoDockTools) | Utility Software | Preparation of receptor and ligand files in PDBQT format for docking [37]. |
| fpocket | Open-Source Software | Detection and characterization of binding pockets on the protein surface [37]. |
The entire process of virtual screening, from library preparation to the identification of final hit compounds, follows a structured workflow. The diagram below illustrates the key stages and decision points.
Preparation of Compound Libraries
Sourcing Compounds from the ZINC Database
The ZINC database is a primary source for commercially available compounds, crucial for virtual screening [9]. To prepare a library for a structure-based workflow in Discovery Studio:
- Access ZINC: Navigate to the publicly accessible website
https://zinc.docking.org/[37]. - Select Subset: For initial screening, consider using focused libraries such as the "ZINC Natural Products database" or "FDA-approved drugs" to increase the likelihood of finding compounds with favorable bioactivity or safety profiles [35] [37].
- Download Compounds: Download the selected compounds in a 3D file format (e.g., SDF or MOL2) that is compatible with Discovery Studio.
Library Preparation for Docking
While Discovery Studio can handle various formats for pharmacophore screening, subsequent molecular docking steps often require specific file preparation. If using docking software like AutoDock Vina, compounds must be converted to PDBQT format [37]. This can be automated using command-line tools in a Unix-like environment, for example, with the jamlib script which energy-minimizes molecules and converts them into the required PDBQT format [37].
Pharmacophore-Based Virtual Screening Protocol
Screening Setup and Execution
This section details the steps for using a validated pharmacophore model to screen a compound library within Discovery Studio.
- Step 1: Load the validated, structure-based pharmacophore model into Discovery Studio. This model should contain key features like Hydrogen Bond Acceptors (HBA), Hydrogen Bond Donors (HBD), Hydrophobic features (HY), and excluded volumes [36] [8].
- Step 2: Load the prepared compound library from the ZINC database into the project.
- Step 3: Access the "Search 3D Database" protocol within Discovery Studio. Configure the parameters:
- Pharmacophore Model: Select your validated model as the 3D query.
- Screening Database: Specify your loaded ZINC library.
- Search Method: Choose "Flexible Search" to account for ligand conformational flexibility during the fitting process.
- Step 4: Execute the screening protocol. The output will be a list of compounds that match the pharmacophore features.
Analysis of Screening Hits
- Step 5: Examine the "Fit Value" of the results. This value indicates how well each compound aligns with the pharmacophore model. A higher fit value generally signifies a better match.
- Step 6: Visually inspect the alignment of the top-ranking hits with the pharmacophore features to confirm the logicality of the fit. At this stage, a study screening 52,765 marine natural products identified 12 initial hit compounds based on the pharmacophore model [8].
Post-Screening Analysis and Validation
Molecular Docking of Hit Compounds
To further evaluate the binding mode and affinity of the pharmacophore hits, molecular docking is performed.
- Receptor Preparation: Obtain the 3D structure of the target protein (e.g., from the PDB). Prepare it by removing water molecules, adding hydrogen atoms, and optimizing side-chain conformations using protein preparation tools in Discovery Studio or other software [36] [8]. For docking with Vina, generate a PDBQT file of the receptor [37].
- Grid Box Definition: Define the docking region (grid box) around the binding site used for pharmacophore generation. Tools like
fpocketcan help characterize binding sites [37]. The center and size of the box should encompass all key residues. - Docking Execution: Dock the hit compounds into the binding site. For instance, the AutoDock Vina or QuickVina 2 software can be used for this purpose [37]. In a case study, two compounds from 12 pharmacophore hits had binding affinities of -6.5 kcal/mol and -6.3 kcal/mol, which were better than the reference inhibitor's score of -6.2 kcal/mol [8].
Statistical Validation of Screening Performance
It is critical to evaluate whether the virtual screening process performs better than random selection. The Receiver Operating Characteristic (ROC) curve is a standard tool for this assessment [34].
- Method: The screening method is tested against a dataset containing known active compounds and inactive decoy molecules. The ROC curve plots the true positive rate against the false positive rate.
- Analysis: The Area Under the Curve (AUC) indicates the quality of the screening; an AUC of 1 represents perfect identification, while 0.5 indicates a random performance [9] [34]. A validated pharmacophore model for XIAP inhibitors achieved an excellent AUC value of 0.98, demonstrating a strong ability to distinguish active from inactive compounds [9]. Another model for PD-L1 showed good performance with an AUC of 0.819 [8].
Table 2: Key Metrics for Virtual Screening Validation
| Metric | Description | Interpretation | Exemplary Values from Literature |
|---|---|---|---|
| Area Under Curve (AUC) | Measures the overall ability to rank actives before inacts [34]. | Closer to 1.0 = Better performance. | 0.98 (XIAP model) [9], 0.819 (PD-L1 model) [8] |
| Enrichment Factor (EF) | Measures the concentration of active compounds in the top of the ranked list. | Higher value = Better enrichment. | Theoretical maximum achieved for 8/8 GPCR targets [29]. |
| Binding Affinity (kcal/mol) | Estimated free energy of binding from molecular docking. | More negative value = Stronger predicted binding. | -6.5, -6.3 (Top hits vs. -6.2 for reference) [8] |
This protocol outlines a robust workflow for executing virtual screening of large compound libraries like ZINC using structure-based pharmacophore models within Discovery Studio. By integrating pharmacophore screening, molecular docking, and rigorous statistical validation, researchers can efficiently prioritize a small number of high-quality lead compounds from millions of candidates for further experimental testing. This computational approach significantly accelerates the early stages of drug discovery.
This application note provides a detailed protocol for a critical step in modern computer-aided drug design: the integration of pharmacophore-based virtual screening with molecular docking and ADMET (Absorption, Distribution, Metabolism, Excretion, and Toxicity) prediction. Employing BIOVIA Discovery Studio (DS) as the unified software platform, this workflow enables the efficient identification of novel hit compounds with desirable biological activity and favorable pharmacokinetic profiles [18] [19]. The methodology outlined here is framed within a broader research context of structure-based pharmacophore generation, leveraging the protein's 3D structure to derive essential interaction features. This integrated approach is designed to significantly accelerate the early drug discovery process for researchers and drug development professionals by prioritizing compounds with a higher probability of success in subsequent experimental assays [38] [39].
The following diagram illustrates the sequential, multi-step workflow for integrating pharmacophore screening, molecular docking, and ADMET analysis. This process efficiently filters large compound libraries to a manageable number of high-quality leads.
Experimental Protocols
Structure-Based Pharmacophore Generation
Objective: To create a 3D pharmacophore model based on the binding site and interaction features of a target protein with a known active ligand [38].
Detailed Methodology:
Protein-Ligand Complex Preparation:
- Obtain the crystal structure of your target protein in complex with a bioactive ligand from the Protein Data Bank (PDB).
- In Discovery Studio, open the PDB file. Use the
Prepare Proteinprotocol to remove water molecules, add hydrogen atoms, correct atom/bond types, and fill in missing amino acid residues [38]. - Perform energy minimization on the complex using the CHARMMM force field to relieve steric clashes [38] [19].
Model Generation:
- Navigate to the
Receptor-Ligand Pharmacophore Generationmodule within Discovery Studio [38]. - Set the
Maximum Pharmacophoresparameter to 10. - Select the six standard pharmacophore features: Hydrogen Bond Acceptor (A), Hydrogen Bond Donor (D), Positive Ionizable (P), Negative Ionizable (N), Hydrophobic (H), and Ring Aromatic (R) [38] [4].
- Set the minimum and maximum number of features to 4 and 6, respectively. Keep all other parameters at their default settings and run the protocol.
- Navigate to the
Model Validation:
- Validate the generated pharmacophore models using a decoy set containing known active and inactive compounds [38].
- Use the
Enrichment Factor (EF)and the Area Under the Receiver Operating Characteristic Curve (AUC) to assess model quality. A reliable model typically has an AUC > 0.7 and an EF value > 2 [38]. - Select the pharmacophore model with the top enrichment factor for the subsequent virtual screening step.
Pharmacophore-Based Virtual Screening
Objective: To screen large commercial chemical databases and filter compounds that match the validated pharmacophore model and drug-likeness rules [38] [39].
Detailed Methodology:
Database Preparation:
- Acquire a database (e.g., ChemDiv, ZINC, MCULE) in a suitable format (e.g., SDF).
- Use the
Prepare LigandsorFilter Ligandsprotocol in DS to remove salts and add hydrogen atoms [38].
Drug-Likeness Filtering:
Pharmacophore Screening:
- Use the
Search 3D Databaseprotocol with the validated pharmacophore model as the query. - Set the
Search ModetoFlexible Searchto account for ligand conformational flexibility. - The output will be a list of compounds that fit the pharmacophore features. These "hits" proceed to molecular docking.
- Use the
Molecular Docking
Objective: To predict the binding pose and affinity of the pharmacophore-screened hits within the protein's active site [38] [40].
Detailed Methodology:
Protein and Ligand Preparation:
- Prepare the protein receptor using the
Define Receptortool in theReceptor-Ligand Interactionsmenu. Add hydrogen atoms and define the binding site using coordinates from the crystal structure or by using theFrom Receptor Cavitiestool [40]. - Prepare the screened hit compounds for docking using the
Prepare Ligandsprotocol to generate 3D conformations and minimize their energy [39].
- Prepare the protein receptor using the
Docking Execution:
- Use a docking protocol such as
LibDockorCDOCKER[19] [40]. - For
LibDock, set theInput Receptorto your prepared protein andInput Ligandsto your hit compounds. Define theInput Site Sphereusing the coordinates and radius of your binding site. - Set the
Docking Preferencesto "User Specified" and adjust parameters likeMax Hits to Save(e.g., 10 per ligand) to manage output size. Run the protocol [40].
- Use a docking protocol such as
Pose Analysis and Selection:
- Analyze the results using the
Analyze Ligand Posesprotocol. This calculates RMSD, identifies hydrogen bonds, and detects van der Waals contacts between the protein and docked ligands [40]. - Visually inspect the top-scoring poses for key interactions (e.g., hydrogen bonds with hinge region residues, hydrophobic contacts). Select the top 10-20 compounds based on a combination of docking score and interaction quality for further analysis.
- Analyze the results using the
In silico ADMET Prediction
Objective: To evaluate the pharmacokinetic and toxicity profiles of the top docked compounds, filtering out those with undesirable properties [38] [39].
Detailed Methodology:
Property Calculation:
- Use the
Calculate Molecular PropertiesorADMET Predictionprotocols in Discovery Studio [38]. - The following key properties should be predicted:
- Use the
Data Interpretation and Filtering:
- Apply standard cut-off values to filter compounds. For example: Solubility level > 3, BBB level < 3, and good intestinal absorption [38].
- Prioritize compounds that show a high probability of good absorption and low toxicity risks. Typically, 2-3 compounds with favorable docking scores and ADMET profiles are selected for final validation.
Data Presentation and Analysis
Quantitative Results from a Representative Study
The table below summarizes key quantitative data from a published study that employed this integrated workflow to identify VEGFR-2/c-Met dual-target inhibitors, demonstrating the filtering efficiency at each stage [38].
Table 1: Virtual Screening Results and Key Properties of Identified Hits
| Step / Compound | Number of Compounds | Key Metric | Value |
|---|---|---|---|
| Initial Library | 1,280,000 | N/A | N/A |
| Post Drug-likeness Filtering | Not Specified | Lipinski & Veber Rules | Applied [38] |
| Post Pharmacophore Screening | Not Specified | Enrichment Factor (EF) | > 2 [38] |
| Post Molecular Docking | 18 | Binding Affinity | Lower than native ligand [38] |
| Final Hits | 2 | Binding Free Energy (MM/PBSA) | Superior to positive control [38] |
| Final Hits | 2 | ADMET Profile | Predicted Result |
| Compound17924 | N/A | Aqueous Solubility | Level 3 [38] |
| Compound17924 | N/A | Hepatotoxicity | Non-toxic [38] |
| Compound4312 | N/A | Aqueous Solubility | Level 3 [38] |
| Compound4312 | N/A | Hepatotoxicity | Non-toxic [38] |
Experimental Validation via Molecular Dynamics
Protocol for Molecular Dynamics (MD) Simulation:
- System Setup: Solvate the protein-ligand complex in an explicit solvent model (e.g., TIP3P water) in a periodic boundary box. Add ions to neutralize the system.
- Simulation Execution: Use the
Dynamics (NAMD)protocol in Discovery Studio. Begin with energy minimization, followed by gradual heating to 310 K and equilibration. Finally, run a production simulation. The 2025 release of DS allows simulation times greater than 200 ns, which is critical for assessing stability [14]. - Trajectory Analysis: Use the
Analyze Trajectoryprotocol to calculate the Root Mean Square Deviation (RMSD) of the protein and ligand, Root Mean Square Fluctuation (RMSF) of residues, and the number of hydrogen bonds over time. This confirms the stability of the binding pose observed in docking [38] [39]. - Binding Free Energy Calculation: Perform MM-PBSA/MM-GBSA calculations using frames from the stabilized MD trajectory to obtain a more reliable estimate of binding affinity, which should corroborate docking results [38] [19].
The Scientist's Toolkit: Research Reagent Solutions
Table 2: Essential Software, Databases, and Tools for the Integrated Workflow
| Item Name | Type | Function in the Protocol | Source / Example |
|---|---|---|---|
| BIOVIA Discovery Studio | Software Suite | Primary platform for all steps: protein prep, pharmacophore modeling, docking, ADMET, and MD simulations [18] [19]. | Dassault Systèmes |
| Protein Data Bank (PDB) | Database | Source for 3D crystal structures of target proteins with resolutions < 2.0 Å, used for structure-based modeling [38]. | RCSB |
| Commercial Compound DBs | Database | Large libraries of purchasable small molecules for virtual screening (e.g., ChemDiv, ZINC, MolPort) [38] [39]. | ChemDiv, MolPort |
| CHARMMM Force Field | Algorithm | Provides parameters for molecular mechanics energy minimization, dynamics, and free energy calculations [38] [19]. | Integrated in DS |
| LibDock / CDOCKER | Algorithm | High-throughput docking algorithm used for pose prediction and scoring of hit compounds [19] [40]. | Integrated in DS |
| Decoy Set (DUD-E) | Database | A set of known active and inactive compounds used to validate the quality and selectivity of pharmacophore models [38]. | DUD-E Website |
| GOLD | Algorithm | Alternative docking program supported in DS for flexible ligand docking with improved torsion sampling [14]. | CCDC / Integrated in DS |
Optimizing Model Performance: Troubleshooting Common Pitfalls and Refining Hypotheses
This application note provides a technical reference for researchers conducting structure-based pharmacophore generation using BIOVIA Discovery Studio. It details common system requirements, library dependencies, and graphics configurations to ensure computational efficiency and project success.
System Requirements and Hardware Configuration
Proper hardware and software configuration is foundational for running Discovery Studio's computationally intensive simulations. The following specifications are critical for optimal performance.
Table 1: BIOVIA Discovery Studio 2025 System Requirements and Recommendations
| Component | Minimum Requirement | Recommended for Structure-Based Design | Details & Rationale |
|---|---|---|---|
| Operating System | Windows 10 (22H2+) / Windows 11 (22H2+) [41] | Windows 11 (22H2+) or Linux Red Hat 8 [14] | Stable, supported OS prevents undocumented behaviors. |
| Memory (RAM) | 16 GB [41] | 32 GB or more | Facilitates handling large protein structures and conformational ensembles. |
| Graphics Card | Dedicated card, 2 GB VRAM, OpenGL 4.6 [41] | NVIDIA Quadro/RTX series, 8 GB VRAM [41] | High VRAM is crucial for GPU-accelerated protocols like Dock Proteins (ZDOCK) and Dynamics (NAMD) [14] [41]. |
| Disk Space | 32 GB [41] | 100+ GB | Accommodates software, large structural databases (e.g., updated PharmaDB), and trajectory files [14]. |
| Key Libraries | Microsoft .NET 8.0, Visual C++ 2022 Redistributable [41] | Pipeline Pilot 2025 (SP1) [14] [21] | Pipeline Pilot is a required component for workflow execution in Discovery Studio 2025 [14]. |
Common Graphics and Library Issues
- Graphics Driver Incompatibility: A prevalent cause of software crashes or failure to launch the visualization window is an outdated or incorrect graphics driver. Ensure you install the latest vendor-certified drivers, especially for NVIDIA GPUs used in Explore Stage simulations [41].
- Missing System Libraries: Instability or failure to start can occur if required runtime libraries, such as the Microsoft .NET Framework or Visual C++ Redistributable, are missing or corrupted. These are often included with the installation but should be verified if issues arise [41].
- Linux-Specific Library Dependencies: For Linux installations, ensure the required system libraries listed in the Discovery Studio system requirements document are present. Recent updates have removed the dependency on
compat-libstdc++-33[14].
Experimental Protocol: Structure-Based Pharmacophore Generation for JAK2 Inhibitors
This protocol outlines the generation and validation of a structure-based pharmacophore model, using Janus kinase 2 (JAK2) as a case study [42]. The workflow is broadly applicable to any target with a known protein-ligand complex structure.
Procedure
Structure Retrieval and Preparation
- Download the crystal structure of your target protein in complex with a high-affinity ligand. For JAK2, the structure with PDB ID 8BXH complexed with momelotinib was used [42].
- Use the Prepare Protein protocol in Discovery Studio. This critical step adds hydrogen atoms, models missing side chains or loops, and assigns correct protonation states at the desired pH.
Pharmacophore Generation (RLIP)
- Launch the Receptor-Ligand Interaction Pharmacophore Generation (RLIPG) module [42].
- Set the prepared protein-ligand complex (e.g., 8BXH) as the input structure.
- Run the protocol. The algorithm will automatically analyze the interaction pattern (e.g., hydrogen bonds, hydrophobic contacts, ionic interactions) between the protein and the co-crystallized ligand and convert them into a 3D pharmacophore hypothesis.
Model Validation
- To assess the model's ability to distinguish active compounds from inactive ones, calculate the Günther-Henry (GH) score [42].
- Decoy Set Generation: Use the DUD-E web server to generate a set of pharmacologically matched decoy molecules (assumed inactives) based on a list of known active compounds [42].
- Virtual Screening Test: Screen the combined set of actives and decoys against your pharmacophore model.
- Calculate GH Score: Use the following formula to compute the GH score, where a value closer to 1 indicates an excellent model [42]:
GH = (1 - (A - Ht)/(A + D - Ht)) * (Ht/A) * (1 - Hf/N)- A: Total number of active compounds in the test set.
- Ht: Number of active compounds correctly retrieved (hits).
- D: Total number of decoy compounds.
- Hf: Number of decoy compounds incorrectly retrieved (false hits).
- N: Total number of compounds screened.
Virtual Screening Application
- Use the validated pharmacophore model as a 3D query to screen large chemical databases like PharmaDB (containing ~240,000 receptor-ligand pharmacophore models) or corporate compound collections [12].
- Compounds that map successfully to the key pharmacophore features are potential hits for further experimental validation.
Table 2: Key Research Reagents and Computational Resources for Structure-Based Pharmacophore Modeling
| Resource / Reagent | Function / Description | Source / Access |
|---|---|---|
| Protein Data Bank (PDB) | Repository for 3D structural data of proteins and nucleic acids, providing the initial protein-ligand complex. | https://www.rcsb.org/ [43] |
| PharmaDB | An extensive database of pre-computed receptor-ligand pharmacophore models within Discovery Studio, used for virtual screening and activity profiling. | Integrated within BIOVIA Discovery Studio [12] |
| scPDB Database | An annotated database of druggable binding sites from the PDB, used to build and update the PharmaDB. | http://bioinfo-pharma.u-strasbg.fr/scPDB [14] |
| Directory of Useful Decoys, Enhanced (DUD-E) | Online tool for generating decoy molecules with similar physicochemical properties but dissimilar 2D topologies to known actives, essential for model validation. | http://dude.docking.org [42] |
| ChEMBL Database | A large-scale bioactivity database containing binding constants and other data for drug discovery, used for sourcing active compounds for validation. | https://www.ebi.ac.uk/chembl/ [42] |
In the field of computational drug discovery, feature selection serves as a critical preprocessing step that directly impacts the performance, interpretability, and generalizability of predictive models. Within the context of structure-based pharmacophore generation using BIOVIA Discovery Studio, proper feature selection methodologies enable researchers to distinguish meaningful molecular interaction patterns from irrelevant noise. The fundamental goal is to identify a subset of molecular descriptors and pharmacophore features that optimally characterize ligand-receptor interactions while avoiding models that are either overly complex (overtrained on noise) or excessively sparse (missing key interactions).
The curse of dimensionality presents a significant challenge in chemoinformatics, where datasets often contain hundreds of molecular features but relatively few observed compounds. As dimensionality increases, models require exponentially more data to maintain accuracy, and irrelevant features can mask meaningful biological signals [44]. Within Discovery Studio's ligand- and pharmacophore-based design module, strategic feature selection enhances virtual screening outcomes, quantitative structure-activity relationship (QSAR) modeling, and lead optimization workflows by focusing computational resources on physiochemically relevant interactions [12].
Theoretical Foundations of Feature Selection Methods
Categorization of Feature Selection Approaches
Feature selection techniques can be broadly classified into three distinct categories, each with characteristic advantages and limitations for pharmacophore modeling:
Filter Methods: These approaches assess feature relevance using statistical measures independent of any machine learning algorithm. Common techniques include correlation coefficients, chi-square tests, mutual information, and ANOVA [44] [45]. For pharmacophore applications, filter methods provide computational efficiency but may overlook feature interactions critical for binding affinity prediction.
Wrapper Methods: These methods evaluate feature subsets by using a specific predictive model to score different combinations. Techniques such as forward selection, backward elimination, and recursive feature elimination (RFE) often yield high-performing feature sets but require substantial computational resources [44] [46]. In Discovery Studio workflows, wrapper methods can optimize feature selection for specific targets but risk overfitting without proper validation.
Embedded Methods: These techniques integrate feature selection directly into the model training process. Algorithms like LASSO (L1 regularization) and tree-based feature importance automatically perform feature selection during model construction [44] [45]. Embedded methods strike a balance between efficiency and performance, making them particularly suitable for high-dimensional pharmacophore datasets.
The Overfitting Problem in Feature Selection
Overfitting occurs when models learn noise and random fluctuations in training data rather than underlying meaningful patterns, leading to poor generalization on unseen data [47]. In pharmacophore modeling, overfitting manifests as feature sets that perfectly explain training compounds but fail to predict activity of new compounds. This problem intensifies with high-dimensional feature spaces and limited training samples, precisely the conditions often encountered in early drug discovery.
The consequences of overfitting during feature selection include inconsistent feature importance rankings, discarding of genuinely relevant features, and selection of irrelevant features that coincidentally correlate with activity in the training set [47]. These issues ultimately compromise model interpretability and predictive utility for lead optimization.
Experimental Protocols for Optimized Feature Selection
Comparative Evaluation of Feature Selection Methods
Table 1: Performance Comparison of Feature Selection Methods on Biomedical Datasets [45]
| Method | Type | Arrhythmia Dataset Accuracy | Oncological Dataset Accuracy | Computational Efficiency |
|---|---|---|---|---|
| BP_ADMM | Embedded | 77% | 100% | Medium |
| LASSO | Embedded | 73% | 98% | High |
| OMP | Embedded | 70% | 95% | High |
| mRMR | Filter | 68% | 92% | Very High |
| ANOVA | Filter | 65% | 90% | Very High |
| Full Feature Set | None | 62% | 85% | N/A |
Protocol 1: Embedded Feature Selection with Sparse Regularization
Objective: Implement LASSO-based feature selection to identify minimal pharmacophore features predictive of binding affinity while avoiding overfitting.
Materials:
- BIOVIA Discovery Studio 2025 [14]
- Curated dataset of ligand-receptor complexes
- PharmaDB database (~41,000 entries) for pharmacophore comparison [14]
Methodology:
- Feature Standardization: Normalize all molecular descriptors and pharmacophore features to zero mean and unit variance
- LASSO Regularization: Apply L1 regularization with coordinate descent optimization to shrink irrelevant feature coefficients to zero
- Parameter Tuning: Optimize regularization strength (λ) via k-fold cross-validation (typically k=5 or k=10)
- Feature Subset Selection: Retain features with non-zero coefficients after convergence
- Model Validation: Assess selected features on held-out test set using ROC-AUC and enrichment factors
Mathematical Formulation: The LASSO optimization problem is formulated as:
Where y represents bioactivity values, X is the feature matrix, β denotes feature coefficients, and λ controls regularization strength [45].
Protocol 2: Filter-Based Preprocessing with Domain Knowledge Integration
Objective: Combine statistical filtering with medicinal chemistry expertise to select pharmacologically relevant features.
Materials:
- Discovery Studio CATALYST Pharmacophore Modeling suite [12]
- Domain knowledge resources (e.g., scPDB, protein-ligand interaction databases)
Methodology:
- Univariate Filtering: Calculate mutual information or Pearson correlation between each feature and bioactivity
- Domain Knowledge Pruning: Remove features inconsistent with established structure-activity relationships
- Redundancy Reduction: Eliminate highly correlated features (r > 0.9) using clustering or principal component analysis
- Multi-Target Profiling: Evaluate feature relevance across related targets using PharmaDB screening [12]
- Consensus Feature Selection: Retain features identified by both statistical and knowledge-based approaches
Protocol 3: Sparse Feature Selection with ADMM Optimization
Objective: Implement Basis Pursuit with Alternating Direction Method of Multipliers (BP_ADMM) for high-dimensional pharmacophore feature selection.
Materials:
- Custom scripting interface in Discovery Studio
- Biomedical dataset with known activity annotations [45]
Methodology:
- Problem Formulation: Configure the Basis Pursuit optimization problem:
Where
tcontrols the sparsity level [45]
ADMM Implementation: Decompose the problem into manageable subproblems using the augmented Lagrangian:
Where
f(β)represents the data fidelity term andg(z)enforces sparsityIterative Optimization:
- β-update: Solve the differentiable optimization subproblem
- z-update: Apply soft thresholding to promote sparsity
- u-update: Update dual variables to enforce consensus
Convergence Checking: Monitor primal and dual residuals until convergence criteria are met
Feature Extraction: Select features corresponding to non-zero coefficients in the solution vector
Implementation Workflows
Integrated Feature Selection Workflow for Pharmacophore Generation
Integrated Feature Selection Workflow for Robust Pharmacophore Models
Overfitting Detection and Prevention Protocol
Overfitting Detection and Prevention Protocol
Table 2: Key Research Reagent Solutions for Feature Selection in Pharmacophore Modeling
| Resource | Function in Feature Selection | Application Context |
|---|---|---|
| BIOVIA Discovery Studio 2025 | Integrated platform for pharmacophore generation and feature analysis | Structure-based pharmacophore modeling with updated PharmaDB [14] |
| PharmaDB Database (~41,000 entries) | Benchmarking feature relevance against known ligand-receptor interactions | Off-target profiling and drug repurposing studies [12] [14] |
| CATALYST Pharmacophore Modeling | Generate and validate 3D pharmacophore hypotheses from ligand/receptor data | Feature space definition for QSAR and virtual screening [12] |
| ADMM Optimization Framework | Efficient solution of sparse feature selection problems | High-dimensional biomarker identification from omics data [45] |
| scPDB Database | Source of diverse protein-ligand complexes for feature validation | Structure-based feature selection with biological relevance [14] |
| Cross-Validation Pipelines | Prevent data leakage and overfitting during feature selection | Robust performance estimation across diverse chemical classes [48] |
Optimizing feature selection represents a critical success factor in structure-based pharmacophore generation using Discovery Studio. Based on experimental evidence and theoretical considerations, the following best practices emerge:
First, combine multiple feature selection approaches rather than relying on a single method. Start with filter methods for efficient dimensionality reduction, followed by embedded methods like BP_ADMM for refined feature selection, and finally apply wrapper methods for target-specific optimization [45] [46]. This hierarchical approach balances computational efficiency with model performance.
Second, integrate domain knowledge throughout the feature selection process. Medicinal chemistry expertise should guide both the initial feature generation and final selection stages, ensuring that selected features align with established structure-activity relationship principles [49]. This practice enhances model interpretability and biological relevance.
Third, implement rigorous validation protocols to detect and mitigate overfitting. Employ nested cross-validation, where the inner loop performs feature selection and the outer loop assesses generalization performance [48]. Additionally, evaluate feature stability across different data splits to identify robust feature sets.
Finally, align feature selection strategy with research objectives. For exploratory studies aiming to identify novel binding patterns, less aggressive feature selection may be appropriate. For development of predictive models with strong generalization, more stringent feature selection combined with regularization typically yields superior results [45] [47].
By implementing these protocols and principles within the Discovery Studio environment, researchers can develop pharmacophore models with optimal complexity that effectively balance predictive accuracy with interpretability and translational potential.
In the realm of structure-based pharmacophore modeling using Discovery Studio, the precision of the resulting hypothesis is paramount for successful virtual screening outcomes. The Principal and MaxOmitFeat attributes are critical parameters within the HipHop algorithm that directly govern this precision by controlling how training set compounds contribute to the common feature pharmacophore generation process [50] [4]. Proper configuration of these parameters allows researchers to encode prior knowledge about the activity and structural characteristics of their training compounds, thereby refining the model's ability to identify the essential spatial features required for biological activity. This application note details the strategic application of these attributes within a structure-based research framework, providing validated protocols to enhance pharmacophore model quality.
Key Attribute Definitions and Functions
Within Discovery Studio's HipHop protocol, the Principal and MaxOmitFeat attributes are assigned to each molecule in the training set to guide the pharmacophore generation process.
- Principal Attribute: This value indicates the activity level or the importance of a compound in the training set.
- A value of 2 denotes a highly active compound that the model should map perfectly.
- A value of 1 indicates a moderately active compound.
- A value of 0 signifies an inactive compound [4].
- MaxOmitFeat Attribute: This parameter specifies the maximum number of pharmacophore features that a compound is allowed to miss while still being considered a "hit" against the model [50]. For a reference compound with high activity (Principal=2), this is typically set to 0, meaning it must map all features of the generated pharmacophore [50].
Experimental Configuration and Data
Strategic Assignment of Attribute Values
The assignment of these parameters should reflect the known structure-activity relationship (SAR) and the research objective. The following table outlines a standard strategic configuration for a training set containing eight diverse S6K1 inhibitors [50]:
Table 1: Example Configuration of Principal and MaxOmitFeat Attributes in a Training Set
| Compound ID | Activity Profile | Principal Value | MaxOmitFeat Value | Rationale |
|---|---|---|---|---|
| A1 | Highly Active Reference | 2 | 0 | Forces model to include all features present in the most active compound. |
| A2 - A8 | Active / Moderately Active | 1 | 1 | Allows model flexibility to identify the most common features. |
This configuration ensures the model encapsulates the critical features of the most potent compound while accommodating structural variations from other active compounds.
Quantitative Impact on Model Generation
The strategic use of these attributes directly influences the output of the common feature pharmacophore generation protocol. The following data, derived from a study generating ten pharmacophore models, summarizes the results when using the configuration detailed in Table 1 [50]:
Table 2: Pharmacophore Model Generation Output and Statistics
| Model Name | Rank Score | Feature Set* | Direct Hit | Partial Hit | Max Fit |
|---|---|---|---|---|---|
| Hypo1 | Highest | A, D, H, R | 11111111 | 00000000 | 4 |
| Hypo2 | ... | ... | ... | ... | ... |
| ... | ... | ... | ... | ... | ... |
| Hypo10 | Lowest | ... | ... | ... | ... |
*Feature Set Legend: A: Hydrogen Bond Acceptor, D: Hydrogen Bond Donor, H: Hydrophobic, R: Ring Aromatic.
The "Direct Hit" column shows a string of ones, indicating that all training set compounds (A1-A8) were successfully mapped to the top model (Hypo1) according to the constraints defined by their Principal and MaxOmitFeat values [50] [4]. The "Max Fit" value of 4 indicates the total number of features in the pharmacophore hypothesis [4].
Detailed Experimental Protocol
Protocol: Setting Principal and MaxOmitFeat Attributes in Discovery Studio
This protocol describes the steps to assign these critical attributes within the Discovery Studio environment [4].
- Load Training Set Compounds: In the file browser, navigate to and open your prepared 3D structure file (e.g.,
.sd) containing the training set ligands. - Add Attribute Columns:
- In the table browser, right-click on a column heading.
- Select
Add Attributes...from the context menu. - In the dialog box, add two new attributes:
PrincipalandMaxOmitFeat.
- Assign Attribute Values:
- For each compound in the table, enter the appropriate integer value based on its role in the training set (refer to Table 1 for guidance).
- Save the modified table.
Protocol: Common Feature Pharmacophore Generation
This protocol follows the parameter setup used in a published S6K1 inhibitor study [50].
- Initiate HipHop Protocol: Navigate to the
Pharmacophoremodule and select theCommon Feature Pharmacophore Generationprotocol (HipHop). - Select Input Ligands: Choose the prepared training set with assigned
PrincipalandMaxOmitFeatvalues. - Define Critical Parameters:
- Run and Analyze: Execute the protocol. Analyze the generated models from the report page, paying attention to the
Rank,Features, andDirect Hitcolumns to select the best model (e.g., Hypo1) [4].
Workflow and Logical Diagrams
The following diagram illustrates the logical decision process for assigning Principal and MaxOmitFeat values and their role in the overall pharmacophore modeling workflow.
Logical Flow for Parameter Assignment
The Scientist's Toolkit: Essential Research Reagents and Software
Table 3: Key Research Reagent Solutions for Structure-Based Pharmacophore Modeling
| Item | Function / Description |
|---|---|
| Discovery Studio (Accelrys) | Software platform containing the HipHop protocol for common feature pharmacophore generation [50] [4]. |
| Protein Data Bank (PDB) File | The experimentally determined (e.g., X-ray) 3D structure of the target protein, which serves as the structural basis for the analysis [50] [51]. |
| Training Set Ligands | A curated set of small molecules with known activity (active, moderately active, inactive) and diverse scaffolds, used to generate the pharmacophore model [50] [52]. |
| Specs/Compound Database | Commercial chemical database (e.g., Specs, ZINC) that is screened using the validated pharmacophore model to identify novel hit compounds [50] [52]. |
In the realm of computer-aided drug design, structure-based pharmacophore generation serves as a powerful method for abstracting critical molecular interactions from a protein-ligand complex into a set of three-dimensional functional features [4] [12]. These features—including hydrogen bond donors (HBD) and acceptors (HBA), hydrophobic centers (H), and positive (PI) or negative (NI) ionizable groups—collectively define the spatial and electronic requirements for a molecule to bind its biological target effectively [4] [8]. However, generating a pharmacophore model is only the first step; rigorously evaluating its quality is equally crucial. Within Discovery Studio software, this evaluation relies heavily on key scoring metrics—Rank, Direct Hit, and Max Fit—which together provide a quantitative framework for assessing model validity and predictive power [4]. Proper interpretation of these scores allows researchers to select the most reliable pharmacophore hypothesis for subsequent virtual screening, thereby increasing the likelihood of identifying novel bioactive compounds in drug discovery campaigns [12] [9].
Core Scoring Metrics and Their Interpretations
The table below defines the key pharmacophore scoring metrics and details their significance in model evaluation.
Table 1: Key Pharmacophore Scoring Metrics in Discovery Studio
| Metric | Definition | Interpretation & Significance | Ideal Outcome |
|---|---|---|---|
| Rank Score | A composite score reflecting the overall quality and rarity of the pharmacophore model [4]. | A higher score indicates a better model. It balances the model's ability to match active training compounds with its complexity and the uniqueness of its feature arrangement [4]. | Maximized value. |
| Direct Hit | A binary string indicating whether the pharmacophore matches all features for each molecule in the training set [4]. | Each digit corresponds to a training set molecule. A '1' signifies a full match; a '0' signifies a failed match. A string of '111111' means all 6 molecules are matched [4]. | A string of all 1s, indicating universal match with active training compounds. |
| Max Fit | The maximum number of pharmacophore features a molecule from the training set can match [4]. | Indicates the completeness of the model. For example, a value of '6' means all 6 defined features in the hypothesis can be matched by a ligand [4]. | A value equal to the total number of features in the model. |
These scores are interdependent. A high Rank Score typically requires a perfect or near-perfect Direct Hit pattern, confirming the model's consistency with known actives [4]. Simultaneously, the Max Fit value ensures the model captures the full complexity of the essential interactions. A model with a high Rank but a low Max Fit might be overly simplistic, potentially leading to the identification of false positives during screening. Conversely, a model with a high Max Fit but a poor Direct Hit rate may be too restrictive, missing valid active compounds [9].
Workflow for Model Generation and Analysis
The following diagram illustrates the standard workflow in Discovery Studio for generating and analyzing common feature pharmacophore models, highlighting the stage at which the key scores are produced.
Workflow for Pharmacophore Analysis
Detailed Experimental Protocol
The process leading to the calculation of these scores follows a structured protocol within Discovery Studio.
Step 1: Training Set Molecular Preparation
- Action: Import a set of active ligand molecules (e.g.,
1A52_ligands.sd). Critically define thePrincipalattribute for each molecule to denote its activity level: 2 for active, 1 for moderately active, and 0 for inactive [4]. - Rationale: The
Principalattribute guides the algorithm to prioritize chemical features common to the most active compounds, forming the basis for a relevant pharmacophore [4].
- Action: Import a set of active ligand molecules (e.g.,
Step 2: Pharmacophore Feature Selection & Model Generation
- Action: Use the
Feature Mappingprotocol (Pharmacophore > Edit and Cluster Features > Feature Mapping) to identify potential chemical features in the training set. Subsequently, run theCommon Feature Pharmacophore Generationprotocol [4]. - Parameters: Under the
Conformation Generationparameter group, select theBESTconformation generation method. Set theMaximum Conformationto 200 and theEnergy Thresholdto 10 to ensure adequate conformational sampling [4]. - Output: The software generates multiple pharmacophore hypotheses (e.g., 10 models), which are automatically ranked [4].
- Action: Use the
Step 3: Result Analysis and Score Interpretation
- Action: In the
Reportbrowser, expand theDetailscolumn to view the results table for all generated models [4]. - Analysis: Refer to Table 1 to interpret the
Rank,Direct Hit, andMax Fitscores. The ranking provides an initial filter, but manual inspection is essential. A model with a high Rank and a perfect Direct Hit (e.g.,111111) should be visually examined to confirm that the mapped features make biological sense within the context of the target's binding site [4] [9].
- Action: In the
Research Reagent Solutions
The table below lists essential computational tools and resources used in structure-based pharmacophore generation and validation.
Table 2: Essential Research Reagents and Tools for Pharmacophore Modeling
| Item/Software | Function in Pharmacophore Modeling | Application Context |
|---|---|---|
| BIOVIA Discovery Studio | An integrated software suite for molecular design and simulation that contains the CATALYST pharmacophore modeling and analysis toolset [12]. | Used to build pharmacophores from ligand sets or protein structures, screen compound databases, and analyze results [4] [12]. |
| PharmaDB | A large-scale database containing approximately 240,000 receptor-ligand pharmacophore models, built and validated using the sc-PDB [12]. | Enables off-target activity profiling and drug repurposing by screening a query molecule against a vast collection of pre-computed models [12]. |
| Validation Database (e.g., DUD.e) | An enhanced database of useful decoys, containing known active compounds and computationally generated inactive "decoy" molecules for a specific target [9]. | Critical for pharmacophore model validation. Used to calculate enrichment factors and AUC values to gauge a model's ability to distinguish actives from inactives [9]. |
| Structure-Based Model Features | The fundamental chemical features (HBD, HBA, H, PI, NI) generated from a protein-ligand complex, often accompanied by exclusion volumes [8] [9]. | Form the core of a structure-based pharmacophore. Exclusion volumes represent regions occupied by the protein, enforcing shape complementarity and improving screening accuracy [9]. |
Advanced Validation and Application
Beyond the immediate scores provided by Discovery Studio, rigorous statistical validation is required to build confidence in a pharmacophore model's predictive ability before its deployment in large-scale virtual screening.
Receiver Operating Characteristic (ROC) Analysis
A robust method for validation involves the use of a test set containing known active compounds and inactive decoys. The model is used to screen this test set, and the results are plotted in a Receiver Operating Characteristic (ROC) curve [8] [9]. The performance is quantified by the Area Under the Curve (AUC).
- AUC Interpretation: An AUC value of 1.0 represents a perfect model, while 0.5 indicates a random classifier. In practice, an AUC value above 0.7 is considered acceptable, with values above 0.8 or 0.9 indicating a good to excellent ability to distinguish active from inactive molecules [8] [9]. For example, a study targeting the XIAP protein reported an outstanding validation AUC of 0.98, demonstrating a highly selective model [9].
Integrated Workflow in Drug Discovery
The ultimate test of a pharmacophore model is its successful application in an integrated drug discovery pipeline, as demonstrated in several recent studies:
Case Study: Targeting PD-L1
- Process: Researchers built a structure-based pharmacophore from the PD-L1 protein (PDB: 6R3K) and used it to screen over 52,000 marine natural products [8].
- Outcome: The initial 12 virtual hits were further filtered by molecular docking and ADMET (Absorption, Distribution, Metabolism, Excretion, and Toxicity) profiling, ultimately identifying a promising lead compound [8]. This showcases how a validated pharmacophore serves as an efficient first filter in a multi-stage screening funnel.
Case Study: Discovering FXR Agonists
- Process: A ligand-based pharmacophore model was generated from known FXR agonists and used for virtual screening [52].
- Outcome: From 18 compounds selected by the model, five showed promising activity in subsequent biological assays, with two emerging as potent leads [52]. This underscores the practical utility of a well-validated model in identifying novel chemical starting points for drug development.
The following diagram illustrates this integrated process, showing the role of pharmacophore scoring and validation within a larger discovery context.
Integrated Drug Discovery Workflow
Best Practices for Manual Optimization of Pharmacophore Features
In the modern computer-aided drug design toolbox, pharmacophores are collections of spatial and electronic features necessary for optimal molecular interactions with a specific biological target [4]. The International Union of Pure and Applied Chemistry (IUPAC) defines a pharmacophore as "the ensemble of steric and electronic features that is necessary to ensure the optimal supramolecular interactions with a specific biological target structure and to trigger (or to block) its biological response" [10]. While automated algorithms in software like Discovery Studio can generate initial pharmacophore hypotheses, these models frequently require expert refinement to achieve reliable predictive performance [4]. Automated generation often produces multiple candidate models ranked by statistical scores, but the highest-ranked model does not always translate to the most biologically relevant one [4]. Manual optimization bridges this gap by incorporating medicinal chemistry intuition, structural biology insights, and an understanding of molecular recognition principles that algorithms may overlook. This process is particularly crucial in structure-based pharmacophore generation, where the model derives from the three-dimensional structure of a macromolecular target or target-ligand complex [10] [9]. Through strategic refinement of feature selection, spatial tolerances, and excluded volumes, researchers can transform a computationally adequate hypothesis into a powerful tool for virtual screening and lead optimization.
Foundational Concepts: From Automated Generation to Expert Refinement
Pharmacophore Feature Types and Their Geometric Representation
A pharmacophore model abstractly represents key molecular interactions as geometric entities rather than specific chemical structures [4] [53]. The most essential feature types include:
- Hydrogen Bond Acceptors (HBA): Represented as vectors and spheres, these features correspond to atoms that can accept hydrogen bonds, typically oxygen or nitrogen atoms with lone electron pairs [10].
- Hydrogen Bond Donors (HBD): Also represented as vectors and spheres, these features represent hydrogen atoms bound to electronegative atoms (typically O or N) that can donate hydrogen bonds [10].
- Hydrophobic Features (H): Represented as spheres, these identify hydrophobic regions of the ligand, often associated with aliphatic or aromatic carbon chains [10].
- Positive/Negative Ionizable Groups (PI/NI): Spheres indicating atoms or groups that can carry positive or negative charges under physiological conditions [10].
- Aromatic Rings (AR): Represented as ring centroids with vector projections, these capture π-π stacking and cation-π interactions [4].
- Exclusion Volumes (XVOL): These "forbidden" areas represent steric constraints from the binding pocket that ligands must avoid, crucial for improving model selectivity [12] [10].
The Initial Model: Interpreting Automated Generation Output
Discovery Studio typically generates multiple pharmacophore hypotheses ranked by a scoring algorithm [4]. For example, in a sample run with six active molecules, the software might generate 10 pharmacophore models ranked according to the matching degree between training set molecules and the model, along with the rarity of the model itself [4]. Critical columns in the results report include:
- Features: The chemical characteristics in the model (e.g., R = aromatic ring center, P = positively charged ion center, H = hydrophobic characteristics, A = hydrogen bond acceptor, D = hydrogen bond donor) [4].
- Rank: The scoring value of the pharmacophore, where higher scores generally indicate better statistical performance [4].
- Direct Hit: The match pattern between the pharmacophore and training set molecules (1 = match, 0 = no match) [4].
- Max Fit: The maximum number of pharmacophore features that can be matched by a molecule [4].
Table 1: Key Parameters in Automated Pharmacophore Generation Output
| Parameter | Description | Interpretation Guide |
|---|---|---|
| Feature Composition | Combination of feature types (e.g., AAHRR) | Models with 4-5 features often provide optimal specificity |
| Rank Score | Numerical score assessing hypothesis quality | Use as initial guide only; always inspect feature geometry |
| Direct Hit | Binary pattern of training set matches (e.g., 111110) | Identify which active compounds are not matched by the model |
| Partial Hit | Number of partially matched features | High partial hits may indicate overly restrictive feature placement |
| Max Fit | Maximum possible feature matches | Values below feature count suggest possible steric clashes |
A model's ranking should not be the sole selection criterion [4]. A systematic evaluation requires visualizing each hypothesis within the context of the binding site, assessing the chemical logic of feature placement, and identifying potential areas for refinement.
Systematic Protocol for Manual Optimization
Model Evaluation and Diagnostic Assessment
Begin optimization by comprehensively evaluating the initial model against both structural and ligand activity data:
Step 1: Binding Site Contextualization
- Load the protein-ligand complex structure in Discovery Studio
- Superimpose the pharmacophore model with the binding site
- Identify discrepancies between feature placement and complementary protein residues
Step 2: Active Ligand Mapping
- Screen all active training compounds against the model
- Identify consistently mismatched features across multiple active ligands
- Note which critical interactions from the binding site are missing from the model
Step 3: Inactive/Decoy Compound Screening
- Test with known inactive compounds or decoy sets
- Identify features that incorrectly match inactive compounds
- Assess exclusion volume placement that may be too restrictive or permissive
Step 4: Feature Necessity Analysis
- Systematically disable individual features and retest with active ligands
- Identify redundant features that don't improve model selectivity
- Note essential features whose removal dramatically reduces active compound recognition
Strategic Feature Modification Techniques
Based on the diagnostic assessment, implement these targeted optimization strategies:
Hydrogen Bond Feature Optimization
- Adjust vector directions to align with protein hydrogen bond partners
- Modify sphere radii based on observed binding geometries (typically 1.0-1.2Å for strong H-bonds)
- Consider converting between donors/acceptors based on protein residue properties
Hydrophobic Feature Refinement
- Consolidate multiple small hydrophobic zones into larger, more representative features
- Adjust placement to center on clustered hydrophobic ligand atoms
- Ensure appropriate representation of aromatic systems versus aliphatic chains
Charge Feature Calibration
- Verify ionization states under physiological conditions
- Adjust tolerance radii based on electrostatic potential maps
- Consider distance constraints to other features to improve specificity
Exclusion Volume Optimization
- Add exclusion volumes near protein side chains that protrude into binding cavity
- Remove exclusion volumes that prevent legitimate ligand binding conformations
- Adjust radius based on observed ligand van der Waals contacts
Table 2: Manual Optimization Strategies for Common Pharmacophore Issues
| Problem Identified | Optimization Strategy | Expected Outcome |
|---|---|---|
| Active compounds not matching | Adjust feature tolerances; Add missing critical features | Improved sensitivity for known actives |
| Inactive compounds matching | Add exclusion volumes; Restrict feature definitions | Improved specificity and reduced false positives |
| Overly rigid alignment | Relax distance constraints; Modify vector directions | Better accommodation of structurally diverse actives |
| Limited predictive value | Incorporate key water-mediated interactions; Add shape constraints | Enhanced screening enrichment and scaffold hopping capability |
Validation and Iterative Refinement
After implementing optimization changes, conduct rigorous validation:
Step 1: Training Set Validation
- Re-test with all training compounds
- Quantify improvement using fit values and alignment quality
- Ensure the model still recognizes all critical active compounds
Step 2: Test Set Validation
- Screen against a separate set of known actives and inactives
- Calculate enrichment factors and statistical performance metrics
- Compare against the original model performance
Step 3: Structural Validation
- Verify all features have structural justification from the protein binding site
- Ensure no important protein-ligand interactions are missing
- Confirm exclusion volumes accurately represent binding site topography
This process typically requires 3-5 iterations to achieve optimal performance, balancing sensitivity for active compounds with specificity against inactive molecules.
Experimental Workflow and Visualization
The complete workflow for manual pharmacophore optimization follows a systematic cycle of evaluation, modification, and validation:
Diagram 1: Manual Pharmacophore Optimization Workflow
Research Reagent Solutions
Table 3: Essential Research Reagent Solutions for Pharmacophore Optimization
| Reagent/Resource | Function in Optimization Process | Implementation in Discovery Studio |
|---|---|---|
| Curated Training Set | Provides diverse active ligands for model validation and refinement | Use to calculate Direct Hit and Partial Hit scores in model evaluation |
| Decoy Compound Sets | Tests model specificity and reduces false positive rates | Apply enhanced Database of Useful Decoys (DUD-E) for rigorous validation [9] |
| Protein Data Bank Structures | Enables structure-based feature validation and exclusion volume placement | Import PDB files (e.g., 5OQW) to generate structure-based pharmacophores [9] |
| ZINC Database Subsets | Supplies purchasable compounds for virtual screening validation | Screen natural compound libraries (e.g., Ambinter) for lead identification [9] |
| LigandScout Software | Complementary tool for analyzing protein-ligand interaction features | Compare features generated automatically with manually optimized features |
Manual optimization represents the critical bridge between computationally generated pharmacophore hypotheses and biologically relevant screening tools. Through systematic evaluation, strategic feature modification, and rigorous validation, researchers can significantly enhance model performance for virtual screening applications. The process requires both computational expertise and medicinal chemistry intuition, focusing on aligning abstract feature definitions with physical molecular recognition principles. When properly executed, manual optimization yields pharmacophore models with improved enrichment factors, better scaffold hopping capability, and ultimately, greater success in identifying novel bioactive compounds in virtual screening campaigns.
Ensuring Predictive Power: Model Validation, Comparison with Ligand-Based Approaches, and Real-World Applications
In the field of computer-aided drug design, the generation of structure-based pharmacophores using tools like BIOVIA Discovery Studio is a critical step for identifying potential hit compounds [12]. However, the predictive performance and robustness of these pharmacophore models are entirely dependent on rigorous statistical validation. Without proper validation, researchers risk pursuing false leads, wasting valuable resources on experimental follow-up for models that do not generalize beyond their training parameters. This application note details the essential statistical validation methodologies—Receiver Operating Characteristic (ROC) curves, Area Under the Curve (AUC) values, and Enrichment Factors (EF)—within the context of Discovery Studio workflows. We provide structured protocols and quantitative frameworks to empower researchers to confidently assess the discriminatory power and early enrichment capability of their pharmacophore models, ensuring that only the most promising models proceed to costly experimental stages.
The Statistical Validation Toolkit
Theoretical Foundations of Key Metrics
ROC Curves and AUC: The ROC curve is a fundamental tool for evaluating the performance of binary classifiers across all possible classification thresholds [54]. It plots the True Positive Rate (TPR or Sensitivity) against the False Positive Rate (FPR) at various threshold settings [55]. The Area Under the ROC Curve (AUC) provides a single scalar value summarizing the model's overall ability to discriminate between positive and negative instances [54]. An AUC of 1.0 represents a perfect classifier, while an AUC of 0.5 indicates performance no better than random guessing [55]. A key advantage of AUC is its threshold independence, offering a comprehensive view of model performance that is not tied to a single, arbitrarily chosen operating point [54].
Enrichment Factors (EF): While AUC gives a global performance measure, the Enrichment Factor is a critical metric for early recognition, which is paramount in virtual screening. EF quantifies the model's ability to prioritize and "enrich" active compounds at the top of a ranked list compared to a random selection. It is typically calculated at a specific fraction of the screened database (e.g., EF1% or EF5%) and provides a direct measure of a model's utility in practical screening scenarios where only a small fraction of the top-ranked compounds will be selected for experimental testing.
Quantitative Benchmarks and Data Ranges
The expected performance of predictive models can vary significantly. The table below summarizes benchmark values for the key validation metrics discussed, drawing from empirical studies.
Table 1: Performance Benchmarks for Classification and Virtual Screening Models
| Metric | Value Range | Performance Interpretation | Context & Notes |
|---|---|---|---|
| AUC | 0.9 - 1.0 | Excellent Discriminatory Power | Indicates a model with high ability to distinguish between classes [54]. |
| 0.8 - 0.9 | Very Good Discriminatory Power | A common target for robust predictive models. | |
| 0.7 - 0.8 | Good Discriminatory Power | Useful model, but may require further refinement [56]. | |
| 0.5 - 0.7 | Poor to Random Discriminatory Power | Model is not reliable for prediction. | |
| Between-Study AUC SD (τ) | ~0.12 | Estimated Heterogeneity | Represents irreducible uncertainty in external validation performance; models should be validated across multiple settings [56]. |
| Enrichment Factor (EF) | >> 1 | Significant Early Enrichment | The higher the EF, the better the model is at prioritizing actives in virtual screening. |
Experimental Protocols for Validation
Protocol 1: ROC Curve and AUC Validation for a Pharmacophore Model
This protocol outlines the steps to validate a generated pharmacophore model using ROC and AUC analysis within a Discovery Studio environment.
1. Hypothesis Generation & Database Preparation: - Generate a structure-based pharmacophore model using the Receptor-Ligand Pharmacophore Generation module in Discovery Studio, typically from a protein-ligand complex (e.g., PDB ID: 3G0E or 4U0I) [36]. Key features often include Hydrogen Bond Acceptor (HBA), Hydrogen Bond Donor (HBD), and Hydrophobic (HY) regions [36] [57]. - Prepare a decoy set containing known active compounds and a large number of presumed inactive molecules. The ZINC database is a common source for such compounds [58] [57]. - Generate multiple conformations for each molecule in the database to ensure comprehensive coverage during the screening process [12].
2. Virtual Screening & Score Calculation: - Use the Ligand Pharmacophore Mapping protocol in Discovery Studio to screen the prepared database against your pharmacophore model [58] [57]. - For each molecule, the primary output is a Fit Value, which quantifies how well the molecule's features align with the pharmacophore hypothesis [57].
3. ROC/AUC Calculation & Visualization: - Rank all molecules in the database based on their Fit Value in descending order. - At multiple intervals down this ranked list, calculate the True Positive Rate (Sensitivity) and False Positive Rate (1 - Specificity). Use the known active/inactive labels as the ground truth. - Plot the TPR against the FPR to generate the ROC curve. The AUC can be computed using numerical integration methods, such as the trapezoidal rule [54]. - Discovery Studio does not always compute AUC directly, so data can be exported and analyzed using statistical software or programming languages (e.g., Python with scikit-learn).
Diagram: Workflow for Pharmacophore Validation using ROC/AUC
Protocol 2: Calculating Enrichment Factors
The Enrichment Factor provides a tangible measure of how much better your model is than random screening at finding active compounds in the top fraction of the ranked list.
1. Run Virtual Screening: Follow steps 1 and 2 from Protocol 1 to generate a ranked list of compounds.
2. Define the Early Recognition Threshold: Common thresholds are 1% or 5% of the total database size.
3. Calculate Enrichment Factor: - Count the number of known active compounds found within the top X% of the ranked list. - The EF at X% is calculated using the formula below, which compares the observed hit rate to the expected random hit rate.
Formula: [ EF_{X\%} = \frac{\text{(Number of actives in top X\%)} / \text{(Total compounds in top X\%)}}{\text{(Total actives in database)} / \text{(Total compounds in database)}} ]
Table 2: The Scientist's Toolkit: Essential Research Reagents & Software
| Item Name | Function / Utility | Example Source / Implementation |
|---|---|---|
| BIOVIA Discovery Studio | Integrated platform for pharmacophore generation (e.g., CATALYST, CBP algorithm), ligand mapping, and virtual screening [12] [36]. | Dassault Systèmes |
| Protein Data Bank (PDB) | Source for 3D crystal structures of target proteins, which serve as the starting point for structure-based pharmacophore modeling [36]. | RCSB PDB (www.rcsb.org) |
| ZINC Database | Publicly available database of commercially available compounds for virtual screening; used as a source for active and decoy molecules [58] [57]. | University of California, San Francisco |
| LUDI Module | A tool within Discovery Studio for receptor-based pharmacophore generation by identifying key interaction sites (HBA, HBD, hydrophobic) in a protein binding pocket [57]. | BIOVIA Discovery Studio |
| scikit-learn | Open-source Python library used for calculating ROC curves and AUC values when external statistical analysis is required [54]. | Python Package |
Integrated Validation Workflow
For a comprehensive assessment, ROC/AUC and EF should be used together. The diagram below illustrates the logical relationship between these metrics and the overall validation process.
Diagram: Integrated Model Validation Logic
A model with a high AUC but a low early EF may be a good classifier overall but is suboptimal for virtual screening where resources are limited. Conversely, a model with a high early EF is extremely valuable for practical drug discovery, even if its overall AUC is only good, as it efficiently prioritizes the most promising candidates for further investigation. By applying these protocols in tandem, researchers can make robust, data-driven decisions on which pharmacophore models warrant progression in the drug discovery pipeline.
Decoy Set Validation Using Enhanced Databases of Useful Decoys (DUDe)
In the field of computer-aided drug design (CADD), the evaluation of virtual screening (VS) methods is a critical step prior to their application in prospective drug discovery campaigns. Such evaluation relies on benchmarking datasets composed of known active compounds and presumed inactive molecules, known as "decoys" [59]. The careful selection of these decoys is paramount; an improperly constructed dataset can lead to biased assessments and an overestimation of a method's performance [59]. The Database of Useful Decoys: Enhanced (DUD-E) was developed to meet this need, providing a publicly available resource designed to minimize inherent biases and offer a rigorous standard for benchmarking molecular docking programs and other VS protocols [60]. Within the context of structure-based pharmacophore generation using tools like BIOVIA Discovery Studio, the use of a validated decoy set such as DUD-E is indispensable for pharmacophore model validation, ensuring that the model possesses a genuine ability to discriminate active ligands from inactive molecules [9]. This application note details the integration of DUD-E into the workflow for validating structure-based pharmacophore models.
DUD-E is an enhanced and rebuilt version of the original Directory of Useful Decoys (DUD). It is designed to help benchmark molecular docking programs by providing challenging decoys that are physically similar but topologically dissimilar to known active compounds [60].
Key Features and Composition
The database contains a substantial collection of targets and compounds, meticulously curated to support robust virtual screening evaluation. Table 1 summarizes the quantitative data and key characteristics of the DUD-E database.
Table 1: Composition and Key Metrics of the DUD-E Database
| Component | Description | Scale/Quantity |
|---|---|---|
| Active Compounds | Known ligands with reported affinities against specific targets. | 22,886 compounds across 102 targets (avg. 224 ligands/target) [60] |
| Decoy Compounds | Presumed inactive molecules with similar physicochemical properties but dissimilar 2D topology to actives. | 50 decoys per active compound [60] |
| Decoy Selection Criteria | Matched on molecular weight, logP, hydrogen bond donors/acceptors. Minimized topological similarity (Tanimoto coefficient < 0.9 using ECFP_4 fingerprints) to reduce "artificial enrichment" [59]. | |
| Primary Application | Benchmarking virtual screening methods, including structure-based pharmacophore model validation [9]. | |
| Availability | Free to use, provided by the Irwin and Shoichet Laboratories at UCSF. Available at: https://dude.docking.org/ [60] |
The Importance of Rigorous Decoys in Pharmacophore Validation
Early benchmarking databases often used decoys selected randomly from large chemical directories. This approach introduced a significant bias because the decoy compounds frequently differed substantially from the active ligands in their basic physicochemical properties (e.g., molecular weight, polarity). VS methods could then achieve artificially high enrichment simply by discriminating based on these property differences, rather than identifying genuine bioactivity [59]. DUD-E addresses this by ensuring that decoys are "property-matched but topology-mismatched" to the active ligands. This design forces VS methods, including pharmacophore models, to recognize specific, topology-driven interactions critical for binding, thereby providing a more realistic and challenging assessment of their performance [60] [59].
Experimental Protocol: Validating a Structure-Based Pharmacophore Model with DUD-E
The following protocol describes the steps to validate a structure-based pharmacophore model using a decoy set from DUD-E, a critical process to confirm the model's ability to distinguish true actives from inactive compounds before its use in prospective virtual screening [9].
The diagram below illustrates the logical flow and key steps involved in the pharmacophore validation process using DUD-E.
Step-by-Step Methodology
Step 1: Generate the Structure-Based Pharmacophore Model
- Objective: Create a pharmacophore hypothesis from a protein-ligand complex.
- Procedure:
- Obtain a 3D crystal structure of the target protein in complex with a bioactive ligand from the Protein Data Bank (e.g., PDB ID: 5OQW for XIAP protein) [9].
- Prepare the protein structure using a tool like the "Protein Preparation" module in BIOVIA Discovery Studio. This typically involves:
- Removing water molecules.
- Adding hydrogen atoms and optimizing the side-chain conformations of amino acid residues.
- Modeling missing loops.
- Performing energy minimization using a force field like CHARMm [36].
- Submit the prepared protein-ligand complex to the "Receptor–Ligand Pharmacophore Generation" module in Discovery Studio [36].
- Define the key chemical features for the model. Common features include:
- Hydrogen Bond Acceptor (HBA)
- Hydrogen Bond Donor (HBD)
- Hydrophobic (HY)
- Positive Ionizable (P)
- Aromatic Ring (R) [36]
- Generate the model and note the spatial arrangement and tolerance radii of the selected features.
Step 2: Retrieve the Active and Decoy Set from DUD-E
- Objective: Acquire a validated set of actives and decoys for your specific target protein.
- Procedure:
- Access the DUD-E website at https://dude.docking.org/ [60].
- Identify your target protein of interest from the list of over 102 available targets.
- Download the file containing the known active compounds for the target.
- Download the corresponding file containing the decoy molecules. DUD-E provides 50 decoys for each active compound [60].
- (Optional) For newer research, consider checking the updated DUDE-Z database, also available from the Shoichet Laboratory [60].
Step 3: Prepare the Combined Screening Database
- Objective: Create a unified database for the virtual screening validation experiment.
- Procedure:
- Convert the structures of the active compounds and decoys from the DUD-E download into a 3D format compatible with your screening software (e.g., Discovery Studio).
- Generate multiple low-energy conformations for each molecule to account for flexibility during the pharmacophore mapping process [61].
- Merge the active and decoy compounds into a single database file. Ensure that the activity status (active or decoy) of each molecule is retained as metadata for subsequent analysis.
Step 4: Perform Virtual Screening with the Pharmacophore Model
- Objective: Screen the combined database to identify compounds that match the pharmacophore hypothesis.
- Procedure:
- Use the "Search 3D Database" or equivalent module in Discovery Studio, with your generated pharmacophore as the query [12].
- Set the screening parameters, such as the maximum number of omitted features and conformational search options.
- Execute the screening run against the combined database of actives and decoys.
- The output will be a list of "hits" – compounds that match the pharmacophore query – along with their fit values.
Step 5: Analyze Screening Performance and Validate the Model
- Objective: Quantitatively assess the model's ability to enrich active compounds over decoys.
- Procedure:
- Based on the screening results, classify each molecule in the database as a True Positive (TP, active and retrieved), False Positive (FP, decoy and retrieved), True Negative (TN, decoy and not retrieved), or False Negative (FN, active and not retrieved).
- Calculate key performance metrics:
- Enrichment Factor (EF): Measures how much better the model is at finding actives compared to random selection. An EF1% (enrichment in the top 1% of the screened list) of 10.0 is considered excellent [9].
- Receiver Operating Characteristic (ROC) Curve: A plot of the true positive rate against the false positive rate.
- Area Under the ROC Curve (AUC): A single value representing the overall quality of the model. A perfect model has an AUC of 1.0, while a random model has an AUC of 0.5. An AUC value of 0.98 demonstrates an outstanding ability to distinguish actives from decoys [9].
- Interpretation: A validated pharmacophore model will show a strong early enrichment (high EF1%) and a high AUC value, confirming its utility for prospective virtual screening.
Table 2: Key Resources for Decoy-Assisted Pharmacophore Validation
| Resource / Reagent | Function in Validation Protocol | Example / Source |
|---|---|---|
| DUD-E Database | Provides benchmark sets of confirmed active compounds and property-matched decoy compounds for a wide range of protein targets. | Shoichet Laboratory, UCSF [60] |
| BIOVIA Discovery Studio | Integrated software suite for structure-based pharmacophore generation, virtual screening, and results analysis. | Dassault Systèmes [36] [12] |
| Protein Data Bank (PDB) | Repository for 3D structural data of proteins and protein-ligand complexes, used as the starting point for structure-based pharmacophore modeling. | www.rcsb.org [36] |
| ZINC Database | A freely available database of commercially available compounds, often used for prospective virtual screening after model validation. | zinc.docking.org [9] |
| LigandScout | Advanced software for structure- and ligand-based pharmacophore modeling, used in validation studies as referenced in literature [9]. | Intel:Ligand [9] |
Integrating the DUD-E database into the development workflow of structure-based pharmacophore models is a critical practice for ensuring methodological rigor. By providing a stringent test using carefully designed decoys, DUD-E enables researchers to move beyond simple feature mapping and quantitatively demonstrate that a model can genuinely recognize key interaction patterns specific to active ligands. This validation step, achievable through the protocol outlined herein, significantly increases confidence in a pharmacophore model's predictive power before its application in costly and time-consuming experimental screening efforts.
In the realm of computer-aided drug design (CADD), pharmacophore modeling serves as a pivotal technique for identifying novel therapeutic candidates by mapping the essential steric and electronic features required for molecular recognition by a biological target [62]. The International Union of Pure and Applied Chemistry (IUPAC) defines a pharmacophore as "the ensemble of steric and electronic features that is necessary to ensure the optimal supramolecular interactions with a specific biological target and to trigger (or block) its biological response" [63] [62]. Two principal methodologies have emerged for developing these models: structure-based pharmacophore modeling, which derives features directly from the target protein's three-dimensional structure, and ligand-based pharmacophore modeling, which inferes critical features from a set of known active ligands [63]. This analysis provides a comprehensive comparison of these complementary approaches, framed within the context of their implementation in Discovery Studio, to guide researchers in selecting and applying the optimal strategy for their drug discovery pipelines.
Theoretical Foundations and Methodologies
Structure-Based Pharmacophore Modeling
The structure-based approach relies on the availability of the target's 3D structure, obtained through experimental methods like X-ray crystallography, NMR spectroscopy, or Cryo-Electron Microscopy, or through computational techniques such as homology modeling or machine learning-based predictions like AlphaFold2 [64] [63]. The foundational premise is that analyzing the ligand-binding site of the target protein allows for the direct identification of key interaction points—such as hydrogen bond donors/acceptors, hydrophobic patches, and charged regions—which are then translated into pharmacophoric features [63] [65].
The typical workflow within Discovery Studio involves several critical steps, as exemplified by a recent study identifying PAD2 inhibitors [65]:
- Protein Preparation: The target structure is prepared by correcting protonation states, adding missing hydrogen atoms, and optimizing the geometry.
- Binding Site Identification: The ligand-binding site is characterized using tools like the "Receptor-Ligand Interactions" module, which analyzes interaction points.
- Feature Generation: Pharmacophore features (e.g., Hydrogen Bond Donor (HBD), Hydrogen Bond Acceptor (HBA), Hydrophobic (Hy)) are generated based on the interaction map.
- Feature Selection: The most relevant features for bioactivity are selected to create the final pharmacophore hypothesis, which can be further refined by adding exclusion volumes to represent the receptor's shape and steric constraints [63] [65].
Ligand-Based Pharmacophore Modeling
In the absence of a known 3D protein structure, the ligand-based approach constructs a pharmacophore model by identifying the common chemical features and their spatial arrangement shared among a set of known active ligands [63]. This method is grounded in the concept that molecules binding to the same biological target and eliciting a similar effect must share a common pharmacophore [66].
The standard methodology involves:
- Ligand Data Curation: Assembling a set of structurally diverse ligands with experimentally determined biological activities and ensuring data quality.
- Conformational Analysis: Generating a representative set of low-energy conformations for each ligand to account for flexibility.
- Common Feature Identification: Using algorithms to ascertain the 3D arrangement of chemical features common to all or most active molecules. Discovery Studio's CATALYST module (HypoGen algorithm) is often employed for this purpose, which can also develop quantitative models correlating feature arrangement with activity levels [12].
- Model Validation: Validating the model using statistical methods and external test sets to ensure its predictive power and robustness [66].
Comparative Analysis: Strengths and Limitations
The choice between structure-based and ligand-based pharmacophore modeling is dictated by available data, project goals, and inherent methodological trade-offs. The table below summarizes the core strengths and limitations of each approach.
Table 1: Core Strengths and Limitations of Structure-Based and Ligand-Based Pharmacophore Modeling
| Aspect | Structure-Based Pharmacophore Modeling | Ligand-Based Pharmacophore Modeling |
|---|---|---|
| Data Requirement | 3D structure of the target protein (experimental or high-quality homology model) [63]. | Set of known active ligands with diverse structures and measured biological activities [63]. |
| Key Strength | Identifies novel chemotypes and scaffold hops by focusing on receptor constraints, not ligand scaffolds [63] [65]. | Does not require protein structural data, making it widely applicable [63]. |
| Key Limitation | Dependent on the quality and resolution of the protein structure; may not account for protein flexibility [63] [62]. | Requires a sufficiently large and diverse set of active ligands to generate a meaningful model [63]. |
| Handling of Novelty | Can propose active molecules completely different from known ligands, ideal for de novo design [67] [63]. | Biased towards chemical features present in the training set; less effective for discovering novel scaffolds [63]. |
| Inclusion of Constraints | Can incorporate exclusion volumes to represent the shape of the binding pocket, improving specificity [63] [65]. | Lacks inherent information about the binding site's shape, potentially leading to false positives that sterically clash with the receptor [62]. |
| Informativeness | Provides direct insight into protein-ligand interactions, aiding in understanding binding mechanisms [65]. | Infers the pharmacophore indirectly; does not explain the structural basis of binding [66]. |
Workflow and Logical Relationships
The following diagram illustrates the fundamental data requirements, core processes, and primary outputs that differentiate the two pharmacophore modeling approaches.
Application Notes and Protocols
Protocol for Structure-Based Pharmacophore Generation using Discovery Studio
This protocol details the steps for generating a structure-based pharmacophore model, based on the methodology successfully used to identify novel PAD2 inhibitors [65].
Objective: To create a validated structure-based pharmacophore hypothesis for virtual screening. Software: BIOVIA Discovery Studio [12] [65]. Required Materials: Table 2: Key Research Reagent Solutions for Structure-Based Modeling
| Reagent / Tool | Function / Description |
|---|---|
| Protein Data Bank (PDB) | Source for the 3D structure of the target protein (e.g., PDB ID: 4N2C for PAD2) [65]. |
| Discovery Studio - Protein Preparation Tool | Prepares the protein structure by adding hydrogen atoms, assigning charges, and optimizing hydrogen bonding [65]. |
| Discovery Studio - Receptor-Ligand Pharmacophore Generation | Module that automatically generates pharmacophore hypotheses based on protein-ligand interactions using a Genetic Function Approximation (GFA) technique [65]. |
| Decoy Set (e.g., DUD-E) | A set of known inactive molecules used to validate the model's ability to distinguish actives from inactives [65]. |
| Virtual Screening Database (e.g., ZINC15, DrugBank) | Large collections of compounds for screening against the pharmacophore model [65]. |
Step-by-Step Workflow:
Target Preparation:
- Retrieve the 3D structure of the target protein (e.g., from the PDB).
- In Discovery Studio, use the "Protein Preparation" tool. Add hydrogen atoms, assign protonation states at physiological pH (e.g., for key residues like His, Asp, Glu), and correct any missing residues or atoms.
- Perform energy minimization to relieve steric clashes and optimize the structure.
Binding Site Definition and Analysis:
- If a co-crystallized ligand is present, define the binding site based on its coordinates. Alternatively, use binding site detection tools like "Define and Edit Binding Site" to identify potential cavities.
- Analyze the binding site to understand key residues and potential interaction points.
Pharmacophore Hypothesis Generation:
- Use the "Receptor-Ligand Pharmacophore Generation" protocol in Discovery Studio.
- Input the prepared protein and, if available, a bound ligand in its bioactive conformation.
- Set parameters for feature generation. The study on PAD2 inhibitors used features like Hydrogen Bond Donor (HBD), Hydrogen Bond Acceptor (HBA), and Hydrophobic (Hy), with modified distances for optimal results (e.g., Max H-bond distance: 3.7 Å) [65].
- Run the protocol to generate multiple pharmacophore hypotheses.
Hypothesis Selection and Validation:
- Select the best model based on selectivity scores and visual inspection. For example, the 'Pharm_01' model for PAD2 had a selectivity score of 10.485 and consisted of three HBD and two Hy features (DDDHH) [65].
- Validate the model rigorously. Use a decoy set method, containing known active and inactive molecules, to calculate enrichment factors and generate a Receiver Operating Characteristic (ROC) curve. A high area under the curve (AUC), such as 0.972 reported for the PAD2 model, indicates excellent discriminatory power [65].
Protocol for Ligand-Based Pharmacophore Generation using Discovery Studio
Objective: To develop a quantitative pharmacophore model from a set of ligands with known activity. Software: BIOVIA Discovery Studio with the CATALYST module [12]. Required Materials:
- A curated set of ligands (typically 20-50 compounds) with consistent experimental biological activity data (e.g., IC₅₀, Ki).
- Discovery Studio - CATALYST/Conformation Generation protocol.
- Discovery Studio - HypoGen algorithm.
Step-by-Step Workflow:
Ligand Preparation and Conformational Analysis:
- Sketch or import the 2D structures of known active and inactive ligands.
- Generate 3D structures and produce a representative set of conformers for each ligand using the "CATALYST Conformation Generation" protocol. Ensure the maximum number of conformers and energy threshold are set to adequately capture the conformational space.
Common Features Pharmacophore Generation:
- Use the "HypoGen" algorithm within the CATALYST component.
- Input the training set ligands along with their activity values.
- The algorithm will generate multiple quantitative pharmacophore hypotheses that correlate the spatial arrangement of features with the level of activity.
Model Validation:
- Assess the statistical significance of the generated hypotheses (e.g., cost analysis, correlation coefficient).
- Use the model to predict the activity of a test set of molecules not used in model generation.
- Validate the model's predictive power by comparing experimental versus predicted activities for the test set.
Integrated Applications in Drug Discovery
The true power of pharmacophore modeling is realized when it is integrated into a larger drug discovery workflow, often in conjunction with other computational techniques.
Virtual Screening: Both structure-based and ligand-based models are extensively used as queries to rapidly screen millions of compounds in virtual libraries (e.g., ZINC, DrugBank) [63] [65]. This prioritizes a manageable number of hits for further experimental testing, dramatically reducing time and cost [67] [63].
Lead Optimization: Pharmacophore models can guide the rational optimization of lead compounds by highlighting which chemical features are critical for activity and which regions of the molecule can be modified [67] [62].
Scaffold Hopping: Pharmacophores, particularly structure-based ones, are excellent tools for scaffold hopping. By searching for molecules that match the essential feature arrangement but possess a different molecular backbone, researchers can discover novel chemotypes with improved properties or to circumvent existing patents [67] [63].
Synergy with Molecular Docking: A common and powerful strategy is to use pharmacophore-based virtual screening as an initial filter to reduce the chemical space, followed by more computationally intensive molecular docking of the hits to refine the selection and predict binding poses [65] [62]. This hybrid approach leverages the strengths of both techniques.
Structure-based and ligand-based pharmacophore modeling are two indispensable, complementary methodologies in the modern computational drug discovery toolkit. The choice between them is not a matter of superiority but of context. Structure-based modeling is the method of choice when a reliable protein structure is available, offering unparalleled insights into binding mechanisms and a high potential for discovering novel scaffolds. Ligand-based modeling provides a powerful alternative when structural data on the target is lacking, leveraging the information embedded in known active compounds.
As evidenced by successful applications in Discovery Studio, such as the identification of PAD2 inhibitors, a well-executed pharmacophore modeling campaign can significantly accelerate the early drug discovery pipeline [65]. The future utility of these approaches will be further enhanced by their continued integration with machine learning, advanced molecular dynamics simulations for accounting flexibility, and their expanding application to challenging targets like protein-protein interactions [20] [62].
The X-linked inhibitor of apoptosis protein (XIAP) is a critical regulator of programmed cell death and a promising therapeutic target in oncology. As a key member of the inhibitor of apoptosis protein (IAP) family, XIAP directly neutralizes caspase-3, caspase-7, and caspase-9, effectively blocking apoptosis execution and contributing to treatment resistance in various cancers [68] [9]. The overexpression of XIAP is frequently observed in malignant cells, including melanoma and hepatocellular carcinoma, where it correlates with poor prognosis and diminished response to conventional therapies [68] [9]. This overexpression enables cancer cells to evade drug-induced death, representing a significant obstacle in chemotherapy.
Current approaches to targeting XIAP, including antisense technology and SMAC-mimetics, have faced challenges in clinical development due to issues such as neurotoxicity or limited efficacy [9]. Natural compounds offer a promising alternative source for XIAP inhibitors due to their structural diversity and potentially favorable toxicity profiles compared to synthetic drugs [69] [70]. The integration of computational drug design methods, particularly structure-based pharmacophore modeling using BIOVIA Discovery Studio, provides an efficient strategy for identifying novel natural product-derived XIAP inhibitors with optimized binding characteristics and reduced adverse effects [12] [9].
Computational Methodology and Workflow
Structure-Based Pharmacophore Generation
The structure-based pharmacophore modeling process begins with the preparation of the target protein structure. For XIAP, the crystal structure (PDB: 5OQW) in complex with a known inhibitor provides the foundation for model development [9]. Using BIOVIA Discovery Studio, the following steps are executed:
- Protein Preparation: The crystal structure is processed by removing water molecules, adding hydrogen atoms, optimizing side-chain conformations, and modeling missing loops using the "Protein Prepare" module. The prepared structure then undergoes energy minimization using the CHARMm forcefield [36] [9].
- Binding Site Analysis: The enzymatic cavity of XIAP, particularly the BIR2 domain responsible for caspase-3 and caspase-7 inhibition, is defined as the binding site for pharmacophore generation.
- Pharmacophore Feature Generation: The "Receptor-Ligand Pharmacophore Generation" module in Discovery Studio is employed to identify critical chemical features from the protein-inhibitor complex. The model incorporates hydrogen bond acceptors (HBA), hydrogen bond donors (HBD), hydrophobic features (HY), and exclusion volumes to define the essential interactions for XIAP binding [36] [9].
The resulting pharmacophore model typically contains multiple features that corroborate with XIAP's binding site characteristics. Analysis of one successful model revealed 14 chemical features: four hydrophobic interactions, one positive ionizable bond, three hydrogen bond acceptors, and five hydrogen bond donors, along with 15 exclusion volume spheres [9].
Workflow Visualization
The complete workflow for identifying natural XIAP inhibitors integrates multiple computational approaches in a sequential manner, as illustrated below.
Pharmacophore Model Validation
Prior to virtual screening, the generated pharmacophore model must undergo rigorous validation to ensure its predictive capability. The validation process involves:
- Decoy Set Validation: The model is screened against a dataset containing known active XIAP antagonists (typically 10 compounds) and decoy compounds (approximately 5199 molecules) from the Database of Useful Decoys (DUDe) [9].
- Statistical Assessment: The model's performance is evaluated using the Receiver Operating Characteristic (ROC) curve and the calculation of the early enrichment factor (EF1%). A validated model demonstrated an EF1% of 10.0 with an excellent area under the ROC curve (AUC) value of 0.98, confirming its ability to distinguish true actives from decoy compounds [9].
Case Study Implementation and Results
Virtual Screening and Hit Identification
Using the validated pharmacophore model as a query, virtual screening was performed on natural compound databases, including the ZINC database which contains over 230 million commercially available compounds in ready-to-dock 3D format [9]. The screening process employed the following filtration criteria:
- Initial Pharmacophore Mapping: Compounds matching the pharmacophore features were selected based on fit value thresholds.
- Lipinski's Rule of Five: Filtering based on drug-likeness properties including molecular weight, log P, hydrogen bond donors and acceptors [58] [57].
- SMART Filtration: Removal of compounds with undesirable functional groups or reactive moieties [58].
Through this process, seven initial hit compounds were identified, which were subsequently subjected to molecular docking studies to evaluate their binding interactions with the XIAP active site [9].
Molecular Docking and Binding Analysis
Molecular docking was performed using the XIAP crystal structure (PDB: 5OQW) to predict binding modes and affinity of the hit compounds. The docking protocol involved:
- Grid Generation: Defining the binding site around the BIR2 domain of XIAP.
- Docking Parameters: Utilizing CHARMm forcefield and flexible docking algorithms available in Discovery Studio.
- Interaction Analysis: Evaluating hydrogen bonding, hydrophobic interactions, and steric complementarity with key residues such as THR308, ASP309, and GLU314 [9].
Based on docking scores and interaction analyses, four compounds were selected for further investigation, from which three showed particularly promising binding characteristics and stability in subsequent molecular dynamics simulations [9].
Identified Natural XIAP Inhibitors
The virtual screening and docking pipeline identified three natural compounds with significant potential as XIAP inhibitors, as summarized in the table below.
Table 1: Natural Compounds Identified as Potential XIAP Inhibitors Through Structure-Based Pharmacophore Modeling
| Compound Name | ZINC ID | Chemical Class | Docking Score (kcal/mol) | Key Interactions with XIAP |
|---|---|---|---|---|
| Caucasicoside A | ZINC77257307 | Triterpenoid saponin | -9.2 | Hydrogen bonds with THR308, hydrophobic interactions with LEU307 [9] |
| Polygalaxanthone III | ZINC247950187 | Xanthone | -8.7 | Hydrophobic contacts with TRP323, hydrogen bond with GLU314 [9] |
| MCULE-9896837409 | ZINC107434573 | Alkaloid-like | -8.5 | Multiple hydrogen bonds with ASP309 and water-mediated contacts [9] |
These compounds exhibited stable binding modes in the XIAP binding pocket and favorable physicochemical properties, suggesting their potential as lead compounds for further development.
The Scientist's Toolkit: Essential Research Reagents
Successful implementation of structure-based pharmacophore modeling for XIAP inhibitor identification requires several key computational tools and resources, as detailed below.
Table 2: Essential Research Reagents and Computational Tools for Structure-Based Pharmacophore Modeling
| Tool/Resource | Specifications | Application in Workflow |
|---|---|---|
| BIOVIA Discovery Studio | CATALYST Pharmacophore Modeling module, CHARMm forcefield, DS 3.0 or later | Pharmacophore generation, protein preparation, molecular docking, and binding analysis [12] [36] |
| XIAP Crystal Structure | PDB ID: 5OQW, resolution ≤2.0 Å | Structure-based pharmacophore modeling and molecular docking template [9] |
| Compound Databases | ZINC database (natural compound subsets), ChEMBL | Source of natural compounds for virtual screening [9] [57] |
| Validation Tools | DUDe decoy sets, ROC curve analysis | Pharmacophore model validation and performance assessment [9] |
| Molecular Dynamics Software | GROMACS, AMBER, or CHARMm | Simulation of protein-ligand complexes for stability assessment [9] |
Pathway and Mechanistic Insights
The therapeutic strategy of XIAP inhibition aims to restore apoptosis in cancer cells by activating caspase-dependent cell death pathways. The mechanistic basis for this approach involves the following key events:
- XIAP-Caspase Interaction: In cancer cells, overexpressed XIAP binds to and inhibits caspase-3, caspase-7, and caspase-9, preventing apoptosis execution.
- Competitive Inhibition: Natural compound inhibitors identified through pharmacophore modeling bind to the BIR2 domain of XIAP, competitively disrupting XIAP-caspase interactions.
- Caspase Activation: Freed caspases become active and initiate the apoptosis cascade through cleavage of cellular substrates.
- Cell Death Execution: Activation of the caspase pathway leads to characteristic apoptotic morphological changes and eventual cell death.
This mechanism is particularly relevant in melanoma and hepatocellular carcinoma, where XIAP overexpression contributes to treatment resistance [68] [9]. Recent approaches have also explored dual-target inhibitors, such as TRI-03, which simultaneously inhibits XIAP and thioredoxin reductase 1 (TrxR1), inducing pyroptosis in melanoma cells through the caspase-9/caspase-3/GSDME axis [68].
This case study demonstrates the successful application of structure-based pharmacophore modeling using BIOVIA Discovery Studio for identifying natural XIAP inhibitors. The integrated computational approach, encompassing pharmacophore generation, virtual screening, molecular docking, and molecular dynamics simulations, efficiently identified three promising natural compounds with potential XIAP inhibitory activity.
The identified compounds—Caucasicoside A, Polygalaxanthone III, and MCULE-9896837409—represent structurally diverse scaffolds that provide excellent starting points for further medicinal chemistry optimization. Future work should focus on experimental validation of these hits through in vitro binding assays and cell-based viability studies, particularly in XIAP-overexpressing cancer models such as melanoma and hepatocellular carcinoma.
The continued development of natural product-derived XIAP inhibitors, guided by structure-based pharmacophore models, offers a promising avenue for overcoming apoptosis resistance in cancer therapy and addressing the limitations of current targeted approaches.
Plasmodium falciparum 5-aminolevulinic acid synthase (Pf 5-ALAS) serves as the rate-limiting enzyme in the heme biosynthesis pathway, catalyzing the condensation of succinyl-CoA and glycine to yield 5-aminolevulinic acid (ALA) [71]. While the blood stages of the malaria parasite can scavenge heme from host erythrocytes, the liver and mosquito stages critically depend on the de novo heme biosynthesis pathway for development [71] [72]. This stage-specific essentiality establishes Pf 5-ALAS as a promising target for prophylactic antimalarial drugs aimed at preventing malaria transmission [71] [73].
Structure-based pharmacophore modeling represents a powerful computational approach in modern drug discovery, enabling the efficient identification of novel enzyme inhibitors by mapping the essential chemical features required for molecular recognition [74] [75]. This case study details the application of this methodology within the Discovery Studio research environment to identify potential inhibitors of Pf 5-ALAS.
Target Selection and Validation
The biological rationale for targeting Pf 5-ALAS is rooted in its critical role in the parasite's life cycle. Evidence confirms that disrupting the heme biosynthesis pathway, including through inhibition of 5-ALAS, does not impair asexual blood-stage growth but strongly inhibits the liver stage-to-blood stage transition and prevents mosquito stage sporozoite maturation [71] [72]. This makes it an ideal target for prophylactic interventions and transmission-blocking strategies.
Computational Methodology
Protein Structure Preparation
The absence of an experimentally determined crystal structure for Pf 5-ALAS necessitated the use of homology modeling to generate a reliable 3D structure for subsequent studies [71] [73].
- Template Selection and Modeling: The tertiary structure of Pf 5-ALAS was built via SWISS-MODEL using the structure of ALAS from Saccharomyces cerevisiae (PDB ID: 5TXR) as a template. Additional models were retrieved from AlphaFold (ID: AF-Q8I4×1-F1) and Robetta [71] [73].
- Model Assessment and Selection: The predicted models were rigorously assessed using MolProbity, ERRAT, and VERIFY 3D from the UCLA-DOE LAB – SAVES v6 server. The model with the lowest MolProbity and clash scores, along with the highest quality factors, was selected for further study [71].
- Active Site Prediction: The active site of the selected Pf 5-ALAS model was predicted using CASTp 3.0 and the Prankweb server. The consensus residues identified by both servers were used to define the binding pocket for pharmacophore generation and docking studies [71] [73].
The following diagram illustrates the key decision points and criteria in the protein structure preparation workflow.
Structure-Based Pharmacophore Modeling
A structure-based pharmacophore model was developed to capture the essential chemical features responsible for inhibitor binding within the Pf 5-ALAS active site [71] [75].
- Software and Receptor Setup: The modeled Pf 5-ALAS structure was imported into Discovery Studio as the receptor. The co-crystallized ligand, pyridoxal 5'-phosphate (PLP) (PubChem ID: 1051), was used to guide the definition of pharmacophore features based on its interactions with the protein's active site [71] [73].
- Feature Selection: The model was built using four key chemical feature types:
- Hydrogen Bond Acceptor (HBA)
- Hydrogen Bond Donor (HBD)
- Hydrophobic (HYP)
- Aromatic (AR) [71]
- Screening Criteria: The hit screening parameters were set according to Lipinski's Rule of Five (Molecular weight ≤ 500, HBA ≤ 10, HBD ≤ 5, LogP ≤ 5) and Veber's filter (rotatable bonds ≤ 10, polar surface area ≤ 140 Ų) to prioritize drug-like molecules [71].
Virtual Screening and Ligand Preparation
The validated pharmacophore model was used as a 3D query to screen large chemical databases for potential hits [71].
- Databases Screened: Multiple databases were screened, including CHEMBL, ChemDiv, ChemSpace, MCULE, MolPort, NCI Open Chemical Repository, and ZINC [71].
- Ligand Library Generation: The screening resulted in 2,755 initial hits. These compounds were converted to 3D structures using OpenBabel within PyRx software. Ultimately, 2,621 compounds were successfully prepared and converted to the AutoDock docking format (.pdbqt) for molecular docking simulations [71].
Molecular Docking and Post-Screening Analysis
- Docking Protocol: The 2,621 prepared ligands were screened against the modeled Pf 5-ALAS structure using AutoDock Vina. The grid box was centered on the predicted active site residues [71].
- Post-Screening Analysis: The docking poses were analyzed using Discovery Studio to examine specific protein-ligand interactions, including hydrogen bonds, hydrophobic contacts, and π-π stacking. Compounds with the most favorable binding affinities and interaction profiles were selected as top hits [71].
In Silico ADMET Evaluation and Molecular Dynamics
- ADMET Prediction: The top hit compounds were subjected to in silico Absorption, Distribution, Metabolism, Excretion, and Toxicity (ADMET) prediction to assess their potential pharmacokinetic and safety profiles [71].
- Molecular Dynamics (MD) Simulation: To validate the stability of the ligand-receptor complex, MD simulations were performed on the best hit using NAMD-VMD and the Galaxy Europe platform. The Root Mean Square Deviation (RMSD) of the protein-ligand complex was monitored over time to confirm stability [71].
Key Experimental Results
Identification of a Promising Lead Compound
The integrated computational workflow identified compound CSMS00081585868 as the most promising hit [71].
- Binding Affinity: It exhibited a strong binding affinity of -9.9 kcal/mol and a predicted inhibition constant (Ki) of 52.10 nM [71].
- Binding Interactions: The compound formed seven hydrogen bonds with key amino acid residues in the target's active site, contributing to its high binding strength [71].
- Structural Assessment: Qualitative analysis revealed that its strong binding is facilitated by the presence of two pyridine scaffolds bearing hydroxy and fluorine groups, linked by a pyrrolidine scaffold [71].
Pharmacokinetic and Stability Profiles
- ADMET Properties: The in silico ADMET prediction indicated that all ten best hits, including CSMS00081585868, possessed relatively good pharmacokinetic properties, suggesting their potential as viable drug leads [71].
- Complex Stability: The MD simulation confirmed the stability of the CSMS00081585868-Pf 5-ALAS complex, as evidenced by a stable RMSD trajectory over the simulation time, indicating a firm binding pose within the active site [71].
Table 1: Key Results for the Top Pf 5-ALAS Inhibitor Hit
| Parameter | Result for CSMS00081585868 |
|---|---|
| Binding Affinity | -9.9 kcal/mol |
| Predicted Ki | 52.10 nM |
| Key Structural Features | Two pyridine rings with OH/F groups, linked by pyrrolidine |
| Hydrogen Bonds | 7 |
| ADMET Profile | Relatively good predicted pharmacokinetics |
| MD Simulation Result | Stable complex (confirmed by RMSD) |
The Scientist's Toolkit: Research Reagent Solutions
Table 2: Essential Materials and Software for Pf 5-ALAS Inhibitor Discovery
| Reagent/Software Solution | Function in the Workflow |
|---|---|
| Discovery Studio | Integrated platform for structure-based pharmacophore modeling, post-docking analysis, and interaction visualization. |
| SWISS-MODEL | A fully automated protein structure homology-modeling server used to generate the 3D structure of Pf 5-ALAS. |
| AlphaFold & Robetta | Protein structure prediction services used for generating and comparing ab initio models of the target. |
| PyRx with AutoDock Vina | Virtual screening software used for molecular docking and binding affinity prediction. |
| CASTp / PrankWeb | Online servers for predicting and analyzing protein active sites and binding pockets. |
| ZINC / CHEMBL / ChemSpace | Commercial and public databases containing millions of screening compounds for virtual screening. |
| NAMD / VMD | Software for performing and visualizing Molecular Dynamics (MD) simulations to assess complex stability. |
| Pyridoxal 5'-phosphate (PLP) | The native cofactor of 5-ALAS; used as a reference ligand to guide pharmacophore model development. |
Application Notes and Protocols
Detailed Protocol: Structure-Based Pharmacophore Generation in Discovery Studio
This protocol outlines the steps for creating a structure-based pharmacophore model for Pf 5-ALAS within the Discovery Studio environment [71] [73].
Receptor and Ligand Preparation:
- Import the validated, modeled Pf 5-ALAS structure (
.pdbformat) into Discovery Studio. - Prepare the protein by adding hydrogen atoms, correcting protonation states, and assigning appropriate charges.
- Import the co-crystallized or reference ligand (e.g., PLP). Ensure the ligand is correctly positioned in the active site.
- Import the validated, modeled Pf 5-ALAS structure (
Define the Binding Site:
- Use the
From Receptor Cavitiestool or manually define the binding site based on the coordinates of the reference ligand and the residues identified by CASTp/PrankWeb.
- Use the
Generate the Pharmacophore Model:
- Navigate to the
Pharmacophoremodule and selectReceptor-Ligand Pharmacophore Generation. - Specify the prepared receptor and the reference ligand.
- Set the key chemical features to be included: HBA, HBD, HYP, and AR.
- Run the generation process. Discovery Studio will create multiple hypotheses.
- Navigate to the
Validate the Pharmacophore Model:
- Select the top-ranked hypothesis based on the selectivity score.
- Validate the model using a decoy set containing known active and inactive compounds. Calculate the Güner-Henry (GH) score and Enrichment Factor (EF) to confirm the model's ability to distinguish actives from inactives [75]. A GH score > 0.6 is generally considered acceptable.
Detailed Protocol: Virtual Screening and Hit Identification
This protocol follows the generation of a validated pharmacophore model [71].
Database Screening:
- Use the
Search 3D Databaseprotocol in Discovery Studio. Load the pharmacophore model as the query. - Input the database of prepared, multi-conformer compounds (e.g., the filtered library from ZINC, ChemDiv, etc.).
- Set the screening parameters to fit the pharmacophore features and run the screening.
- Use the
Ligand Preparation for Docking:
- Collect the hits from the pharmacophore screening.
- Use the
Prepare Ligandsprotocol to optimize geometries, assign charges, and generate possible tautomers and isomers. - Export the prepared ligands in a format compatible with your docking software (e.g.,
.pdbqtfor AutoDock Vina).
Molecular Docking:
- Set up the docking grid in AutoDock Vina centered on the Pf 5-ALAS active site.
- Run the docking simulation for all prepared hits.
- Analyze the results by sorting compounds based on their calculated binding affinity.
Post-Docking Analysis in Discovery Studio:
- Import the top-ranking docking poses back into Discovery Studio.
- Use the
Analyze Ligand PosesandNon-covalent Interactionstools to visually inspect and analyze the specific interactions (hydrogen bonds, hydrophobic contacts, etc.) between each hit and the key residues in the Pf 5-ALAS active site.
The overall workflow, from target preparation to lead identification, is summarized in the following diagram.
This case study demonstrates a successful application of a structure-based pharmacophore approach within a Discovery Studio framework to identify a novel, potent inhibitor of Plasmodium falciparum 5-ALAS. The compound CSMS00081585868 emerged as a promising lead with high binding affinity, stable complex formation, and favorable predicted pharmacokinetic properties. The detailed methodologies and protocols provided serve as a robust template for researchers aiming to discover and optimize new antimalarial agents targeting this essential pathway, contributing to the broader goal of combating drug-resistant malaria.
Conclusion
Structure-based pharmacophore generation in Discovery Studio provides a powerful, abstracted approach to capturing the essential steric and electronic features required for effective ligand-target interactions, making it an indispensable tool in the modern CADD toolbox. This guide has synthesized the complete workflow—from foundational concepts and detailed methodology to troubleshooting and rigorous validation—demonstrating how robust pharmacophore models can direct virtual screening to identify novel lead compounds with high efficiency. The future of this field is bright, with integration into larger drug discovery pipelines that include molecular dynamics simulations, AI-assisted protein structure prediction like AlphaFold2, and advanced ADMET profiling. As demonstrated in successful applications against targets like XIAP and Pf 5-ALAS, this methodology holds significant promise for accelerating the discovery of new therapeutic agents for cancer, infectious diseases, and beyond, ultimately enabling more effective and targeted treatments.
References
- 1. IUPAC - pharmacophore (11485) [https://goldbook.iupac.org/terms/view/11485]
- 2. Pharmacophore [https://en.wikipedia.org/wiki/Pharmacophore]
- 3. Pharmacophore modeling and applications in drug discovery [https://www.sciencedirect.com/science/article/abs/pii/S135964461000111X]
- 4. Pharmacophore Construction Using Discovery Studio [https://www.computabio.com/pharmacophore-construction-using-discovery-studio.html]
- 5. Setting the record straight: the origin of the pharmacophore ... [https://pubmed.ncbi.nlm.nih.gov/24745881/]
- 6. Applications of the Pharmacophore Concept in Natural ... [https://pmc.ncbi.nlm.nih.gov/articles/PMC7685156/]
- 7. Pharmacophore - an overview | ScienceDirect Topics [https://www.sciencedirect.com/topics/immunology-and-microbiology/pharmacophore]
- 8. Structure-Based Pharmacophore Modeling, Virtual ... [https://pmc.ncbi.nlm.nih.gov/articles/PMC8777599/]
- 9. Structure based pharmacophore modeling, virtual ... [https://www.nature.com/articles/s41598-021-83626-x]
- 10. Drug Design by Pharmacophore and Virtual Screening ... [https://pmc.ncbi.nlm.nih.gov/articles/PMC9145410/]
- 11. Pharmacophore – Knowledge and References [https://taylorandfrancis.com/knowledge/Medicine_and_healthcare/Pharmaceutical_medicine/Pharmacophore/]
- 12. Ligand and Pharmacophore based Design | BIOVIA [https://www.3ds.com/products/biovia/discovery-studio/ligand-and-pharmacophore-based-design]
- 13. A pharmacophore-guided deep learning approach for ... [https://www.nature.com/articles/s41467-023-41454-9]
- 14. T101-2024 Notification regarding BIOVIA Discovery Studio ... [https://www.3ds.com/support/documentation/resource-library/t101-2024-notification-regarding-biovia-discovery-studio-2025]
- 15. Structure‐based pharmacophore modeling for precision ... [https://pmc.ncbi.nlm.nih.gov/articles/PMC11299079/]
- 16. Building shape-focused pharmacophore models for effective ... [https://jcheminf.biomedcentral.com/articles/10.1186/s13321-024-00857-6]
- 17. PharmacoForge: pharmacophore generation with diffusion ... [https://www.frontiersin.org/journals/bioinformatics/articles/10.3389/fbinf.2025.1628800/full]
- 18. BIOVIA Discovery Studio [https://www.3ds.com/products/biovia/discovery-studio]
- 19. Discovery Studio [https://grokipedia.com/page/Discovery_Studio]
- 20. Molecular Dynamics Simulations | BIOVIA [https://www.3ds.com/products/biovia/discovery-studio/simulations]
- 21. T28-2025 - BIOVIA Discovery Studio 2025 SP1 | Support [https://www.3ds.com/support/documentation/resource-library/t28-2025-biovia-discovery-studio-2025-sp1]
- 22. Structure-based pharmacophore modeling 2. Developing a ... [https://www.sciencedirect.com/science/article/abs/pii/S1093326323000864]
- 23. What's NEW? A Closer Look at BIOVIA Discovery Studio ... [https://events.3ds.com/biovia-closer-discovery-studio-simulation]
- 24. How to Prepare Your Protein for Docking with Discovery ... [https://www.linkedin.com/posts/mahadi-hasan-324700182_drugdesign-discoverystudio-proteinpreparation-activity-7346180502904631297-eNjY]
- 25. Synthesis, molecular docking, and in vitro activity of a novel ... [https://pubs.rsc.org/en/content/articlehtml/2025/ra/d5ra01134e]
- 26. Structure based drug design and machine learning ... [https://www.nature.com/articles/s41598-025-17708-5]
- 27. Targeting programmed death ligand 1 for anticancer ... [https://www.nature.com/articles/s41598-025-14503-0]
- 28. Schrodinger-Notes—Target-based Pharmacophore Modeling [https://blog.jiangshen.org/2024/schrodinger-notes-target-based-pharmacophore-modeling/]
- 29. Structure-based pharmacophore modeling 1. Automated ... [https://www.sciencedirect.com/science/article/abs/pii/S109332632300027X]
- 30. A structure-based framework for selective inhibitor design ... [https://www.nature.com/articles/s42003-025-07840-3]
- 31. Pharmacophore Modeling, Virtual Screening, and ... [https://www.medsci.org/v10p0265.htm]
- 32. Rapid screening and taste mechanism of novel umami ... [https://pmc.ncbi.nlm.nih.gov/articles/PMC12166769/]
- 33. Pharmacophore screening, molecular docking, and MD ... [https://www.frontiersin.org/journals/pharmacology/articles/10.3389/fphar.2025.1534707/full]
- 34. A statistical framework to evaluate virtual screening [https://bmcbioinformatics.biomedcentral.com/articles/10.1186/1471-2105-10-225]
- 35. Pharmacophore modeling and virtual screening for the ... [https://www.sciencedirect.com/science/article/pii/S2211383511000049]
- 36. 2.2. Pharmacophore models' generation [https://bio-protocol.org/exchange/minidetail?id=9311763&type=30]
- 37. Protocol for an automated virtual screening pipeline including ... [https://pmc.ncbi.nlm.nih.gov/articles/PMC12639438/]
- 38. Pharmacophore screening, molecular docking, and MD ... [https://pmc.ncbi.nlm.nih.gov/articles/PMC11926154/]
- 39. A comprehensive drug discovery study using commercial ... [https://journals.plos.org/plosone/article?id=10.1371/journal.pone.0311527]
- 40. Discovery Studio LibDock Tutorial [https://www.computabio.com/discovery-studio-libdock-tutorial.html]
- 41. Ansys Discovery Hardware Requirements (2025 R2) [https://innovationspace.ansys.com/knowledge/forums/topic/ansys-discovery-hardware-requirements-2025-r2/]
- 42. Structure-Guided Identification of JAK2 Inhibitors [https://www.mdpi.com/2673-9879/5/4/66]
- 43. Concepts and Applications Exemplified on Hydroxysteroid ... [https://pmc.ncbi.nlm.nih.gov/articles/PMC6332202/]
- 44. Feature Selection in Machine Learning: How to Choose the ... [https://medium.com/skillcamper/feature-selection-in-machine-learning-how-to-choose-the-best-features-for-your-model-d97974efa12b]
- 45. Evaluating Sparse Feature Selection Methods [https://www.mdpi.com/2076-3417/15/7/3752]
- 46. Advanced Feature Selection Techniques for Machine ... [https://www.kdnuggets.com/2023/06/advanced-feature-selection-techniques-machine-learning-models.html]
- 47. How Overfitting Ruins Your Feature Selection - Hex [https://hex.tech/blog/overfitting-model-impact/]
- 48. Feature selection methods affect the performance of ... [https://www.nature.com/articles/s41592-025-02624-3]
- 49. How many features is too many when using ... [https://datascience.stackexchange.com/questions/122640/how-many-features-is-too-many-when-using-feature-selection-methods]
- 50. Combination of pharmacophore hypothesis, genetic ... [https://pmc.ncbi.nlm.nih.gov/articles/PMC3824193/]
- 51. Structure-based pharmacophore modeling [https://bio-protocol.org/exchange/minidetail?id=815933&type=30]
- 52. Pharmacophore modeling and virtual screening studies for ... [https://pubs.rsc.org/en/content/articlehtml/2021/ra/d0ra09320c]
- 53. Pharmacophore - an overview [https://www.sciencedirect.com/topics/medicine-and-dentistry/pharmacophore]
- 54. Mastering AUC-ROC: Essential Model Evaluation ... [https://galileo.ai/blog/auc-roc-model-evalulation]
- 55. Classification: ROC and AUC | Machine Learning [https://developers.google.com/machine-learning/crash-course/classification/roc-and-auc]
- 56. Instability of the AUROC of Clinical Prediction Models [https://pubmed.ncbi.nlm.nih.gov/39921554/]
- 57. Receptor-Based Pharmacophore Modeling in the Search ... [https://pmc.ncbi.nlm.nih.gov/articles/PMC8000608/]
- 58. Ligand-based Pharmacophore Modeling, Virtual Screening ... [https://www.sciencedirect.com/science/article/pii/S2001037018302617]
- 59. Decoys Selection in Benchmarking Datasets [https://www.frontiersin.org/journals/pharmacology/articles/10.3389/fphar.2018.00011/full]
- 60. DUD-E: A Database of Useful (Docking) Decoys — Enhanced [https://dude.docking.org/]
- 61. Pharmacophore modeling and 3D quantitative structure ... [https://pmc.ncbi.nlm.nih.gov/articles/PMC3645363/]
- 62. Pharmacophore modeling: advances, limitations, and ... [https://www.dovepress.com/pharmacophore-modeling-advances-limitations-and-current-utility-in-dru-peer-reviewed-fulltext-article-JRLCR]
- 63. Drug Design by Pharmacophore and Virtual Screening ... [https://www.mdpi.com/1424-8247/15/5/646]
- 64. Molecular docking as a tool for the discovery ... [https://www.nature.com/articles/s41598-023-40160-2]
- 65. Identification of novel PAD2 inhibitors using ... [https://www.nature.com/articles/s41598-024-78330-5]
- 66. Recent Advances in Ligand-Based Drug Design [https://pmc.ncbi.nlm.nih.gov/articles/PMC2975775/]
- 67. Applications and Limitations of Pharmacophore Modeling [https://drugdiscoverypro.com/applications-and-limitations-of-pharmacophore-modeling/]
- 68. A dual inhibitor of TrxR1 and XIAP induces pyroptosis in ... [https://www.frontiersin.org/journals/cell-and-developmental-biology/articles/10.3389/fcell.2025.1542356/full]
- 69. Natural compounds modulating redox metabolism and ... [https://pmc.ncbi.nlm.nih.gov/articles/PMC12639388/]
- 70. Bioactive compounds from nature: Antioxidants targeting ... [https://www.sciencedirect.com/science/article/pii/S0753332224003160]
- 71. Structure-based pharmacophore modeling, virtual screening ... [https://pmc.ncbi.nlm.nih.gov/articles/PMC9877529/]
- 72. The Heme Biosynthesis Pathway Is Essential for ... [https://www.sciencedirect.com/science/article/pii/S0021925819561336]
- 73. Structure-based pharmacophore modeling, virtual ... [https://www.frontiersin.org/journals/medicine/articles/10.3389/fmed.2022.1022429/full]
- 74. Virtual screening based on pharmacophore model for ... [https://www.sciencedirect.com/science/article/abs/pii/S0048357522000761]
- 75. Discovery of Novel Allosteric SHP2 Inhibitor Using ... [https://www.mdpi.com/1424-8247/17/7/935]