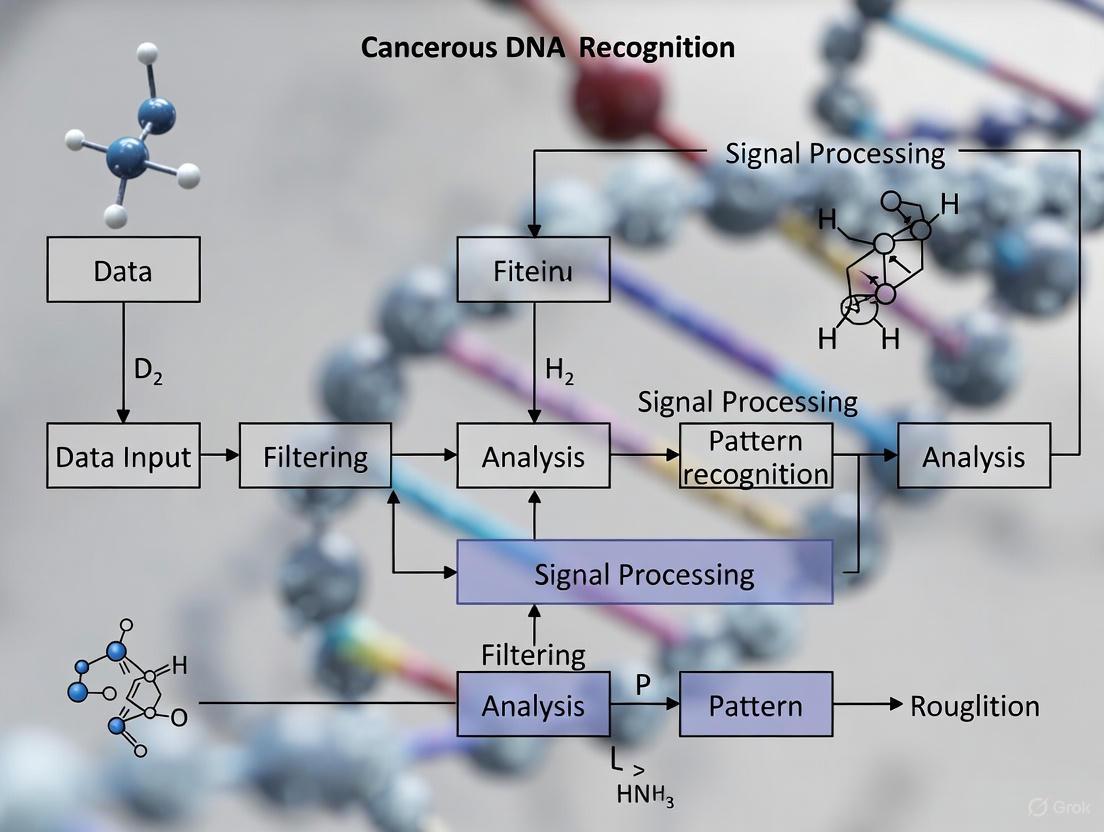
Signal Processing for Cancerous DNA Pattern Recognition: From Genomic Signals to Clinical Diagnostics
This article provides a comprehensive overview of signal processing (SP) methodologies for identifying cancerous patterns in DNA sequences.
Signal Processing for Cancerous DNA Pattern Recognition: From Genomic Signals to Clinical Diagnostics
Abstract
This article provides a comprehensive overview of signal processing (SP) methodologies for identifying cancerous patterns in DNA sequences. Tailored for researchers, scientists, and drug development professionals, it explores the foundational principles of genomic SP, detailing key techniques like Discrete Wavelet Transform (DWT) and Fourier analysis for feature extraction. The scope extends to advanced applications integrating machine and deep learning for methylation analysis and multi-cancer classification, alongside critical troubleshooting for data noise and computational challenges. A validation framework comparing SP methods with established sequencing technologies is presented, synthesizing performance benchmarks to guide tool selection and future biomedical research directions.
The Foundation of Genomic Signals: From DNA Sequence to Analysable Data
Core Concepts of Genomic Signal Processing
Genomic Signal Processing (GSP) is an interdisciplinary engineering discipline that integrates the theory and methods of signal processing with the applications arising from high-throughput technologies in biomedical research [1]. In the context of cancer research, GSP provides a powerful framework for converting DNA sequence data into numerical values, enabling the application of digital signal processing (DSP) techniques to identify patterns and features associated with carcinogenesis [2] [3]. This approach allows researchers to investigate the complex structural and functional relationships among genes and proteins in cancerous tissues, with the potential to revolutionize molecular diagnostics and personalized cancer treatment strategies [1].
Central to GSP is the transformation of nucleotide sequences into numerical data, which facilitates the extraction of key spectral features—most notably the period-3 property observed in protein coding regions [3]. These techniques enable the prediction and validation of gene locations by differentiating the exonic (coding) and intronic (non-coding) regions, thereby advancing our understanding of genetic function and regulation in cancer biology [3]. The evolution from traditional transform-based methods to adaptive filtering and machine learning approaches has significantly enhanced the accuracy of gene prediction and broadened applications in cancer diagnostics and personalized medicine [3].
Key Numerical Representations and Processing Methods
DNA Sequence to Signal Conversion
The fundamental first step in GSP analysis involves mapping DNA sequences to numerical representations. One of the most established methods is the Voss representation, which employs four binary indicator vectors to denote the presence of each nucleotide type at specific locations within a DNA sequence [2]. Given a DNA sequence α, its corresponding four-dimensional DNA signal is computed as follows:
Xˆ1[i] = 1 if X[i] = A, 0 otherwiseXˆ2[i] = 1 if X[i] = G, 0 otherwiseXˆ3[i] = 1 if X[i] = C, 0 otherwiseXˆ4[i] = 1 if X[i] = T, 0 otherwise[2]
After converting DNA sequences to numerical signals, the Discrete Fourier Transform (DFT) is applied to compute the power spectral density (PSD), which describes how the power of a signal is distributed over frequency [2]. In genomic terms, the PSD serves as a descriptor of the nucleotide patterns that may be present within the DNA sequence, with specific frequency components indicating biologically significant regions such as protein-coding exons [2] [3].
Table 1: Key Numerical Representation Methods in Genomic Signal Processing
| Method | Description | Key Applications in Cancer Research |
|---|---|---|
| Voss Representation | Four binary indicator sequences for A, T, G, C | Fundamental encoding for subsequent spectral analysis |
| Discrete Fourier Transform (DFT) | Converts genomic signals to frequency domain | Identification of periodic patterns like period-3 in exons |
| Power Spectral Density (PSD) | Describes power distribution over frequencies | Quantification of dominant patterns in cancer-related genes |
| Digital Filters (e.g., Comb Notch) | Selective frequency component isolation | Separation of coding and non-coding regions in cancer genomes |
| Walsh Hadamard Transform (WHT) | Binary orthogonal transformation | Alternative spectral analysis of mutational patterns |
Advanced Processing Techniques
Recent advances in GSP include the utilization of specialized filters that isolate characteristic frequencies associated with exonic regions, thereby improving the identification of protein-coding segments [3]. Integrated approaches combining recursive adaptation techniques with tailored windowing functions can dynamically adjust parameters to track the evolving characteristics of genetic sequences, resulting in significant performance gains in gene prediction accuracy for cancer genomes [3].
Additional innovative approaches include Walsh Hadamard Transform (WHT) [4] and combinatorial methods that integrate statistical and DSP models for analyzing various cancer sequences [4]. These methods have demonstrated particular utility in identifying genomic samples of viruses associated with cancer, such as HIV [4].
Experimental Protocols for GSP in Cancer Research
Protocol 1: DNA Sequence Clustering Using GSP and K-means
Purpose: To perform cluster analysis of DNA sequences from cancer patients based on GSP methods and the K-means algorithm [2].
Materials and Reagents:
- DNA sequences from cancer patients (e.g., BRCA1, KIRC, COAD, LUAD, PRAD)
- Computational resources for signal processing
- Software platforms for numerical analysis (Python, MATLAB)
Procedure:
- Sequence Acquisition: Obtain DNA sequences from cancer patients. The dataset should comprise sequences associated with distinct cancer types, with appropriate sample sizes for training, validation, and testing (e.g., 194 patients for training, 98 for validation, 98 for testing) [5].
Numerical Mapping: Convert DNA sequences to numerical signals using the Voss representation [2]:
- For each sequence, create four binary indicator sequences representing nucleotides A, T, G, C
- Generate the fourth-dimensional DNA signal Xˆα
Spectral Analysis:
- Apply Discrete Fourier Transform to each DNA signal
- Compute the Power Spectral Density (PSD) Sˆα for each sequence
- The PSD serves as a descriptor of nucleotide patterns within the DNA sequence
Cluster Analysis:
- Apply K-means algorithm to the PSD data Ω = [ω1, ω2, …, ωm]
- Use Euclidean distance as the similarity metric
- Repeat computation multiple times (e.g., 50 times) and keep the best convergence score to account for random initial label assignments [2]
Result Visualization:
- Compute the main centroid point M as the geometrical center of the K centroids
- For each cluster j, compute the Euclidean distance dj of its centroid Cj relative to M
- Sort centroids according to distance to the main centroid for visualization [2]
Protocol 2: Cancer Prediction Using GSP with Machine Learning Classifiers
Purpose: To develop a high-accuracy DNA-based cancer risk predictor by blending GSP with machine learning approaches [5].
Materials and Reagents:
- DNA sequences associated with multiple cancer types (e.g., 390 patients across 5 cancer types)
- Computational resources for machine learning
- Data preprocessing tools for outlier removal and standardization
Procedure:
- Data Preprocessing:
- Perform outlier removal using appropriate functions (e.g., Pandas drop())
- Execute data standardization using tools like StandardScaler in Python
- Retain all available features within the dataset without reduction [5]
Model Development:
- Employ a blended ensemble of Logistic Regression with Gaussian Naive Bayes
- Optimize hyperparameters via grid search technique
- Implement 10-fold cross-validation, dividing the dataset into ten distinct subsets
- Use nine subsets for training and one for validation, rotating this process ten times [5]
Model Validation:
- Aggregate predictions from K-trained models
- Use an independent hold-out test set comprising 20% of the full cohort for final assessment
- Ensure no data leakage between training and validation splits [5]
Performance Evaluation:
- Assess accuracy across different cancer types (e.g., BRCA1, KIRC, COAD, LUAD, PRAD)
- Compute micro- and macro-average ROC AUC values
- Compare results with existing state-of-the-art methods [5]
Table 2: Performance Metrics of GSP-Based Cancer Classification
| Cancer Type | Full Name | Reported Accuracy | Key Genetic Features |
|---|---|---|---|
| BRCA1 | Breast Cancer gene 1 | 100% | Mutations in RING and BRCT domains |
| KIRC | Kidney Renal Clear Cell Carcinoma | 100% | Immunological responses, metabolic pathways |
| COAD | Colorectal Adenocarcinoma | 100% | APC gene mutations |
| LUAD | Lung Adenocarcinoma | 98% | EGFR pathway alterations |
| PRAD | Prostate Adenocarcinoma | 98% | Androgen receptor (AR) pathway mutations |
Visualization and Data Analysis Workflows
GSP-Based DNA Sequence Clustering Workflow
GSP-Based DNA Sequence Clustering Workflow: This diagram illustrates the complete pipeline from raw DNA sequences to cluster visualization using genomic signal processing techniques.
GSP for Cancer Classification Workflow
GSP for Cancer Classification Workflow: This diagram shows the integrated approach of GSP with machine learning for multi-cancer classification.
The Scientist's Toolkit: Essential Research Reagents and Materials
Table 3: Essential Research Reagents and Computational Tools for GSP in Cancer Research
| Item | Function/Application | Specifications/Alternatives |
|---|---|---|
| DNA Sequences from Cancer Patients | Primary data for GSP analysis | 390+ patients across multiple cancer types; accessible via repositories like Kaggle |
| Voss Representation Algorithm | Converts DNA sequences to numerical signals | Four binary indicator sequences for A, T, G, C |
| Discrete Fourier Transform (DFT) | Identifies periodic patterns in genomic data | Implementation in Python (SciPy) or MATLAB |
| Power Spectral Density (PSD) Calculator | Quantifies distribution of power in frequency domain | Essential for identifying period-3 property in exons |
| K-means Clustering Algorithm | Groups sequences with similar spectral features | Euclidean distance metric; multiple iterations for stability |
| Ensemble Classifiers (Logistic Regression + Gaussian NB) | Cancer type prediction from genomic features | Hyperparameter optimization via grid search |
| Cross-Validation Framework | Model validation and performance assessment | 10-fold stratified cross-validation |
| SHAP Analysis Tool | Model interpretability and feature importance | Identifies dominant genes in classification decisions |
Applications in Cancer Research and Future Directions
GSP techniques have demonstrated significant utility across multiple domains of cancer research. In cluster analysis, GSP methods combined with K-means algorithms enable researchers to find and visualize interesting features of sets of DNA data without prior information about the hidden structure [2]. This approach facilitates the exploration of cancer subtypes based on genomic signatures rather than solely on histological characteristics.
For cancer prediction, the integration of GSP with machine learning classifiers has yielded remarkable accuracy. Recent research reports accuracies of 100% for BRCA1, KIRC, and COAD, while achieving 98% for LUAD and PRAD—representing improvements of 1–2% over recent deep-learning and multi-omic benchmarks [5]. These approaches provide lightweight, interpretable, and highly effective tools for early cancer prediction.
The convergence of GSP with artificial intelligence represents a promising future direction. Deep learning models, particularly convolutional neural networks (CNNs) and recurrent neural networks (RNNs), are increasingly being applied to genomic data [6]. These technologies can automatically extract valuable features from large-scale datasets, enhancing early detection accuracy and efficiency in cancer diagnostics [6]. As these methodologies continue to evolve, they hold the potential to further revolutionize precision oncology by enabling more accurate molecular classification of tumors and personalized treatment strategies.
Performance Metrics in Cancer Research
The following table summarizes quantitative performance data from recent studies applying DWT and Fourier analysis to cancer detection and diagnosis.
Table 1: Quantitative Performance of Transform-Based Methods in Cancer Research
| Cancer Type | Analytical Method | Data Source | Key Performance Metrics | Reference |
|---|---|---|---|---|
| Lung Cancer | Frequency-guided Wavelet Network (FreqWNet) | Optical time-stretch imaging of cell death | 98.42% F1-score for cell death state identification | [7] |
| Lung, Breast & Ovarian Cancer | DWT with Genomic Signal Processing | NCBI gene sequences | 100% classification accuracy with Support Vector Machine | [8] |
| Breast Cancer | Fourier Transform Infrared (FT-IR) Spectroscopy | Serum, biopsy, plasma, saliva | ~98% Sensitivity, ~100% Specificity (Systematic Review) | [9] |
| Pancreatic Cancer | DWT + Probability Neural Network (PNN) | ATR-FT-IR spectra of rat tissue | 98% correct for early carcinoma; 100% for advanced carcinoma | [10] |
Experimental Protocols
Protocol: Genomic Sequence Analysis for Cancer Mutation Detection
This protocol outlines the procedure for differentiating cancerous from non-cancerous genomic sequences using DWT, achieving high classification accuracy [8].
1. Data Acquisition
- Source: Obtain cancerous and non-cancerous gene sequences from curated databases such as NCBI.
- Targets: Sequences for specific cancers (e.g., lung, breast, ovarian).
2. Numerical Mapping
- Convert genomic sequences (A, C, G, T) into numerical indicator sequences that can be processed by signal analysis techniques.
3. Wavelet Decomposition
- Apply a 4-level Discrete Wavelet Transform (DWT) using the Haar wavelet to the numerical sequences.
- This decomposition produces a set of approximation and detail coefficients across multiple resolution scales.
4. Feature Extraction
- From the wavelet domain coefficients, calculate a set of statistical features for each sequence. These typically include:
- Mean
- Median
- Standard Deviation
- Interquartile Range
- Skewness
- Kurtosis
- From the wavelet domain coefficients, calculate a set of statistical features for each sequence. These typically include:
5. Classification
- Use the extracted statistical features as input for a machine learning classifier.
- Algorithm: Support Vector Machine (SVM).
- The model is trained to classify sequences as "cancerous" or "non-cancerous" based on these features.
Protocol: Cell Death Pathway Prediction via Multi-Modal Imaging
This protocol describes a framework for label-free prediction of cell death pathways in lung cancer chemotherapy using a advanced wavelet network [7].
1. Sample Preparation and Imaging
- Treat lung cancer cells with chemotherapeutic agents (e.g., cisplatin).
- Acquire single-cell intensity and phase images in a label-free manner using a multi-modal Optical Time-Stretch Imaging Flow Cytometry (OTS-IFC) system.
2. Feature Extraction with Dual-Stream Network
- Process the intensity and phase images through a dual-stream Frequency-guided Wavelet Network (FreqWNet).
- Within the network, a Wavelet Frequency Decoupling (WFD) module performs:
- Decomposition: Uses DWT to disentangle low-frequency (global structural) information from high-frequency (fine textural) details.
- Processing: The low-frequency branch captures global representations. The high-frequency branch undergoes residual convolution to enhance fine-grained features.
- Reconstruction: An inverse wavelet transform is applied to reconstruct the enhanced features.
3. Cross-Modal Feature Fusion
- Implement a cross-modal collaboration module that uses a mutual attention mechanism to adaptively align and fuse the complementary features extracted from the intensity and phase image streams.
4. State Identification and Prediction
- The fused, robust feature representations are used by the model to identify cell death states and predict the specific death pathway with high accuracy.
Workflow Visualization
Genomic Signal Processing for Cancer Detection
FreqWNet for Cell Death Prediction
Research Reagent Solutions
Table 2: Essential Research Materials and Computational Tools
| Item / Reagent | Function / Application in Research | Example from Context |
|---|---|---|
| Nicole NEXUS 670 FTIR Spectrometer | Acquires vibrational spectra from biological samples to detect biochemical changes associated with cancer. | Used with a diamond ATR accessory to collect FT-IR spectra from pancreatic tissues [10]. |
| Multi-modal OTS-IFC System | High-throughput, label-free acquisition of single-cell intensity and phase images for real-time analysis. | Core component for imaging lung cancer cells in various death states [7]. |
| NCBI Gene Sequence Database | Repository for obtaining standardized cancerous and non-cancerous genomic sequences for analysis. | Source of lung, breast, and ovarian cancer sequences for genomic signal processing [8]. |
| Haar Wavelet / Daubechies Wavelet | Mother wavelets used in DWT for decomposing signals and images into frequency components. | Haar wavelet used for genomic sequence decomposition [8] and Daubechies for FT-IR feature extraction [10]. |
| Support Vector Machine (SVM) | A machine learning classifier effective for high-dimensional data, used for final decision making. | Achieved 100% accuracy in classifying genomic sequences [8]. |
| Probability Neural Network (PNN) | A feed-forward neural network based on statistical theory, suitable for pattern classification tasks. | Used to classify pancreatic tissues based on FT-IR features with high accuracy [10]. |
Converting DNA Sequences into Numerical Indicator Signals
The conversion of DNA sequences into numerical indicator signals, known as numerical mapping or numerical encoding, constitutes a fundamental preprocessing step in Genomic Signal Processing (GSP). This transformation enables the application of digital signal processing techniques to DNA sequences, facilitating the identification of patterns indicative of functional genomic elements. Within cancer research, these methods provide the computational foundation for predictive, preventive, and personalized medicine (PPPM) by revealing molecular signatures critical for early detection, accurate diagnosis, and targeted treatment strategies [11]. The core principle involves assigning numerical values to nucleotide bases (Adenine, Thymine, Cytosine, and Guanine) based on specific biological or mathematical properties, thereby converting symbolic genomic data into a quantitative format amenable to computational analysis [12].
The detection of protein-coding regions (exons) represents a primary application of these techniques in cancer genomics. In eukaryotes, protein-coding regions exhibit a period-3 property due to the codon structure, where every third nucleotide shows a statistical bias. This periodicity manifests as a dominant peak at frequency 1/3 in the Fourier spectrum, allowing exons to be distinguished from non-coding regions (introns) [12]. Advanced numerical mapping methods, combined with digital filters, enhance this signal, suppressing intron noise and accurately pinpointing coding regions—a capability essential for understanding the genomic alterations driving carcinogenesis [12] [11].
Numerical Encoding Methods: Principles and Performance
Numerical mapping methods are broadly classified into binary and non-binary schemes, each with distinct representational strategies and performance characteristics in genomic analysis [12].
Table 1: Classification and Description of Numerical Encoding Methods
| Method Category | Representative Methods | Core Principle | Nucleotide Assignment Scheme |
|---|---|---|---|
| Binary Methods | Voss/OBNE [12], Four-bit Binary (FBNE) [12], Walsh Code-Based (WCBNE) [12] | Represents DNA sequences using binary vectors indicating nucleotide presence/absence or orthogonal binary codes. | FBNE: A='0100', G='0010', T='0001', C='1000' [12] |
| Non-Binary Methods | Integer-Based (IBNE) [12], Electron-Ion Interaction Potential (EIIP) [12], Hadamard Based (HBNE) [12] | Assigns integer, real, or complex numbers based on physico-chemical properties or structured matrices. | IBNE: A=1, T=2, G=3, C=4 [12] |
The Hadamard Based Numerical Encoding (HBNE) method represents a significant advancement in this field. This approach utilizes a fourth-order Hadamard matrix to generate orthogonal numerical codes for DNA nucleotides. When integrated with an Elliptic filter and Gaussian windowing technique, HBNE effectively isolates period-3 components while suppressing high-frequency noise from non-coding regions [12].
Table 2: Performance Comparison of Numerical Encoding Methods for Exon Prediction
| Encoding Method | Reported Accuracy | Key Advantages | Key Limitations |
|---|---|---|---|
| Hadamard (HBNE) [12] | 95% | High accuracy (95%) and specificity; effective noise suppression. | Requires specialized signal processing implementation. |
| Four-bit Binary (FBNE) [12] | Not Specified | Maintains orthogonality via constant Hamming distance. | May not fully capture nucleotide interaction variability. |
| Walsh Code-Based (WCBNE) [12] | Not Specified | Structured binary encoding. | Reduced specificity in identifying nucleotide sequences. |
| Integer (IBNE) [12] | Not Specified | Simple and intuitive assignment. | May not leverage biological properties. |
| Voss (OBNE) [12] | Not Specified | Established position-based encoding. | High computational cost from high-dimensional representation. |
Recent research evaluates the representational power of pre-trained genomic Language Models (gLMs). These models, such as Nucleotide Transformer and DNABERT2, use self-supervised learning on whole genomes to generate contextual embeddings for DNA sequences [13]. However, current benchmarks indicate that for many regulatory genomics tasks, highly tuned supervised models using simple one-hot encoded sequences can achieve performance competitive with or superior to these pre-trained gLMs, highlighting an ongoing area of development [13].
Experimental Protocol: Hadamard Encoding for Exon Identification
This protocol details the application of the Hadamard Based Numerical Encoding (HBNE) method for identifying protein-coding regions in genomic sequences, using the Caenorhabditis elegans Cosmid F56F11 gene sequence as a benchmark [12].
Research Reagent Solutions and Computational Tools
Table 3: Essential Materials and Software Tools
| Item Name | Function/Description | Specification/Version |
|---|---|---|
| Genomic DNA Sequence | The raw biological data for analysis. | Caenorhabditis elegans Cosmid F56F11 (NCBI Accession: FO081497) [12] |
| Hadamard Matrix (4th Order) | Generates orthogonal numerical codes for nucleotides. | A specific 4x4 orthogonal matrix used for mapping [12]. |
| Elliptic Filter | Extracts period-3 spectral components from the numerical signal. | Digital filter design for selective frequency bandpass [12]. |
| Gaussian Window | Smooths the output signal to refine coding region identification. | Applied to reduce spectral leakage and noise [12]. |
| Computational Environment | Platform for implementing the signal processing pipeline. | MATLAB or Python (with NumPy, SciPy libraries) [12] |
Step-by-Step Procedure
- Sequence Acquisition and Preprocessing: Obtain the FASTA format DNA sequence from the NCBI database (e.g., F56F11). Remove any non-nucleotide characters and ensure the sequence is a single, continuous string of 'A', 'T', 'G', and 'C' [12].
- Numerical Mapping via HBNE: Convert the symbolic DNA sequence into a numerical sequence using the Hadamard encoding scheme. Assign to each nucleotide a specific numerical value derived from the fourth-order Hadamard matrix to create a discrete-time numerical signal [12].
- Spectral Analysis with Digital Filtering:
- Apply a Digital Elliptic Filter to the numerical sequence. This filter is designed to have a sharp frequency response, allowing it to isolate the period-3 component (around frequency 1/3) while attenuating other frequencies associated with non-coding regions [12].
- Process the filtered signal with a Gaussian Window to smooth the output, which helps in obtaining a clear and localized identification of potential exons by reducing spectral leakage [12].
- Visualization and Peak Detection: Plot the final processed signal magnitude against the nucleotide position. Protein-coding regions (exons) will appear as prominent peaks in this spectrum. Compare the predicted exon locations with known annotation files for the gene to validate the results [12].
- Performance Calculation: Calculate standard performance metrics by comparing predictions against known annotations.
- Sensitivity: Proportion of true exonic bases correctly identified.
- Specificity: Proportion of true non-exonic bases correctly identified.
- Accuracy: Overall proportion of correctly classified bases.
- Area Under the Curve (AUC): Measure of the overall discriminative power, derived from the Receiver Operating Characteristic (ROC) curve [12].
Application in Cancer DNA Pattern Recognition
The translation of DNA sequences into numerical signals is pivotal for PPPM in oncology. Cancer is a complex, whole-body disease involving multi-factors, multi-processes, and multi-consequences [11]. A single biomarker is often insufficient for accurate prediction, diagnosis, or prognosis. Pattern recognition using multi-parameter molecular patterns derived from numerical representations of genomic data offers a more robust framework [11].
Molecular alterations at the genome level (e.g., mutations, Copy Number Alterations - CNA) initiate tumorigenesis. Identifying the pattern of these alterations, rather than single mutations, is critical. As noted, a typical cancer model requires mutations in two to eight "driver genes" [11]. Numerical encoding facilitates the large-scale analysis needed to detect these mutational patterns, gene expression signatures, and regulatory element variations from high-throughput sequencing data [11]. For instance, combining SNP patterns with other omics data (transcriptomics, proteomics, metabolomics) can form an integrative diagnostic pattern that significantly improves the positive detection rate compared to a single biomarker assay [11].
Advanced deep learning techniques build upon these numerical foundations. Word embedding-based methods like Word2Vec and GloVe, and modern large language models (LLMs) based on Transformer architectures, can capture complex contextual relationships and long-range dependencies in biological sequences [14]. These models are being applied to tasks such as protein function annotation, RNA structure prediction, and the interpretation of regulatory genomics data, pushing the frontiers of cancer genomics research [14] [13].
The integration of signal processing principles with genomic analysis has given rise to the field of Genomic Signal Processing (GSP), fundamentally advancing cancer research. GSP applies mathematical transform techniques, such as Discrete Wavelet Transforms (DWT) and Fourier analysis, to numerical representations of DNA sequences, allowing for the identification of patterns that are imperceptible through conventional biological methods [8] [4]. This approach enables researchers to model the genome as a complex information transmission system, where key signal features—amplitude, frequency, and entropy—can be quantified to reveal the dysfunctional signaling states that characterize cancer cells [15] [16].
The central thesis of this application note is that cancer fundamentally alters cellular information processing, and these changes can be systematically quantified by analyzing genomic and signaling pathway data through a signal processing lens. For instance, oncogenic transformations can severely corrupt a cell's capacity to perceive its environment, reducing the information transmission rate through critical signaling pathways to a fraction of that in healthy cells [15]. Similarly, specific entropy patterns and frequency-domain features derived from cancerous DNA sequences serve as reliable biomarkers for automated cancer classification [8]. The protocols herein provide a framework for detecting these diagnostic signal features, offering researchers robust tools for cancer pattern recognition.
Theoretical Foundation: Signal Processing in Cancer Genomics
Information Theory and Entropy in Cancer Signaling
At the core of this approach is Shannon information theory, which provides quantitative metrics to assess the rate of information transfer through biological communication channels, such as signaling pathways [15]. Information entropy serves as a sensitive metric for dysfunction. A landmark study demonstrated this by quantifying the Shannon information capacity of Receptor Tyrosine Kinase (RTK) signaling in both non-transformed cells (BEAS-2B) and EML4-ALK-driven lung cancer cells (STE-1) [15]. The study revealed a stark contrast: while healthy cells transmitted information at a rate of approximately 7 bits/hour, the information capacity in cancerous cells was drastically reduced to less than 0.5 bits/hour [15]. This information bottleneck was not permanent; therapeutic intervention with an ALK inhibitor (e.g., crizotinib) partially restored the information rate to 3 bits/hour, demonstrating that information entropy is a reversible metric of oncogenic dysfunction and drug efficacy [15].
Frequency and Amplitude Modulation in Cellular Networks
Biological systems natively employ frequency modulation (FM) and amplitude modulation (AM) for information encoding [16]. Research in bacterial second messenger systems has shown that frequency-encoded signals can be decoded into distinct gene expression patterns, a process governed by filtering modules that perform frequency-to-amplitude conversion [16]. The physical principles of this conversion reveal that frequency modulation can significantly expand the accessible state space of a biological system. In a three-gene regulatory system, the joint application of frequency and duty cycle control can yield approximately two additional bits of information entropy compared to amplitude-only control, effectively quadrupling the number of distinguishable expression states [16]. This underscores the critical importance of analyzing temporal dynamics, not just signal intensity, to fully understand the corrupted information processing in cancer.
Experimental Protocols
Protocol 1: DWT-Based Classification of Cancerous Genomic Sequences
This protocol details a method for differentiating cancerous from non-cancerous gene sequences using Discrete Wavelet Transform (DWT) and machine learning, achieving high classification accuracy [8].
- 1. Objective: To automatically identify cancerous genomic sequences (e.g., for lung, breast, or ovarian cancer) by extracting statistical signal features from wavelet-domain representations.
- 2. Materials:
- Genomic Sequences: Cancerous and non-cancerous DNA sequences for specific cancer types, sourced from databases like NCBI [8].
- Software Tools: Computational environment for signal processing and machine learning (e.g., MATLAB, Python with SciPy/scikit-learn).
- 3. Procedure:
- Step 1: Numerical Mapping. Convert the genomic DNA sequences (composed of A, T, C, G) into numerical indicator sequences. A common complex representation is used, which is suitable for subsequent GSP techniques [8].
- Step 2: Wavelet Decomposition. Apply a four-level Discrete Wavelet Transform (DWT) using the Haar wavelet to the numerical sequence. This decomposes the signal into approximation and detail coefficients, capturing patterns at multiple resolutions [8].
- Step 3: Feature Extraction. From the wavelet domain coefficients, calculate the following six statistical features for each sequence: Mean, Median, Standard Deviation, Interquartile Range, Skewness, and Kurtosis [8].
- Step 4: Model Training and Classification. Use the extracted statistical features as input to a machine learning classifier. The Support Vector Machine (SVM) classifier has been shown to achieve high accuracy in distinguishing cancerous from non-cancerous sequences based on these features [8].
The workflow for this protocol is standardized and can be visualized as follows:
Protocol 2: Quantifying Information Capacity in Live-Cell Signaling Pathways
This protocol employs optogenetics, live-cell imaging, and information theory to quantify how cancer and drugs alter the information capacity of signaling pathways [15].
- 1. Objective: To compare the information transmission rate (bitrate) of the RTK/ERK signaling pathway between non-transformed and cancerous cell lines, and to evaluate the effects of targeted inhibitors.
- 2. Materials:
- Cell Lines: Non-transformed (e.g., BEAS-2B) and cancerous (e.g., patient-derived STE-1) cell lines [15].
- Optogenetic System: Cells engineered to express optoFGFR (a light-inducible FGF receptor) and an ERK activity reporter (ERK-KTR) [15].
- Live-Cell Imaging Setup: Microscope with environmental control and precise light stimulation capability.
- Reagents: Targeted inhibitors (e.g., ALKi Crizotinib, MEKi Trametinib, CALCi Cyclosporine A) [15].
- 3. Procedure:
- Step 1: Pseudorandom Stimulation. Stimulate the optoFGFR pathway in single cells with a pseudorandom series of light pulses. The intervals between pulses should follow a fixed distribution (e.g., from 5 to 35 minutes) designed to sample a broad range of input frequencies [15].
- Step 2: Response Monitoring. Record the dynamics of ERK activity by imaging the nucleocytoplasmic translocation of the ERK-KTR reporter every minute throughout the stimulation period [15].
- Step 3: Signal Reconstruction. Train a multilayer perceptron (MLP), a type of artificial neural network, to reconstruct the input light pulse sequence from the observed ERK-KTR trajectory. The model uses a short fragment of the trajectory and the time since the last pulse as key inputs [15].
- Step 4: Information Calculation. Compute the transmitted information rate, I(X;Y), as the input information rate (entropy of the stimulus, H(X)) minus the reconstruction entropy rate (uncertainty in the stimulus given the response, H(X|Y)). The channel capacity is the maximum achievable information rate under optimal encoding [15].
The experimental setup and information flow for this protocol are complex, as shown in the following diagram:
Data Presentation and Analysis
Quantitative Analysis of Information Capacity
The following table summarizes quantitative findings from the application of information theory to live-cell signaling data, highlighting cancer-induced deficits and drug-induced recoveries in information transmission [15].
Table 1: Information Transmission Rates in RTK/ERK Signaling Pathway
| Cell Line / Condition | Information Transmission Rate (bits/hour) | Key Experimental Condition |
|---|---|---|
| BEAS-2B (Non-transformed) | ~7.0 | Baseline optoFGFR stimulation [15] |
| STE-1 (EML4-ALK Cancer) | < 0.5 | Baseline optoFGFR stimulation [15] |
| STE-1 + ALK Inhibitor | ~3.0 | Treatment with crizotinib [15] |
The Scientist's Toolkit: Research Reagent Solutions
The table below catalogs essential reagents and their functions for conducting experiments in cancer genomic signal processing and signaling pathway analysis.
Table 2: Essential Research Reagents and Materials
| Item Name | Function/Application |
|---|---|
| optoFGFR | An optogenetic FGF receptor fusion protein (Cry2-FGFR1). Allows precise, pulsatile activation of the RTK pathway with light, replacing biochemical ligands for superior temporal control [15]. |
| ERK-KTR Reporter | A live-cell biosensor (Kinase Translocation Reporter) that undergoes nucleocytoplasmic shuttling upon ERK phosphorylation. Enables minute-resolution tracking of ERK activity dynamics via fluorescence imaging [15]. |
| ALK Inhibitor (Crizotinib) | A targeted therapeutic drug used in protocol 2 to investigate the restoration of information capacity in EML4-ALK driven cancer cells [15]. |
| Haar Wavelet | A specific wavelet function used in the DWT for genomic signal analysis. It is effective for detecting sharp transitions and features in numerical representations of DNA sequences [8]. |
| Support Vector Machine (SVM) | A machine learning classifier used to differentiate cancerous from non-cancerous sequences based on statistical features extracted from the wavelet domain, noted for achieving high classification accuracy [8]. |
The protocols and data presented herein demonstrate that the signal processing framework provides a powerful, quantitative lens through which to view cancer. The corrupting influence of oncogenes extends beyond simple constitutive activation to a fundamental degradation of information fidelity and throughput, as quantified by entropy and bitrate measures [15]. Furthermore, the successful classification of cancerous genomes using DWT-derived features confirms that these information deficits are encoded in the static DNA sequence itself, manifesting as discernible patterns in the frequency domain [8].
The implications for drug development are substantial. Information-theoretic metrics like channel capacity offer a novel, sensitive, and functional readout for evaluating targeted therapies, moving beyond traditional amplitude-based measures of pathway inhibition [15]. The restoration of information flow, not just the suppression of a signal, could become a new benchmark for therapeutic efficacy.
Future research directions will involve the deeper integration of cloud-scale genomic signal processing to handle the computational demands of large-scale cancer genomic datasets [17]. Furthermore, the application of explainable AI (XAI) and advanced neural network models like large language models (LLMs) to DNA methylation and other epigenomic data presents a promising frontier for uncovering deeper, more causal patterns in cancer epigenetics [18]. By continuing to leverage the tools of signal processing and information theory, researchers can decode the complex language of cancer genomes, accelerating the development of sophisticated diagnostics and therapeutics.
Advanced Methodologies and Real-World Applications in Cancer Diagnostics
Machine and Deep Learning Integration with GSP for Classification
Application Notes: The Role of GSP and ML in Cancer Genomics
The integration of Graph Signal Processing (GSP) with machine learning (ML) and deep learning (DL) creates a powerful paradigm for analyzing complex biological data, particularly for cancer classification based on genomic signatures. This approach excels at capturing spatial relationships and structural dependencies within genetic information that traditional methods often miss.
Core Analytical Strengths and Documented Performance
GSP techniques, particularly the Graph Fourier Transform (GFT), provide a mathematical framework for analyzing signals defined on graph structures. This is exceptionally valuable for representing irregular, non-Euclidean relationships inherent in biological networks, such as gene interactions or spatial tumor morphology. When integrated with ML, these techniques enable a more comprehensive representation of tumor characteristics by capturing both spatial proximity and spectral characteristics [19].
Recent research demonstrates the superior performance of integrated approaches:
- Brain Tumor Classification: A GFT-based feature extraction method combined with ML classifiers achieved 94.91% accuracy on the Kaggle-253 dataset and 98.50% on the BR35H dataset, significantly outperforming models without GSP-based features [19].
- Multi-Cancer Classification from DNA: A blended ensemble model combining Logistic Regression and Gaussian Naive Bayes achieved accuracies of up to 100% for certain cancer types (BRCA1, KIRC, COAD) and 98% for others (LUAD, PRAD) on a dataset of 390 patients [5].
- Advanced Multi-Representation Frameworks: The GraphVar framework, which integrates mutation-derived imaging and numeric genomic features using a ResNet-18 backbone and a Transformer encoder, reported an overall accuracy of 99.82% across 33 cancer types from 10,112 patients in the TCGA cohort [20].
The table below summarizes quantitative performance benchmarks from recent studies.
Table 1: Performance Benchmarks of Integrated GSP-ML/DL Models in Cancer Classification
| Model/Framework | Core Methodology | Data Type | Cancer Types | Key Performance Metric |
|---|---|---|---|---|
| GFT + RF/LGBM [19] | Graph Fourier Transform with ML classifiers | Brain MRI | Brain Tumors | Accuracy: 94.91% (Kaggle-253), 98.50% (BR35H) |
| Blended Ensemble [5] | Logistic Regression + Gaussian Naive Bayes | DNA Sequences | 5 types (e.g., BRCA, LUAD) | Accuracy: 98-100%; ROC AUC: 0.99 |
| GraphVar [20] | ResNet-18 + Transformer on variant maps & numeric features | Somatic Mutations (TCGA) | 33 types | Accuracy: 99.82%; F1-Score: 99.82% |
| MARLIN [21] | Neural Network on DNA Methylation Patterns | DNA Methylation (Nanopore) | Acute Leukemia (38 subtypes) | Rapid classification in <2 hours; high accuracy |
Key Applications in Cancer Research
The primary application of this integration is accurate cancer type and subtype classification, which is fundamental for precision oncology. This is critical because the same cancer type can have different molecular subtypes that respond differently to treatments. For instance, the MARLIN tool uses DNA methylation patterns to classify 38 distinct subtypes of acute leukemia, resolving diagnostic "blind spots" that conventional methods can miss [21].
Another crucial application is biomarker discovery and interpretability. Models like GraphVar employ techniques such as Gradient-weighted Class Activation Mapping (Grad-CAM) to highlight which genes or genomic regions were most influential in the classification decision, thereby identifying potential novel biomarkers or validating known ones [20]. Similarly, SHAP analysis on DNA sequencing data has shown that model decisions are often dominated by a small subset of features, indicating strong potential for dimensionality reduction and focused biological validation [5].
Experimental Protocols
This section provides detailed, replicable methodologies for implementing GSP and ML/DL for genomic cancer classification, based on published frameworks.
Protocol 1: GFT-Based Feature Extraction for Classification
This protocol is adapted from methodologies that have successfully classified brain tumors from MRI data [19] and can be adapted for genomic spatial data.
2.1.1 Reagents and Materials
- Dataset: Genomic data (e.g., from TCGA [22] [20]) or spatial transcriptomics data.
- Software: Python (v3.10+) with libraries: Scikit-learn, NumPy, PyTorch/TensorFlow, and GSP libraries (e.g., PyGSP).
- Computing: Standard workstation (16GB RAM, multi-core CPU); GPU optional for this protocol.
2.1.2 Step-by-Step Procedure
Graph Construction:
- Represent your data as a graph ( G = (V, E, W) ), where ( V ) is a set of nodes (e.g., individual genes, genomic loci, or image pixels), ( E ) is a set of edges connecting related nodes, and ( W ) is a weight matrix defining the strength of these connections.
- Edge-Weighting: Define the relationships between nodes. Two common techniques are:
- Binary Weighting: ( W{ij} = 1 ) if nodes ( i ) and ( j ) are connected (e.g., adjacent genomic regions, physically interacting proteins), else ( 0 ) [19].
- Gaussian Weighting: ( W{ij} = \exp(-\frac{{||xi - xj||}^2}{2\sigma^2}) ), where ( xi ) and ( xj ) are feature vectors of nodes ( i ) and ( j ), and ( \sigma ) is a scaling parameter. This captures intensity similarity [19].
Graph Laplacian Calculation:
- Compute the Graph Laplacian matrix ( L = D - W ), where ( D ) is the diagonal degree matrix (( D{ii} = \sumj W_{ij} )).
Spectral Decomposition:
- Perform eigenvalue decomposition of the Laplacian: ( L = U \Lambda U^T ).
- The eigenvectors ( U ) form the Graph Fourier Basis, analogous to the classical Fourier basis, but tailored to the graph structure.
Graph Fourier Transform (GFT):
- For a graph signal ( f ) (a scalar value defined on each node, like gene expression), compute its GFT as ( \hat{f} = U^T f ).
- The resulting ( \hat{f} ) represents the signal's expansion in the spectral domain of the graph, capturing its frequency components.
Feature Resampling (Optional):
- If the dataset has class imbalance (e.g., many more normal samples than tumor), apply the Synthetic Minority Oversampling Technique (SMOTE) to the extracted GFT features to create a balanced training set [19].
Model Training and Classification:
The following workflow diagram illustrates the GFT-based feature extraction protocol:
Protocol 2: Multi-Representation Deep Learning for Pan-Cancer Classification
This protocol is inspired by the GraphVar framework [20] and is designed for high-throughput somatic mutation data from projects like TCGA.
2.2.1 Reagents and Materials
- Data: Somatic variant data in Mutation Annotation Format (MAF) from TCGA or similar consortium.
- Software: Python (v3.10+) with PyTorch (v2.2.1+), Scikit-learn, OpenCV, and Transformers library.
- Computing: High-performance computing node with multiple GPUs (e.g., NVIDIA A100/V100) for efficient training of large models.
2.2.2 Step-by-Step Procedure
Data Curation and Partitioning:
- Download and curate MAF files, removing duplicate patient entries.
- Partition the data at the patient level into training (70%), validation (10%), and a held-out test set (20%) using stratified sampling to preserve class proportions [20].
Dual-Input Feature Generation:
- Variant Map Construction (Image Modality):
- Organize mutated genes based on their chromosomal positions (chromosomes 1-22, X, Y).
- Encode different variant types into pixel intensities in a 2D image: SNPs (Blue), Insertions (Green), Deletions (Red) [20].
- This creates a spatial, image-like representation of the mutational landscape of a sample.
- Numeric Feature Matrix Construction:
- Calculate a 36-dimensional feature vector for each sample, including population allele frequencies and probabilities across 6 somatic mutation spectra (e.g., C>A, C>G, C>T, T>A, T>C, T>G) [20].
- Variant Map Construction (Image Modality):
Dual-Stream Model Architecture:
- Image Stream: Use a pre-trained ResNet-18 convolutional neural network (CNN) as a backbone to extract high-level spatial features from the variant maps [20].
- Numeric Stream: Use a Transformer encoder to model complex, long-range dependencies within the 36-dimensional numeric feature matrix. The attention mechanism is key here [20].
- Feature Fusion: Concatenate the feature embeddings from the ResNet-18 and Transformer branches into a comprehensive feature vector.
Model Training and Interpretation:
- Feed the fused feature vector into a fully connected classification head with a softmax output layer for final cancer type prediction.
- Use Gradient-weighted Class Activation Mapping (Grad-CAM) on the variant maps to visualize and biologically validate which genomic regions the model prioritized for its decision [20].
The following workflow diagram illustrates the multi-representation deep learning protocol:
Successful implementation of the described protocols requires a suite of data, computational tools, and algorithms. The table below catalogs key resources.
Table 2: Essential Research Reagents and Computational Tools for GSP-ML Integration
| Category | Item | Function/Description | Example Sources |
|---|---|---|---|
| Genomic Data | The Cancer Genome Atlas (TCGA) | Provides comprehensive, multi-omics data (genomic, transcriptomic, epigenomic) from over 11,000 tumor samples across 33+ cancer types for model training and validation. | [23] [22] [20] |
| NIST Cancer Genome in a Bottle | Provides a benchmark, ethically-sourced, whole-genome sequenced cancer cell line (pancreatic) for quality control and technology development. | [24] | |
| Computational Algorithms | Graph Fourier Transform (GFT) | Core GSP operation that transforms a graph signal into its spectral components, enabling the analysis of spatial patterns and relationships. | [19] |
| Convolutional Neural Network (CNN) | Deep learning architecture ideal for processing image-like data, such as variant maps or MRIs, to extract hierarchical spatial features. | [23] [20] | |
| Transformer Encoder | Advanced neural network architecture that uses self-attention mechanisms to weigh the importance of different elements in a sequence (e.g., numeric feature vectors). | [20] | |
| Software & Libraries | PyTorch / TensorFlow | Open-source libraries for developing and training deep learning models. Provide flexibility for custom architectures like GraphVar. | [20] |
| Scikit-learn | Provides a wide array of traditional ML algorithms (e.g., Random Forest) and utilities for data preprocessing and model evaluation. | [5] [19] | |
| Analytical Techniques | Stratified K-Fold Cross-Validation | A resampling procedure used to evaluate a model by partitioning the data into 'k' folds while preserving the percentage of samples for each class, ensuring robust performance estimation. | [5] |
| Gradient-weighted Class Activation Mapping (Grad-CAM) | A technique for producing visual explanations for decisions from a wide range of CNN-based models, making them more interpretable. | [22] [20] | |
| SHAP (SHapley Additive exPlanations) | A game theory-based method to explain the output of any machine learning model, identifying the contribution of each feature to the prediction. | [5] |
The detection of DNA methylation patterns represents a critical frontier in the advancement of cancer diagnostics and personalized medicine. DNA methylation, defined as the addition of a methyl group to the cytosine ring within CpG dinucleotides, serves as a fundamental epigenetic modification that regulates gene expression without altering the underlying DNA sequence [25]. This process is mediated by DNA methyltransferases (DNMTs) including DNMT1, DNMT3a, and DNMT3b, which act as "writers" of methylation marks, while ten-eleven translocation (TET) family enzymes function as "erasers" through active demethylation processes [25]. In cancerous tissues, both global hypomethylation and locus-specific hypermethylation contribute to carcinogenesis by silencing tumor suppressor genes and activating oncogenes, making methylation patterns highly valuable biomarkers for early cancer detection [26].
The analysis of cell-free DNA (cfDNA) circulating in blood plasma presents particular promise for non-invasive cancer detection, though it introduces significant signal processing challenges due to the exceptionally low abundance of tumor-derived cfDNA, especially during early cancer stages [27]. Signal processing methodologies must therefore evolve to extract meaningful epigenetic signals from this complex biological background noise, driving innovation in both biochemical assays and computational analysis techniques.
Methylation Detection Technologies: A Comparative Analysis
The accurate profiling of DNA methylation patterns relies on multiple technological platforms, each with distinct advantages, limitations, and appropriate applications. These methods generally fall into three categories: bisulfite conversion-based sequencing, enrichment-based approaches, and microarray technologies.
Whole-genome bisulfite sequencing (WGBS) currently represents the gold standard for comprehensive methylation analysis, providing single-base resolution across the entire genome [26]. Reduced representation bisulfite sequencing (RRBS) offers a more targeted approach by focusing on CpG-rich regions, thereby reducing sequencing costs and computational requirements [25]. For clinical applications requiring high throughput, Illumina's Infinium HumanMethylation BeadChip arrays (450K and 850K) provide a cost-effective solution for profiling pre-selected CpG sites [25]. More recently, enhanced linear splint adapter sequencing (ELSA-seq) has emerged as a promising method for detecting circulating tumor DNA (ctDNA) methylation with high sensitivity and specificity, making it particularly suitable for liquid biopsy applications [25].
Table 1: Comparison of DNA Methylation Detection Techniques
| Technique | Resolution | Coverage | Cost | Primary Applications | Key Limitations |
|---|---|---|---|---|---|
| WGBS | Single-base | Genome-wide | High | Comprehensive methylome mapping, discovery | High cost, computationally intensive [25] |
| RRBS | Single-base | CpG-rich regions | Medium | Regional methylation analysis, biomarker validation | Limited to regions with specific CpG density [25] |
| BeadChip Arrays | Single CpG site | Pre-defined sites (~850,000) | Low | High-throughput screening, clinical applications | Limited to pre-designed CpG sites [25] [26] |
| ELSA-seq | Single-base | Targeted regions | Medium | Liquid biopsy, MRD monitoring, cancer recurrence | Requires prior knowledge of target regions [25] |
| MeDIP-seq | ~100-500 bp | Genome-wide | Medium | Methylated region enrichment | Lower resolution, antibody-dependent [25] |
Each methodology generates distinct data types and signal-to-noise characteristics that directly influence subsequent processing requirements. WGBS and RRBS produce nucleotide-resolution methylation ratios but require extensive sequencing depth and sophisticated alignment algorithms to account for bisulfite-induced sequence conversion. BeadChip arrays provide discrete methylation β-values but are constrained by their predetermined genomic coverage. The selection of an appropriate detection technology must therefore balance resolution needs, cost constraints, and specific research objectives.
Targeted Methylation Sequencing for Multi-Cancer Detection
Targeted methylation sequencing has emerged as a particularly powerful approach for multi-cancer early detection from blood-based liquid biopsies. This methodology focuses on specific genomic regions known to exhibit differential methylation patterns between normal and cancerous tissues, offering enhanced sensitivity for detecting low-abundance tumor-derived cfDNA against a background of predominantly normal cfDNA [27].
The Circulating Cell-free Genome Atlas (CCGA) study, a prospective, observational, longitudinal clinical trial conducted by GRAIL, provided seminal insights into the comparative performance of methylation-based approaches. In its first phase, the CCGA compared three next-generation sequencing techniques: whole-genome sequencing, targeted mutation detection, and targeted methylation sequencing. The results demonstrated that targeted methylation analysis significantly outperformed both alternative approaches in distinguishing cancerous from non-cancerous samples [27]. Based on these findings, the study progressed with targeted methylation analysis as its primary methodology for subsequent phases.
The targeted approach employed in CCGA utilized custom capture probes covering more than 100,000 distinct genomic regions and encompassing over one million individual methylation sites [27]. This extensive coverage required specialized probe synthesis capabilities, which were facilitated through collaboration with Twist Bioscience, leveraging their high-throughput oligonucleotide synthesis technologies to produce the necessary targeted enrichment panels [27].
Table 2: Key Research Reagent Solutions for Targeted Methylation Sequencing
| Reagent/Component | Function | Example Specification | Application Note |
|---|---|---|---|
| Targeted Enrichment Panels | Hybridization capture of methylated genomic regions | >100,000 regions; >1 million CpG sites [27] | Custom design required for specific cancer types |
| Bisulfite Conversion Reagents | Chemical conversion of unmethylated cytosines to uracils | >99% conversion efficiency | Critical step that requires optimization to minimize DNA degradation [25] |
| NGS Methylation Detection System | Integrated reagents for library prep and capture | Reduced bias and off-target capture [27] | Twist Bioscience system enhances capture uniformity |
| Methylation-Specific PCR Primers | Amplification of converted DNA | Specific to methylated/unmethylated sequences after bisulfite treatment | Useful for validation but limited scalability [25] |
A critical technical consideration in methylation sequencing involves the timing of bisulfite conversion relative to library amplification and capture. For low-abundance targets like cfDNA, the pre-capture conversion approach is generally preferred, where bisulfite conversion occurs before amplification and capture. This sequence increases library complexity and reduces input DNA requirements, though it necessitates specialized probe design to control for off-target capture and maintain high sensitivity [27].
Interim results from the CCGA study's second phase demonstrated remarkable performance characteristics, with the ability to detect more than 50 cancer types across all stages at greater than 99% specificity, while also localizing the tissue of origin with over 90% accuracy [27]. These findings underscore the transformative potential of targeted methylation sequencing as a foundation for multi-cancer early detection tests.
Experimental Protocol: Targeted Methylation Sequencing from Plasma cfDNA
Sample Collection and DNA Extraction
Begin with collection of peripheral blood into cell-stabilizing tubes (e.g., Streck Cell-Free DNA BCT) to prevent genomic DNA contamination from leukocyte lysis. Process samples within 24-48 hours of collection through differential centrifugation: 800-1600 × g for 10 minutes at room temperature to separate plasma from cellular components, followed by 16,000 × g for 10 minutes to remove remaining debris. Isolate cfDNA from 4-10 mL of plasma using silica membrane-based extraction kits specifically validated for low-concentration samples. Quantify extracted cfDNA using fluorometric methods sensitive to low DNA concentrations (e.g., Qubit dsDNA HS Assay). Expect yields of 5-30 ng/mL plasma, with higher amounts potentially indicating underlying pathology.
Library Preparation with Pre-Capture Bisulfite Conversion
Dilute cfDNA to 5-10 ng in 20-50 μL TE buffer. Add freshly prepared bisulfite conversion reagent (commercial kits recommended) and incubate using thermal cycling conditions optimized to maximize conversion while minimizing DNA fragmentation: denaturation at 95°C for 30-60 seconds, incubation at 60°C for 20-45 minutes, and optional repeated cycles. Desalt converted DNA using column-based purification and elute in low-volume Tris-EDTA buffer. Proceed immediately to library construction to minimize degradation.
For library preparation, add adapters with unique molecular identifiers (UMIs) to account for amplification biases and PCR duplicates during data analysis. Use polymerase enzymes capable of reading uracil bases resulting from bisulfite conversion. Amplify libraries with 8-12 PCR cycles to generate sufficient material for hybridization capture while maintaining library complexity.
Targeted Capture and Sequencing
Dilute amplified libraries to 100-500 ng in hybridization buffer and combine with targeted methylation panel (e.g., Twist Bioscience Methylation Panel). Incubate at 65°C for 16-24 hours with agitation. Wash with increasingly stringent buffers to remove non-specifically bound DNA. Elute captured DNA and amplify with 10-14 PCR cycles using indexing primers for sample multiplexing. Quality control includes capillary electrophoresis for size distribution (expected peak ~300 bp) and qPCR for quantification.
Pool indexed libraries in equimolar ratios and sequence on Illumina platforms (NovaSeq recommended) to achieve minimum coverage of 1000x per CpG site. Include non-methylated lambda phage DNA spike-in controls to monitor bisulfite conversion efficiency, targeting >99% conversion.
Computational Analysis of Methylation Data
Primary Data Processing and Quality Control
Begin analysis with raw sequencing files (FASTQ format). Assess quality metrics using FastQC or MultiQC, focusing on per-base sequence quality, adapter contamination, and bisulfite conversion efficiency. Align reads to a bisulfite-converted reference genome using specialized aligners such as Bismark, BSMAP, or BS-Seeker2, accounting for C-to-T conversions. Retain only properly paired reads with mapping quality scores >20. Remove PCR duplicates using UMI information to prevent amplification bias. Calculate methylation ratios at each CpG site by counting converted versus unconverted reads, requiring minimum coverage of 10-20x per site for reliable quantification.
Advanced Signal Processing and Machine Learning Approaches
Machine learning algorithms have revolutionized the interpretation of complex methylation data by identifying subtle patterns indicative of cancerous transformation. Both conventional supervised methods and deep learning architectures play crucial roles in this analytical pipeline.
Conventional supervised methods including support vector machines (SVM), random forests (RF), and gradient boosting have demonstrated strong performance for classification tasks using methylation array or sequencing data [25]. These approaches are particularly valuable for sample classification (cancer vs. normal), tissue-of-origin identification, and feature selection across tens to hundreds of thousands of CpG sites.
More recently, deep learning architectures have shown remarkable capability in capturing nonlinear interactions between CpG sites and genomic context. Convolutional neural networks (CNNs) can identify spatially correlated methylation patterns across genomic regions, while multilayer perceptrons (MLPs) excel at integrating multimodal data [26]. Recurrent neural networks (RNNs) and their variants (LSTM, GRU) can model sequential dependencies along chromosomal coordinates.
Most promisingly, transformer-based foundation models pretrained on extensive methylome datasets (e.g., MethylGPT, CpGPT) have demonstrated robust cross-cohort generalization and contextually aware CpG embeddings that transfer efficiently to age and disease-related outcomes [25]. These models enhance analytical efficiency in limited clinical populations and represent the cutting edge of methylation signal processing.
The integration of advanced signal processing methodologies with DNA methylation analysis has created a powerful paradigm for cancer detection and classification. Targeted methylation sequencing, particularly when combined with machine learning algorithms, demonstrates exceptional performance in multi-cancer early detection from liquid biopsy samples, with specificities exceeding 99% and accurate tissue-of-origin localization in over 90% of cases [27]. These capabilities position methylation-based diagnostics as transformative tools for clinical oncology.
Future developments in this field will likely focus on several key areas: enhanced sensitivity for stage I cancers through improved signal-to-noise ratio in cfDNA analysis, standardization of analytical pipelines across platforms and institutions, and the integration of methylation signatures with other molecular markers including mutations and fragmentomics patterns. Furthermore, the emergence of agentic AI systems that combine large language models with computational tools shows promise for automating complex bioinformatics workflows, though these approaches require further validation before clinical implementation [25].
As these technologies mature and evidence of clinical utility accumulates, methylation-based signal processing is poised to transition from research settings to routine clinical practice, ultimately fulfilling the promise of precision oncology through non-invasive, comprehensive molecular profiling.
The integration of advanced signal processing (SP) methods with genomic data is revolutionizing the early detection and classification of cancers. This case study explores the application of SP techniques for identifying DNA patterns in three major malignancies: lung, breast, and ovarian cancers. By analyzing complex genomic signatures through computational approaches, researchers can achieve unprecedented accuracy in cancer detection, often surpassing traditional biomarker-based methods. These advancements are particularly crucial for cancers where early detection significantly improves survival outcomes but has historically been challenging.
The following sections detail specific SP methodologies, their performance metrics across different cancer types, and the experimental protocols required to implement these cutting-edge approaches. We focus on techniques that analyze nucleotide sequences, fragmentomic patterns, and multi-omic integrations to demonstrate how signal processing transforms raw genomic data into clinically actionable information.
Key Methodologies and Performance Data
Recent research has yielded several promising SP-based approaches for cancer detection, each with distinct technical foundations and performance characteristics.
Table 1: Performance Metrics of Featured SP-Based Cancer Detection Methods
| Cancer Type | Methodology | Core SP Feature | Sensitivity (Stage I) | Specificity | AUC | Sample Size |
|---|---|---|---|---|---|---|
| Lung Cancer | Nucleotide Transition Probability [28] | First-Order Transition Probability (FOTP) in cfDNA | 73.9% | 95% | 0.942 | 1,036 participants |
| Breast Cancer | Blended Machine Learning [5] | DNA sequence classification via Logistic Regression + Gaussian NB | 98-100% (across types) | N/R | 0.99 (micro/macro avg) | 390 patients |
| Ovarian Cancer | AI-Powered Multi-Omic Platform [29] | Integrated lipid, ganglioside, and protein biomarkers | 89% (Stage I/II) | N/R | 0.89-0.92 | ~1,000 samples |
Table 2: Technical Implementation Details of Featured Methods
| Methodology | Data Input | Computational Framework | Key Advantages | Implementation Challenges |
|---|---|---|---|---|
| Nucleotide Transition Probability [28] | Plasma cfDNA, low-pass WGS | SVM classifier | High sensitivity for early-stage disease; Biologically interpretable features | Requires WGS capabilities |
| Blended Machine Learning [5] | Patient DNA sequences | Ensemble (Logistic Regression + Gaussian Naive Bayes) | Lightweight, interpretable model; Minimal feature requirement | Limited to trained cancer types |
| AI-Powered Multi-Omic Platform [29] | Blood-based lipids, gangliosides, proteins | Machine learning integration of multi-omic data | High accuracy in symptomatic population; Comprehensive molecular view | Complex assay requirements (LC-MS, immunoassays) |
| One-Shot Learning Framework [30] | Gene expression + mutational profiles | Siamese Neural Networks | Effective with limited samples; Handles unseen cancer types | Complex implementation; Requires explainability techniques |
Experimental Protocols
Protocol 1: Nucleotide Transition Probability Analysis for Lung Cancer Detection
Principle: This method detects lung cancer by analyzing nucleotide sequential dependencies within cell-free DNA fragments, leveraging the finding that the first 10 bp at the 5′ end harbor the most discriminative information for cancer detection [28].
Reagents and Materials:
- Blood collection tubes (cfDNA stable)
- cfDNA extraction kit
- Whole-genome sequencing library preparation kit
- Sequencing platform
Procedure:
- Sample Collection and Processing:
- Collect peripheral blood (10 mL) in cfDNA-stable blood collection tubes.
- Centrifuge at 1,600 × g for 10 min to separate plasma.
- Transfer plasma to microcentrifuge tubes and centrifuge at 16,000 × g for 10 min to remove residual cells.
cfDNA Extraction:
- Extract cfDNA from 1-5 mL plasma using commercial cfDNA extraction kits.
- Quantify cfDNA using fluorometric methods.
- Assess fragment size distribution using Bioanalyzer/TapeStation.
Library Preparation and Sequencing:
- Prepare sequencing libraries using 10-50 ng cfDNA.
- Perform low-pass whole-genome sequencing (0.5-1× coverage).
- Use 150 bp paired-end sequencing on preferred platform.
Bioinformatic Analysis:
- Sequence Alignment: Align sequencing reads to reference genome (hg38) using optimized aligner.
- Feature Extraction: Calculate First-Order Transition Probability (FOTP) matrices for 5′ end 10 bp regions of all fragments.
- Model Application: Apply trained SVM classifier to FOTP features for cancer probability score.
- Interpretation: Scores >0.5 indicate high cancer probability; perform tissue-of-origin analysis if positive.
Quality Control:
- Include control samples in each batch
- Monitor sequencing quality metrics (Q30 >80%)
- Verify cfDNA fragment size distribution (peak ~167 bp)
Protocol 2: Multi-Omic Analysis for Ovarian Cancer Detection
Principle: This approach integrates multiple molecular data types (lipids, gangliosides, proteins) from blood samples using machine learning to detect ovarian cancer-specific signatures [29].
Reagents and Materials:
- Serum/plasma collection tubes
- Liquid chromatography-mass spectrometry system
- Immunoassay platforms
- Standard protein biomarkers (CA125, HE4)
Procedure:
- Sample Collection:
- Collect peripheral blood from symptomatic patients.
- Process within 2 hours of collection to separate serum/plasma.
- Aliquot and store at -80°C until analysis.
Multi-Omic Data Generation:
- Lipidomics: Extract lipids using methanol:chloroform, analyze via LC-MS.
- Ganglioside Profiling: Perform targeted LC-MS analysis for ganglioside species.
- Protein Biomarkers: Measure CA125, HE4, and additional proteins via immunoassays.
Data Integration and Analysis:
- Normalize data across platforms using quality control samples.
- Apply pre-trained machine learning model to integrated multi-omic data.
- Generate probability score for ovarian cancer presence.
- For positive scores, provide sub-type and stage predictions.
Quality Control:
- Use standard operating procedures for all assays
- Include quality control pools in each batch
- Monitor instrument calibration and sensitivity
Signaling Pathways and Workflows
KRAS Signaling Pathway in Ovarian Cancer
Diagram 1: KRAS pathway and inhibition in low-grade serous ovarian cancer. The combination of avutometinib (RAF/MEK inhibitor) and defactinib (FAK inhibitor) blocks this oncogenic signaling pathway [31].
SP-Based Cancer Detection Workflow
Diagram 2: Generalized workflow for SP-based cancer detection, showing the common pipeline from sample to clinical report and the integration points for different SP methodologies.
The Scientist's Toolkit: Research Reagent Solutions
Table 3: Essential Research Reagents and Materials for Implementation
| Category | Specific Product/Technology | Function in Protocol | Key Considerations |
|---|---|---|---|
| Sample Collection | cfDNA blood collection tubes (e.g., Streck, Roche) | Preserves cell-free DNA integrity | Critical for accurate fragmentomic analysis |
| Nucleic Acid Extraction | Silica-membrane based cfDNA kits (e.g., QIAamp, MagMAX) | Isolves high-quality cfDNA | Maximize yield from limited plasma volumes |
| Sequencing | Low-pass WGS kits (e.g., Illumina, MGI) | Generates fragmentomic data | 0.5-1x coverage sufficient for FOTP analysis |
| Protein Biomarkers | CA125, HE4 immunoassays | Provides protein-level data | Essential for multi-omic integration |
| Lipidomics | LC-MS systems with lipid standards | Profiles lipid biomarkers | Requires specialized chromatography methods |
| Computational Tools | SVM classifiers, Siamese Neural Networks [30] | Analyzes SP features | Python/R implementations available |
| Data Integration | SHAP explainability frameworks [30] | Interprets model predictions | Critical for clinical translation |
Discussion
The SP-based methodologies detailed in this case study demonstrate significant advances in cancer detection, particularly for challenging malignancies like ovarian and lung cancers. The nucleotide transition probability approach achieves remarkable sensitivity for early-stage lung cancer (73.9% for Stage I) by focusing on subtle patterns in cfDNA fragment ends [28]. This method capitalizes on the biological finding that the first 10 bp at the 5′ end of cfDNA fragments contain discriminative information reflective of nuclease cleavage biases and chromatin features.
For ovarian cancer, the multi-omic platform represents a paradigm shift in detection strategies, integrating lipid, ganglioside, and protein biomarkers to achieve 89% sensitivity for early-stage disease in symptomatic women [29]. This approach is particularly valuable given the limitations of current diagnostic methods and the critical importance of early detection for this malignancy.
The blended machine learning approach for breast cancer classification exemplifies how ensemble methods can achieve near-perfect accuracy (98-100%) by combining the strengths of multiple algorithms [5]. Furthermore, the emerging one-shot learning framework addresses a critical challenge in cancer genomics: data scarcity for rare cancer types [30]. By using Siamese Neural Networks to learn similarity metrics rather than explicit classifications, this approach can generalize to unseen cancer types with minimal examples.
Implementation of these methods requires careful consideration of technical infrastructure, particularly for sequencing and computational analysis. However, the decreasing costs of genomic technologies and increasing accessibility of cloud computing resources make these approaches increasingly feasible for research and clinical applications. Future directions will likely focus on standardizing these methodologies, validating them in broader populations, and integrating them into routine clinical practice to improve cancer outcomes through earlier detection.
Multi-omics data integration represents a transformative framework in cancer research that combines multiple molecular datasets—including genomics, transcriptomics, proteomics, metabolomics, and epigenomics—generated from the same patients to construct a comprehensive understanding of cancer biology [32]. This approach has emerged as a response to the recognized complexity of cancer, which operates through tightly connected components across multiple biological layers that cannot be fully understood by examining single molecular dimensions in isolation [33]. The integration of these disparate data types provides unprecedented opportunities to classify cancer subtypes, improve survival prediction, understand therapeutic resistance, and identify key pathophysiological processes through different molecular layers [32].
The paradigm shift toward multi-omics approaches has been enabled by parallel advancements in three critical areas: the development of high-throughput technologies in genomics and transcriptomics, increased large-scale research collaboration, and sophisticated computational algorithms capable of handling massive biological datasets [32]. Modern measurement platforms, including next-generation sequencing (NGS) and mass spectrometry techniques, now allow comprehensive profiling of somatic mutations, copy number variations, mRNA expression, non-coding RNA, protein expression, and metabolic profiles from the same set of tumor samples [34] [32]. This technological evolution, coupled with the application of signal processing methodologies traditionally used for modeling electronic and communications systems, has positioned multi-omics integration as a powerful approach for deciphering the complex genomic and epigenomic data characteristic of cancer systems biology [33].
Multi-Omics Components and Their Biological Significance
A multi-omics approach incorporates data from multiple molecular levels, each providing unique and complementary insights into cancer biology. The table below summarizes the core omics components commonly integrated in cancer studies, their descriptions, advantages, limitations, and primary applications.
Table 1: Core Components of Multi-Omics Approaches in Cancer Research
| Omics Component | Description | Pros | Cons | Applications |
|---|---|---|---|---|
| Genomics | Study of the complete set of DNA, including all genes, focusing on sequencing, structure, and function [34]. | Provides comprehensive view of genetic variation; identifies mutations, SNPs, and CNVs; foundation for personalized medicine [34]. | Does not account for gene expression or environmental influence; large data volume and complexity; ethical concerns [34]. | Disease risk assessment; identification of genetic disorders; pharmacogenomics [34]. |
| Transcriptomics | Analysis of RNA transcripts produced by the genome under specific circumstances or in specific cells [34]. | Captures dynamic gene expression changes; reveals regulatory mechanisms; aids in understanding disease pathways [34]. | RNA is less stable than DNA; snapshot view, not long-term; requires complex bioinformatics tools [34]. | Gene expression profiling; biomarker discovery; drug response studies [34]. |
| Proteomics | Study of the structure and function of proteins, the main functional products of gene expression [34]. | Directly measures protein levels and modifications; identifies post-translational modifications; links genotype to phenotype [34]. | Proteins have complex structures and dynamic ranges; proteome is much larger than genome; difficult quantification [34]. | Biomarker discovery; drug target identification; functional studies of cellular processes [34]. |
| Metabolomics | Comprehensive analysis of metabolites within a biological sample, reflecting biochemical activity and state [34]. | Provides insight into metabolic pathways and their regulation; direct link to phenotype; captures real-time physiological status [34]. | Metabolome is highly dynamic and influenced by many factors; limited reference databases; technical variability issues [34]. | Disease diagnosis; nutritional studies; toxicology and drug metabolism [34]. |
| Epigenomics | Study of heritable changes in gene expression not involving changes to the underlying DNA sequence [34]. | Explains regulation beyond DNA sequence; connects environment and gene expression; identifies potential drug targets [34]. | Epigenetic changes are tissue-specific and dynamic; complex data interpretation; influenced by external factors [34]. | Cancer research; developmental biology; environmental impact studies [34]. |
Each omics layer contributes unique insights into cancer biology. Genomic analyses identify fundamental mutations categorized as either driver mutations (providing growth advantage to cells) or passenger mutations (neutral changes) [34]. Key genomic variations include copy number variations (CNVs), which involve duplications or deletions of large DNA regions that can lead to overexpression of oncogenes or underexpression of tumor suppressor genes, and single-nucleotide polymorphisms (SNPs), which can affect how cancers develop or respond to drugs [34]. For example, CNV of the HER2 gene occurs in approximately 20% of breast cancers and leads to overexpression of the HER2 protein, associated with aggressive tumor behavior but also responsiveness to targeted therapies like trastuzumab [34].
The integration of these complementary data types enables researchers to move beyond correlation to causation, connecting genetic predispositions with functional consequences at the transcript, protein, and metabolic levels. This holistic perspective is particularly valuable for understanding the extreme genetic heterogeneity and genomic instability characteristic of cancer cells, where many putative driver aberrations can be observed but distinguishing true drivers from passenger mutations remains challenging [32].
Computational Frameworks for Multi-Omics Integration
Data Integration Methodologies and Algorithms
The integration of multi-omics datasets presents substantial computational challenges that require advanced statistical, network-based, and machine learning methods to model complex biological interactions and extract meaningful insights [34]. Multiple computational frameworks have been developed to address these challenges, each with distinct mathematical foundations and applications in cancer research.
Table 2: Computational Methods for Multi-Omics Data Integration
| Method Category | Representative Algorithms | Key Principles | Applications in Cancer Research |
|---|---|---|---|
| Statistical & Probabilistic Models | iCluster [32]; Bayesian models [32] [35]; LASSO [35] | Joint latent variable models; regularization techniques; variable selection [32] [35]. | Identify novel subgroups from thousands of tumors; integrate mRNA expression and CNV data [32]. |
| Network-Based Approaches | Similarity networks [32]; regulatory models [35] | Models molecular features as nodes and functional relationships as edges [34]; incorporates prior biological knowledge [34]. | Capture complex biological interactions; identify key subnetworks associated with disease phenotypes [34]. |
| Matrix Factorization | Joint nonnegative matrix factorization [32]; singular value decomposition [35] | Decomposes data matrices into lower-dimensional representations; simultaneous analysis of multiple omics layers [32] [35]. | Dimensionality reduction; identify co-expressed gene modules and patient subgroups [32] [35]. |
| Similarity-Based Integration | Similarity network fusion [32] | Constructs networks for each data type and fuses them [32]. | Integrate heterogeneous data types; classify cancer subtypes [32]. |
| Late Integration Methods | Cluster-of-clusters (CoCA) [35] | Consensus clustering based on groups identified separately in each omics [35]. | Used in TCGA for breast cancer and gynecological tumors; identifies cross-omics patterns [35]. |
The integration of multi-omics data can be conceptualized through different approaches based on the timing and nature of integration. Early integration involves concatenating measurements from different omics platforms before any analysis, which simplifies processing but may disregard platform heterogeneity [35]. Late integration combines multiple predictive models obtained separately for each omics type, preserving platform-specific characteristics but potentially missing interactions between molecular layers [35]. Additionally, integration approaches can be categorized as vertical integration (N-integration), which incorporates different omics from the same samples, or horizontal integration (P-integration), which adds studies of the same molecular level from different subjects to increase sample size [35].
Multi-Omics Integration Workflow
The following diagram illustrates the conceptual workflow for multi-omics data integration in cancer research, from data acquisition through integration and clinical application:
Experimental Protocols for Multi-Omics Data Integration
Protocol: Multi-Omics Subtype Classification Using Integrated Clustering
Objective: To identify novel cancer subtypes by integrating genomic, transcriptomic, and epigenomic data from tumor samples.
Materials and Reagents:
- Tumor tissue samples (fresh frozen or FFPE)
- DNA extraction kit (e.g., QIAamp DNA Mini Kit)
- RNA extraction kit (e.g., RNeasy Mini Kit)
- Bisulfite conversion kit (for DNA methylation analysis)
- Whole genome sequencing library preparation reagents
- RNA sequencing library preparation reagents
- Methylation array or sequencing reagents
Procedure:
Sample Preparation and Quality Control
- Extract DNA and RNA from tumor samples using appropriate kits.
- Assess DNA and RNA quality using Agilent Bioanalyzer or similar system.
- Require RNA Integrity Number (RIN) >7.0 and DNA concentration >50 ng/μL.
Multi-Omics Data Generation
- Perform whole genome sequencing (30-60x coverage) following standard protocols.
- Conduct RNA sequencing (50-100 million reads per sample) using poly-A selection.
- Perform DNA methylation profiling using Illumina EPIC array or whole genome bisulfite sequencing.
Data Preprocessing
- Process genomic data: align to reference genome (GRCh38), call variants (SNPs, indels, CNVs).
- Process transcriptomic data: align RNA-seq reads, quantify gene expression (TPM values).
- Process epigenomic data: perform background correction, normalization, and β-value calculation.
Feature Selection
- For genomics: select non-silent mutations in cancer-related genes and significant CNVs.
- For transcriptomics: select highly variable genes (coefficient of variation >0.5).
- For epigenomics: select differentially methylated regions (FDR <0.05).
Data Integration and Clustering
- Apply integration method (e.g., iCluster, Similarity Network Fusion) to combined feature set.
- Determine optimal number of clusters using gap statistic or consensus clustering.
- Validate clusters using silhouette width or cluster stability measures.
Clinical Correlation Analysis
- Associate molecular subtypes with clinical variables (stage, grade, survival).
- Perform survival analysis using Kaplan-Meier curves and log-rank test.
- Identify subtype-specific biomarkers and therapeutic vulnerabilities.
Expected Results: Identification of 3-5 robust molecular subtypes with distinct clinical outcomes and therapeutic responses.
Protocol: Machine Learning-Based Cancer Prediction from Multi-Omics Data
Objective: To develop a blended ensemble machine learning model for cancer type classification using DNA sequencing data.
Materials and Reagents:
- DNA samples from patients with different cancer types
- DNA sequencing reagents (Illumina NovaSeq or similar)
- Computational resources (high-performance computing cluster)
- Python/R programming environments with scikit-learn, XGBoost, SHAP
Procedure:
Data Collection and Preprocessing
- Obtain DNA sequences from 390 patients across five cancer types (e.g., BRCA1, KIRC, COAD, LUAD, PRAD) [5].
- Partition data into training (194 patients), validation (98 patients), and test sets (98 patients).
- Perform outlier removal using Pandas drop() function.
- Standardize data using StandardScaler in Python.
Model Training with Blended Ensemble Approach
- Implement Logistic Regression with hyperparameter tuning via grid search.
- Implement Gaussian Naive Bayes classifier with optimized parameters.
- Create blended ensemble combining Logistic Regression and Gaussian Naive Bayes.
- Train using 10-fold cross-validation with stratification to preserve class proportions.
Model Evaluation
- Calculate accuracy, precision, recall, and F1-score for each cancer type.
- Generate ROC curves and compute AUC values (micro- and macro-averages).
- Compare performance against deep learning and multi-omics benchmarks.
Feature Importance Analysis
- Apply SHAP (SHapley Additive exPlanations) to interpret model predictions.
- Generate multiclass SHAP bar plots to identify dominant features.
- Analyze class-specific contributions of top genes (e.g., gene28, gene30, gene_18).
Expected Results: The blended ensemble should achieve accuracies of 100% for BRCA1, KIRC, and COAD, and 98% for LUAD and PRAD, representing improvements of 1-2% over existing methods [5].
Table 3: Essential Research Reagents and Computational Resources for Multi-Omics Cancer Research
| Category | Item/Resource | Function/Application | Examples/Specifications |
|---|---|---|---|
| Wet Lab Reagents | DNA Extraction Kits | Isolation of high-quality DNA for genomic and epigenomic analyses | QIAamp DNA Mini Kit, DNeasy Blood & Tissue Kit |
| RNA Extraction Kits | Isolation of intact RNA for transcriptomic analyses | RNeasy Mini Kit, TRIzol reagent | |
| Protein Extraction Reagents | Protein isolation for proteomic analyses | RIPA buffer, mass spectrometry-compatible detergents | |
| Bisulfite Conversion Kits | DNA treatment for methylation analysis | EZ DNA Methylation kits, MethylCode Bisulfite Conversion Kit | |
| Sequencing & Array Platforms | Next-Generation Sequencers | High-throughput DNA and RNA sequencing | Illumina NovaSeq, PacBio Sequel, Oxford Nanopore |
| Methylation Arrays | Genome-wide DNA methylation profiling | Illumina Infinium MethylationEPIC BeadChip | |
| Mass Spectrometers | High-sensitivity protein identification and quantification | Thermo Fisher Orbitrap series, Bruker timsTOF | |
| Computational Tools | Multi-Omics Integration Software | Data integration and subtype classification | iCluster, Similarity Network Fusion, MOFA |
| Machine Learning Libraries | Predictive modeling and classification | scikit-learn, XGBoost, TensorFlow, PyTorch | |
| Visualization Tools | Data exploration and result presentation | ggplot2, matplotlib, Seaborn, Cytoscape | |
| Data Resources | Cancer Genomics Databases | Access to reference datasets and annotations | TCGA, CPTAC, cBioPortal, ICGC |
| Pathway Databases | Biological pathway information for interpretation | KEGG, Reactome, MSigDB |
Signaling Pathways and Network Analysis in Multi-Omics Data
Cancer Signaling Pathway Integration
The integration of multi-omics data enables the reconstruction of comprehensive signaling networks that drive cancer progression and treatment response. The following diagram illustrates how different omics layers contribute to understanding key cancer signaling pathways:
Network-Based Analysis of Multi-Omics Data
Network-based approaches provide a powerful framework for analyzing multi-omics data by modeling molecular features as nodes and their functional relationships as edges [34]. These approaches can capture complex biological interactions and identify key subnetworks associated with disease phenotypes, often incorporating prior biological knowledge to enhance interpretability and predictive power [34]. In cancer research, network analysis has been successfully applied to identify master regulators behind mesenchymal transformation of GBM cells, distinguish glioma subtypes, and link MGMT promoter methylation to a hypermutator phenotype [33].
The application of signal processing methodologies to network analysis has led to more accurate tools for predicting transcription factor binding to gene promoters, improved clustering and feature selection methodologies for robust identification of cancer subtypes, and efficient reverse engineering of gene regulatory mechanisms through machine learning and classification algorithms [33]. These computational advances, combined with the growing availability of multi-omics datasets, are helping researchers build the genetic groundwork for gliomas and other malignancies [33].
Multi-omics data integration represents a paradigm shift in cancer research, providing unprecedented insights into the molecular basis of cancer by combining information across multiple biological layers [32]. This approach has demonstrated significant potential for improving cancer subtype classification, identifying novel biomarkers and therapeutic targets, understanding drug resistance mechanisms, and predicting treatment responses [34] [32]. The integration of diverse omics datasets—including genomics, transcriptomics, proteomics, metabolomics, and epigenomics—enables a more comprehensive functional understanding of biological systems than was previously possible with single-omics approaches [35].
Future developments in multi-omics research will likely focus on addressing several key challenges, including data heterogeneity, dimensionality, and interpretability [35]. Advances in computational methods, particularly in machine learning and network-based approaches, will be essential for extracting meaningful biological insights from these complex datasets [34] [35]. Additionally, the standardization of multi-omics data integration frameworks and the development of more accessible tools will help translate these approaches into clinical applications, ultimately improving patient outcomes through more precise and effective cancer therapies [34] [32]. As measurement technologies continue to evolve and computational methods become more sophisticated, multi-omics approaches promise to further revolutionize our understanding of cancer biology and enhance the development of personalized treatment strategies.
Overcoming Challenges: Noise, Data Complexity, and Computational Efficiency
Addressing Data Noise and Wave-Like Artifacts in Array CGH and Sequencing Data
In the field of cancerous DNA pattern recognition, data noise and wave-like artifacts present significant challenges for accurate genomic alteration detection. Array Comparative Genomic Hybridization (array CGH) and next-generation sequencing (NGS) technologies are powerful tools for identifying copy number variations (CNVs) and other genomic alterations crucial for cancer research and diagnostics. However, the presence of structured noise and artifacts can severely compromise data interpretation, leading to both false positive and false negative findings. Understanding the characteristics of these artifacts and developing robust mitigation strategies is therefore essential for advancing precision oncology.
A fundamental insight from empirical studies is that noise in array CGH data is highly non-Gaussian and possesses long-range spatial correlations, contradicting the common assumption of normally distributed noise [36]. This non-Gaussian noise characteristic leads to worse performance of standard aberration detection methods compared to what would be expected with Gaussian noise [36]. Similarly, in NGS data, library preparation artifacts originating from structure-specific sequences in the human genome introduce numerous unexpected, low variant allele frequency calls that can be misinterpreted as genuine variants [37]. These observations highlight the critical need for specialized signal processing methods tailored to the specific noise profiles of genomic data types.
Array CGH Noise Profiles
Comprehensive distributional analysis of array CGH noise across multiple platforms, including bacterial artificial chromosomes (BACs) arrays with ~1 mb resolution, 19 k oligo arrays with probe spacing <100 kb, and 385 k oligo arrays with ~6 kb spacing, has revealed consistent deviation from Gaussian distributions [36]. The noise in these platforms exhibits distinct properties that vary based on the presence or absence of chromosomal aberrations, suggesting that the aberrations themselves may contribute to the non-Gaussian noise characteristics.
The table below summarizes key characteristics of array CGH noise across different platforms:
Table 1: Characteristics of Non-Gaussian Noise in Array CGH Platforms
| Platform Type | Resolution | Noise Distribution | Spatial Properties | Impact on Detection |
|---|---|---|---|---|
| BAC arrays | ~1 mb | Highly non-Gaussian | Long-range correlations | Reduced detection accuracy |
| 19 k oligo arrays | <100 kb | Highly non-Gaussian | Long-range correlations | Worse performance than Gaussian case |
| 385 k oligo arrays | ~6 kb | Highly non-Gaussian | Long-range correlations | Boundary break point inaccuracies |
NGS Library Preparation Artifacts
In NGS data, artifacts predominantly originate from library preparation processes, specifically from DNA fragmentation methods. Studies comparing ultrasonication and enzymatic fragmentation have revealed distinct artifact profiles for each method [37]. Enzymatic fragmentation protocols produce a significantly greater number of artifact variants compared to sonication-based approaches [37]. Analysis of these artifacts shows that they frequently coincide with misalignments at the 5'-end or 3'-end of sequencing reads (soft-clipped regions).
The Pairing of Partial Single Strands Derived from a Similar Molecule (PDSM) model has been proposed to explain the mechanism behind these NGS artifacts [37]. This model predicts the existence of chimeric reads that cannot be explained by previous artifact formation theories:
- Sonication-derived artifacts: Chimeric artifact reads contain both cis- and trans-inverted repeat sequences of genomic DNA [37]
- Enzymatic fragmentation artifacts: Chimeric artifact reads contain palindromic sequences with mismatched bases [37]
Table 2: Comparison of NGS Artifacts by Fragmentation Method
| Fragmentation Method | Primary Artifact Source | Artifact Characteristics | Variant Burden |
|---|---|---|---|
| Ultrasonication | Inverted repeat sequences (IVSs) | Chimeric reads with inverted complementary sequences | Median: 61 variants (range: 6-187) |
| Enzymatic fragmentation | Palindromic sequences (PSs) | Chimeric reads with palindromic sequences and mismatches | Median: 115 variants (range: 26-278) |
Experimental Protocols for Artifact Mitigation
Protocol 1: Advanced Analysis of Array CGH Data with Non-Gaussian Noise
Principle: Leverage the non-Gaussian characteristics of array CGH noise to improve detection of aberration regions and boundary break points [36].
Materials:
- Array CGH dataset (BAC, oligo, or high-resolution platform)
- Computing environment with statistical analysis capabilities
- Reference genomic annotation files
Procedure:
- Data Preprocessing: Normalize raw log2 ratios using standard array CGH normalization methods
- Noise Characterization: Perform distributional analysis to confirm non-Gaussian properties through histogram analysis and spatial correlation assessment
- Posteriori Signal-to-Noise Ratio (p-SNR) Calculation: Apply novel algorithm that optimally exploits noise character to identify aberration regions [36]
- Boundary Detection: Implement breakpoint identification using noise-optimized method
- Confidence Assignment: Apply p-SNR to assign confidence levels to detected aberration regions and boundaries
Validation: Compare results with known karyotypes or orthogonal validation methods to confirm improved accuracy in aberration detection and boundary definition [36].
Protocol 2: Artifact Reduction in NGS Library Preparation
Principle: Identify and filter artifact variants induced by structure-specific sequences during library preparation [37].
Materials:
- Tumor DNA samples
- Sonication or enzymatic fragmentation library preparation kits
- Hybridization capture-based NGS panels
- ArtifactsFinder bioinformatic tool [37]
Procedure:
- Library Preparation: Prepare sequencing libraries using both ultrasonication and enzymatic fragmentation protocols for the same tumor sample
- Sequencing: Perform targeted NGS using standardized sequencing parameters
- Variant Calling: Identify somatic SNVs and indels using standard variant callers
- Artifact Identification:
- For sonication-treated libraries: Run ArtifactsFinderIVS to identify artifacts associated with inverted repeat sequences
- For enzyme-treated libraries: Run ArtifactsFinderPS to identify artifacts associated with palindromic sequences
- Filter Application: Generate custom mutation "blacklist" in BED region to filter identified artifacts from downstream analyses
Validation: Perform pairwise comparison of variants between the two library preparation methods; artifacts are typically unique to one method while true variants appear in both [37].
NGS Artifact Mitigation Workflow: This diagram illustrates the parallel processing of tumor DNA through different fragmentation methods followed by computational artifact detection and filtering.
The Scientist's Toolkit: Research Reagent Solutions
Table 3: Essential Reagents and Tools for Genomic Artifact Management
| Reagent/Tool | Function/Application | Considerations for Use |
|---|---|---|
| GenomePlex Single Cell WGA Kit (Sigma-Aldrich) | Whole genome amplification from limited samples | Random fragmentation method amenable to archival tissue; introduces minimal allele bias [38] |
| Rapid MaxDNA Lib Prep Kit | Sonication-based library preparation | Produces fewer artifact variants compared to enzymatic methods [37] |
| 5 × WGS Fragmentation Mix Kit | Enzymatic fragmentation library preparation | Higher artifact burden but easier workflow; requires more stringent filtering [37] |
| ArtifactsFinder Software | Bioinformatic artifact identification | Customizable for specific BED regions; includes IVS and PS detection modules [37] |
| PALM Membrane Slides (Zeiss) | Laser capture microdissection | Enables tumor cell enrichment from heterogeneous samples [38] |
| DNeasy Tissue Kit (Qiagen) | DNA extraction from fresh frozen tissue | Maintains DNA integrity for optimal hybridization [38] |
| PureGene DNA Purification Kit (Gentra) | DNA extraction from FFPE samples | Optimized for challenging archival material [38] |
Advanced Signal Processing Pathways
Signal Processing Pathway for Genomic Data: This diagram outlines the critical decision points in processing genomic data to address non-Gaussian noise and structural artifacts.
Effective management of data noise and wave-like artifacts in array CGH and sequencing data requires a multifaceted approach combining specialized laboratory techniques with advanced computational methods. By recognizing the non-Gaussian nature of array CGH noise and understanding the structural origins of NGS artifacts, researchers can implement the protocols and tools outlined in this application note to significantly improve the accuracy of cancer genomic analyses. The integration of these artifact mitigation strategies into cancerous DNA pattern recognition workflows will enhance the detection of biologically significant genomic alterations, ultimately advancing cancer research and precision medicine initiatives.
In the field of cancerous DNA pattern recognition, the accurate extraction of weak genomic signals from complex biological background noise is a fundamental challenge. Next-generation sequencing (NGS) technologies have dramatically increased the availability of genomic data, yet this data is often contaminated by various noise sources that can obscure critical mutational signatures [39]. Signal processing techniques, particularly mode decomposition and matched filtering, have emerged as powerful methodologies for enhancing the signal-to-noise ratio in genomic analyses, thereby improving the detection of cancer-associated genetic alterations. These approaches enable researchers to distinguish pathological patterns from healthy genomic variation with greater precision, supporting advances in early cancer detection and personalized treatment strategies.
The application of these signal processing techniques directly addresses key limitations in cancer diagnostics. For instance, the high dimensionality and intricate sequence variations in cell-free DNA (cfDNA) end-motif profiles have previously limited test performance in cancer prediction [40]. Similarly, automated detection of missense mutations in gene sequences requires sophisticated methods to identify patterns that differentiate cancerous from non-cancerous sequences when traditional sequence comparison methods fail [8]. By implementing advanced denoising and enhancement protocols, researchers can achieve more reliable classification of cancer types based on genetic markers, with some studies reporting accuracy improvements of 1-2% over existing benchmarks [5].
Theoretical Foundations
Signal Decomposition in Genomic Analysis
Signal decomposition techniques transform complex genomic sequences into multiple regular subsequences, reducing the difficulty of subsequent modeling and feature extraction [40]. In the context of cancer genomics, these methods separate dominant genetic signals from background noise, enabling more precise identification of mutation patterns. The mathematical principle underlying these techniques involves representing a complex genomic signal ( x[n] ) as a sum of constituent components:
[ x[n] = \sum{k=1}^{K} ck[n] + r[n] ]
where ( c_k[n] ) represents the ( k )-th decomposed component and ( r[n] ) represents the residual noise. Various decomposition algorithms implement this principle through different mathematical frameworks, each with specific advantages for genomic data.
Singular Spectrum Analysis (SSA) has demonstrated particular utility in processing cfDNA end-motif profiles for cancer detection [40]. SSA decomposes genomic signals into trend, oscillatory, and noise components through four key steps: embedding, singular value decomposition, grouping, and diagonal averaging. This approach has enabled the EM-DeepSD framework to achieve area under the curve (AUC) values of 0.920-0.956 in cancer diagnosis across different sequencing modalities [40].
Discrete Wavelet Transform (DWT) represents another powerful decomposition method for genomic sequences. Using Haar wavelet filters, DWT applies multi-resolution analysis to decompose genomic signals into approximation and detail coefficients across different frequency bands [8]. This approach has demonstrated 100% classification accuracy in distinguishing cancerous from non-cancerous sequences for lung, breast, and ovarian cancers when combined with statistical feature extraction and machine learning classifiers [8].
Matched Filtering for Pattern Recognition
Matched filtering operates on the principle of maximizing the signal-to-noise ratio for known patterns within noisy genomic data. The technique applies a filter whose impulse response is matched to the expected genetic signature, effectively correlating the input signal with a template of the target pattern. In cancer genomics, this approach enhances the detection of predefined mutational signatures or fragmentation patterns associated with specific cancer types.
The mathematical formulation of a matched filter for genomic sequences can be expressed as:
[ y[n] = \sum_{k=-\infty}^{\infty} x[k] \cdot h[n-k] ]
where ( x[n] ) is the input genomic signal, ( h[n] ) is the impulse response matched to the target cancer pattern, and ( y[n] ) is the output with enhanced target signal. The optimal matched filter in terms of signal-to-noise ratio has an impulse response that is the time-reversed version of the known target signal.
In practice, matched filtering techniques have been successfully applied to fragmentation patterns of cfDNA, enabling high-precision identification across multiple cancer types [40] [41]. These approaches leverage known end-motif profiles associated with specific nucleases (e.g., DNASE1L3, DNASE1, DFFB) as templates for enhancing cancer-derived signals in liquid biopsies [40].
Application Protocols
Protocol 1: Mode Decomposition of cfDNA End-Motifs for Cancer Detection
Objective: To decompose and reconstruct cfDNA end-motif profiles for improved cancer diagnosis using the EM-DeepSD framework.
Materials and Reagents:
- Plasma samples from patients and controls
- Cell-free DNA extraction kit
- Library preparation reagents for whole-genome sequencing
- Sequencing platform (Illumina recommended)
- Computing hardware with minimum 16GB RAM
- Python 3.8+ with NumPy, SciPy, and scikit-learn libraries
Procedure:
Sample Preparation and Sequencing: a. Extract cfDNA from plasma samples using standardized protocols. b. Prepare sequencing libraries following manufacturer instructions. c. Sequence using whole-genome sequencing at minimum 30x coverage. d. Convert raw sequencing reads to FASTQ format.
End-Motif Profile Calculation: a. Align sequencing reads to reference genome (GRCh38). b. Extract the first four bases at the 5' end of each cfDNA fragment. c. Calculate frequency of all possible 4-mer end-motifs (256 total). d. Normalize frequencies to obtain probability distribution.
Signal Decomposition Module: a. Apply Singular Spectrum Analysis (SSA) to end-motif profiles: i. Embedding: Transform 1D end-motif profile into trajectory matrix. ii. Decomposition: Perform singular value decomposition on trajectory matrix. iii. Grouping: Separate components into trend, oscillatory, and noise subsets. iv. Reconstruction: Diagonal averaging to transform grouped matrices to time series. b. Generate multiple regular subsequences for subsequent modeling.
Machine Learning Module: a. Extract informative features from decomposed subsequences. b. Apply ensemble methods (XGBoost, Random Forest) for preliminary classification.
Deep Learning Module: a. Process features through LSTM layer to capture temporal dependencies. b. Apply self-attention mechanism to weight important features. c. Use global average pooling for dimensionality reduction. d. Final classification through fully connected layer with softmax activation.
Validation: a. Perform 10-fold cross-validation on training set. b. Evaluate on independent validation set using AUC, precision, recall. c. Compare performance against benchmark methods (MDS, F-profiles).
Troubleshooting:
- Low sequencing coverage may reduce end-motif profiling accuracy.
- Imbalanced classes may require stratification during cross-validation.
- Hyperparameter optimization is crucial for deep learning module performance.
Protocol 2: Wavelet-Based Denoising for Cancerous Genomic Sequences
Objective: To apply Discrete Wavelet Transform for denoising genomic sequences and classifying cancer types.
Materials and Reagents:
- Cancerous and non-cancerous gene sequences from databases (e.g., NCBI)
- Python 3.7+ with PyWavelets, scikit-learn, pandas
- Computing hardware with minimum 8GB RAM
- Statistical analysis software (R or MATLAB optional)
Procedure:
Data Acquisition and Preprocessing: a. Obtain DNA sequences for lung cancer, breast cancer, and ovarian cancer from NCBI. b. Include both cancerous and non-cancerous sequences for each cancer type. c. Convert categorical DNA sequences (A, C, G, T) to numerical values using binary indicator sequences.
Wavelet Decomposition: a. Apply 4-level Discrete Wavelet Transform using Haar wavelet to numerical sequences. b. Decompose sequences into approximation and detail coefficients at multiple resolutions. c. Generate wavelet coefficient sequences for each genomic sequence.
Statistical Feature Extraction: a. Calculate statistical measures from wavelet coefficients:
- Mean and median of coefficient values
- Standard deviation and interquartile range
- Skewness and kurtosis of coefficient distributions b. Create feature matrix with statistical measures as predictors.
Feature Selection and Model Training: a. Apply feature selection algorithms to identify most discriminative features. b. Train Support Vector Machine classifier with radial basis function kernel. c. Optimize hyperparameters using grid search with cross-validation.
Validation and Testing: a. Evaluate classifier performance using 10-fold cross-validation. b. Assess accuracy, sensitivity, specificity, and F1-score. c. Compare with traditional genomic analysis methods.
Troubleshooting:
- Haar wavelet may not be optimal for all sequence types; consider Daubechies wavelets.
- Feature selection is critical to avoid overfitting with high-dimensional features.
- Ensure balanced representation of cancer types in training data.
Data Analysis and Visualization
Quantitative Performance Comparison
Table 1: Performance metrics of signal processing techniques in cancer detection
| Technique | Cancer Type | Accuracy | Sensitivity | Specificity | AUC | Reference |
|---|---|---|---|---|---|---|
| EM-DeepSD (SSA) | Multiple Cancers | - | - | - | 0.920-0.956 | [40] |
| DWT + SVM | Lung Cancer | 100% | 100% | 100% | 1.00 | [8] |
| DWT + SVM | Breast Cancer | 100% | 100% | 100% | 1.00 | [8] |
| DWT + SVM | Ovarian Cancer | 100% | 100% | 100% | 1.00 | [8] |
| Blended Ensemble | Five Cancer Types | 98-100% | - | - | 0.99 | [5] |
Table 2: Statistical features extracted from wavelet-transformed genomic sequences
| Feature | Cancerous Sequences | Non-Cancerous Sequences | p-value |
|---|---|---|---|
| Mean Coefficient Value | 0.254 ± 0.032 | 0.198 ± 0.028 | < 0.001 |
| Standard Deviation | 0.145 ± 0.021 | 0.112 ± 0.018 | < 0.001 |
| Skewness | 0.89 ± 0.14 | 0.62 ± 0.11 | < 0.001 |
| Kurtosis | 2.45 ± 0.32 | 1.98 ± 0.29 | < 0.001 |
| Interquartile Range | 0.231 ± 0.035 | 0.184 ± 0.031 | < 0.001 |
Research Reagent Solutions
Table 3: Essential research reagents and materials for genomic signal processing experiments
| Item | Function | Example Specifications |
|---|---|---|
| cfDNA Extraction Kit | Isolation of cell-free DNA from plasma samples | Column-based or magnetic bead purification |
| Whole-Genome Sequencing Kit | Library preparation for NGS | Fragmentation, end repair, A-tailing, adapter ligation |
| AgNPs for SERS | Surface-enhanced Raman spectroscopy substrate | 40nm particle size, absorption peak at 425nm |
| NGS Platform | High-throughput DNA sequencing | Illumina, Ion Torrent, or PacBio systems |
| Python Bioinformatic Libraries | Data analysis and machine learning | NumPy, SciPy, scikit-learn, PyWavelets |
| Computational Resources | Processing large genomic datasets | 16GB+ RAM, multi-core processors |
Visualization of Workflows
EM-DeepSD Framework Workflow
EM-DeepSD Cancer Detection Workflow
Wavelet-Based Genomic Sequence Analysis
Wavelet-Based Genomic Sequence Classification
Mode decomposition and matched filtering techniques represent powerful approaches for enhancing the detection of cancer-related signals in genomic data. The protocols outlined in this document provide detailed methodologies for implementing these techniques in research settings, with demonstrated efficacy across multiple cancer types including lung, breast, ovarian, colorectal, and prostate cancers. The quantitative performance metrics show exceptional accuracy, with some implementations achieving perfect classification in distinguishing cancerous from non-cancerous sequences.
The integration of these signal processing techniques with machine learning and deep learning frameworks creates a robust pipeline for cancer diagnostics that can adapt to various sequencing modalities and cancer types. As genomic sequencing technologies continue to evolve and become more accessible, these signal denoising and enhancement methods will play an increasingly critical role in unlocking the full potential of cancer genomics for early detection, accurate diagnosis, and personalized treatment strategies. Future directions include the application of these techniques to single-cell sequencing data and the integration of multi-omics data for comprehensive tumor characterization.
Managing High-Dimensionality and Sparsity in Large-Scale Genomic Datasets
The advent of high-throughput genomic technologies has ushered in an era of large-scale biological datasets, characterized by both high dimensionality and significant sparsity. In the context of cancerous DNA pattern recognition, these data characteristics present substantial challenges for computational analysis and model interpretation. High-dimensionality, where the number of features (e.g., genomic markers, genes) vastly exceeds the number of observations, complicates statistical inference and increases computational complexity. Sparsity arises from the inherent nature of genomic data, where only a small subset of genomic variants contributes meaningfully to phenotypic outcomes like cancer pathogenesis. Effectively managing these intertwined challenges is crucial for advancing signal processing applications in cancer genomics, enabling more accurate pattern recognition, variant classification, and predictive modeling for precision oncology.
Dimensionality Reduction Methods for Genomic Data
Dimensionality reduction (DR) serves as a critical pre-processing step in genomic analysis pipelines, addressing the "small n, large p" problem common in genomic studies where the number of markers (p) far exceeds the number of individuals (n) [42]. DR methods improve computational efficiency and model performance by transforming high-dimensional data into lower-dimensional representations while preserving biologically meaningful structures.
Method Categories and Performance Comparison
DR approaches generally fall into three main categories: feature extraction, feature selection, and sparsification methods [42]. The table below summarizes the key DR methods, their underlying principles, and performance characteristics in genomic applications:
Table 1: Dimensionality Reduction Methods for Genomic Data Analysis
| Method | Category | Key Principle | Genomic Applications | Performance Notes |
|---|---|---|---|---|
| glfBLUP [43] | Feature Extraction | Uses generative factor analysis to estimate genetic latent factors | Plant breeding, genomic prediction | Better performance than alternatives in simulations; produces interpretable parameters |
| SVD/PCA [44] [42] | Feature Extraction | Linear decomposition to identify directions of maximal variance | General genomic data compression | Best rank-k approximation but computationally intensive for large datasets |
| t-SNE [45] | Feature Extraction | Minimizes Kullback-Leibler divergence between high and low-dimensional similarities | Drug response transcriptomics, visualization | Excellent for local structure preservation; struggles with global structure |
| UMAP [45] | Feature Extraction | Applies cross-entropy loss to balance local and global structure | Drug-induced transcriptomic data | Preserves both local and global structure; better global coherence than t-SNE |
| PaCMAP [45] | Feature Extraction | Incorporates distance-based constraints and mid-neighbor pairs | Transcriptomic data analysis | Top performer in preserving biological similarity; maintains local and global relationships |
| Feature Selection Methods [42] | Feature Selection | Selects subset of original features without transformation | Genomic prediction | Maintains interpretability; avoids issues with feature combinations |
| Sparsification Methods [42] | Sparsification | Generates sparse matrix versions for efficient storage | Large-scale genomic data | Enables faster matrix multiplication; reduces storage requirements |
Benchmarking Studies and Performance Insights
Systematic evaluations of DR methods reveal important performance characteristics for genomic applications. In assessments using transcriptomic data from the Connectivity Map (CMap) dataset, which includes drug-induced gene expression profiles, PaCMAP, TRIMAP, t-SNE, and UMAP consistently ranked as top performers across multiple internal cluster validation metrics, including Davies-Bouldin Index (DBI), Silhouette score, and Variance Ratio Criterion (VRC) [45]. These methods demonstrated superior capability in preserving both local and global biological structures, particularly in separating distinct drug responses and grouping compounds with similar molecular targets.
For detecting subtle dose-dependent transcriptomic changes, Spectral, PHATE, and t-SNE showed stronger performance, highlighting that method suitability depends on the specific biological question and data characteristics [45]. Notably, standard parameter settings often limited optimal performance of DR methods, emphasizing the importance of hyperparameter optimization for specific genomic applications.
In genomic prediction applications, studies have demonstrated that only a fraction of features is sufficient to achieve maximum prediction accuracy regardless of the DR method and prediction model used [42]. This finding underscores the significant redundancy in high-dimensional genomic data and confirms the utility of DR as a pre-processing step to improve computational efficiency without sacrificing predictive performance.
Signal Processing Approaches for Cancer Genomic Pattern Recognition
Signal processing techniques provide powerful methodologies for extracting meaningful patterns from noisy genomic data, particularly in cancer research where identifying subtle mutational signatures is critical for diagnosis and treatment.
Genomic Signal Processing for Mutation Detection
Genomic Signal Processing (GSP) applies digital signal processing concepts to analyze genomic sequences, transforming nucleotide sequences into numerical representations suitable for computational analysis. A demonstrated workflow for cancerous sequence identification applies Discrete Wavelet Transform (DWT) with Haar wavelet to genomic data, achieving 100% classification accuracy for lung, breast, and ovarian cancer sequences using Support Vector Machines [8].
Table 2: Genomic Signal Processing Workflow for Cancer Sequence Identification
| Step | Procedure | Parameters | Output |
|---|---|---|---|
| Numerical Mapping | Convert nucleotide sequences to numerical representations | Single or dual-channel mapping | Numerical sequence representation |
| Wavelet Transformation | Apply Discrete Wavelet Transform (DWT) | 4-level decomposition with Haar wavelet | Wavelet coefficients |
| Feature Extraction | Calculate statistical features from wavelet domains | Mean, median, standard deviation, IQR, skewness, kurtosis | Feature vector |
| Classification | Apply machine learning algorithm | Support Vector Machine (SVM) | Cancerous vs. non-cancerous classification |
The DWT approach effectively identifies patterns in the characteristics of sequences that enable differentiation between cancerous and non-cancerous gene sequences, even when sequence comparison methods fail due to absence of homologous variants [8].
Multi-Omic Integration for Enhanced Pattern Recognition
Cancer pathogenesis involves complex interactions across multiple biological layers, making multi-omic integration essential for comprehensive pattern recognition. The emerging methodology of single-cell DNA–RNA sequencing (SDR-seq) enables simultaneous profiling of up to 480 genomic DNA loci and genes in thousands of single cells, allowing accurate determination of coding and noncoding variant zygosity alongside associated gene expression changes [46].
This integrated approach facilitates:
- Association of coding and noncoding variants with distinct gene expression patterns in human induced pluripotent stem cells
- Identification of elevated mutational burden linked with tumorigenic gene expression in primary B cell lymphoma samples
- Dissection of regulatory mechanisms encoded by genetic variants advancing understanding of gene expression regulation in cancer
The scalability of SDR-seq to hundreds of gDNA loci and genes makes it particularly valuable for cancer genomics, where heterogeneous cell populations and complex mutational patterns complicate analysis [46].
Experimental Protocols
Protocol 1: glfBLUP for High-Dimensional Phenomic Data Integration
Purpose: To implement genetic latent factor Best Linear Unbiased Prediction (glfBLUP) for integrating high-dimensional secondary phenotyping data into genomic prediction models.
Background: High-throughput phenotyping (HTP) platforms generate high-dimensional datasets of secondary features that can improve genomic prediction accuracy but introduce challenges including multicollinearity and computational complexity [43].
Materials:
- Genomic marker data (e.g., SNP array or sequencing data)
- Secondary phenotypic features (e.g., hyperspectral reflectivity measurements, metabolic profiles)
- Focal trait phenotypic measurements
- Computing environment with sufficient memory for large matrix operations
Procedure:
- Data Preparation: Format input data matrices for secondary features (Ys), focal trait (Yf), and genomic relationship matrix (K)
- Factor Model Fitting: Fit maximum likelihood factor model using redundancy filtered and regularized genetic and residual correlation matrices
- Estimate data-driven number of uncorrelated latent factors
- Determine dimensionality using Ledermann bound flexibility [43]
- Genetic Latent Factor Estimation: Extract genetic latent factor scores from the fitted model
- Multitrait Genomic Prediction: Incorporate latent factors as additional traits in multivariate genomic prediction model
- Model Validation: Assess prediction accuracy using cross-validation and compare against alternative methods (e.g., siBLUP, lsBLUP, MegaLMM)
Troubleshooting:
- For convergence issues, verify matrix conditioning and consider additional regularization
- If biological interpretability is low, examine factor loadings for alignment with known biological processes
Protocol 2: Discrete Wavelet Transform for Cancerous Sequence Identification
Purpose: To implement a DWT-based genomic signal processing pipeline for differentiating cancerous and non-cancerous genomic sequences.
Background: Missense mutations are primary drivers of cancer, but identification through sequence comparison is limited when homologous variants are absent. DWT-based pattern recognition provides an alternative approach [8].
Materials:
- Cancerous and non-cancerous gene sequences from databases (e.g., NCBI)
- Computing environment with signal processing and machine learning libraries
- Python with NumPy, PyWavelets, and scikit-learn packages
Procedure:
- Sequence Acquisition and Preparation:
- Obtain cancerous and non-cancerous gene sequences for specific cancer types (lung, breast, ovarian)
- Verify sequence quality and annotation
Numerical Mapping:
- Convert nucleotide sequences to numerical indicator sequences using appropriate mapping scheme
- Validate mapping consistency across sequences
Wavelet Decomposition:
- Apply 4-level DWT using Haar wavelet to numerical sequences
- Extract approximation and detail coefficients at each decomposition level
Statistical Feature Extraction:
- Calculate statistical features (mean, median, standard deviation, interquartile range, skewness, kurtosis) from wavelet coefficients
- Compile features into structured feature matrix
Machine Learning Classification:
- Partition data into training and validation sets (e.g., 70-30 split)
- Train Support Vector Machine classifier on extracted features
- Validate model using k-fold cross-validation
- Assess classification accuracy, precision, recall, and F1-score
Troubleshooting:
- If classification performance is suboptimal, experiment with different wavelet families (e.g., Daubechies, Coiflets)
- For imbalanced class distributions, apply appropriate sampling techniques or class weighting
Visualization Frameworks
Genomic Signal Processing Workflow for Cancer Detection
glfBLUP Pipeline for High-Dimensional Data Integration
The Scientist's Toolkit: Research Reagent Solutions
Table 3: Essential Research Reagents and Computational Tools for Genomic Pattern Recognition
| Category | Item/Reagent | Specifications | Application/Function |
|---|---|---|---|
| Sequencing Technologies | SDR-seq Platform | Capacity: 480 gDNA loci & genes simultaneously; Cell throughput: Thousands of single cells | Simultaneous DNA and RNA profiling at single-cell resolution [46] |
| Data Sources | NCBI Gene Sequences | Cancerous and non-cancerous sequences for multiple cancer types | Reference data for mutation pattern analysis [8] |
| Data Sources | Connectivity Map (CMap) | 2,166 drug-induced transcriptomic profiles; 12,328 genes per profile | Drug response analysis and biomarker discovery [45] |
| Computational Tools | DWT Algorithms | Haar wavelet; 4-level decomposition | Genomic signal decomposition for pattern identification [8] |
| Computational Tools | glfBLUP Pipeline | R/Python implementation with factor analysis capabilities | High-dimensional phenomic and genomic data integration [43] |
| Computational Tools | t-SNE/UMAP/PaCMAP | Dimensionality reduction libraries with visualization capabilities | High-dimensional data visualization and structure preservation [45] |
| Cell Lines | Human iPS Cells | WTC-11 line; validated pluripotency | Model system for variant function studies [46] |
| Fixation Reagents | Glyoxal | Non-crosslinking fixative | Nucleic acid preservation for SDR-seq [46] |
| Primer Systems | Custom Poly(dT) Primers | UMI, sample barcode, capture sequence | Target amplification and cell barcoding in SDR-seq [46] |
Optimizing Computational Workflows for Scalable Analysis
Application Note: Multimodal Data Integration for Cancer Genomics
The analysis of cancerous DNA patterns requires computational workflows capable of integrating and processing heterogeneous, large-scale multimodal data. The convergence of genomic, clinical, and imaging data presents both unprecedented opportunities and significant computational challenges for cancer researchers. This application note details optimized protocols for scalable analysis, leveraging cloud-native architectures and foundation model-driven embeddings to accelerate cancerous DNA pattern recognition research.
Quantitative Performance Benchmarks
Table 1: Performance Metrics of Multimodal Embedding Frameworks in Oncology
| Framework/Model | Data Modality | Task | Performance Metric | Result | Dataset Scale |
|---|---|---|---|---|---|
| HONeYBEE (Clinical embeddings) | Clinical data (structured/unstructured) | Cancer-type classification | Accuracy | 98.5% | 11,428 patients (33 cancer types) |
| HONeYBEE (Clinical embeddings) | Clinical data | Patient similarity retrieval | Precision@10 | 96.4% | 11,428 patients (33 cancer types) |
| HONeYBEE (Multimodal fusion) | Clinical + imaging + molecular | Overall survival prediction | Concordance index | Improvement over single-modality | 11,428 patients (33 cancer types) |
| OPSI algorithm | DNA sequence data | Approximate pattern matching | Time efficiency | 69% more efficient than hamming distance | DNA sequences with permissible mismatches (è) |
| Cancer Genomics Cloud | Genomic workflows | Variant calling across TCGA | Processing time and cost | ~3 hours for $15 | 11,000 TCGA participants |
Table 2: Framework Integration Capabilities and Data Support
| Platform/Component | Supported Data Types | Integration Method | Computational Infrastructure | Interoperability Standards |
|---|---|---|---|---|
| HONeYBEE Framework | Clinical text, pathology reports, WSIs, radiology scans, molecular profiles | Foundation model-driven embeddings, concatenation, mean pooling, Kronecker product fusion | PyTorch, Hugging Face, FAISS | GDC, IDC, TCIA, CRDC, PDC |
| Cancer Genomics Cloud (CGC) | Genomic, transcriptomic, clinical data, imaging, proteomic data | API, Semantic Web approach, Docker containers, Common Workflow Language | Amazon Web Services, cloud computation | TCGA, CCLE, TARGET, CGCI |
| OPSI Methodology | DNA sequence data | Shift Beyond for Avoiding Redundant Comparison (SBARC) table | Traditional computing infrastructure | Reference genome alignment |
Experimental Protocols
Protocol 1: Multimodal Patient Embedding Generation Using HONeYBEE
Purpose: To generate unified patient-level embeddings from multimodal oncology data for downstream tasks including cancer subtype classification, survival prediction, and patient similarity retrieval.
Materials:
- Patient data encompassing clinical text, whole-slide images, radiology scans, and molecular profiles
- HONeYBEE framework (open-source)
- Computational infrastructure compatible with PyTorch and Hugging Face
Procedure:
- Data Preprocessing:
- Standardize input data from repositories (TCGA, GDC, IDC, TCIA) using HONeYBEE's ingestion pipelines
- Process clinical text using language models (GatorTron, Qwen3, Med-Gemma, or Llama-3.2)
- Generate whole-slide image embeddings using UNI (ViT-L/16), UNI2-h (ViT-g/14), or Virchow2 models
- Process radiological images through RadImageNet CNN
- Encode molecular profiles using SeNMo self-normalizing deep learning encoder
Modality-Specific Embedding Generation:
- Execute embedding pipelines for each available data modality
- Configure model-specific parameters according to HONeYBEE documentation
- Generate feature vectors of standardized dimensions for each modality
Multimodal Fusion:
- Apply fusion strategies (concatenation, mean pooling, or Kronecker product) to integrate embeddings
- Validate fusion output dimensions and compatibility
Downstream Task Execution:
- Utilize fused embeddings for cancer classification, survival analysis, or similarity retrieval
- Evaluate performance using framework-specific evaluation metrics
Validation: Assess embedding quality through performance on benchmark tasks using TCGA dataset (11,428+ patients across 33 cancer types).
Protocol 2: Scalable DNA Pattern Recognition Using OPSI Algorithm
Purpose: To efficiently identify similar patterns in DNA sequences with permissible mismatches for applications in mutation detection and sequence alignment.
Materials:
- DNA sequence data (FASTA format)
- OPSI algorithm implementation
- Reference genome (if applicable)
Procedure:
- Algorithm Initialization:
- Preprocess sequence data to ensure consistent formatting
- Initialize Shift Beyond for Avoiding Redundant Comparison (SBARC) table
- Set permissible mismatch threshold (è) based on application requirements
Pattern Similarity Identification:
- Implement optimized pattern matching with O(ls·è) time complexity, where ls is sequence length
- Utilize SBARC table to bypass already compared characters in the text
- Identify spots of similar patterns occur in the sequence while ignoring è mismatches
Validation and Output:
- Compare results with traditional hamming distance-based approximate pattern matching
- Verify detected patterns against known mutation databases
- Generate alignment reports with mismatch positions highlighted
Validation: Benchmark against traditional methods, expecting 69% improvement in efficiency compared to hamming distance-based approaches.
Protocol 3: Cloud-Native Genomic Analysis Using Cancer Genomics Cloud
Purpose: To perform scalable, reproducible analysis of massive cancer genomic datasets without local infrastructure constraints.
Materials:
- Cancer Genomics Cloud platform access
- Genomic datasets (TCGA, CCLE, TARGET, or user-provided data)
- Analysis workflows (pre-installed or custom)
Procedure:
- Platform Setup:
- Register for CGC account (free profiles available)
- Configure project workspace with appropriate collaborators
- Select genomic datasets of interest from available repositories
Workflow Configuration:
- Choose from 200+ pre-installed bioinformatics tools and workflows or develop custom analyses using Software Development Kit
- Describe tools using Common Workflow Language for portability
- Package tools within Docker containers for reproducibility
Data Exploration and Query:
- Utilize Semantic Web approach to link clinical, biospecimen, and analysis metadata properties
- Build complex queries visually or programmatically to identify data of interest
- Use Case Explorer for global views of gene expression, copy number variation, and mutation status
Execution and Analysis:
- Launch analyses leveraging elastic cloud computation resources
- Monitor execution through CGC interface
- Collaborate with team members in shared project spaces
Reproducibility Assurance:
- Record all analysis aspects: input files, tool versions, parameter settings
- Export complete workflow descriptions for independent verification
Validation: Execute targeted variant calling across 11,000 TCGA participants as benchmark (expected: ~3 hours processing time, <$15 cost).
Workflow Visualization
Multimodal Data Integration Workflow
DNA Pattern Recognition Workflow
Cloud-Native Genomic Analysis Workflow
Research Reagent Solutions
Table 3: Essential Computational Tools for Cancer DNA Pattern Recognition Research
| Tool/Platform | Type | Primary Function | Application in Cancer Research |
|---|---|---|---|
| HONeYBEE Framework | Multimodal embedding generator | Integrates clinical, imaging, molecular data into unified patient representations | Cancer subtype classification, survival prediction, patient similarity analysis |
| Cancer Genomics Cloud | Cloud-based analysis platform | Provides scalable computation and collaborative workspace for genomic data | Variant calling, differential expression analysis, multi-omics integration |
| OPSI Algorithm | Pattern matching methodology | Identifies similar DNA patterns with permissible mismatches | Mutation detection, sequence alignment, reference genome mapping |
| GatorTron | Language model | Processes clinical text and pathology reports | Extracts semantic information from unstructured clinical narratives |
| UNI/Virchow2 | Whole-slide image models | Generates embeddings from pathology images | Digital pathology analysis, feature extraction from tissue samples |
| SeNMo | Molecular encoder | Encodes multi-omics data (gene expression, methylation, mutations) | Integrates molecular profiles with other data modalities |
| RadImageNet | Radiology model | Processes medical images (CT, MRI, PET scans) | Feature extraction from radiological images for tumor characterization |
| Common Workflow Language | Workflow standard | Ensures reproducibility and portability of analyses | Enables reproducible bioinformatics workflows across computing environments |
| Docker Containers | Virtualization technology | Packages tools and dependencies for consistent execution | Creates reproducible analysis environments across different systems |
Benchmarking Performance: Validation Frameworks and Comparative Analysis
In the field of cancerous DNA pattern recognition, the accuracy of any diagnostic model is fundamentally dependent on the quality of the underlying methylation data. DNA methylation serves as a powerful biomarker for cell type, age, environmental exposures, and disease states, including various cancers [47]. As signal processing approaches continue to advance for distinguishing cancerous DNA sequences, establishing validated ground truth through robust methodological comparisons becomes paramount [48]. This application note examines the critical process of validating DNA methylation profiling platforms, focusing specifically on the concordance between bisulfite sequencing and Infinium Methylation microarrays within the context of ovarian cancer research, providing detailed protocols and analytical frameworks for researchers and drug development professionals.
Platform Comparison: Technical Specifications and Performance Metrics
The Infinium Methylation EPIC array and targeted bisulfite sequencing represent two prominent approaches for DNA methylation analysis, each with distinct advantages for clinical and research applications [49]. The array platform provides broad coverage across predefined CpG sites, while sequencing-based methods offer flexibility for custom target investigation.
Table 1: Technical Comparison of Methylation Profiling Platforms
| Parameter | Infinium Methylation EPIC Array | Targeted Bisulfite Sequencing |
|---|---|---|
| CpG Coverage | 850,000-930,000 predefined sites [49] | Customizable (e.g., 648 CpG panel) [49] |
| Input DNA Requirements | Higher [49] | Lower [49] |
| Cost Structure | Higher per array [49] | Cost-effective for larger sample sets [49] |
| Platform Versatility | Fixed content | Adaptable to specific research questions [49] |
| Data Output | Beta values (methylation ratios) [49] | Methylation levels per CpG site [49] |
Table 2: Performance Concordance Between Platforms
| Sample Type | Correlation Metric | Performance Outcome | Key Findings |
|---|---|---|---|
| Ovarian Tissue (N=55) | Sample-wise correlation [49] | Strong agreement | Preserved diagnostic clustering patterns [49] |
| Cervical Swabs (N=25) | Sample-wise correlation [49] | Slightly reduced agreement | Likely due to reduced DNA quality [49] |
| CpG Site Analysis | Bland-Altman analysis [49] | Consistent methylation levels | Supports platform interchangeability for validated targets [49] |
Experimental Protocols for Cross-Platform Validation
Sample Preparation and DNA Extraction
Protocol: Nucleic Acid Isolation from Diverse Biospecimens
- Tissue Samples: Extract DNA using Maxwell RSC Tissue DNA Kit (Promega). Use 2μg genomic DNA for WGBS protocols [47] or 200ng for Swift Accel-NGS Methyl-Seq protocol [47].
- Cervical Swabs/Liquid Biopsies: Extract DNA with QIAamp DNA Mini kit (QIAGEN) [49]. This is particularly relevant for minimally invasive early detection approaches.
- Quality Assessment: Verify DNA integrity and quantification via fluorometric methods prior to bisulfite conversion.
Bisulfite Conversion Methods
Protocol: Chemical vs. Enzymatic Conversion
- Chemical Conversion (Standard WGBS): Use EpiTect Bisulfite Kit (QIAGEN) or EZ DNA Methylation Kit (Zymo Research) [47] [49]. Incubate 2μg fragmented DNA following manufacturer's instructions for complete cytosine deamination.
- Enzymatic Conversion (EM-seq): Employ enzymatic methyl-seq to reduce DNA fragmentation [47]. This approach demonstrates enhanced DNA preservation compared to chemical bisulfite treatment.
- Conversion Efficiency Check: Include control DNA with known methylation status in each conversion batch.
Library Preparation and Sequencing
Protocol: Targeted Bisulfite Sequencing Library Construction
- Panel Design: Develop custom panel targeting diagnostically relevant CpG sites (e.g., 648 CpG sites across 119 primers) [49]. Include both internal targets (hypothesis-driven) and external targets (literature-based).
- Library Preparation: Use QIAseq Targeted Methyl Custom Panel kit (QIAGEN) following manufacturer's instructions [49].
- Quality Control: Assess library concentration with QIAseq Library Quant Assay Kit and size distribution with Bioanalyzer High Sensitivity DNA Kit [49].
- Sequencing: Pool libraries in equimolar concentrations, spike with PhiX, and sequence on Illumina MiSeq using v2 Reagent Kit (300 cycles) [49].
Computational Workflows for Data Processing
The accurate processing of bisulfite sequencing data requires specialized computational workflows that account for the chemical conversion of unmethylated cytosines. Multiple tools have been developed for this purpose, with varying performance characteristics [47].
Table 3: Benchmarking of Methylation Data Processing Workflows
| Workflow | Key Features | Performance Notes | Citation/Reference |
|---|---|---|---|
| Bismark | Three-letter alignment approach [47] | Consistently superior performance in benchmarking [47] | [47] |
| Biscuit | Recent workflow with comprehensive functionality [47] | Added to benchmark due to recent development [47] | [47] |
| FAME | Wild card-related approach transforming to asymmetric mapping [47] | Included as emerging methodology [47] | [47] |
| BAT | Well-established among research collaborators [47] | Included despite not meeting all selection criteria [47] | [47] |
| BSBolt, bwa-meth, gemBS, GSNAP, methylCtools, methylpy | Varied alignment and processing approaches [47] | Systematically evaluated in benchmark study [47] | [47] |
Signal Processing Applications in Cancer DNA Pattern Recognition
The validation of methylation profiling methods enables advanced signal processing approaches for cancerous DNA pattern recognition. Fourier-based techniques and digital filter design provide powerful tools for distinguishing cancerous samples based on protein coding regions of DNA sequences [48].
Diagram: Signal Processing Workflow for Cancer DNA Pattern Recognition
Workflow Description: The signal processing pipeline begins with DNA sequence input, which undergoes numerical mapping to convert genetic information into analyzable numerical data [48]. Parallel processing using both Discrete Fourier Transform (DFT) and Anti-Notch Filter techniques enables comprehensive feature extraction from the genetic signal [48]. These extracted features subsequently feed into a Support Vector Machine (SVM) classifier that distinguishes between cancerous and non-cancerous samples based on the discriminative patterns identified [48].
The Scientist's Toolkit: Essential Research Reagents and Materials
Table 4: Key Research Reagent Solutions for Methylation Analysis
| Category | Product/Kit | Manufacturer | Primary Function |
|---|---|---|---|
| DNA Extraction | Maxwell RSC Tissue DNA Kit | Promega | High-quality DNA isolation from tissue samples [49] |
| DNA Extraction | QIAamp DNA Mini Kit | QIAGEN | DNA extraction from swabs and liquid biopsies [49] |
| Bisulfite Conversion | EZ DNA Methylation Kit | Zymo Research | Chemical conversion of unmethylated cytosines [49] |
| Bisulfite Conversion | EpiTect Bisulfite Kit | QIAGEN | Alternative bisulfite conversion methodology [49] |
| Targeted Sequencing | QIAseq Targeted Methyl Custom Panel | QIAGEN | Library preparation for focused methylation analysis [49] |
| Whole-Genome Sequencing | Accel-NGS Methyl-Seq Kit | Swift Bio | Library prep for moderate to low-input DNA [47] |
| Quality Control | Bioanalyzer High Sensitivity DNA Kit | Agilent Technologies | Library size distribution and QC assessment [49] |
Analytical Framework for Cross-Platform Validation
Diagram: Methylation Validation Experimental Workflow
Experimental Framework: The validation workflow begins with careful sample collection from relevant biospecimens, followed by standardized DNA extraction and bisulfite conversion procedures [49]. Split samples undergo parallel analysis using both microarray and sequencing platforms to generate comparable methylation datasets [49]. Subsequent data processing and normalization enable direct concordance analysis between platforms, ultimately leading to method validation for specific research or clinical applications [49].
The establishment of methodological ground truth through rigorous validation of bisulfite sequencing against microarray platforms provides an essential foundation for advancing signal processing approaches in cancerous DNA pattern recognition. The demonstrated concordance between these platforms, particularly for tissue-based analyses, enables researchers to select the most appropriate methodology based on specific project requirements for cost, throughput, and target flexibility. As these validated methods continue to be implemented in cancer research and drug development, they support the creation of increasingly sophisticated pattern recognition models with enhanced diagnostic and prognostic capabilities for oncology applications.
Within the framework of signal processing methods for cancerous DNA pattern recognition, the evaluation of algorithm performance is paramount. The selection and interpretation of performance metrics are critical for assessing the efficacy of classification models in distinguishing cancerous from non-cancerous patterns. Accuracy, sensitivity, and specificity form the fundamental triad of metrics used to quantify this discriminatory power. However, in a clinical and research context, simply achieving high accuracy is insufficient; understanding the trade-offs between sensitivity and specificity and their implications for false positives and false negatives is essential for model utility and deployment. This document provides detailed application notes and protocols for employing these metrics in cancer classification research, with a specific focus on DNA sequence analysis and related data modalities.
Core Performance Metrics: Definitions and Clinical Significance
The performance of a binary classification model, such as one that distinguishes between cancerous and non-cancerous samples, is typically evaluated using a confusion matrix. This matrix cross-tabulates the predicted classes against the actual classes, defining four key outcomes: True Positives (TP), True Negatives (TN), False Positives (FP), and False Negatives (FN). From these, the primary metrics are derived.
- Accuracy measures the overall correctness of the classifier across both positive and negative classes. It is calculated as (TP + TN) / (TP + TN + FP + FN). While a useful general indicator, accuracy can be misleading when dealing with imbalanced datasets, where one class significantly outnumbers the other [50].
- Sensitivity (or Recall) quantifies the model's ability to correctly identify positive cases. It is calculated as TP / (TP + FN). A high sensitivity is crucial in cancer diagnosis, as it minimizes the number of false negatives—cases where cancer is present but missed by the test. This is often the priority in screening scenarios [51].
- Specificity measures the model's ability to correctly identify negative cases. It is calculated as TN / (TN + FP). High specificity reduces the number of false positives, preventing unnecessary follow-up procedures and anxiety for patients who do not have the disease [51].
The choice of which metric to prioritize depends on the specific clinical or research objective. For instance, in a screening tool aimed at identifying potential cancer cases from a large population, high sensitivity is prioritized to ensure few cancers are missed. Conversely, when confirming a diagnosis before initiating an invasive treatment, high specificity becomes more important to avoid subjecting healthy individuals to unnecessary procedures [51].
Quantitative Benchmarking in Current Literature
Recent advances in deep learning and machine learning have demonstrated high performance across various cancer classification tasks. The table below summarizes the reported metrics from several contemporary studies, providing a benchmark for researchers in the field.
Table 1: Performance metrics from recent cancer classification studies
| Cancer Type | Data Modality | Model / Approach | Accuracy | Sensitivity | Specificity | Source |
|---|---|---|---|---|---|---|
| Skin Cancer | Dermoscopic Images | Modified Inception-ResNet-V2 (AdaMax) | 97.65% | 96.67% | 98.92% | [50] |
| Skin Cancer | Dermoscopic Images | Hybrid EViT-Dens169 | 97.10% | 90.80% | 99.29% | [52] |
| Multi-Cancer | Histopathology Images | DenseNet121 | 99.94% | N/R | N/R | [53] |
| Multiple Cancers | 5-min ECG / HRV | Ensemble Model (RF, LDA, NB) | 86.00% | N/R | N/R | [54] |
| Breast Cancer | DNA Sequences | Non-linear SVM with Markov features | High (10-fold CV) | N/R | N/R | [55] |
| Skin Cancer | Dermoscopic Images | Hybrid Deep Learning Ensemble | 91.70% | N/R | N/R | [56] |
N/R: Not explicitly reported in the provided source.
Detailed Experimental Protocols
This section outlines a standardized protocol for developing and evaluating a cancer classifier, incorporating methodologies from cited studies on DNA sequence analysis and medical imaging.
Protocol 1: DNA Sequence-Based Classification Using Markov Features
This protocol is adapted from the hybrid approach detailed in [55], which combines Markov chain-based feature extraction with a non-linear SVM classifier for discriminating cancerous genes.
1. Data Acquisition and Preprocessing:
- Source: Obtain DNA sequences in FASTA format from public repositories like NCBI's GenBank [55].
- Selection: Curate a balanced dataset of known cancerous and non-cancerous (healthy) gene sequences. The study in [55] utilized 200 samples (100 cancerous, 100 non-cancerous) for breast cancer genes.
- Preprocessing: Validate sequences and ensure they are in a uniform format for feature extraction.
2. Feature Extraction via Markov Chain:
- Objective: Reduce the high dimensionality of DNA sequences while preserving discriminatory information.
- Procedure: a. For each DNA sequence, compute the transition probabilities of nucleotides (A, T, C, G). This involves calculating the probability of each nucleotide following every other nucleotide, effectively creating a transition probability matrix. b. This matrix captures the statistical and sequential properties of the DNA sequence, which are used as the feature vector for classification. This method maps sequences of different lengths into a fixed-size feature space [55].
3. Feature Selection and Model Training:
- Feature Selection: Apply a feature selection technique (e.g., statistical analysis of feature importance) to identify the most discriminative Markov features.
- Classifier Training: Train a non-linear Support Vector Machine (SVM) with kernel functions (e.g., Radial Basis Function (RBF) or Polynomial) on the selected features. The study [55] demonstrated the effectiveness of this combination.
4. Model Evaluation:
- Validation Method: Employ a 10-fold cross-validation to ensure robust performance estimation and mitigate overfitting [55].
- Metrics Calculation: Generate the confusion matrix from the cross-validation results and calculate accuracy, sensitivity, and specificity.
Protocol 2: Image-Based Classification via Transfer Learning
This protocol synthesizes methodologies from multiple studies that used deep learning for skin and other cancer types from images [50] [52] [53].
1. Dataset Curation and Preprocessing:
- Source: Utilize publicly available datasets such as ISIC for skin lesions [50] [52] or other relevant histopathology image datasets [53].
- Class Balancing: Address class imbalance using techniques like the Synthetic Minority Oversampling Technique (SMOTE) or data augmentation (random flipping, rotation, brightness/contrast adjustment) [50] [56].
- Preprocessing: Resize images to a uniform input size (e.g., 224x224 pixels). Apply artifact removal, noise reduction (median filtering), and edge enhancement to improve image quality [50] [52]. Normalize pixel values to a standard range (e.g., [0, 1]).
2. Model Selection and Training with Transfer Learning:
- Base Model: Select a pre-trained Convolutional Neural Network (CNN) such as Inception-ResNet-V2 [50], DenseNet121 [53], or a hybrid Vision Transformer-CNN architecture like EViT-Dens169 [52].
- Transfer Learning: Replace the final classification layer of the pre-trained model to match the number of classes (e.g., benign vs. malignant). Fine-tune the model weights on the target cancer dataset.
- Optimization: Use optimizers like Adam, Nadam, or AdaMax [50]. Implement early stopping and learning rate scheduling to prevent overfitting.
3. Model Evaluation and Robustness Testing:
- Data Splitting: Split data into training, validation, and a hold-out test set using stratified sampling to preserve class distribution.
- Validation: Use k-fold cross-validation (e.g., fivefold [50]) to assess model consistency.
- Performance Assessment: Evaluate the final model on the independent test set. Report accuracy, sensitivity, specificity, and Area Under the ROC Curve (AUC-ROC) [50] [57].
Workflow Visualization
The following diagram illustrates the logical sequence and decision points involved in the process of model building and metric prioritization, integrating concepts from the methodological descriptions.
The Scientist's Toolkit: Research Reagent Solutions
Table 2: Essential materials and computational tools for cancer classification research
| Item / Resource | Function / Description | Example Use Case |
|---|---|---|
| NCBI GenBank Database | A public repository of nucleotide sequences and supporting bibliographic and biological annotation. | Sourcing verified DNA sequences of cancerous and non-cancerous genes for model training and testing [55]. |
| ISIC Archive | A public repository of dermoscopic skin lesion images, often used for benchmarking deep learning models in dermatology. | Provides standardized, annotated image data for developing and validating skin cancer classifiers [50] [52]. |
| Pre-trained Deep Learning Models (e.g., Inception-ResNet-V2, DenseNet) | Models previously trained on large-scale image datasets (e.g., ImageNet), enabling transfer learning. | Used as a foundational feature extractor, fine-tuned on specific cancer image data to achieve high accuracy with limited data [50] [53]. |
| Synthetic Minority Oversampling Technique (SMOTE) | A statistical technique for increasing the number of cases in a dataset in a balanced way by generating synthetic examples. | Addressing class imbalance in training data to prevent model bias toward the majority class (e.g., more benign than malignant samples) [50]. |
| Scikit-learn Library | A popular open-source machine learning library for Python that provides simple and efficient tools for data analysis and modeling. | Implementing SVM classifiers, feature selection algorithms, and standard evaluation metrics like accuracy, sensitivity, and specificity [55]. |
| TensorFlow / PyTorch | Open-source libraries for deep learning, providing a flexible framework for building and training complex neural network architectures. | Developing and fine-tuning custom or hybrid deep learning models (e.g., CNN-LSTM ensembles) for cancer classification [56]. |
Comparative Analysis of GSP, Deep Learning, and Traditional Bioinformatics Tools
The advancement of cancer genomics has necessitated the development of sophisticated computational tools for identifying pathological patterns in DNA sequences. Three distinct methodological paradigms have emerged: Genomic Signal Processing (GSP), Deep Learning (DL), and Traditional Bioinformatics Tools. Each approach offers unique mechanisms for analyzing genomic data, with varying strengths in accuracy, interpretability, and resource requirements. This analysis provides a structured comparison of these methodologies within the context of cancerous DNA pattern recognition, offering quantitative performance assessments, detailed experimental protocols, and practical implementation guidelines for researchers and drug development professionals.
Quantitative Performance Comparison
The table below summarizes the key performance metrics, advantages, and limitations of each computational approach for cancer genomic analysis.
Table 1: Comparative Analysis of Computational Approaches for Cancer Genomics
| Feature | Genomic Signal Processing (GSP) | Deep Learning (DL) | Traditional Bioinformatics Tools |
|---|---|---|---|
| Reported Accuracy | 100% (cancerous vs non-cancerous classification) [8] | 92-99% (variant prioritization, methylation detection) [23] [58] | 50-80% sensitivity (SCNA detection from RNA-seq) [59] |
| Primary Strengths | High accuracy on specific classification tasks; Computational efficiency [8] | Superior performance on complex pattern recognition; Adaptability to multi-omics data [6] [23] | Established workflows; Better interpretability; Lower computational demands [60] [61] |
| Key Limitations | Limited to specific mutation types; Less effective with heterogeneous data [8] | "Black box" nature; High computational resource requirements; Large training datasets needed [6] [23] | Moderate sensitivity and specificity; Poor FDRs (27-60%) for some tasks [59] |
| Data Requirements | Numerical representations of sequences [8] | Large-scale labeled datasets [6] [62] | Pre-processed genomic data; Reference databases [60] [61] |
| Interpretability | Medium (statistical features in transform domain) [8] | Low (complex multi-layer architectures) [6] [23] | High (transparent algorithmic processes) [60] [63] |
Methodologies and Experimental Protocols
Genomic Signal Processing (GSP) Protocol
Objective: Distinguish cancerous from non-cancerous genomic sequences using signal processing techniques [8].
Workflow Diagram for GSP-Based Cancer Sequence Classification
Step-by-Step Protocol:
- Data Acquisition: Obtain cancerous and non-cancerous gene sequences from databases such as NCBI for specific cancer types (lung, breast, ovarian) [8].
- Numerical Mapping: Convert genomic sequences (A, C, G, T) into numerical representations using indicator sequences that GSP techniques can process [8].
- Discrete Wavelet Transform (DWT): Apply four-level DWT decomposition using Haar wavelet to the numerically mapped sequences. This process separates the genomic signal into different frequency components [8].
- Feature Extraction: Calculate statistical features from the wavelet domain including:
- Mean, median, and standard deviation
- Interquartile range
- Skewness and kurtosis [8]
- Classification: Implement a Support Vector Machine (SVM) classifier with linear kernel using the extracted statistical features. Utilize leave-one-out cross-validation (LOOCV) for performance evaluation [8].
Deep Learning Protocol for Methylation Detection
Objective: Detect DNA methylation sites from Oxford Nanopore sequencing data using deep learning frameworks [58].
Workflow Diagram for Deep Learning-Based Methylation Detection
Step-by-Step Protocol:
- Data Input: Collect ionic current signal data from Oxford Nanopore sequencing stored in POD5 or FAST5 files, along with basecalled reads in BAM format [58].
- Signal Preprocessing: Normalize raw ionic current signals to account for flow cell variations and sequencing artifacts. For R10.4 flowcells, process the dual signal pinch points characteristic of this technology [58].
- Model Architecture:
- Implement either a Bidirectional Long Short-Term Memory (BiLSTM) model or a Transformer architecture
- For BiLSTM: Configure to process genomic signals sequentially in both directions
- For Transformer: Implement attention mechanisms to capture long-range dependencies in the signal data [58]
- Model Training: Train the model using ground truth methylation data from bisulfite sequencing or methylation arrays. Utilize reference cell lines (e.g., NIH3T3, HG002) for validation [58].
- Methylation Calling: Generate per-read methylation predictions which are then aggregated to estimate methylation levels at each CpG site in the reference genome [58].
- Phased Analysis: For haplotype-specific methylation analysis, utilize phased BAM files as input to generate allele-specific methylation calls [58].
Traditional Bioinformatics Protocol for SCNA Detection
Objective: Predict somatic copy number aberrations (SCNAs) from RNA-seq data using traditional bioinformatics approaches [59].
Step-by-Step Protocol:
- Data Collection: Obtain RNA-seq data from cancer samples along with matched normal tissue where available. Public datasets such as TCGA and DepMap provide appropriate resources for this analysis [59].
- Expression Quantification: Process raw RNA-seq data through alignment and generate normalized expression values (e.g., TPM - transcripts per million) [59].
- Segmentation: Group adjacent genes into segments based on genomic positions, assuming genes within a segment share copy number status [59].
- Reference Comparison: Compare expression patterns against a reference set of normal samples to identify regions of significant amplification or deletion [59].
- Statistical Calling: Implement statistical models (e.g., circular binary segmentation) to identify genomic regions with significant deviations from normal expression patterns that may indicate SCNAs [59].
The Scientist's Toolkit: Research Reagent Solutions
Table 2: Essential Research Resources for Cancer Genomic Analysis
| Resource Category | Specific Tools/Databases | Primary Function | Applicable Methodology |
|---|---|---|---|
| Genomic Databases | TCGA, ICGC, COSMIC, cBioPortal [60] | Provide curated cancer genomic datasets for analysis and validation | All methodologies |
| Sequence Analysis Tools | GATK, STAR, HISAT2 [61] | Process sequencing data, perform alignment, and initial variant calling | Traditional Bioinformatics, GSP |
| Expression Analysis Tools | DESeq2, EdgeR [61] | Identify differentially expressed genes from RNA-seq data | Traditional Bioinformatics |
| Deep Learning Frameworks | TensorFlow, Keras, PyTorch [6] [61] | Provide infrastructure for developing and training DL models | Deep Learning |
| Specialized DL Models | DeepVariant, DeepMod2, RCANE [23] [58] [59] | Perform specific tasks like variant calling, methylation detection, and SCNA prediction | Deep Learning |
| Visualization Platforms | UCSC Xena, IGV [60] [58] | Enable visualization and exploration of genomic data and results | All methodologies |
The comparative analysis of GSP, Deep Learning, and Traditional Bioinformatics Tools reveals a complex landscape where each approach offers distinct advantages for specific scenarios in cancerous DNA pattern recognition. GSP provides exceptional accuracy for well-defined classification tasks with relatively low computational overhead. Deep Learning architectures demonstrate superior performance for complex pattern recognition tasks and multimodal data integration, albeit with higher computational demands and interpretability challenges. Traditional bioinformatics tools maintain relevance through their established workflows, transparency, and efficiency for standardized analyses. The optimal selection of methodology depends on multiple factors including the specific research question, data characteristics, computational resources, and interpretability requirements. Future advancements will likely focus on hybrid approaches that leverage the strengths of each paradigm while addressing their respective limitations through technical innovations.
The integration of advanced Signal Processing (SP) methods and artificial intelligence (AI) is revolutionizing the detection and interpretation of genomic patterns in cancer research. These computational approaches are critical for analyzing complex DNA sequencing data to identify somatic variants, structural rearrangements, and epigenetic modifications that drive oncogenesis. Establishing robust correlation between novel SP methodologies and established genomic technologies is fundamental for validating their clinical utility in precision oncology. This protocol outlines standardized procedures for conducting such correlation studies, with a focus on performance benchmarking across sequencing platforms and analytical pipelines. The framework supports the broader thesis that computational signal processing enables more accurate, efficient, and comprehensive cancerous DNA pattern recognition, ultimately accelerating biomarker discovery and therapeutic development.
Performance Metrics of AI-Based Variant Detection Tools
Table 1: Performance comparison of AI-driven somatic variant detection tools against traditional methods.
| Tool/Platform | Variant Type | Sensitivity (%) | Specificity (%) | Sequencing Technology | Clinical Validation |
|---|---|---|---|---|---|
| DeepSomatic [64] | Single-nucleotide variants & small indels | >99% (Benchmark tests) | >99% (Benchmark tests) | Short-read & Long-read | Pediatric leukemia, Glioblastoma |
| Blended Ensemble (Logistic Regression + Gaussian NB) [5] | Cancer type classification | 100 (BRCA1, KIRC, COAD), 98 (LUAD, PRAD) | Not Specified | DNA Sequencing | 5 cancer types (390 patients) |
| Illumina Short-Read [65] [66] | Single-nucleotide variants | ~99.99% (Theoretical) | ~99.99% (Theoretical) | Short-read | Colorectal cancer |
| Nanopore Long-Read [65] [66] | Structural variants | High precision | High precision | Long-read | Colorectal cancer |
Technical Performance of Sequencing Platforms
Table 2: Methodological comparison of short-read (Illumina) and long-read (Nanopore) sequencing technologies.
| Performance Metric | Illumina Short-Read | Nanopore Long-Read | Notes |
|---|---|---|---|
| Mean Coverage Depth [66] | 105.88X ± 30.34X (Exome) | 21.20X ± 6.60X (Whole Genome, CRC samples) | Coverage normalized for comparison |
| Mapping Quality (Phred Score) [66] | 33.67 (99.96% accuracy) | 29.8 (99.89% accuracy) | Measure of misaligned reads |
| Nucleotide Content (A/T %) [66] | 25.519% ± 0.580% / 25.654% ± 0.424% | 29.444% ± 0.181% / 29.450% ± 0.179% | Whole-genome data |
| Key Strengths [65] [66] | High base-level accuracy for point mutations | Superior structural variant detection; Epigenetic profiling | Platforms are complementary |
| Limitations [65] [66] | Limited in complex/repetitive regions | Higher error rates in base calling; Cost | Systematic uncertainties reported |
Experimental Protocols
Protocol 1: Cross-Platform Validation of Somatic Variant Detection
Objective: To validate the performance of signal processing methods (e.g., DeepSomatic) against established sequencing technologies for detecting somatic variants in cancer samples.
Materials:
- Matched tumor and normal DNA samples
- Illumina short-read sequencing platform
- Nanopore long-read sequencing platform
- Computational resources for data analysis
- Reference genome (GRCh38)
- DeepSomatic software tool [64]
Methodology:
- Sample Preparation: Extract high-quality DNA from matched tumor and normal tissues using standardized protocols. For formalin-fixed paraffin-embedded (FFPE) samples, implement additional purification steps to address degradation [64].
- Library Preparation & Sequencing:
- Prepare sequencing libraries for both Illumina and Nanopore platforms according to manufacturer protocols.
- For Illumina: Use exome capture panels (e.g., Twist Bioscience GRCh38 ILMN Exome 2.0 Plus Panel) for targeted sequencing [66].
- For Nanopore: Utilize PCR-free protocols to preserve epigenetic methylation signals [65].
- Sequence all samples on both platforms, ensuring minimum coverage of 100X for Illumina and 20X for Nanopore whole-genome sequencing [66].
- Data Processing:
- Process raw sequencing data through platform-specific pipelines for base calling, quality control, and alignment to reference genome.
- Generate binary alignment/map (BAM) files for downstream analysis.
- Variant Calling:
- Apply DeepSomatic to both datasets following developer guidelines for tumor-normal comparison [64].
- Process the same samples through traditional variant callers (e.g., GATK, VarScan) for comparison.
- Concordance Analysis:
- Compare variant calls across platforms using bedtools or custom scripts.
- Calculate sensitivity, specificity, and precision metrics using validated benchmark variants.
- Focus analysis on clinically relevant cancer genes (KRAS, BRAF, TP53, APC, PIK3CA) [66].
Protocol 2: Performance Benchmarking of AI-Based Classification Models
Objective: To evaluate the classification accuracy of SP-based ensemble models across multiple cancer types using DNA sequencing data.
Materials:
- DNA sequence dataset from cancer patients (e.g., 390 patients across 5 cancer types) [5]
- Pre-processed genomic features (e.g., 48 genes)
- Computational environment (Python with scikit-learn)
- Blended ensemble model (Logistic Regression + Gaussian Naive Bayes)
Methodology:
- Data Preprocessing:
- Perform outlier removal using Pandas drop() function.
- Standardize features using StandardScaler in Python.
- Retain all available features without reduction [5].
- Model Training:
- Implement blended ensemble combining Logistic Regression and Gaussian Naive Bayes.
- Optimize hyperparameters via grid search with 10-fold stratified cross-validation.
- Use 194 patients for training, 98 for validation, and 98 for testing [5].
- Performance Evaluation:
- Calculate accuracy, sensitivity, and specificity for each cancer type (BRCA1, KIRC, COAD, LUAD, PRAD).
- Generate micro- and macro-average ROC curves with AUC values.
- Perform SHAP analysis to identify feature importance (e.g., gene28, gene30, gene_18) [5].
- Statistical Validation:
- Compare results against recent deep-learning and multi-omic benchmarks.
- Assess potential for dimensionality reduction based on feature importance rankings.
Visualization of Workflows and Pathways
Cross-Platform Validation Workflow
Figure 1: Cross-platform validation workflow for somatic variant detection.
AI-Based Cancer Classification Pathway
Figure 2: AI-based cancer classification and interpretation pathway.
Research Reagent Solutions
Table 3: Essential research reagents and materials for correlation studies in cancerous DNA pattern recognition.
| Reagent/Material | Function/Application | Specifications |
|---|---|---|
| Twist Bioscience Exome Panel [66] | Target enrichment for exome sequencing | GRCh38 ILMN Exome 2.0 Plus Panel |
| Matched Cell Line Pairs [64] | Training data for AI models | Tumor-healthy pairs from 6 patients |
| Illumina Sequencing Reagents [66] | Short-read sequencing | MiniSeq, MiSeq, HiSeq, NextSeq systems |
| Nanopore Sequencing Reagents [65] [66] | Long-read sequencing | PCR-free protocols for methylation analysis |
| DeepSomatic Software [64] | AI-based variant detection | Deep learning framework for somatic mutations |
| SHAP Analysis Tool [5] | Model interpretation and feature importance | Identify key genes (gene28, gene30, etc.) |
Conclusion
Signal processing has firmly established itself as a powerful and transformative paradigm for cancerous DNA pattern recognition. By translating nucleotide sequences into analyzable numerical data, SP techniques like DWT and matched filtering provide a robust foundation for extracting discriminative features that distinguish cancerous from non-cancerous genomes. The integration of these methods with advanced machine and deep learning models, such as DeepMod2 for methylation detection, has significantly enhanced classification accuracy and enabled the analysis of complex epigenetic modifications. Despite challenges related to data noise and computational demands, optimization strategies like mode decomposition effectively enhance the signal-to-noise ratio. Validation studies consistently show high correlation with gold-standard methods, confirming the reliability of SP approaches. Future directions point towards the increased use of multi-modal data fusion, the development of more explainable AI models, and the application of these powerful computational techniques in clinical settings for early diagnosis, personalized treatment strategies, and ultimately, improved patient outcomes in the fight against cancer.
References
- 1. Genomic Signal Processing | Full Text [https://asp-eurasipjournals.springeropen.com/articles/10.1155/2010/137263]
- 2. Genomic signal processing for DNA sequence clustering [https://pmc.ncbi.nlm.nih.gov/articles/PMC5786891/]
- 3. Genomic Signal Processing and Gene Prediction Techniques [https://www.nature.com/research-intelligence/nri-topic-summaries/genomic-signal-processing-and-gene-prediction-techniques-micro-203250]
- 4. A genomic signal processing approach for identification ... [https://link.springer.com/article/10.1007/s00500-024-10377-y]
- 5. Refining cancer prediction with DNA sequencing and ... [https://www.nature.com/articles/s41598-025-23359-3]
- 6. Deep Learning for Cancer Detection Based on Genomic and ... [https://pmc.ncbi.nlm.nih.gov/articles/PMC12459622/]
- 7. Frequency-guided wavelet network for label-free cell death ... [https://www.sciencedirect.com/science/article/abs/pii/S0141938225003099]
- 8. Automated detection of cancerous genomic sequences ... [https://www.sciencedirect.com/science/article/abs/pii/S0167739X18326645]
- 9. Application of Fourier transform infrared spectroscopy on ... [https://pubmed.ncbi.nlm.nih.gov/40185215/]
- 10. Research of Recognition Method of Discrete Wavelet ... [https://pmc.ncbi.nlm.nih.gov/articles/PMC4274863/]
- 11. Pattern recognition for predictive, preventive, and ... [https://pmc.ncbi.nlm.nih.gov/articles/PMC5471804/]
- 12. Hadamard code based numerical mapping approach for ... [https://www.sciencedirect.com/science/article/abs/pii/S0010482525009163]
- 13. Evaluating the representational power of pre-trained DNA ... [https://genomebiology.biomedcentral.com/articles/10.1186/s13059-025-03674-8]
- 14. Biological Sequence Representation Methods and Recent ... [https://pmc.ncbi.nlm.nih.gov/articles/PMC12467266/]
- 15. Quantifying cancer- and drug-induced changes in ... [https://www.nature.com/articles/s41598-025-23075-y]
- 16. Decoding frequency-modulated signals increases ... [https://www.nature.com/articles/s41567-025-03030-4]
- 17. Cloud-Scale Genomic Signals Processing for Robust ... [https://pubmed.ncbi.nlm.nih.gov/26552098/]
- 18. Artificial intelligence for comprehensive DNA methylation ... [https://pmc.ncbi.nlm.nih.gov/articles/PMC12448452/]
- 19. Enhanced brain tumor identification using graph Fourier ... [https://www.sciencedirect.com/science/article/abs/pii/S004579062500518X]
- 20. A multi-representation deep-learning framework for accurate ... [https://translational-medicine.biomedcentral.com/articles/10.1186/s12967-025-07325-1]
- 21. New Diagnostic Tool Developed at Dana-Farber ... [https://www.dana-farber.org/newsroom/news-releases/2025/new-diagnostic-tool-developed-at-dana-farber-revolutionizes-acute-leukemia-diagnosis]
- 22. Computational models for pan-cancer classification based on ... [https://pmc.ncbi.nlm.nih.gov/articles/PMC12599994/]
- 23. Deep learning approaches for resolving genomic ... [https://pmc.ncbi.nlm.nih.gov/articles/PMC12579925/]
- 24. NIST Releases Trove of Genetic Data to Spur Cancer ... [https://www.nist.gov/news-events/news/2025/07/nist-releases-trove-genetic-data-spur-cancer-research]
- 25. DNA methylation and machine learning - PubMed Central - NIH [https://pmc.ncbi.nlm.nih.gov/articles/PMC12512482/]
- 26. Application of deep learning in cancer epigenetics through ... [https://pmc.ncbi.nlm.nih.gov/articles/PMC10661960/]
- 27. Epigenetic analysis for early cancer detection [https://www.nature.com/articles/d42473-020-00273-y]
- 28. Early Lung Cancer Detection Using Nucleotide Transition ... [https://www.medrxiv.org/content/10.1101/2025.09.09.25335450v1]
- 29. AOA Dx Demonstrates High Accuracy in AI-Powered Blood ... [https://aoadx.com/aacr2025/]
- 30. Cancer detection via one-shot learning: integrating gene ... [https://pmc.ncbi.nlm.nih.gov/articles/PMC12502228/]
- 31. New Approaches for Ovarian Cancer Treatment and ... [https://www.aacr.org/blog/2025/09/18/shining-a-light-on-new-approaches-for-ovarian-cancer-treatment-and-detection/]
- 32. Integrative Multi-Omics Approaches in Cancer Research: From Biological Networks to Clinical Subtypes - PMC [https://pmc.ncbi.nlm.nih.gov/articles/PMC8334347/]
- 33. Cancer systems biology: signal processing for ... [https://pmc.ncbi.nlm.nih.gov/articles/PMC4013347/]
- 34. Navigating Cancer Complexity: Integrative Multi-Omics Methodologies for Clinical Insights - PMC [https://pmc.ncbi.nlm.nih.gov/articles/PMC12553891/]
- 35. Methods for multi-omic data integration in cancer research - PMC [https://pmc.ncbi.nlm.nih.gov/articles/PMC11446849/]
- 36. Exploiting noise in array CGH data to improve detection of ... [https://pmc.ncbi.nlm.nih.gov/articles/PMC1994778/]
- 37. Characterization and mitigation of artifacts derived from NGS ... [https://bmcgenomics.biomedcentral.com/articles/10.1186/s12864-024-10157-w]
- 38. Challenges in array comparative genomic hybridization for ... [https://www.nature.com/articles/gim200789]
- 39. Next-generation sequencing in cancer diagnosis and ... [https://pmc.ncbi.nlm.nih.gov/articles/PMC12009796/]
- 40. EM-DeepSD: A Deep Neural Network Model Based on Cell ... [https://pmc.ncbi.nlm.nih.gov/articles/PMC12071254/]
- 41. Current AI technologies in cancer diagnostics and treatment [https://molecular-cancer.biomedcentral.com/articles/10.1186/s12943-025-02369-9]
- 42. Evaluating dimensionality reduction for genomic prediction [https://www.frontiersin.org/journals/genetics/articles/10.3389/fgene.2022.958780/full]
- 43. Improving Genomic Prediction Using High‐Dimensional ... [https://pmc.ncbi.nlm.nih.gov/articles/PMC12504928/]
- 44. BME 6780: Data Science for Bioengineers - Orly Alter [https://alterlab.org/teaching/BME6780/]
- 45. Benchmarking of dimensionality reduction methods to ... [https://www.nature.com/articles/s41598-025-12021-7]
- 46. Functional phenotyping of genomic variants using joint ... [https://www.nature.com/articles/s41592-025-02805-0]
- 47. PMC - PubMed Central [https://pmc.ncbi.nlm.nih.gov/articles/PMC12539629/]
- 48. A pattern recognition model to distinguish cancerous DNA ... [https://link.springer.com/article/10.1007/s00500-020-04942-4]
- 49. Comparative Performance of Methylation Array and ... [https://pmc.ncbi.nlm.nih.gov/articles/PMC12589796/]
- 50. Effective skin cancer classification by modified and ... [https://pmc.ncbi.nlm.nih.gov/articles/PMC12634692/]
- 51. Trade-offs between accuracy measures for electronic ... [https://pmc.ncbi.nlm.nih.gov/articles/PMC3264740/]
- 52. Enhanced early skin cancer detection through fusion of ... [https://www.nature.com/articles/s41598-025-18570-1]
- 53. Automating cancer diagnosis using advanced deep ... [https://www.nature.com/articles/s41598-024-75876-2]
- 54. Cancer classification using machine learning and HRV ... [https://www.nature.com/articles/s41598-021-01779-1]
- 55. A Markov chain-based feature extraction method for ... [https://pmc.ncbi.nlm.nih.gov/articles/PMC8022238/]
- 56. A Hybrid Deep Learning Ensemble for Accurate Skin ... [https://www.medrxiv.org/content/10.1101/2025.09.03.25335044v1.full-text]
- 57. How to evaluate deep learning for cancer diagnostics [https://pmc.ncbi.nlm.nih.gov/articles/PMC8068597/]
- 58. A signal processing and deep learning framework for ... [https://www.nature.com/articles/s41467-024-45778-y]
- 59. RCANE: a deep learning algorithm for whole-genome pan ... [https://www.nature.com/articles/s42003-025-08712-6]
- 60. Bioinformatics tools and resources for cancer and application [https://pmc.ncbi.nlm.nih.gov/articles/PMC11374212/]
- 61. Current Bioinformatics Tools in Precision Oncology - PMC [https://pmc.ncbi.nlm.nih.gov/articles/PMC12238682/]
- 62. a comprehensive review of DNA sequence analysis task ... [https://pmc.ncbi.nlm.nih.gov/articles/PMC12011883/]
- 63. A novel gene selection algorithm for cancer classification ... [https://pmc.ncbi.nlm.nih.gov/articles/PMC6334429/]
- 64. New AI tool detects hidden cancer mutations [https://news.ucsc.edu/2025/10/new-ai-tool-detects-hidden-cancer-mutations/]
- 65. Methodological Comparison of Short-Read and Long ... [https://pubmed.ncbi.nlm.nih.gov/41009816/]
- 66. Methodological Comparison of Short-Read and Long ... [https://www.mdpi.com/1422-0067/26/18/9254]