Sensitivity and Specificity in Cancer Diagnostics: A Comparative Analysis of Modern Testing Platforms
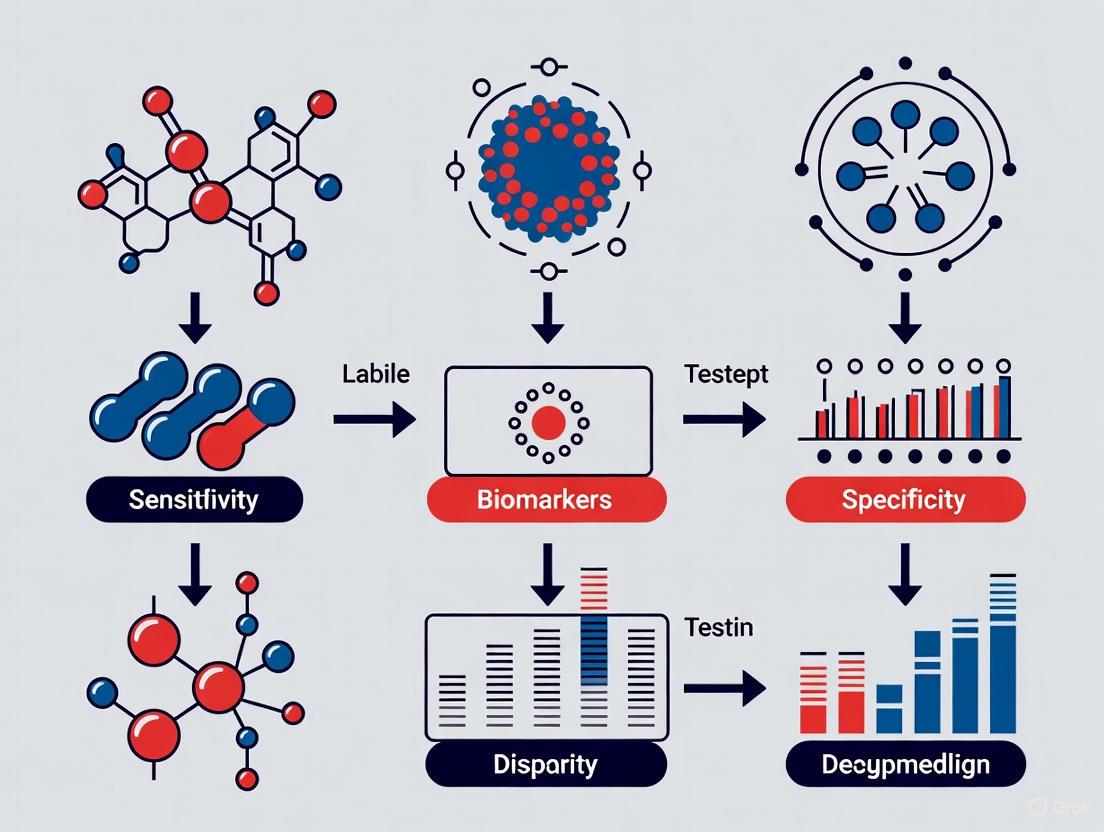
This article provides a comprehensive analysis of the sensitivity and specificity profiles of current and emerging cancer testing platforms, tailored for researchers, scientists, and drug development professionals.
Sensitivity and Specificity in Cancer Diagnostics: A Comparative Analysis of Modern Testing Platforms
Abstract
This article provides a comprehensive analysis of the sensitivity and specificity profiles of current and emerging cancer testing platforms, tailored for researchers, scientists, and drug development professionals. It explores the foundational principles of diagnostic accuracy, examines the methodologies and real-world applications of platforms including multi-cancer early detection (MCED) tests, immunohistochemistry, and fluorescence in-situ hybridization (FISH), addresses key challenges in test optimization, and offers a rigorous comparative validation of performance metrics across technologies. The synthesis of this information aims to inform strategic R&D decisions and guide the future evolution of oncological diagnostics.
The Pillars of Diagnostic Accuracy: Understanding Sensitivity and Specificity in Oncology
In the field of oncology, accurate diagnostic tests are critical for early detection, appropriate treatment selection, and improved patient outcomes. The performance of these tests is quantitatively assessed using four fundamental metrics: sensitivity, specificity, positive predictive value (PPV), and negative predictive value (NPV). These statistical measures provide distinct but complementary information about a test's clinical utility [1] [2]. Sensitivity and specificity are inherent characteristics of a test itself, reflecting its technical accuracy, while PPV and NPV are highly influenced by the clinical context, particularly disease prevalence in the tested population [3] [2]. For researchers and clinicians evaluating cancer screening platforms, diagnostic imaging, liquid biopsies, or biomarker assays, understanding the interplay between these metrics is essential for appropriate test interpretation and application.
This guide provides a comprehensive comparison of these key metrics across different cancer testing platforms, supported by experimental data and detailed methodologies. We will explore how these metrics are calculated, their clinical implications, and their performance across various cancer types and technologies, from established imaging techniques to emerging multi-cancer early detection (MCED) tests.
Defining the Core Metrics
Conceptual Foundations and Calculations
The four core metrics are derived from a 2x2 contingency table that cross-tabulates test results (positive or negative) with actual disease status (present or absent) [1] [2]. The fundamental relationships are illustrated in the diagram below:
Figure 1: Logical relationships between test results, disease status, and the four key diagnostic metrics. This 2x2 table forms the foundation for calculating sensitivity, specificity, PPV, and NPV.
Sensitivity (True Positive Rate): Measures a test's ability to correctly identify individuals with the disease. High sensitivity is crucial for ruling out disease when the test is negative (often remembered by the mnemonic "SNOUT") [3]. For example, a sensitivity of 98% for prostate-specific antigen (PSA) density in detecting clinically significant prostate cancer means it correctly identified 98% of all subjects with the disease [2].
Specificity (True Negative Rate): Measures a test's ability to correctly identify individuals without the disease. High specificity is valuable for ruling in disease when the test is positive (mnemonic "SPIN") [3]. In the same prostate cancer study, a specificity of 16% indicates that only 16% of healthy subjects were correctly identified as negative, while many received false positives [2].
Positive Predictive Value (PPV): The probability that a person with a positive test result actually has the disease. This metric is highly dependent on disease prevalence [3] [2]. As prevalence decreases, PPV typically decreases as well, meaning false positives become more common relative to true positives.
Negative Predictive Value (NPV): The probability that a person with a negative test result truly does not have the disease. NPV increases as disease prevalence decreases [3] [2].
There is typically an inverse relationship between sensitivity and specificity. Adjusting a test's threshold to increase sensitivity usually decreases specificity, and vice versa [2]. For instance, lowering the PSA density cutoff for prostate biopsy from 0.08 ng/mL/cc to 0.05 ng/mL/cc increased sensitivity from 98% to 99.6% but decreased specificity from 16% to 3% [2].
Prevalence Impact on Predictive Values
Unlike sensitivity and specificity, which are considered stable test characteristics, predictive values are profoundly influenced by disease prevalence in the tested population [3] [2]. This relationship has critical implications for cancer screening programs targeting different risk groups.
Table 1: Impact of Prevalence on Predictive Values (for a test with 90% sensitivity and 95% specificity)
| Disease Prevalence | Positive Predictive Value (PPV) | Negative Predictive Value (NPV) |
|---|---|---|
| 1% | 8% | >99% |
| 10% | 50% | 99% |
| 20% | 69% | 97% |
| 50% | 90% | 90% |
Data adapted from Geeky Medics [3]
This prevalence dependence explains why the same test may perform very differently in various clinical settings. A cancer screening test used in the general population (low prevalence) will generate more false positives than when applied to a high-risk population (higher prevalence), even with identical sensitivity and specificity [3] [2].
Comparative Performance Across Cancer Testing Platforms
Established Single-Cancer Screening Modalities
Conventional cancer screening methods typically focus on specific organ systems and demonstrate variable performance characteristics depending on the cancer type and technology used.
Table 2: Performance of Conventional Cancer Screening Tests
| Cancer Type | Screening Test | Sensitivity | Specificity | Target Population |
|---|---|---|---|---|
| Breast Cancer | Mammography | 50–80% | 85–90% | Females aged 40 and above [4] |
| Colorectal Cancer | Fecal Occult Blood Test (FOBT) | 65–85% | 95–98% | Males and females aged 40 and above [4] |
| Lung Cancer | Chest X-ray | 30–50% | 80–90% | Males and females aged 40 and above [4] |
| Cervical Cancer | Pap Smear | 50–70% | 85–95% | Females aged 20 and above [4] |
| Gastric Cancer | Gastric Endoscopy | >95% | 90–95% | Males and females aged 50 and above [4] |
| Prostate Cancer | PSA Density (≥0.08 ng/mL/cc) | 98% | 16% | Men with elevated PSA [2] |
These traditional methods face several limitations, including moderate sensitivity and specificity, restriction to specific cancer types, and participation barriers such as discomfort, cost, and accessibility [4]. Approximately 45.5% of cancers occur in types without recommended screening protocols, highlighting the need for more comprehensive approaches [4].
Emerging Multi-Cancer Early Detection (MCED) Tests
MCED tests represent a transformative approach that can detect multiple cancer types from a single liquid biopsy, analyzing circulating tumor DNA (ctDNA) and other biomarkers [5] [4]. The experimental workflow for these advanced tests typically follows this pathway:
Figure 2: Generalized experimental workflow for MCED tests using liquid biopsy. Multiple biomarker analysis methods are often combined to enhance detection sensitivity and specificity.
Table 3: Performance Characteristics of Selected MCED Tests
| MCED Test | Company/Developer | Sensitivity | Specificity | Detection Method | Detectable Cancer Types |
|---|---|---|---|---|---|
| Galleri | GRAIL | 51.5% | 99.5% | Targeted methylation sequencing | >50 cancer types [4] |
| Carcimun | - | 90.6% | 98.2% | Protein conformation changes | Multiple cancers [5] |
| CancerSEEK | Exact Sciences | 62% | >99% | Multiplex PCR + immunoassay | 8 cancer types [4] |
| Shield | Guardant Health | 65% (Stage I) | 88% | Genomic mutations + methylation | Colorectal cancer [4] |
| PanTum Detect | Zyagnum AG | 100% | 96.2% | Epitope detection in monocytes | Multiple cancers [4] |
| Aurora | AnchorDx | 84% (Lung) | 99% (Lung) | Targeted methylation sequencing | Lung, breast, colorectal, gastric, esophageal cancers [4] |
MCED tests demonstrate a wide range of sensitivities (51.5%-100%) and specificities (88%-99.5%) across different technologies [5] [4]. The Carcimun test, which detects conformational changes in plasma proteins through optical extinction measurements, reported a mean extinction value of 315.1 in cancer patients compared to 23.9 in healthy individuals and 62.7 in those with inflammatory conditions, demonstrating significant differentiation capability (p<0.001) [5]. Many MCED tests combine multiple analysis methods to improve performance. For example, CancerSEEK simultaneously analyzes eight cancer-associated proteins and 16 cancer gene mutations, increasing overall sensitivity from 43% to 69% compared to using either approach alone [4].
Detailed Experimental Protocols
Carcimun Test Methodology
The Carcimun test employs a unique approach based on detecting conformational changes in plasma proteins through optical extinction measurements. The detailed experimental protocol is as follows [5]:
Sample Preparation: Initially, 70 µl of 0.9% NaCl solution is added to the reaction vessel, followed by 26 µl of blood plasma, resulting in a total volume of 96 µl with a final NaCl concentration of 0.9%. Subsequently, 40 µl of distilled water is added, increasing the volume to 136 µl and adjusting the NaCl concentration to 0.63%.
Incubation: The mixture is incubated at 37°C for 5 minutes to achieve thermal equilibration.
Baseline Measurement: After incubation, a blank measurement is recorded at 340 nm to establish a baseline.
Acid Addition: Following this, 80 µl of 0.4% acetic acid solution (containing 0.81% NaCl) is added, resulting in a final volume of 216 µl with 0.69% NaCl and 0.148% acetic acid.
Final Measurement: The final absorbance measurement is performed at 340 nm using the Indiko Clinical Chemistry Analyzer (Thermo Fisher Scientific, Waltham, MA, USA).
Blinding: All measurements are performed in a blinded manner, with personnel conducting the measurements unaware of the clinical or diagnostic status of the samples.
Cut-off Value: The test's performance metrics are calculated using a predefined cut-off value of 120 to differentiate between healthy and cancer subjects, determined through ROC curve analysis and the Youden Index in previous studies [5].
Auto-Antibody ELISA Methodology
Auto-antibody detection ELISA represents another approach for cancer detection by identifying antibodies against tumor-associated antigens. The optimized protocol includes [6]:
Plate Coating: Flat bottom polystyrene 96-well Immunolon-4 HBX microtiter plates (binding capacity 100-200 ng IgG/cm²) are coated with 2 µg/cm³ of purified recombinant human antigen in 100 mm³ coating buffer (phosphate buffered saline, PBS).
Incubation: The plate is sealed with adhesive sealing films and incubated overnight in the dark at room temperature.
Washing and Blocking: Plates are washed once with specific buffer, then blocked for 2 hours at room temperature with 100 µl of a four-fold dilution of BlockAce solution.
Sample Incubation: After two washes, 100 mm³ of 10,000-fold diluted serum samples are added and incubated for 1 hour at 37°C.
Secondary Antibody: After three washes, 100 mm³ of 20,000-fold diluted anti-human IgG-HRP conjugate is added in buffer and incubated for 1 hour at room temperature.
Detection: The plate is washed five times, then incubated with 100 mm³ of prestained TMB PLUS substrate solution for 30 minutes at room temperature in the dark.
Reaction Stop: The enzyme reaction is stopped with 100 mm³ of 0.45 mol/dm³ H₂SO₄.
Reading: Absorbance is read within 30 minutes at 450 nm with an ELISA reader.
Each ELISA is repeated at least twice, with standards, samples, blanks, and/or controls analyzed in duplicates to ensure reproducibility [6].
Essential Research Reagents and Materials
Cancer diagnostic research requires specialized reagents and tools for various analytical platforms. The following table details key research solutions used in the experiments cited throughout this guide.
Table 4: Essential Research Reagent Solutions for Cancer Diagnostic Development
| Research Tool | Function/Application | Example Uses |
|---|---|---|
| Indiko Clinical Chemistry Analyzer (Thermo Fisher) | Optical extinction measurements at 340 nm | Carcimun test for detecting protein conformational changes [5] |
| Anti-human IgG-HRP conjugate | Secondary antibody for ELISA detection | Auto-antibody detection in colorectal cancer research [6] |
| ProQuantum Immunoassay Kits | High-sensitivity protein detection using proximity amplification | Quantitation of low-abundance cancer biomarkers [7] |
| ProcartaPlex Multiplex Immunoassays | Simultaneous measurement of multiple soluble biomarkers | Analysis of immuno-oncology checkpoint panels [7] |
| Luminex xMAP Technology | Multiplex gene and protein detection | Hallmarks of cancer biomarker panels [7] |
| Hallmarks of Cancer ELISA Kits | Detection of specific cancer-related proteins | Measuring VEGF, IL-8, EGF in cancer progression research [7] |
| Recombinant human antigens (e.g., PKA, NNMT) | Coating antigens for auto-antibody capture | Optimizing diagnostic ELISAs for colorectal cancer [6] |
| TMB PLUS substrate | Chromogenic substrate for HRP detection | Developing colorimetric signal in ELISA protocols [6] |
These research tools enable the development and optimization of various cancer diagnostic platforms. For instance, ProQuantum immunoassays utilize proximity-based amplification technology that combines antibody-antigen binding with qPCR signal detection, achieving high sensitivity with small sample volumes [7]. Similarly, ProcartaPlex multiplex panels allow researchers to simultaneously track multiple soluble proteins over time, providing comprehensive insights into cancer development and metastasis [7].
Sensitivity, specificity, PPV, and NPV provide distinct but complementary insights into cancer test performance. While sensitivity and specificity describe inherent test accuracy, PPV and NPV reflect clinical utility in specific populations. Traditional single-cancer screening tests demonstrate moderate performance (e.g., mammography sensitivity: 50-80%, specificity: 85-90%), while emerging MCED tests show promising ranges (sensitivity: 51.5%-100%; specificity: 88%-99.5%) across multiple cancers [5] [4].
Methodology significantly influences performance, with combined biomarker approaches generally enhancing detection capabilities [4]. As the field advances, standardized metrics and transparent reporting will be essential for researchers and clinicians to evaluate these technologies effectively and integrate them appropriately into cancer detection and management pathways.
The Critical Impact of Early Detection on Cancer Survival Rates
Cancer remains a leading cause of death worldwide, with prognosis heavily dependent on the disease stage at detection. Early-stage cancers are significantly more treatable and potentially curable, driving intensive research into multi-cancer early detection (MCED) technologies. This guide objectively compares the performance of three leading blood-based cancer testing platforms—GRAIL's Galleri, BillionToOne's Northstar Select, and the Carcimun test—framed within a broader thesis on the critical importance of sensitivity and specificity in diagnostic platforms. For researchers and drug development professionals, understanding the technical capabilities, underlying methodologies, and performance characteristics of these emerging technologies is essential for advancing the field of liquid biopsy and improving patient outcomes.
Performance Comparison of Cancer Testing Platforms
The table below summarizes key performance metrics from recent clinical studies of three distinct cancer detection approaches, highlighting their technological foundations and detection capabilities.
Table 1: Comparative Analysis of Cancer Detection Platforms
| Platform | Technology | Intended Use | Sensitivity | Specificity | Key Performance Highlights |
|---|---|---|---|---|---|
| GRAIL Galleri [8] | Targeted Methylation Sequencing | MCED Screening | 40.4% (All cancers); 73.7% (for 12 high-mortality cancers) | 99.6% | 7-fold increase in cancer detection when added to standard screening; 92% Cancer Signal Origin accuracy |
| BillionToOne Northstar Select [9] | Single-Molecule NGS (smNGS) | Comprehensive Genomic Profiling (CGP) | LOD95 of 0.15% VAF for SNVs; 5-fold better LOD95 for CNVs | >99.9% | Detected 51% more SNVs/Indels and 109% more CNVs vs. comparators; 45% fewer null reports |
| Carcimun Test [5] | Optical Extinction of Plasma Proteins | Cancer vs. Inflammatory Conditions | 90.6% | 98.2% | 95.4% accuracy differentiating cancer from healthy/ inflammatory states; Mean extinction value: 315.1 (cancer) vs. 23.9 (healthy) |
Experimental Protocols and Methodologies
GRAIL Galleri MCED Test
The Galleri test employs a targeted methylation sequencing approach to analyze cell-free DNA (cfDNA) in blood plasma [8].
- Study Design: The PATHFINDER 2 registrational study was a prospective, multi-center interventional study enrolling 35,878 participants aged 50+ with no clinical suspicion of cancer [8].
- Laboratory Protocol: Cell-free DNA is isolated from plasma samples followed by bisulfite conversion. Targeted sequencing captures methylation patterns across approximately 100,000 informative genomic regions. A proprietary machine learning classifier analyzes methylation patterns to detect cancer signals and predict the tissue of origin (Cancer Signal Origin) [8].
- Key Metrics: Performance was evaluated through episode sensitivity (ability to detect cancer confirmed within 12 months), specificity, positive predictive value (PPV), and Cancer Signal Origin (CSO) prediction accuracy [8].
BillionToOne Northstar Select
Northstar Select utilizes single-molecule next-generation sequencing (smNGS) with Quantitative Counting Templates (QCT) for ultra-sensitive detection of tumor-derived alterations [9].
- Study Design: A prospective head-to-head comparison included 182 patients with >17 solid tumor types from community oncology clinics and hospitals. The test was compared against six commercially available liquid biopsy assays [9].
- Laboratory Protocol: Circulating tumor DNA (ctDNA) is extracted from plasma. The QCT technology enables absolute molecular counting, allowing precise variant allele frequency (VAF) measurement. The 84-gene panel covers SNVs, indels, CNVs (amplifications and losses), fusions, and MSI-H [9].
- Orthogonal Validation: Additional alterations detected by Northstar Select but missed by comparators were validated using digital droplet PCR (ddPCR), demonstrating 98% concordance [9].
Carcimun Test
The Carcimun test uses a protein conformation-based approach detecting structural changes in plasma proteins via optical extinction measurements [5].
- Study Design: A prospective, single-blinded study included 172 participants: 80 healthy volunteers, 64 cancer patients (stages I-III), and 28 with inflammatory conditions or benign tumors [5].
- Laboratory Protocol: 26 µL of blood plasma is mixed with 70 µL of 0.9% NaCl solution and 40 µL distilled water. After incubation at 37°C for 5 minutes, a baseline absorbance measurement at 340 nm is recorded. 80 µL of 0.4% acetic acid solution is added, and final absorbance is measured at 340 nm using a clinical chemistry analyzer [5].
- Diagnostic Threshold: A pre-defined cut-off value of 120 extinction units differentiated healthy from cancer subjects, as determined by ROC curve analysis and Youden Index in prior studies [5].
Technology Workflow Diagrams
Diagram 1: Galleri Targeted Methylation Workflow
Diagram 2: Northstar Select Single-Molecule NGS Workflow
Diagram 3: Carcimun Protein Conformation Workflow
Research Reagent Solutions
Table 2: Essential Research Materials and Their Functions
| Reagent/Material | Function in Experimental Protocol |
|---|---|
| Cell-free DNA Isolation Kits | Extraction and purification of cfDNA from blood plasma for downstream sequencing applications [8] [9] |
| Bisulfite Conversion Reagents | Chemical treatment of DNA that converts unmethylated cytosines to uracils while preserving methylated cytosines, enabling methylation analysis [8] |
| Targeted Sequencing Panels | Custom-designed probe sets that enrich specific genomic regions of interest for efficient sequencing [8] [9] |
| Quantitative Counting Templates (QCT) | Proprietary molecular tags that enable absolute quantification and reduce sequencing errors in single-molecule approaches [9] |
| Digital Droplet PCR (ddPCR) Reagents | Orthogonal validation method that partitions samples into thousands of droplets for absolute quantification of specific variants [9] |
| Clinical Chemistry Analyzer | Instrumentation for precise absorbance/extinction measurements at specific wavelengths in protein-based assays [5] |
| Acetic Acid Solution | Chemical reagent used to induce conformational changes in plasma proteins for detection in extinction-based assays [5] |
Discussion and Clinical Implications
The comparative data reveals distinct technological approaches with complementary clinical applications. Galleri's methylation-based platform addresses the critical need for broad cancer screening, detecting over 50 cancer types with particularly strong performance for cancers responsible for two-thirds of cancer deaths [8]. Its high specificity (99.6%) minimizes false positives, while accurate Cancer Signal Origin prediction (92%) facilitates efficient diagnostic workups.
Northstar Select's smNGS technology excels in therapy selection for advanced cancers, detecting clinically actionable alterations other tests miss, especially below 0.5% variant allele frequency [9]. Its superior CNV detection, including the ability to differentiate focal drivers from aneuploidies, addresses a significant limitation in current liquid biopsy approaches.
The Carcimun test offers a fundamentally different approach through protein conformation analysis, providing high accuracy in distinguishing cancer from inflammatory conditions—a common challenge in cancer diagnostics [5]. Its technical simplicity and cost-effectiveness position it as a potential triage tool in clinical settings.
These platforms demonstrate how advancing sensitivity and specificity directly impacts clinical utility. Enhanced sensitivity enables detection of earlier-stage cancers and low-abundance actionable variants, while high specificity reduces unnecessary invasive procedures and patient anxiety. As these technologies evolve, their integration into standard care holds promise for significantly reducing cancer mortality through earlier detection and more precise treatment selection.
Limitations of Conventional Single-Cancer Screening Modalities
The evaluation of cancer screening tests revolves critically around the metrics of sensitivity and specificity. Sensitivity defines a test's ability to correctly identify individuals with the disease (true positives), while specificity measures its ability to correctly identify those without the disease (true negatives). For researchers and drug development professionals, understanding the limitations and performance boundaries of conventional screening modalities is fundamental to developing next-generation diagnostics. These established methods, while foundational, face inherent challenges related to their diagnostic accuracy, which can be influenced by technological constraints, tumor biology, and methodological frameworks used in their assessment. This guide objectively compares the performance of these conventional platforms, supported by experimental data and detailed methodologies.
Performance Analysis of Conventional Modalities
The performance of conventional screening tests is not absolute but is significantly affected by the chosen follow-up period, a concept defined as the accuracy assessment interval. This interval is the period after a screening test used to estimate its accuracy, and its length can introduce substantial bias into sensitivity and specificity estimates [10]. The inherent tradeoff is that an interval too short may miss cancers that were truly present at screening, while an interval too long may misclassify new cancers that developed after the screening as having been present initially [10].
The table below summarizes the reported sensitivity and specificity of various conventional single-cancer screening modalities, illustrating their performance variations.
Table 1: Diagnostic Accuracy of Conventional Cancer Screening Modalities
| Screening Modality | Cancer Type | Reported Sensitivity (%) | Reported Specificity (%) | Gold Standard | Key Limitations / Context |
|---|---|---|---|---|---|
| Digital Mammography [11] | Breast | 97.0 | 64.5 | Histopathology | Conducted in a diagnostic, not purely screening, context; specificity is moderate. |
| Fecal Immunochemical Test (FIT) [10] | Colorectal | 25.0 - 50.0 | 98.7 - 98.8 | Clinical follow-up (1-4 year interval) | Sensitivity highly dependent on the length of the accuracy assessment interval. |
| CT Scan for Staging [12] | Cervical | 55.0 (for parametrial invasion) | Information Missing | Clinical FIGO Staging | Poor agreement with clinical staging; underestimates local invasion. |
| 18FDG-PET/CT [13] | Breast (Axillary Lymph Nodes) | 52.2 | 91.6 | Histopathology | Systematically low sensitivity for detecting axillary lymph node metastases. |
| Biparametric MRI (bpMRI) [14] | Prostate | 80.0 - 84.0 | 74.0 - 77.0 | Histopathology or ≥2 year follow-up | High performance but omission of contrast may miss some lesions in specific scenarios. |
| Multiparametric MRI (mpMRI) [14] | Prostate | 82.0 - 86.0 | 75.0 - 78.0 | Histopathology or ≥2 year follow-up | Considered standard but is time-consuming, costly, and requires contrast agent. |
Methodological Deep Dive: Key Experiments and Protocols
To critically appraise the data from performance studies, it is essential to understand the experimental protocols from which they are derived.
Evaluating Digital Mammography Accuracy
A cross-sectional analytical study was conducted to determine the diagnostic accuracy of digital mammography for breast cancer detection [11].
Experimental Protocol:
- Patient Cohort: 122 female patients aged above 30 years referred for digital mammography for evaluation of breast-related symptoms.
- Imaging Technique: Mammograms were performed using Siemens Mammomat Nova 3000. Standard mediolateral oblique and craniocaudal projections were acquired, with additional views (e.g., magnified view, cone compression) taken as needed.
- Image Analysis: Digital mammograms were analyzed by a consultant radiologist with a minimum of five years of experience, documenting findings such as spiculated density, pleomorphic microcalcifications, and architectural distortion.
- Gold Standard: All patients subsequently underwent biopsy or surgery, and histopathological analysis was performed by a consultant pathologist with a minimum of five years of experience.
- Data Analysis: A 2x2 contingency table was constructed to calculate sensitivity, specificity, positive predictive value (PPV), negative predictive value (NPV), and overall diagnostic accuracy against the histopathology results [11].
Assessing PET/CT for Axillary Staging in Breast Cancer
A systematic review investigated the role of 18F-FDG PET/CT in staging the axilla in stage I-III breast cancer, providing a pooled analysis of its performance [13].
Experimental Protocol (Systematic Review):
- Search Strategy: A systematic search of PubMed, Ovid, and Cochrane libraries was conducted up to August 2020 using terms related to PET/CT and axillary staging.
- Inclusion/Exclusion Criteria: Studies were included if they assessed sensitivity and specificity of PET/CT for axillary lymph node metastases, used histopathology as a gold standard, and focused on stage I-III cancer. Studies with sample sizes below 50 or without extractable true/false positive/negative rates were excluded.
- Data Extraction: True positive (TP), false positive (FP), true negative (TN), and false negative (FN) rates were extracted from each included study.
- Quality Assessment: The quality of included studies was assessed using the CASP (Critical Appraisal Skills Programme) tool for diagnostic studies.
- Data Synthesis: Pooled means for sensitivity, specificity, PPV, NPV, and accuracy were calculated by combining the overall TP, FP, TN, and FN from studies using visual assessment of the PET/CT scans [13].
Conceptual Framework and Workflows
The following diagrams illustrate key concepts and workflows pertinent to understanding the limitations of cancer screening modalities.
Impact of Assessment Interval on Test Accuracy
This diagram conceptualizes how the length of the accuracy assessment interval following a screening test can lead to misclassification and biased estimates of sensitivity and specificity [10].
Workflow for Evaluating a Screening Test
This diagram outlines a generalized experimental workflow for establishing the diagnostic accuracy of a new cancer screening test against a histopathological gold standard, as exemplified in the digital mammography study [11].
The Scientist's Toolkit: Research Reagent Solutions
The following table details key reagents, materials, and technologies essential for conducting research in cancer screening and diagnostic accuracy.
Table 2: Essential Research Reagents and Materials for Diagnostic Accuracy Studies
| Item | Function/Application in Research |
|---|---|
| Histopathology Setup | The definitive gold standard for confirming cancer diagnosis. Involves tissue processing, staining (e.g., H&E), and microscopic examination by a pathologist [11]. |
| Digital Mammography System | Platform for acquiring high-quality mammographic images. Used to evaluate imaging biomarkers like spiculated masses and microcalcifications [11]. |
| 18F-FDG Tracer | The radiopharmaceutical used in PET/CT imaging. It acts as a biomarker for metabolically active tissue, including most cancers [13]. |
| PCR & NGS Reagents | Used for analyzing circulating tumor DNA (ctDNA) in liquid biopsy research. Enable detection of tumor-specific mutations and methylation patterns at low frequencies [15]. |
| CellSearch System | The only FDA-cleared system for enumerating Circulating Tumor Cells (CTCs) from blood samples. Used as a prognostic biomarker in clinical studies [16]. |
| Contrast Agents (Gadolinium/Iodinated) | Essential for enhancing soft tissue contrast in MRI (mpMRI) and CT scans, respectively. Critical for delineating tumor boundaries and assessing vascularity [12] [14]. |
| PI-RADS v2.1 Guidelines | A standardized framework for the acquisition, interpretation, and reporting of prostate MRI. Ensures consistency and reproducibility in research studies [14]. |
Conventional single-cancer screening modalities, from mammography to CT and PET/CT, are hampered by well-documented limitations in diagnostic accuracy. These include variable and often suboptimal sensitivity and specificity, which are not fixed attributes but can be influenced by study design factors like the accuracy assessment interval [10]. Furthermore, many tests are organ-specific, lack the granularity to accurately stage local disease [12], or exhibit performance characteristics that make them unsuitable as standalone replacements for invasive procedures like sentinel lymph node biopsy [13]. A deep understanding of these constraints, the methodologies used to uncover them, and the reagents required for such research is crucial for scientists and drug developers aiming to create the next generation of multi-cancer early detection tests and more precise, less invasive diagnostic tools.
The Emergence of Liquid Biopsy and Multi-Cancer Early Detection (MCED) Platforms
The landscape of cancer detection is undergoing a paradigm shift with the advent of liquid biopsy and Multi-Cancer Early Detection (MCED) platforms. Traditional cancer screening methods are limited in scope, often detecting only a few cancer types with low positive predictive value and suboptimal patient adherence [17]. Conventional screening targets only specific cancers like breast, cervical, colorectal, and lung cancers, leaving approximately 45.5% of annual cancer cases without recommended screening protocols [4]. Tissue biopsy, while remaining the gold standard for tumor diagnosis, presents significant limitations including invasiveness, difficulty in serial sampling for monitoring, and challenges in capturing tumor heterogeneity [16].
Liquid biopsy represents a minimally invasive approach that analyzes tumor-derived components from bodily fluids such as blood, focusing on biomarkers including circulating tumor cells (CTCs), circulating tumor DNA (ctDNA), extracellular vesicles (EVs), and proteins [16] [18]. MCED tests build upon this foundation by simultaneously screening for multiple cancers from a single liquid biopsy sample, identifying molecular changes before symptom onset [4]. These innovative platforms assess various biomarkers including DNA mutations, abnormal DNA methylation patterns, fragmented DNA, and protein signatures to indicate the presence of cancer and predict its tissue of origin [4]. The development of MCED technologies marks a significant advancement in oncology, potentially revolutionizing cancer control by enabling earlier detection of a broader spectrum of cancers.
Key Biomarkers and Technological Principles
MCED platforms leverage distinct biological signatures released by tumors into the bloodstream. The most prominent biomarkers include circulating tumor DNA (ctDNA), circulating tumor cells (CTCs), and proteins, each with unique advantages for cancer detection.
Circulating Tumor DNA (ctDNA) originates from tumor cells and represents a fraction of circulating cell-free DNA (cfDNA). In cancer patients, ctDNA base fragments are typically shorter than non-cancer cfDNA (approximately 20–50 base pairs) and exhibit a shorter half-life, enabling real-time monitoring of tumor dynamics [16]. CtDNA carries tumor-specific alterations including mutations, copy number variations, and methylation pattern changes. DNA methylation abnormalities, in particular, play a crucial role in cancer development and often precede tumor formation, making them valuable targets for early detection [16].
Circulating Tumor Cells (CTCs) are cells released from primary and metastatic tumors that circulate in the peripheral blood. Although extremely rare (approximately 1 CTC per 1 million leukocytes), CTC levels correlate with cancer development and play important roles in the metastatic process [16]. Technological advances in CTC isolation and detection have enhanced their potential as diagnostic biomarkers.
Protein Biomarkers complement nucleic acid-based approaches by measuring cancer-associated proteins in circulation. Some MCED tests combine protein signatures with mutational analysis to improve overall test performance [4]. For instance, one approach detects conformational changes in plasma proteins through optical extinction measurements as a marker for general malignancy [19].
The following diagram illustrates the primary biomarkers analyzed in liquid biopsy and their relationship to tumor processes:
Comparative Performance Analysis of MCED Platforms
The diagnostic performance of MCED tests varies significantly based on their technological approaches, target biomarkers, and intended use cases. The table below provides a comprehensive comparison of major MCED platforms based on current validation studies:
| Test Name | Technology/Company | Sensitivity (Overall) | Specificity | Detection Method | Key Detectable Cancers |
|---|---|---|---|---|---|
| Galleri | GRAIL | 51.5% (All cancers) 73.7% (High-mortality cancers) | 99.5% | Targeted methylation sequencing | >50 cancer types [4] [8] |
| OncoSeek | AI-powered test | 58.4% | 92.0% | 7 protein tumor markers + AI | Breast, lung, colorectal, liver, pancreatic, etc. [20] |
| CancerSEEK | Exact Sciences | 62% | >99% | Multiplex PCR + immunoassay | Lung, breast, colorectal, pancreatic, gastric, hepatic, esophageal, ovarian [4] |
| Carcimun | Protein-based test | 90.6% | 98.2% | Optical extinction of plasma proteins | Pancreatic, bile duct, esophageal, gastric, colorectal, lung [19] |
| Shield | Guardant Health | 83% (Colorectal cancer) | N/R | Genomic mutations, methylation, DNA fragmentation | Colorectal cancer [4] |
| Adela MCED | Adela Inc. | AUC 0.94 (All stages) AUC 0.92 (Stage I) | N/R | Genome-wide methylome enrichment | 12 cancer types including low-shedding cancers [21] |
Performance metrics for early-stage cancer detection are particularly important for assessing clinical utility. The Galleri test demonstrates a 40.4% episode sensitivity for all cancers in a prospective screening setting, with 73.7% sensitivity for the 12 cancers responsible for two-thirds of cancer deaths in the U.S. [8]. The Adela MCED platform shows promising early-stage detection with an AUC of 0.92 for stage I cancers and 0.95 for stage II cancers in a retrospective study [21]. The OncoSeek test demonstrates variable sensitivity across cancer types, ranging from 38.9% for breast cancer to 83.3% for bile duct cancer [20].
Recent modeling studies suggest that incorporating annual MCED testing into standard care could reduce late-stage (Stage IV) cancer diagnoses by 45%, with the largest absolute reductions in lung, colorectal, and pancreatic cancers [22]. The test interval significantly impacts this reduction, with annual testing achieving 45% reduction compared to 28% with biennial testing [22].
Experimental Methodologies and Workflows
Methylation-Based Detection Workflows
Targeted methylation sequencing represents one of the most advanced approaches for MCED testing. The following diagram outlines the generalized workflow for methylation-based MCED tests like Galleri:
The Galleri test utilizes a targeted methylation sequencing approach to detect over 50 types of cancer from a single blood draw [8]. The test workflow involves cell-free DNA extraction from plasma, library preparation focusing on methylation patterns, next-generation sequencing, and machine learning analysis to distinguish cancer from non-cancer signals and predict tissue of origin. In the PATHFINDER 2 study, this approach demonstrated 92% accuracy in predicting cancer signal origin, which facilitated efficient diagnostic workups with a median diagnostic resolution time of 46 days [8].
Protein-Based Detection Protocols
Alternative MCED approaches utilize protein biomarkers rather than nucleic acid analysis. The Carcimun test protocol exemplifies this methodology:
- Sample Preparation: 26 µL of blood plasma is added to 70 µL of 0.9% NaCl solution, resulting in a total volume of 96 µL [19].
- Dilution: 40 µL of distilled water is added, adjusting the NaCl concentration to 0.63% with a final volume of 136 µL [19].
- Incubation: The mixture is incubated at 37°C for 5 minutes to achieve thermal equilibration [19].
- Baseline Measurement: A blank measurement is recorded at 340 nm to establish a baseline [19].
- Acid Addition: 80 µL of 0.4% acetic acid solution (containing 0.81% NaCl) is added, resulting in a final volume of 216 µL with 0.69% NaCl and 0.148% acetic acid [19].
- Final Measurement: Absorbance is measured at 340 nm using a clinical chemistry analyzer [19].
This method detects conformational changes in plasma proteins through optical extinction measurements, with significantly higher extinction values in cancer patients (mean 315.1) compared to healthy individuals (mean 23.9) or those with inflammatory conditions (mean 62.7) [19]. The test uses a predefined cut-off value of 120 to differentiate between healthy and cancer subjects, achieving 90.6% sensitivity and 98.2% specificity in a prospective study that included participants with inflammatory conditions [19].
Multi-Modal Approaches
Some advanced MCED tests integrate multiple biomarker classes to enhance detection capabilities. CancerSEEK simultaneously analyzes 16 cancer gene mutations and 8 cancer-associated proteins, increasing sensitivity from 43% with mutation analysis alone to 69% with the combined approach [4]. Similarly, the Guardant Health Shield test combines genomic mutations, methylation patterns, and DNA fragmentation profiles for early colorectal cancer detection, demonstrating 83% sensitivity for colorectal cancer with 100% sensitivity for stages II-IV in the ECLIPSE study [4].
Research Reagent Solutions and Essential Materials
Successful implementation of MCED technologies requires specific research reagents and laboratory materials. The following table details key solutions used across different MCED platforms:
| Reagent/Material | Function | Example Applications |
|---|---|---|
| Cell-Free DNA Blood Collection Tubes | Stabilizes nucleated blood cells and preserves cell-free DNA | All ctDNA-based tests (Galleri, Shield, Adela) [21] [8] |
| Methylation-Specific Enzymes & Reagents | Bisulfite conversion, methylation-sensitive restriction enzymes | Methylation-based tests (Galleri, Adela) [21] [8] |
| Next-Generation Sequencing Kits | Library preparation, target enrichment, sequencing | Targeted methylation sequencing (Galleri), whole-genome sequencing (Oncodetect) [23] [8] |
| Protein Assay Reagents | Antibodies, detection substrates, buffers | Protein-based tests (Carcimun, CancerSEEK) [4] [19] |
| Bioinformatic Analysis Pipelines | Machine learning algorithms, classification models | All major MCED tests for result interpretation [20] [21] [8] |
| Quality Control Materials | Reference standards, internal controls | Validation and quality assurance across all platforms [20] [19] |
The OncoSeek test exemplifies platform flexibility, having been validated across four different quantification platforms (Roche Cobas e411/e601, Bio-Rad Bio-Plex 200) while maintaining consistent performance with a Pearson correlation coefficient of 0.99-1.00 between different laboratories [20]. This demonstrates that robust MCED tests can maintain performance across different instrumentation and laboratory settings.
For ctDNA-based tests, specialized blood collection tubes containing preservatives that stabilize nucleated blood cells are essential to prevent genomic DNA contamination and maintain the integrity of cell-free DNA. Methylation-based assays require specific reagents for bisulfite conversion or enzymatic treatment that distinguish methylated from unmethylated cytosine residues. Next-generation sequencing workflows depend on library preparation kits, target enrichment systems, and sequencing reagents tailored to the specific detection approach.
Clinical Validation and Implementation Challenges
Performance in Prospective Studies
Recent results from large-scale prospective studies provide critical insights into real-world MCED performance. The PATHFINDER 2 study, the largest U.S. MCED interventional study to date with 35,878 enrolled participants, demonstrated that adding the Galleri test to standard screenings increased cancer detection more than seven-fold compared to standard screening alone [8]. Importantly, 53.5% of cancers detected by Galleri were early-stage (stage I or II), and approximately three-quarters of the detected cancers lack standard screening options [8]. The study reported a positive predictive value (PPV) of 61.6%, substantially higher than the previous PATHFINDER study, with a specificity of 99.6% (false positive rate of 0.4%) [8].
The OncoSeek test was validated across 15,122 participants from seven centers in three countries, demonstrating consistent performance with an area under the curve (AUC) of 0.829, 58.4% sensitivity, and 92.0% specificity [20]. The test showed particularly high sensitivity for symptomatic cancers (73.1% at 90.6% specificity), suggesting utility in diagnostic settings [20].
Current Limitations and Research Directions
Despite promising results, MCED technologies face several challenges before widespread implementation. Detection sensitivity for early-stage cancers remains suboptimal, with most tests showing reduced sensitivity for stage I cancers compared to later stages [17]. The biological limitation of low ctDNA shed by early tumors contributes to this challenge, particularly for low-shedding cancers like bladder, breast, renal, prostate, and endometrial cancers [21].
Economic considerations represent another significant barrier. The cost-effectiveness of MCED tests in diverse healthcare systems requires further evaluation, particularly for population-level screening [17]. Additionally, questions regarding optimal screening intervals, management of false positives, and integration with existing cancer screening pathways need resolution through ongoing research.
Future development directions include enhancing sensitivity for early-stage cancers through technological improvements, validating performance in diverse populations, and demonstrating mortality reduction in large-scale randomized trials. Next-generation tests like Exact Sciences' Oncodetect are pursuing ultra-low detection limits (below 1 part per million) using whole-genome sequencing and tracking up to 5,000 patient-specific variants [23]. Such advances may expand clinical utility beyond early detection to minimal residual disease monitoring and recurrence surveillance.
Liquid biopsy-based MCED platforms represent a transformative approach in cancer detection, potentially addressing significant limitations of current single-cancer screening methods. Technologies utilizing methylation patterns, protein biomarkers, and multi-modal approaches demonstrate varying performance characteristics, with the most advanced tests showing specificity exceeding 99% and promising sensitivity for deadly cancers. While current evidence from large prospective studies is encouraging, further validation is needed to establish mortality benefits and cost-effectiveness. Ongoing technological refinements focus on enhancing early-stage detection sensitivity, improving tissue of origin accuracy, and expanding detectable cancer types. As evidence accumulates, MCED tests are poised to potentially redefine cancer screening paradigms by enabling comprehensive multi-cancer detection through minimally invasive liquid biopsies.
Platforms in Practice: Technological Mechanisms and Clinical Implementations
The rising global incidence of cancer underscores the critical need for diagnostic strategies that enable early detection when treatment is most effective [24]. Multi-Cancer Early Detection (MCED) tests represent a transformative approach in oncology, leveraging liquid biopsies to identify signals from multiple cancer types through a single, minimally invasive blood draw [18] [16]. Unlike traditional tissue biopsies, liquid biopsies analyze tumor-derived components circulating in bodily fluids, primarily focusing on circulating tumor DNA (ctDNA) released into the bloodstream through apoptosis and necrosis of tumor cells [16]. The true innovation of MCED technologies lies in their integrative analysis of distinct biological features of ctDNA—specifically, methylation patterns, fragmentomics, and mutational profiles—to achieve both high sensitivity and specificity across multiple cancer types [25]. This guide provides a technical comparison of the leading analytical approaches underpinning MCED tests, examining their experimental protocols, performance characteristics, and reagent requirements to inform research and development decisions.
Analytical Approaches: A Comparative Framework
MCED tests employ various technological frameworks to detect the often minuscule amounts of tumor-derived DNA in blood, where ctDNA can constitute less than 0.1% of total cell-free DNA (cfDNA) in early-stage disease [16]. The primary analytical approaches can be categorized into three paradigms: methylation profiling, fragmentomic analysis, and multimodal integration.
Methylation-Based Profiling
DNA methylation, the addition of a methyl group to cytosine in CpG dinucleotides, is a stable epigenetic marker that regulates gene expression without altering the DNA sequence [24]. Cancer cells exhibit characteristic methylation aberrations, including genome-wide hypomethylation and promoter-specific hypermethylation of tumor suppressor genes, which occur early in tumorigenesis and remain stable throughout cancer progression [24] [26]. These properties make methylation patterns highly specific biomarkers for cancer detection and tissue-of-origin identification.
The SPOT-MAS (Screening for the Presence of Tumor by Methylation and Size) assay exemplifies a targeted methylation approach. It simultaneously profiles methylomics, fragmentomics, copy number alterations, and end motifs using a combination of targeted and shallow genome-wide sequencing (~0.55x) [25]. In a validation cohort of 738 non-metastatic patients across five cancer types (breast, colorectal, gastric, liver, lung) and 1550 healthy controls, SPOT-MAS demonstrated a sensitivity of 72.4% at 97.0% specificity, with stage I and II sensitivities of 73.9% and 62.3%, respectively [25].
The Galleri test (GRAIL) represents a more comprehensive methylation approach, analyzing over 100,000 methylation regions across the genome to detect more than 50 cancer types [25]. This extensive profiling requires sophisticated bioinformatics pipelines and machine learning algorithms to distinguish cancer-specific methylation patterns from background noise.
Alternative methodologies to bisulfite sequencing include cell-free methylated DNA immunoprecipitation sequencing (cfMeDIP-seq), which uses an anti-5mC antibody to enrich for methylated cfDNA fragments without the damaging bisulfite conversion process [27]. A study focusing on esophageal cancer successfully utilized cfMeDIP-seq to identify 25 methylation and fragmentation markers, achieving a sensitivity of 99% and specificity of 97.8% in an independent validation cohort [27].
Fragmentomic Analysis
Fragmentomics refers to the study of cfDNA fragmentation patterns, which reflect genomic organization and cell death mechanisms [28]. Multiple fragmentomic features can be analyzed:
- Fragment Length Distribution: Tumor-derived cfDNA often demonstrates a shorter fragment length distribution compared to DNA from healthy cells, with a characteristic peak at ~167 bp and a smaller peak at ~330 bp, corresponding to mononucleosomal and dinucleosomal fragments [25].
- End Motifs and Breakpoint Motifs: The nucleotide sequences at the 3' and 5' termini of cfDNA fragments (end motifs) and sequences extending from breakpoint positions (breakpoint motifs) provide distinct signatures of nuclease activity and chromatin accessibility in cancer cells [27].
- Nucleosome Positioning: Differential nucleosome occupancy in cancer versus normal tissues affects cfDNA fragmentation patterns and protection from nuclease degradation [24].
The DELFI (DNA Evaluation of Fragments for Early Interception) assay employs genome-wide analysis of ctDNA fragment profiles to detect cancer, leveraging the observation that cfDNA from cancer patients exhibits more irregular fragmentation patterns compared to the structured fragmentation from healthy cells [25].
Multimodal Integration
Multimodal assays combine multiple analytic approaches to enhance detection sensitivity and tissue-of-origin localization. SPOT-MAS integrates methylation, fragment size, copy number alteration, and end motif data in a single workflow [25]. Similarly, CancerSEEK combines protein biomarkers with genetic alterations, though this approach can be more time-consuming and costly [25]. The fundamental advantage of multimodal integration is the complementary nature of different biomarker classes, which can compensate for the limitations of any single-marker approach, particularly in early-stage disease with low ctDNA fraction.
Performance Comparison of MCED Approaches
The clinical utility of MCED tests depends on their performance characteristics across cancer types and stages. The following tables summarize key performance metrics from recent studies and commercial tests.
Table 1: Overall Performance Characteristics of MCED Tests
| Test Name | Primary Technology | Cancer Types Covered | Sensitivity | Specificity | Tissue-of-Origin Accuracy |
|---|---|---|---|---|---|
| SPOT-MAS | Multimodal (Methylation + Fragmentomics) | 5 (Breast, Colorectal, Gastric, Liver, Lung) | 72.4% (All stages) | 97.0% | 0.70 (AUC) |
| Galleri | Methylation (100,000+ regions) | >50 | NA | NA | NA |
| cfMeDIP-seq (Esophageal) | Methylation + Fragmentomics | 1 (Esophageal) | 99% | 97.8% | Not Reported |
| DELFI | Fragmentomics (Genome-wide) | Multiple | NA | NA | NA |
Table 2: Stage-Wise Sensitivity of MCED Tests
| Test Name | Stage I Sensitivity | Stage II Sensitivity | Stage III Sensitivity | Early-Stage Cohort Size |
|---|---|---|---|---|
| SPOT-MAS | 73.9% | 62.3% | 88.3% (Non-metastatic) | 738 patients |
| cfMeDIP-seq (Esophageal) | Not Reported | Not Reported | Not Reported | 35 patients |
Experimental Protocols and Methodologies
Sample Collection and cfDNA Extraction
Standardized pre-analytical protocols are critical for reliable MCED results. The typical workflow begins with blood collection in EDTA or specialized cell-free DNA blood collection tubes, followed by plasma separation through a two-step centrifugation protocol (e.g., 1600g for 10 minutes, then 16,000g for 10 minutes at 4°C) [27]. cfDNA is then extracted from plasma using commercial kits, such as the Qiagen Circulating Nucleic Acids Kit, with final elution volumes typically ranging from 50-55 μL [27]. cfDNA concentration is quantified using fluorescence-based methods like the Qubit dsDNA High Sensitivity Assay, with quality control assessing fragment size distribution [27].
Library Preparation and Sequencing
The specific library preparation protocol varies by analytical approach:
- For cfMeDIP-seq: Input cfDNA (typically 100 ng) is used for library preparation. When cfDNA quantity is insufficient, carrier DNA (e.g., λDNA) may be added to maintain total input mass. The MagMeDIP kit or similar immunoprecipitation-based protocols are used with anti-5mC antibodies to enrich methylated fragments, followed by purification with AMPure XP beads and sequencing on platforms such as Illumina NovaSeq with 150 bp paired-end reads [27].
- For Targeted Methylation Sequencing: Assays like SPOT-MAS use a hybrid approach combining targeted methylation panels with low-pass whole-genome sequencing for fragmentomic analysis, achieving a total sequencing depth of approximately 0.55x [25].
- For Whole-Genome Methylation Sequencing: Approaches like Galleri require much higher sequencing depths to comprehensively profile methylation patterns across hundreds of thousands of genomic regions [25].
Bioinformatics and Data Analysis
Bioinformatic processing typically involves:
- Quality Control and Adapter Trimming: Using tools like FastQC and Trim Galore.
- Alignment to Reference Genome: Using aligners such as Bowtie2 with hg19 or GRCh38 reference genomes.
- Duplicate Removal: Using tools like Samtools.
- Feature Extraction:
- For methylation data: Peak calling with MACS2, followed by differential methylation analysis with packages like limma, often incorporating propensity score matching to control for confounding factors [27].
- For fragmentomics: Fragment length distribution analysis, end motif characterization, and nucleosome positioning patterns.
- Machine Learning Classification: Integration of multiple features using random forest, logistic regression, or deep learning models to generate cancer detection signals and tissue-of-origin predictions [25].
MCED Test Workflow: From Sample to Result
The Scientist's Toolkit: Essential Research Reagents
Table 3: Essential Research Reagents for MCED Development
| Reagent/Category | Specific Examples | Function/Application | Technical Notes |
|---|---|---|---|
| Blood Collection Systems | EDTA tubes, cfDNA Stabilization Tubes | Preserves blood sample integrity | Plasma is preferred over serum for higher ctDNA enrichment [24] |
| cfDNA Extraction Kits | Qiagen Circulating Nucleic Acids Kit | Isolates high-quality cfDNA from plasma | Final elution volume affects concentration; typically 50-55μL [27] |
| DNA Quantification | Qubit dsDNA HS Assay Kit | Accurate quantification of low-abundance cfDNA | Fluorescence-based methods preferred over spectrophotometry |
| Methylation Analysis | MagMeDIP Kit, Bisulfite Conversion Kits | Enables methylation profiling | cfMeDIP-seq avoids DNA damage from bisulfite conversion [27] |
| Library Preparation | Illumina DNA Prep, KAPA HyperPrep | Prepares sequencing libraries | Choice affects fragmentomic integrity [27] |
| Methylated DNA Standards | λDNA, Synthetic Methylated Controls | Controls for methylation efficiency | Used as spike-ins and when input cfDNA is limited [27] |
| Bead-Based Cleanup | AMPure XP Beads | Size selection and purification | Critical for removing adapter dimers and short fragments |
| Sequencing Platforms | Illumina NovaSeq, NextSeq | High-throughput sequencing | 150bp paired-end reads common for fragmentomics [27] |
The evolving landscape of MCED technologies demonstrates a clear trend toward multimodal integration, combining methylation, fragmentomic, and other molecular features to maximize diagnostic performance while managing costs [25]. Methylation-based approaches offer high specificity for cancer detection and tissue-of-origin localization, while fragmentomic analyses provide complementary information that enhances sensitivity, particularly in early-stage disease [27] [25]. The ongoing challenge for researchers and developers lies in optimizing the balance between test performance, accessibility, and cost-effectiveness to enable population-level screening implementation. As evidence accumulates from large-scale clinical validation studies, these advanced liquid biopsy approaches are poised to fundamentally transform cancer early detection paradigms and potentially reduce cancer mortality through earlier intervention.
Performance Comparison of Colorectal Cancer Screening Tests
The following tables summarize the latest performance data for available colorectal cancer (CRC) screening tests, providing researchers with key quantitative metrics for comparison.
| Test Name | Technology | Sensitivity for CRC | Specificity for Advanced Neoplasia | Recommended Screening Interval |
|---|---|---|---|---|
| Shield (V2 Algorithm) | Blood-based ctDNA [29] [30] [31] | 84% [29] [30] [32] | 90% [29] [30] [31] | 3 years [33] |
| ColoSense | Stool-based RNA [34] | 94% [34] | 88%* [34] | 3 years [34] |
| FIT | Stool-based Immunochemical [35] | 67-92% (Range) [31] | ~90-95% (Typical) [35] | 1 year [35] |
| Cologuard (sDNA-FIT) | Stool-based DNA + FIT [35] | 67-92% (Range) [31] | ~87% (Typical) [35] | 1-3 years [35] |
*Specificity for a negative colonoscopy was 88% in the CRC-PREVENT trial supporting ColoSense [34].
Table 2: Stage-Wise Sensitivity of the Shield Test (V2 Algorithm)
| Cancer Stage | Sensitivity | Clinical Significance |
|---|---|---|
| Stage I | 62% [29] [30] [32] | Detects a majority of earliest-stage cancers |
| Stage II | 100% [29] [30] | High detection rate for localized cancer |
| Stage III | 96% [29] [30] | Excellent detection for regional spread |
| Stage IV | 100% [29] [30] | Near-perfect detection for distant metastasis |
| Advanced Adenomas | 13% [29] [30] [35] | Limited sensitivity for precancerous lesions |
Experimental Protocol: The ECLIPSE Validation Study
The performance data for the Shield test is derived primarily from the landmark ECLIPSE (Evaluation of ctDNA LUNAR Assay in an Average Patient Screening Episode) study, a prospective, observational, multicenter trial that serves as the foundational clinical validation [29] [30] [35].
Study Design and Methodology
- Objective: To evaluate the performance of the Shield blood test for detecting CRC in average-risk individuals compared to screening colonoscopy [31] [32].
- Study Type: Prospective, observational, registrational study [29] [31].
- ClinicalTrials.gov Identifier: NCT04136002 [30] [31].
- Publication Venue: The New England Journal of Medicine [29] [31].
Participant Cohort and Eligibility
- Cohort Size: The analysis for the latest Shield V2 algorithm was performed on an expanded clinical cohort derived from the original ECLIPSE study, which enrolled over 20,000 participants [29] [31]. The initial clinical validation cohort included 10,258 participants, with 7,861 evaluable for analysis [31] [34].
- Age Range: 45 to 84 years [31].
- Risk Profile: Average risk for colorectal cancer [31] [32].
- Key Inclusion Criterion: Participants intended to undergo a screening colonoscopy and were willing to provide a blood sample before bowel preparation, within 60 days of the colonoscopy [30] [31].
- Key Exclusion Criteria: History of CRC, known diagnosis of inflammatory bowel disease, or prior colonoscopy within 9 years before study entry [30].
Experimental Workflow and Primary Endpoints
The experimental workflow of the ECLIPSE study followed a standardized protocol to ensure consistency and reliability.
Diagram 1: Experimental workflow of the ECLIPSE study, illustrating the patient pathway and primary endpoint assessment.
Primary Endpoints:
- Sensitivity for CRC: The proportion of participants with CRC confirmed by colonoscopy who tested positive on the Shield test [31].
- Specificity for Advanced Neoplasia: The proportion of participants without advanced neoplasia (CRC or advanced precancerous lesions) on colonoscopy who tested negative on the Shield test [31].
Secondary Endpoints included sensitivity for advanced adenomas, positive predictive value (PPV), and negative predictive value (NPV) [30].
Algorithm Evolution: Shield V2
The latest algorithm, Shield V2, represents an advancement over the version used in the initial ECLIPSE publication. Its performance was validated on an expanded cohort from the same study, demonstrating improved sensitivity (84%) while maintaining 90% specificity [29] [32]. This continuous algorithm refinement is a key aspect of the test's development trajectory.
The ctDNA Detection Pathway in Colorectal Cancer
The Shield test is based on the detection of circulating tumor DNA (ctDNA), which carries cancer-specific molecular signatures shed into the bloodstream. The following diagram illustrates the biological pathway and detection logic.
Diagram 2: The ctDNA biological pathway and analytical targets for the Shield blood test.
Research Reagent Solutions for ctDNA-Based CRC Detection
The following table details key reagents and materials essential for developing and implementing ctDNA-based screening assays like the Shield test.
Table 3: Essential Research Reagents for ctDNA-Based CRC Detection
| Reagent/Material | Function in Assay | Specific Application in Shield/ECLIPSE |
|---|---|---|
| Cell-Free DNA Blood Collection Tubes | Stabilizes nucleated blood cells to prevent genomic DNA contamination during sample transport [33] | Ensures sample integrity from clinical draw site to testing laboratory |
| DNA Extraction Kits | Isulates and purifies cell-free DNA from plasma component of blood [33] | Provides high-quality, fragment-size selected cfDNA for downstream analysis |
| Bisulfite Conversion Reagents | Chemically modifies unmethylated cytosine to uracil while leaving methylated cytosine unchanged [29] | Enables detection of cancer-specific methylation patterns in ctDNA |
| PCR/PCR-Free Library Prep Kits | Prepares cfDNA samples for next-generation sequencing (NGS) [29] | Creates sequencing libraries from limited input cfDNA |
| NGS Panels (Custom) | Targets specific genomic regions for deep sequencing [29] | Interrogates CRC-associated methylation sites and somatic mutations |
| Bioinformatic Analysis Pipeline | Analyzes NGS data to distinguish cancer signals from noise [29] [32] | Shield V2 algorithm classifies samples based on multidimensional signature |
Guideline Inclusion and Regulatory Status
The Shield test has achieved significant milestones in its translation from a research assay to a clinically implemented tool, marked by key endorsements and regulatory decisions.
- NCCN Guideline Inclusion (June 2025): The National Comprehensive Cancer Network (NCCN) updated its Colorectal Cancer Screening Guidelines to include the Shield blood test, recommending a screening interval of every three years for average-risk adults aged 45 and older [33] [34]. This inclusion is notable as it represents the first national guideline recommendation for a blood-based CRC screening test and was based on the evidence from the ECLIPSE study [33].
- FDA Approval (July 2024): The U.S. Food and Drug Administration (FDA) granted approval to Shield as the first blood test for primary screening of colorectal cancer in average-risk adults [29] [35]. This approval also clears the path for Medicare reimbursement, a critical factor for widespread adoption [31].
- Broader Pipeline: The core ctDNA detection technology behind Shield is being leveraged for a multi-cancer detection (MCD) test, which has received Breakthrough Device Designation from the FDA and is included in the National Cancer Institute's Vanguard study [29] [35].
Performance Comparison of Cancer Testing Platforms
The table below summarizes the key performance metrics of the Galleri test from the PATHFINDER 2 study alongside other cancer testing technologies for a comparative perspective.
Table 1: Performance Metrics of Cancer Testing Platforms
| Test / Technology | Primary Function | Sensitivity | Specificity | Positive Predictive Value (PPV) | Key Performance Notes |
|---|---|---|---|---|---|
| Galleri MCED Test [36] [8] | Multi-cancer early detection via cfDNA methylation | 73.7% (for 12 high-mortality cancers); 40.4% (all cancers) | 99.6% | 61.6% | "Episode sensitivity" measured over 12 months in an interventional study. |
| Foundation One (F1) [37] | Genomic profiling of solid tumors for treatment guidance | Information Not Available | Information Not Available | Information Not Available | Focuses on identifying actionable genomic targets; performance characterized by turnaround time and actionable target rates. |
| Paradigm Cancer Diagnostic (PCDx) [37] | Genomic profiling with deep sequencing and mRNA expression | Information Not Available | Information Not Available | Information Not Available | Compared to F1, demonstrated a statistically significant higher rate of clinically actionable targets and faster turnaround time. |
| AI Software for Lung Nodule Detection (S1) [38] | Automated detection/quantification of pulmonary nodules on LDCT | Information Not Available | Information Not Available | Information Not Available | Performance assessed via agreement with final radiologist read; moderate agreement (75%) in Lung-RADS categorization. |
| AI Software for Lung Nodule Detection (S2) [38] | Automated detection/quantification of pulmonary nodules on LDCT | Information Not Available | Information Not Available | Information Not Available | Lower agreement (55%) with final read in Lung-RADS categorization compared to S1. |
Table 2: Clinical Impact of the Galleri Test in the PATHFINDER 2 Study
| Impact Metric | Result | Clinical Significance |
|---|---|---|
| Increase in Cancer Detection [8] [39] | More than seven-fold increase when added to USPSTF A and B screenings | Dramatically enhances the yield of finding cancers in a screening population. |
| Stage at Detection [8] | 53.5% of Galleri-detected cancers were Stage I or II | Facilitates earlier detection, when cancer is more likely to be treatable. |
| Cancers Without Standard Screening [8] | ~75% of Galleri-detected cancers lack recommended screening tests | Addresses a major unmet need in cancer screening. |
| Cancer Signal Origin (CSO) Accuracy [36] [8] | 92% - 93.4% | Enables efficient diagnostic workups, with a median time to diagnostic resolution of 46 days. |
Experimental Protocols and Methodologies
The PATHFINDER 2 Study Protocol
The PATHFINDER 2 study was a prospective, multi-center, interventional study designed as the registrational trial for the Galleri test [8] [40].
- Objective: To evaluate the safety and performance of the Galleri MCED test when used alongside standard-of-care cancer screenings in an intended-use population [8].
- Participant Cohort: The study enrolled 35,878 participants across the United States and Canada. Eligibility required participants to be aged 50 years or older, with no clinical suspicion of cancer and no history of cancer or cancer therapy within the past three years [8] [39]. The pre-specified analysis was performed on the first 25,578 participants with at least 12 months of follow-up [8].
- Intervention: All participants underwent a blood draw for the Galleri test. The test was performed at a central CLIA-certified laboratory [36]. Participants who received a "Cancer Signal Detected" result underwent further diagnostic testing based on the predicted Cancer Signal Origin (CSO) to confirm the presence of cancer [8].
- Key Endpoints:
- Performance: Positive Predictive Value (PPV), specificity, sensitivity (measured as "episode sensitivity" over 12 months), and CSO prediction accuracy [8].
- Safety: The number and type of diagnostic procedures performed, including the rate of invasive procedures, were tracked in a safety cohort of 25,114 participants [8].
Galleri Test Methodology: Methylation-Based Signal Detection
The Galleri test's experimental protocol is based on targeted methylation analysis of cell-free DNA (cfDNA) [36] [41].
- Sample Processing: A single blood draw is collected from the patient. Plasma is separated, and cell-free DNA is extracted [41].
- DNA Sequencing and Methylation Profiling: The extracted cfDNA undergoes next-generation sequencing. The test focuses on analyzing the methylation pattern at hundreds of thousands of specific sites across the genome [36] [41].
- Signal Analysis and Machine Learning: The sequenced methylation data is processed using a machine learning classifier. This classifier was trained on the largest known methylation database to distinguish between the methylation patterns of non-cancerous cfDNA and cfDNA shed by cancer cells [41].
- Result Interpretation:
- No Cancer Signal Detected: The classifier did not identify a pattern consistent with cancer in the cfDNA.
- Cancer Signal Detected & Origin Prediction: If a cancer signal is identified, the classifier then compares the sample's methylation pattern to a reference set of known cancer types to predict the tissue of origin or Cancer Signal Origin (CSO) with high accuracy [36] [41].
Signaling Pathways and Workflows
MCED Testing Workflow from Blood Draw to Diagnosis
The following diagram illustrates the end-to-end process of the Galleri test, from the initial blood draw to the final clinical action.
The Scientist's Toolkit: Research Reagent Solutions
Table 3: Essential Research Materials for MCED Test Development
| Reagent / Material | Function in Research & Development |
|---|---|
| Cell-Free DNA (cfDNA) Extraction Kits | Purify and isolate fragmented circulating DNA from blood plasma samples for downstream molecular analysis [41]. |
| Bisulfite Conversion Reagents | Chemically treat extracted DNA to convert unmethylated cytosine residues to uracil, allowing for the specific sequencing and identification of methylated cytosines [36]. |
| Next-Generation Sequencing (NGS) Library Prep Panels | Create sequencing libraries that are targeted to enrich for hundreds of thousands of genomic regions known to be informative for methylation-based cancer detection [36] [41]. |
| Methylation Reference Standards | Provide controlled samples with known methylation patterns to validate assay performance, calibrate equipment, and ensure analytical accuracy [36]. |
| Bioinformatics Pipelines & Classifiers | Software algorithms based on machine learning to analyze complex methylation sequencing data, distinguish cancer from non-cancer signals, and predict the tissue of origin [36] [41]. |
Within modern diagnostic pathology, the quantitative assessment of diagnostic test performance is fundamental for advancing clinical practice and research. This guide provides a detailed, data-driven comparison of two pivotal tissue-based diagnostic technologies: immunohistochemistry (IHC) for fungal infections and artificial intelligence (AI)-powered systems for cytopathology. The evaluation of diagnostic accuracy—primarily through metrics of sensitivity and specificity—provides a critical framework for comparing these technologies against traditional methods and understanding their respective roles in a complete diagnostic workflow. For researchers and drug development professionals, this comparison illuminates the operational characteristics, evidence base, and potential integration pathways of these tools, which are essential for directing future research investments and clinical adoption strategies.
Immunohistochemistry for Fungal Infections: Performance and Protocols
Performance Comparison of Fungal IHC Antibodies
Immunohistochemistry offers a significant advantage over traditional histochemical stains by providing specific identification of fungal pathogens through antibody-antigen recognition. The performance of a panel of commercially available IHC antibodies was systematically evaluated in formalin-fixed, paraffin-embedded (FFPE) tissue sections from cases with fungal infections confirmed by culture or sequencing [42].
Table 1: Diagnostic Performance of IHC Antibodies for Filamentous Fungi
| IHC Antibody Target | Sensitivity (%) | Specificity (%) | Key Cross-Reactivity Findings |
|---|---|---|---|
| Anti-Aspergillus | 100 | 95 | Focal positivity in 1 of 4 Candida species infections |
| Anti-Rhizopus | 71 | 100 | Positive in 1 of 3 Mucor species infections |
| Anti-Candida | 100 | 0 | Showed cross-reactivity in all other fungal cases |
The data reveal a variable performance profile. The anti-Aspergillus antibody demonstrated an optimal combination of high sensitivity (100%) and high specificity (95%), effectively distinguishing Aspergillus from other hyaline molds such as Fusarium and Scedosporium [42]. In contrast, while the anti-Rhizopus antibody was highly specific (100%), its sensitivity was only moderate (71%), indicating a potential for false negatives. The anti-Candida antibody's profile of 100% sensitivity with 0% specificity limits its diagnostic utility as a standalone test and underscores the necessity of using IHC within a panel approach [42].
Experimental Protocol for Fungal IHC
The following methodology details the experimental procedure used to generate the performance data summarized in Table 1 [42].
- Sample Preparation: The study utilized 24 formalin-fixed, paraffin-embedded (FFPE) tissue blocks from confirmed cases of fungal infection, including four polyfungal infections. Sections were cut from these blocks according to standard histological protocols.
- IHC Staining: Commercially available anti-Aspergillus, anti-Rhizopus, and anti-Candida antibodies were used. IHC was performed on the FFPE tissue sections following the manufacturers' specified protocols for each antibody, which typically involve deparaffinization, antigen retrieval, application of primary antibody, and detection with a chromogenic system.
- Reference Standard: The diagnostic accuracy of each IHC stain was assessed against a gold standard diagnosis established by fungal culture or molecular sequencing.
- Interpretation and Analysis: Stained slides were examined microscopically for positive staining of fungal elements. Sensitivity and specificity were calculated based on the congruence between IHC results and the reference standard diagnosis.
Logical Workflow for Diagnosing Fungal Infections
The following diagram illustrates the diagnostic decision pathway incorporating IHC, based on the performance characteristics of the antibody panel.
AI-Powered Cytopathology for Cancer Screening: Performance and Protocols
Performance of AI in Cervical Cancer Screening
Artificial intelligence systems are transforming cytopathology by automating the analysis of whole-slide images (WSIs). One such system, the Artificial Intelligence Cervical Cancer Screening (AICCS) system, was developed and validated using multi-center datasets involving 16,056 participants [43].
Table 2: Performance of the AICCS System in Cervical Cytology Grading
| Validation Dataset | Sensitivity | Specificity | Accuracy | AUC |
|---|---|---|---|---|
| Prospective Validation | 0.946 | 0.890 | 0.892 | 0.947 |
| Randomized Observational Trial (AI-Assisted Pathologist) | Significantly higher than pathologist alone (+13.3%) | Significantly higher than pathologist alone | Significantly higher than pathologist alone | Significantly higher than pathologist alone |
The AICCS system demonstrated consistently high accuracy in predicting cytology grades across different datasets [43]. Crucially, in a randomized observational trial, the performance of cytopathologists assisted by the AICCS system was significantly superior to that of cytopathologists working alone, with a notable 13.3% enhancement in sensitivity. This demonstrates AI's potential not to replace, but to augment human expertise, leading to fewer false negatives [43].
Experimental Protocol for AI-Based Cytopathology
The development and validation of the AICCS system followed a rigorous, multi-stage process [43].
- Dataset Curation: A total of 16,056 eligible participants were recruited from three institutions. The dataset was divided into a training set (9,316 participants), an internal validation set (2,152 participants), two external validation sets (600 participants each), a prospective dataset (2,780 participants), and a dataset for a randomized observational trial (608 participants).
- AI Model Architecture: The AICCS system is a hybrid model combining two functional components:
- Patch-Level Cell Detection Model: Based on the RetinaNet (Retina-ResNet18) deep learning algorithm, this model scans the whole-slide image in small patches to identify and detect potentially abnormal cells.
- WSI-Level Classification Model: A random forest classifier aggregates all detections from the patch-level model to provide a final slide-level classification (e.g., negative, ASC-US, LSIL, HSIL).
- System Validation: The system's performance was evaluated on the internal, external, and prospective validation sets. Furthermore, a randomized observational trial was conducted to compare the diagnostic performance of cytopathologists with and without the assistance of the AICCS system.
Workflow of an AI-Powered Cytopathology System
The operation of a system like AICCS involves a sequential, automated process from slide digitization to diagnostic assistance, as outlined below.
The Scientist's Toolkit: Key Research Reagents and Materials
Table 3: Essential Reagents and Materials for Tissue-Based Diagnostic Research
| Item | Specific Example | Research Function |
|---|---|---|
| Commercial IHC Antibodies | Anti-Aspergillus, Anti-Rhizopus, Anti-Candida [42] | Specific detection and identification of fungal pathogens in FFPE tissues. |
| Nucleic Acid Extraction Kit | QIAamp DNA FFPE Tissue Kit [44] | Extraction of high-quality DNA from challenging FFPE samples for PCR-based confirmation. |
| Histochemical Stains | Grocott's Methenamine Silver (GMS), Periodic Acid-Schiff (PAS) [44] | Broad, non-specific visualization of fungal elements in tissue sections. |
| Whole-Slide Imaging Scanner | (e.g., OptraScan, models using Panoptiq software) [45] | Digitization of glass slides for AI analysis and digital pathology workflows. |
| Deep Learning Framework | RetinaNet, Faster R-CNN, Random Forest [43] | Building and training AI models for object detection (cells) and image classification. |
| Validated Image Datasets | Annotated WSIs of cervical cytology [43] | Training, validation, and benchmarking of AI algorithms for diagnostic applications. |
Cross-Technology Comparative Analysis
The preceding sections detailed two distinct approaches to enhancing tissue-based diagnostics: one through biological probes (IHC antibodies) and the other through computational algorithms (AI). The following analysis synthesizes their comparative attributes.
Table 4: Comparative Analysis: IHC for Fungi vs. AI for Cytopathology
| Feature | IHC for Fungal Infections | AI for Cytopathology |
|---|---|---|
| Primary Role | Pathogen identification and differentiation | Triage, classification, and augmentation of human diagnosis |
| Key Performance | Variable by antibody (e.g., Anti-Aspergillus: 100% Sens, 95% Spec) [42] | Consistently high (e.g., AICCS: 94.6% Sens, 94.3% Spec) [43] [46] |
| Technology Basis | Antibody-antigen molecular recognition | Deep learning and machine learning image analysis |
| Integration with Workflow | Replaces or supplements special stains in pathology lab | Integrates with digital pathology; assists pathologist's review |
| Key Advantage | Provides species-level or genus-level specificity where antibodies exist | Objectivity, high throughput, reduction in inter-observer variability [45] |
| Main Limitation | Limited by antibody availability, cross-reactivity, and sensitivity [42] [47] | High initial cost, need for large curated datasets, "black box" problem |
This comparison guide underscores a central thesis in modern diagnostic research: technological augmentation, whether through specific molecular probes or sophisticated AI, consistently outperforms traditional, subjective methods. IHC provides a targeted solution for the specific diagnostic challenge of fungal identification, with performance heavily dependent on the characteristics of individual antibody reagents. In contrast, AI-powered cytopathology offers a platform technology that augments human expertise across a broad classification task, demonstrably improving diagnostic sensitivity and specificity. For researchers and drug developers, these technologies represent complementary frontiers of progress. The choice between—or combination of—these tools depends on the specific clinical question, with IHC excelling in precise pathogen identification and AI systems enhancing accuracy and efficiency in high-volume screening and complex pattern recognition tasks. The future of tissue-based diagnostics lies in the continued refinement and intelligent integration of both biological and computational tools.
Fluorescence in situ hybridization (FISH) remains the gold-standard clinical assay for detecting genetic abnormalities in multiple myeloma (MM), a plasma cell neoplasm representing approximately 10% of all blood-related cancers [48]. These acquired cytogenetic abnormalities within the plasma cell clone serve as crucial biomarkers for disease prognosis and response to therapy [48]. The clinical significance of these biomarkers has led to their incorporation into major risk stratification guidelines, including those from the International Myeloma Working Group (IMWG), National Comprehensive Cancer Network (NCCN), and Mayo Stratification for Myeloma and Risk-Adapted Therapy (mSMART) [48]. Accurate detection of these abnormalities is therefore essential for appropriate risk-adapted treatment strategies in multiple myeloma.
Nearly all MM cases are characterized by either recurrent immunoglobulin heavy chain (IGH) rearrangements (∼40% of cases) or hyperdiploidy defined by gains of odd-numbered chromosomes (∼50% of cases) [48]. The five generally mutually exclusive IGH translocations include t(4;14)(p16;q32), t(14;16)(q32;q23), t(14;20)(q32;q12), t(11;14)(q13;q32), and t(6;14)(p21.1;q32) [48]. Additionally, deletion and/or mutation of TP53 is recognized as a high-risk cytogenetic entity across all major guidelines, while t(4;14), t(14;16), and t(14;20) in combination with gains or amplifications of 1q21 or deletions of 1p32 are also classified as high-risk [48]. This review provides a comprehensive comparison of FISH methodologies and their performance against emerging technologies in the context of multiple myeloma risk stratification.
Experimental Protocols and Methodologies
Standard FISH Testing Workflow with Plasma Cell Enrichment
The accurate detection of cytogenetic abnormalities in multiple myeloma requires specialized methodologies to overcome the challenge of low plasma cell percentages in bone marrow aspirates. The basic workflow involves sample preparation, plasma cell enrichment, FISH probe hybridization, and signal analysis [49] [50].
The modified cytoplasmic immunoglobulin FISH (cIg-FISH) protocol utilizes fixed cell pellets to achieve well-separated and easily identifiable plasma cells [49]. This technique involves using immunostaining and subsequent FISH, which can be incorporated into routine cytogenetic laboratory workflow [49]. The process begins with bone marrow aspiration and sample fixation. Plasma cells are then identified using cytoplasmic immunoglobulin light chain labeling, which allows for unambiguous identification before FISH probe application [49].
The Fluorescence-Activated Cell Sorting FISH (FACS-FISH) protocol represents a more advanced enrichment technique [50]. This method involves labeling bone marrow samples with fluorescent antibodies against plasma cell surface markers (typically CD138), followed by cell sorting using a fluorescence-activated cell sorter [50]. The sorted plasma cells are then subjected to FISH analysis, ensuring that genetic abnormalities are assessed specifically in the malignant plasma cell population rather than being diluted by normal bone marrow cells [50].
The FICTION (Fluorescence Immunophenotyping and Interphase Cytogenetics as a Tool for the Investigation of Neoplasms) technique combines immunophenotyping and FISH, enabling simultaneous evaluation of immunophenotype and hybridization signals under a fluorescence microscope [50]. This method allows for correlating genetic abnormalities with cell surface marker expression without requiring physical separation of cell populations [50].
Emerging Methodologies: SWIFT-seq for Circulating Tumor Cells
SWIFT-seq represents a novel blood-based approach that utilizes single-cell sequencing to profile circulating tumor cells (CTCs) in the blood [51]. This methodology begins with blood sample collection, eliminating the need for invasive bone marrow biopsies [51]. Plasma is separated from blood cells, and circulating tumor cells are isolated and enriched using marker-independent approaches based on the tumor's molecular barcode rather than relying solely on cell surface markers [51]. The isolated cells then undergo single-cell RNA sequencing, allowing for comprehensive genomic profiling, assessment of tumor growth rates, and identification of prognostically significant gene signatures from a single blood sample [51].
Figure 1: Experimental Workflow Comparison for Multiple Myeloma Genetic Testing
Performance Comparison of Detection Methodologies
Detection Sensitivity Across Methodologies
The sensitivity of cytogenetic abnormality detection in multiple myeloma varies significantly depending on the methodology employed, particularly the plasma cell enrichment technique used prior to FISH analysis.
Table 1: Detection Sensitivity of Cytogenetic Abnormalities by Methodology
| Detection Methodology | Overall Abnormality Detection Rate | del(17p) Detection Rate | IGH Translocations Detection Rate | 1q21 Gains Detection Rate |
|---|---|---|---|---|
| Direct FISH (n=137) | 38.0% | 5.8% | 17.7% | 17.7% |
| FICTION (n=224) | 56.3% | 10.7% | 11.2% | 23.4% |
| FACS-FISH (n=132) | 95.5% | 34.9% | 36.4% | 46.2% |
| SWIFT-seq (n=101) | 90-95%* | N/A | N/A | N/A |
*SWIFT-seq captured CTCs in 90% of patients with MGUS, SMM, and MM, and 95% of patients with SMM and 94% of newly diagnosed MM [51].
Recent research demonstrates that FACS-FISH significantly outperforms both direct FISH and FICTION across all categories of cytogenetic abnormalities [50]. The overall detection rate of cytogenetic abnormalities was 95.5% with FACS-FISH compared to 56.3% with FICTION and only 38.0% with direct FISH (p < 0.001) [50]. This pattern of superior detection extends to specific high-risk abnormalities: for deletion 17p, FACS-FISH detected abnormalities in 34.9% of cases compared to 10.7% with FICTION and 5.8% with direct FISH (p < 0.0001) [50]. Similarly, for IGH translocations, FACS-FISH detected 36.4% of cases compared to 17.7% with direct FISH and 11.2% with FICTION (p < 0.0001) [50].
The percentage of plasma cells in bone marrow aspirates significantly influences FISH positivity in direct FISH and FICTION methods, with odds ratios of 1.04 and 1.02 respectively for each 1% increase in plasma cells [50]. In contrast, FACS-FISH results show no significant association with plasma cell percentage (OR 1.09; 95% CI: 1.00-1.32, P = 0.186), indicating its robustness across samples with varying tumor cellularity [50].
Analytical Performance of FISH Versus Emerging Platforms
Table 2: Platform Comparison for Genetic Analysis in Multiple Myeloma
| Platform | Sample Type | Key Genetic Targets | Advantages | Limitations |
|---|---|---|---|---|
| FISH | Bone marrow | IGH translocations, del(17p), 1q21 gain, 1p32 deletion | Gold standard, well-established risk stratification, guideline-endorsed | Invasive sample, variable enrichment protocols, limited genomic scope |
| FACS-FISH | Bone marrow | IGH translocations, del(17p), 1q21 gain, 1p32 deletion | High sensitivity (95.5%), independent of plasma cell percentage | Requires specialized equipment, more complex workflow |
| SWIFT-seq | Blood | Comprehensive genomic profile, proliferative capacity, gene signatures | Non-invasive, provides multiple layers of information from single test | Emerging technology, not yet standard in guidelines |
| NGS | Bone marrow | Mutational profile, subclonal architecture | Comprehensive genomic assessment, identifies novel mutations | Higher cost, not optimized for structural variants |
The performance of FISH is highly dependent on the enrichment method, with FACS-FISH demonstrating superior sensitivity compared to other approaches [50]. The median percentage of cytogenetically abnormal cells detected by FACS-FISH was 67.8%, significantly higher than the 30.0% detected by FICTION (P < 0.001) [50]. The percentage of cases where abnormal cells were detected in a low fraction of less than 10% was highest with FACS-FISH (18.1%) compared to FICTION (10.0%) and direct FISH (9.8%) [50].
SWIFT-seq represents a promising alternative with demonstrated capability to capture circulating tumor cells in 90% of patients with monoclonal gammopathy of undetermined significance (MGUS), smoldering multiple myeloma (SMM), and MM [51]. The test successfully identifies CTCs in 95% of patients with SMM and 94% of patients with newly diagnosed MM—populations that stand to benefit most from improved risk stratification and genomic surveillance [51].
Standard FISH Panel Design and Reporting Guidelines
Consensus Recommendations for FISH Testing
The Cancer Genomics Consortium Plasma Cell Neoplasm Working Group has established consensus recommendations for optimized FISH panel selection and standardized reporting aligned with the 2025 IMS/IMWG Updated Risk Stratification [48]. These guidelines propose two standard FISH panels: an initial diagnostic panel and a relapsed MM panel [48].
For all newly diagnosed multiple myeloma (NDMM), minimal evaluation should include assessment for primary IGH rearrangements: t(4;14), t(14;16), t(14;20), and t(11;14) if an IGH rearrangement has been detected in the initial screen [48]. Both diagnostic and relapsed MM panels should include evaluation for 17p deletion (including the TP53 gene), 1p deletion, and 1q gain or amplification [48].
The t(4;14) translocation is present in approximately 15% of NDMM and results in overexpression of FGFR3 and/or NSD2 [48]. The t(14;16) occurs in 3-5% of NDMM and leads to increased expression of MAF, while t(14;20) is present in 1-2% of NDMM and results in MAFB overexpression [48]. The t(11;14), which involves IGH and CCND1 resulting in increased CCND1 expression, is present in 15-20% of NDMM and 50% of primary plasma cell leukemia cases [48].
Detection of TP53 deletion (present in 7-10% of NDMM and up to 80% of relapsed/refractory MM) is typically performed using FISH with enumeration and locus-specific probes targeting the centromere of chromosome 17 and 17p (TP53) [48]. Chromosome 1 abnormalities include 1p deletion (present in 8-12% of NDMM) with the most significant region at 1p32.3, and 1q gain or amplification (present in 30-45% of NDMM and 55-70% at relapse) [48].
The Scientist's Toolkit: Essential Research Reagents
Table 3: Essential Research Reagents for Multiple Myeloma FISH Analysis
| Reagent/Category | Specific Examples | Research Function |
|---|---|---|
| FISH Probes | IGH Break-Apart Probe, TP53/CEP17 Probe, 1p32/1q21 Probes | Detection of specific structural variants and copy number alterations |
| Plasma Cell Enrichment Reagents | CD138 Antibodies, Cytoplasmic Immunoglobulin Labels, Cell Sorting Reagents | Isolation and identification of malignant plasma cells for analysis |
| Cell Preparation Reagents | Fixatives, Permeabilization Buffers, Slide Preparation Solutions | Sample preservation and preparation for optimal hybridization |
| Detection Systems | Fluorescent Conjugates, Counterstains, Antifade Mounting Media | Signal visualization and preservation for accurate interpretation |
Cytogenetic FISH analysis maintains its position as the gold standard for risk stratification in multiple myeloma, with recent advancements in plasma cell enrichment methodologies significantly improving detection sensitivity. FACS-FISH demonstrates superior performance with a 95.5% overall detection rate for cytogenetic abnormalities, substantially outperforming direct FISH (38.0%) and FICTION (56.3%) methodologies [50]. The consistency of FACS-FISH across samples with varying plasma cell percentages makes it particularly valuable for standardized risk assessment.
Emerging technologies like SWIFT-seq offer promising non-invasive alternatives for comprehensive genomic profiling [51]. However, FISH remains the foundation of current risk stratification guidelines due to its well-established prognostic associations and clinical validation [48]. The development of standardized FISH panels and reporting practices, as recommended by the Cancer Genomics Consortium, will further enhance the clinical utility of FISH testing in multiple myeloma [48].
Future directions in multiple myeloma risk stratification will likely involve integrated approaches combining the established strengths of FISH for detecting specific high-risk abnormalities with broader genomic profiling offered by emerging sequencing technologies. This multifaceted approach promises to deliver increasingly personalized risk assessment and treatment strategies for multiple myeloma patients.
Navigating Diagnostic Challenges: False Results, Integration, and Standardization
Addressing False Positives and False Negatives in Real-World Screening
In the pursuit of early cancer detection, the balance between sensitivity (the ability to correctly identify cancer when present) and specificity (the ability to correctly exclude cancer when absent) represents a fundamental challenge in diagnostic medicine. False positives and false negatives in cancer screening carry significant consequences—the former leads to unnecessary invasive procedures, patient anxiety, and increased healthcare costs, while the latter delays critical treatments and worsens prognosis. The traditional paradigm of "one test for one cancer" has demonstrated limitations in both dimensions, particularly as many deadly cancers lack recommended screening modalities altogether [8] [52].
The emergence of novel testing platforms, including multi-cancer early detection (MCED) tests, liquid biopsies, and advanced biomarker panels, promises to reshape the screening landscape. This comparison guide provides an objective analysis of the performance characteristics of these technologies, with particular focus on their false positive and false negative rates in real-world settings. By examining experimental data across multiple platforms, this review aims to equip researchers, scientists, and drug development professionals with a comprehensive understanding of the current state of cancer screening technologies and their evolving performance metrics.
Performance Comparison of Cancer Screening Modalities
The following tables synthesize quantitative performance data across established and emerging cancer screening technologies, highlighting their sensitivity, specificity, and predictive values across different cancer types and stages.
Table 1: Overall Performance Metrics Across Screening Platforms
| Screening Platform | Cancer Types | Sensitivity | Specificity | False Positive Rate | Positive Predictive Value | Key Study |
|---|---|---|---|---|---|---|
| Galleri MCED Test | >50 cancer types | 40.4% (all cancers); 73.7% (for 12 high-mortality cancers) | 99.6% | 0.4% | 61.6% | PATHFINDER 2 [8] |
| Mammography | Breast | ~87% (varies by density) | ~89% | ~11% | Not reported | BCSC [53] [54] |
| Shield Blood Test (V2) | Colorectal | 84% (overall); 62% (Stage I) | 90% | 10% | Not reported | ECLIPSE [30] |
| Natera ECD Test | Colorectal | 95% (CRC); 22.5% (advanced adenomas) | 91.5% | 8.5% | Not reported | PROCEED-CRC [55] |
| Urine Biomarker Panel | Prostate | AUC 0.92 (validation) | High (exact % not specified) | Not reported | Not reported | Yuan et al. [56] |
Table 2: Stage-Stratified Detection Rates for Selected Blood-Based Tests
| Test | Stage I Sensitivity | Stage II Sensitivity | Stage III Sensitivity | Stage IV Sensitivity | Advanced Adenoma Detection |
|---|---|---|---|---|---|
| Galleri MCED | Part of 53.5% early-stage detection | Part of 53.5% early-stage detection | 69.3% detected at stages I-III | 69.3% detected at stages I-III | Not specifically reported [8] |
| Shield Blood Test | 62% | 100% | 96% | 100% | 13% [30] |
| Natera ECD | 92% | Not specified | Not specified | Not specified | 22.5% [55] |
Table 3: Real-World Impact of Screening Results on Patient Behavior
| Screening Result | Return to Routine Screening Rate | Adjusted Absolute Difference vs. True-Negative | Population Most Affected |
|---|---|---|---|
| True-Negative Mammogram | 76.9% | Reference | All groups [54] |
| False-Positive (Additional Imaging) | 75.0% | -1.9% | Minimal variation [53] |
| False-Positive (Biopsy Recommendation) | 67.0% | -10.0% | Asian and Hispanic/Latinx women [53] [54] |
| False-Positive (Short-interval Follow-up) | 61.0% | -15.9% | Asian and Hispanic/Latinx women [53] |
| Two Consecutive False-Positives | 56.0% | Not reported | Not reported [53] |
Experimental Protocols and Methodologies
Multi-Cancer Early Detection (MCED) Test Protocol
The Galleri MCED test employed in the PATHFINDER 2 study utilized a targeted methylation-based platform to analyze cell-free DNA in blood samples. The experimental protocol included:
- Study Design: Prospective, multi-center, interventional study with 35,878 participants aged 50+ with no clinical suspicion of cancer [8].
- Sample Collection: Peripheral blood draws were collected from all participants using standardized phlebotomy procedures and cell-free DNA collection tubes [8].
- Laboratory Analysis: Plasma separation through centrifugation, followed by extraction of cell-free DNA. Bisulfite conversion was performed to preserve methylation patterns while converting unmethylated cytosine residues to uracil [8] [18].
- Sequencing and Analysis: Next-generation sequencing of the bisulfite-converted DNA focused on approximately 100,000 informative methylation regions. Machine learning algorithms analyzed methylation patterns to detect cancer signals and predict tissue of origin [8].
- Follow-up Protocol: Participants with cancer signals detected underwent diagnostic evaluations based on the predicted cancer signal origin, with follow-up continuing for 12 months to confirm cancer status [8].
- Outcome Measures: Primary endpoints included cancer signal detection rate, cancer detection rate, positive predictive value, specificity, and accuracy of cancer signal origin prediction [8].
Single-Cancer Early Detection (SCED) Blood Test Protocol
The Shield blood test for colorectal cancer detection employed the following methodology in the ECLIPSE trial:
- Study Design: Prospective, observational study across 200+ clinical sites enrolling average-risk individuals aged 45-84 scheduled for screening colonoscopy [30].
- Sample Collection: Blood draws performed prior to bowel preparation for colonoscopy, within 60 days of the scheduled procedure [30].
- Laboratory Analysis: Guardant Health's Shield V2 algorithm analyzed cell-free DNA for genomic and epigenomic cancer-associated alterations, including somatic mutations, methylation patterns, and fragmentomic profiles [30].
- Reference Standard: All participants underwent colonoscopy, with histopathological confirmation of suspected cancers, providing the definitive cancer status for sensitivity and specificity calculations [30].
- Statistical Analysis: Sensitivity was calculated as the proportion of confirmed CRC cases with a positive Shield test. Specificity was calculated as the proportion of participants without advanced neoplasia who received a negative Shield test result [30].
Urine Biomarker Panel Development Protocol
The prostate cancer detection study by Yuan et al. utilized a multi-phase approach:
- Discovery Phase: RNA-sequencing analysis of exfoliated cells in urine specimens identified 50 candidate RNA biomarkers with differential expression between prostate cancer and benign conditions [56].
- Biomarker Refinement: Initial qPCR testing in pooled urine samples from 243 participants narrowed candidates to three biomarkers (TTC3, H4C5, EPCAM) with optimal specificity and sensitivity characteristics [56].
- Validation Phase: The three-biomarker panel was validated in an independent cohort of 646 participants using predefined cutoff values established in the development phase [56].
- Analytical Validation: Biomarker expression was confirmed in prostate tissue specimens, and the oncogenic function of TTC3 was assessed through in vitro and in vivo models including knockdown experiments [56].
- Performance Assessment: Diagnostic performance was compared against existing biomarkers including prostate-specific antigen (PSA) and prostate cancer antigen 3 (PCA3) RNA using area under the curve (AUC) analysis [56].
Signaling Pathways and Experimental Workflows
MCED Test Workflow
The following diagram illustrates the end-to-end workflow for multi-cancer early detection testing, from sample collection through clinical decision-making:
MCED Test Workflow: From sample collection to clinical decision
Diagnostic Decision Pathway
The following pathway outlines the clinical decision-making process following a cancer screening test, highlighting points where false positives and false negatives may occur:
Diagnostic Decision Pathway Following Screening Tests
The Scientist's Toolkit: Essential Research Reagents and Materials
Table 4: Key Research Reagents and Materials for Advanced Cancer Detection Studies
| Reagent/Material | Function | Example Application |
|---|---|---|
| Cell-free DNA Blood Collection Tubes | Stabilizes nucleated blood cells to prevent genomic DNA contamination of plasma | Preserves cell-free DNA integrity during transport and storage [8] [18] |
| Bisulfite Conversion Reagents | Converts unmethylated cytosine to uracil while preserving methylated cytosine | Enables methylation pattern analysis in epigenetic studies [8] |
| Methylation-Specific PCR Primers | Amplifies specific methylated or unmethylated DNA sequences | Detection of cancer-specific methylation patterns [8] [55] |
| Next-Generation Sequencing Kits | Library preparation and sequencing of bisulfite-converted DNA | Comprehensive methylation analysis across multiple genomic regions [8] [18] |
| Ultracentrifugation Equipment | Separates extracellular vesicles from other cellular components | Isolation of tumor-derived exosomes and microvesicles [18] |
| qPCR Assay Kits | Quantitative analysis of specific RNA/DNA biomarkers | Validation of candidate biomarkers in development cohorts [56] |
| Machine Learning Algorithms | Pattern recognition in complex multidimensional data | Classification of cancer vs. non-cancer signals in MCED tests [8] [52] |
Discussion: Implications for Research and Clinical Practice
The comparative performance data reveal fundamental trade-offs between different approaches to cancer screening. Traditional mammography screening demonstrates relatively high sensitivity but produces false-positive rates of approximately 10-12%, which subsequently impacts future screening adherence—particularly among racial and ethnic minority groups who experience the largest decreases in return to screening after false positives [53] [54]. After 10 years of annual screening, 50-60% of women will experience at least one false-positive recall, and 7-12% will undergo at least one false-positive biopsy recommendation [54].
The emerging MCED platform presents a different performance profile, with substantially lower false-positive rates (0.4%) but more variable sensitivity across cancer types and stages [8]. This high specificity (99.6%) translates to significantly higher positive predictive value (61.6%) compared to traditional screening modalities, meaning that a positive result is more likely to represent true cancer [8] [57]. When considering system-level implementation, modeling studies suggest that a screening approach using multiple SCED tests would generate 188 times more diagnostic investigations in cancer-free people compared to a single MCED test targeting the same cancer types [52].
For cancers without established screening modalities, novel biomarker approaches show considerable promise. The urine biomarker panel for prostate cancer detection achieved an AUC of 0.92 in validation cohorts, substantially outperforming existing biomarkers like PCA3 RNA (AUC 0.76) [56]. Similarly, blood-based tests for colorectal cancer screening now demonstrate sensitivity exceeding 80% for overall detection, though early-stage detection remains challenging (62% for Stage I) [30]. The detection of precancerous lesions also varies significantly, with advanced adenoma sensitivity ranging from 13% to 22.5% across different platforms [55] [30].
These performance characteristics have profound implications for population-level screening implementation. The efficiency of a screening system—measured by the number needed to screen to detect one cancer—varies dramatically between approaches. Modeling studies indicate that an MCED-based system may have approximately 6-fold higher efficiency (number needed to screen: 334) compared to a system using multiple SCED tests (number needed to screen: 2062) [52]. Furthermore, the cumulative burden of false positives per annual screening round may be 150 times higher for a multiple SCED approach compared to a single MCED test [52].
The evolving landscape of cancer screening technologies presents researchers and clinicians with increasingly sophisticated tools for early detection, each with distinct performance characteristics regarding false positives and false negatives. The traditional paradigm of "one test for one cancer" demonstrates limitations in both dimensions, particularly through cumulative false-positive rates that adversely impact patient adherence to routine screening [53] [54]. Emerging MCED platforms offer substantially improved specificity and the ability to detect cancers that currently lack recommended screening, though sensitivity—particularly for early-stage disease—remains an area for continued optimization [8] [52].
Future research directions should focus on optimizing test performance across diverse populations, developing strategies to mitigate the negative impacts of false-positive results on screening adherence, and refining algorithms to improve early-stage cancer detection. Additionally, the integration of artificial intelligence for rapid, same-day follow-up of abnormal findings may help reduce the anxiety and inconvenience associated with false-positive results [53]. As these technologies continue to evolve, their thoughtful implementation—with careful consideration of their false-positive and false-negative profiles—holds promise for transforming cancer early detection and ultimately reducing cancer-related mortality.
The advent of Multi-Cancer Early Detection (MCED) tests represents a paradigm shift in oncology, moving from single-organ screening to a comprehensive approach that can detect multiple cancers from a single blood draw [58]. These minimally invasive "liquid biopsy" tests analyze circulating biomarkers, such as cell-free DNA (cfDNA), to identify cancer signals in asymptomatic individuals [59]. The "diagnostic cascade" refers to the critical sequence of steps following a positive MCED result: confirmation of the cancer signal, identification of the tumor origin, and guiding appropriate diagnostic workups to achieve tissue confirmation and staging. The clinical value of MCED tests hinges not only on their detection sensitivity but also on their ability to accurately predict the cancer signal origin (CSO), which directly impacts the efficiency and success of subsequent diagnostic pathways [8].
This guide objectively compares the performance of leading MCED technologies, focusing on their role within the diagnostic cascade. We examine key performance metrics including sensitivity, specificity, positive predictive value (PPV), and CSO prediction accuracy, with particular emphasis on how these factors influence the diagnostic workflow after an initial positive signal is detected.
Performance Comparison of MCED Platforms
The clinical utility of an MCED test is determined by a combination of factors, with high sensitivity for early-stage disease and a very low false-positive rate being paramount for population screening. Equally critical is the test's ability to accurately predict the tissue of origin, which streamlines the subsequent diagnostic journey. The table below summarizes key performance metrics from recent clinical studies of prominent MCED tests.
Table 1: Performance Metrics of MCED and Liquid Biopsy Platforms from Recent Studies
| Test Name / Platform | Study / Context | Sensitivity (Overall / by Stage) | Specificity | Positive Predictive Value (PPV) | Cancer Signal Origin (CSO) Accuracy |
|---|---|---|---|---|---|
| Galleri MCED Test | PATHFINDER 2 (Interventional, n=23,161) [8] | 40.4% (All cancers); 73.7% (for 12 high-mortality cancers) | 99.6% | 61.6% | 92% |
| Carcimun Test | Analytical Performance (n=172) [19] | 90.6% | 98.2% | Not reported | Not applicable (Pan-cancer signal) |
| Northstar Select | Therapy Selection for Advanced Cancers (n=182) [9] | Detected 51% more SNV/Indels and 109% more CNVs vs. comparators | >99.9% | Not primary endpoint | Not primary endpoint |
The data reveals distinct performance profiles. The Galleri test demonstrates a central challenge in MCED development: achieving high sensitivity for lethal cancers while maintaining an excellent specificity of 99.6% in a large-scale screening population [8]. Its PPV of 61.6% means that most positive signals indeed indicate cancer, which is crucial for minimizing unnecessary invasive procedures. The Carcimun test, which detects conformational changes in plasma proteins, reported high sensitivity and specificity in a smaller cohort, though its performance in predicting the tissue of origin was not detailed [19]. Northstar Select, while designed for therapy selection in advanced cancer rather than screening, showcases the technological evolution towards ultra-sensitive detection of actionable genomic alterations, which is relevant for the confirmation phase of the diagnostic cascade [9].
The MCED Diagnostic Cascade Workflow
A positive MCED test initiates a multi-step diagnostic process to confirm and locate the cancer. This cascade must be efficient to minimize patient anxiety and avoid delays in diagnosis. The following diagram illustrates the pathway from the initial blood draw to the final diagnosis.
Figure 1: The MCED Diagnostic Cascade. This workflow outlines the steps following a positive MCED test, highlighting the critical role of Cancer Signal Origin prediction.
The efficiency of this cascade heavily depends on the MCED test's accuracy in predicting the CSO. As demonstrated in the PATHFINDER 2 study, a high CSO prediction accuracy (92% for Galleri) enables clinicians to target diagnostic evaluations efficiently, reducing the time to resolution and avoiding unnecessary broad-spectrum imaging [8]. In this study, the median time to diagnostic resolution was 46 days, and only 0.6% of all participants underwent an invasive procedure, underscoring how a accurate CSO can streamline the patient journey from a positive blood test to a confirmed diagnosis [8].
Experimental Protocols and Methodologies
Targeted Methylation Sequencing (e.g., Galleri Test)
Objective: To detect and localize cancer through genome-wide methylation patterns of cfDNA [58] [8].
Workflow:
- Plasma Separation: Centrifuge blood collection tubes to isolate plasma.
- cfDNA Extraction: Purify cell-free DNA from plasma.
- Bisulfite Conversion & Library Prep: Treat cfDNA with bisulfite to convert unmethylated cytosines to uracils, then prepare sequencing libraries. This step is crucial for resolving methylation signatures.
- Targeted Sequencing: Perform next-generation sequencing (NGS) on a panel targeting ~100,000 informative methylation regions.
- Bioinformatic Analysis: Use machine learning models to:
- Classify Signal: Distinguish cancer-derived cfDNA from non-cancer cfDNA based on methylation patterns.
- Predict CSO: Identify the tissue of origin by comparing the sample's methylation profile to a reference database of known cancer types.
Figure 2: Targeted Methylation Sequencing Workflow. This method relies on bisulfite conversion and ML to identify cancer signals and their origin.
Protein Conformation Analysis (e.g., Carcimun Test)
Objective: To detect cancer by measuring conformational changes in plasma proteins induced by malignancy [19].
Workflow:
- Sample Preparation: Dilute 26 µL of blood plasma in 0.9% NaCl solution and incubate at 37°C.
- Acidification: Add 80 µL of 0.4% acetic acid solution to induce protein aggregation.
- Spectrophotometry: Measure the optical extinction (absorbance) at 340 nm before and after acidification using a clinical chemistry analyzer (e.g., Indiko, Thermo Fisher Scientific).
- Interpretation: Calculate the change in extinction. A value above a pre-defined cutoff (e.g., 120) indicates a positive cancer signal. The test measures a general malignancy signal and does not specify the tissue of origin.
Single-Molecule NGS for Comprehensive Genomic Profiling (e.g., Northstar Select)
Objective: To achieve ultra-sensitive detection of genomic alterations in ctDNA for therapy selection in advanced cancer patients [9].
Workflow:
- Plasma and Buffy Coat Isolation: Collect plasma (containing ctDNA) and buffy coat (for white blood cell DNA) via centrifugation.
- DNA Extraction: Extract cfDNA from plasma and gDNA from buffy coat.
- Library Preparation: Use proprietary Quantitative Counting Templates (QCT) to prepare NGS libraries for both DNA sources, enabling absolute molecule counting.
- Hybrid Capture & Sequencing: Use a panel covering 84 actionable genes to capture targets, followed by NGS.
- Bioinformatic Analysis:
- Compare plasma and buffy coat sequences to filter out germline variants and clonal hematopoiesis.
- Identify somatic alterations (SNVs, Indels, CNVs, fusions) with high sensitivity down to 0.15% variant allele frequency.
Research Reagent Solutions for MCED Development
The development and validation of MCED tests rely on a specialized set of reagents and materials. The following table details key components essential for researchers in this field.
Table 2: Key Research Reagents and Materials for MCED Assay Development
| Reagent / Material | Function in MCED Workflow | Application Examples |
|---|---|---|
| Cell-Free DNA Blood Collection Tubes | Stabilizes nucleated blood cells to prevent genomic DNA contamination of plasma, preserving the integrity of cfDNA. | Critical for pre-analytical sample integrity in all liquid biopsy workflows [9]. |
| Bisulfite Conversion Kits | Chemically converts unmethylated cytosine to uracil, allowing for the differential sequencing of methylated regions. | Essential for methylation-based MCED tests like Galleri [58] [8]. |
| Methylation-Aware NGS Library Prep Kits | Prepares bisulfite-converted DNA for next-generation sequencing, often with unique molecular identifiers (UMIs). | Used in targeted methylation sequencing to build libraries for detecting cancer signals [58]. |
| Targeted Methylation Panels | A predefined set of probes capturing hyper/hypomethylated genomic regions informative for multiple cancer types. | Forms the core of the sequencing assay for tests like Galleri [58] [8]. |
| Bioinformatic Classification Algorithms | Machine learning models trained to distinguish cancer from non-cancer and predict tissue of origin based on sequencing data. | The software engine that translates raw data into a clinical result; critical for all MCED tests [58] [8]. |
| Clinical Chemistry Analyzer | Automates photometric measurements of sample absorbance/extinction for protein-based assays. | Used in the Carcimun test to measure optical extinction after acidification [19]. |
The integration of MCED tests into the cancer screening landscape heralds a new era where the diagnostic cascade begins not with symptoms, but with a molecular signal in the blood. The comparative data shows that while all platforms aim to detect cancer early, their technological approaches yield different performance profiles, directly impacting the subsequent diagnostic pathway. Tests with high CSO prediction accuracy, such as Galleri, provide a clear starting point for diagnostic workups, potentially reducing time to diagnosis and the burden of unnecessary procedures [8]. Meanwhile, technologies like Northstar Select demonstrate the powerful application of ultra-sensitive sequencing for confirming and characterizing cancer, albeit in a different clinical context [9].
For researchers and clinicians, understanding the nuances of these platforms—their underlying protocols, performance metrics, and limitations—is fundamental to appropriately implementing them in clinical practice and guiding patients effectively through the diagnostic cascade following a positive result.
The promise of liquid biopsy, particularly the analysis of circulating tumor DNA (ctDNA), is revolutionizing precision oncology by offering a non-invasive window into tumor genetics. However, two fundamental challenges—tumor heterogeneity and low ctDNA abundance—complicate the reliable detection of these biomarkers, directly impacting the sensitivity and specificity of cancer testing platforms. Tumor heterogeneity, encompassing both genetic and non-genetic differences between and within tumors, can lead to incomplete mutation profiling as a single biopsy or blood sample may not capture the full genomic landscape of the cancer [60] [61]. Meanwhile, the scant amount of ctDNA, especially in early-stage or low-shedding tumors, where it can constitute less than 1% of total cell-free DNA (cfDNA), poses a significant technical barrier for detection systems [62] [63]. This guide objectively compares how modern testing platforms are navigating these hurdles to achieve the high sensitivity and specificity required by researchers and clinicians.
The Core Challenges: A Scientific Deep Dive
Tumor Heterogeneity
Tumor heterogeneity describes the cellular diversity within a tumor ecosystem. This variation is a cornerstone of cancer evolution and therapeutic resistance.
- Sources and Types: Heterogeneity arises from both heritable and non-heritable mechanisms. Heritable heterogeneity stems from genomic instability and clonal evolution, where random mutations during cell divisions create subpopulations of cells with distinct genomic profiles [61]. Non-heritable heterogeneity is driven by phenotypic plasticity, where genetically identical cells exhibit different functional states due to microenvironmental cues or stochastic changes in gene expression [61].
- Impact on Biomarker Detection: The presence of genetically divergent clones means that a mutation present in one region of a tumor, or in a specific subset of cells, may be absent in another. Profiling a single tissue biopsy risks missing these subclonal alterations. While ctDNA, shed from multiple tumor sites, can theoretically provide a more comprehensive picture, its composition reflects the relative abundance of these clones. Low-frequency subclones may release ctDNA at levels below the limit of detection of many assays, leading to false negatives [60] [64].
Low ctDNA Abundance
The minimal amount of ctDNA in the bloodstream is a primary technical obstacle for liquid biopsy.
- Biological Basis: ctDNA is released into the circulation primarily through processes such as apoptosis, necrosis, and active secretion from tumor cells [62] [64]. The concentration of ctDNA is correlated with tumor burden; patients with early-stage or low-shedding tumors have significantly lower levels than those with advanced, metastatic disease [62] [63].
- Concentration and Proportion: In healthy individuals, total cfDNA concentrations typically range from 1-10 ng/mL. In cancer patients, this can increase to 10-1000 ng/mL, but the ctDNA fraction may be only 0.01-10% of the total cfDNA [62]. In early-stage cancers, this fraction is often at the lower end of this range, demanding exceptionally sensitive detection technologies [63].
Comparative Analysis of Testing Platforms
The following table summarizes the performance of major technology platforms in overcoming these challenges, highlighting their methodologies and limitations.
Table 1: Comparison of ctDNA Testing Platforms in Overcoming Key Hurdles
| Technology Platform | Core Methodology | Approach to Tumor Heterogeneity | Sensitivity (LOD for VAF) | Key Advantages | Key Limitations |
|---|---|---|---|---|---|
| Digital PCR (dPCR/ddPCR) | Partitions sample into thousands of nanoreactions for absolute quantification of predefined mutations [62] [63]. | Targeted; requires prior knowledge of mutations. Limited in discovering unknown heterogeneous mutations [63]. | ~0.001%-0.1% VAF [62] [64] | High sensitivity for known targets; cost-effective; rapid turnaround [62]. | Low multiplexing capability; blind to unknown genomic alterations [63]. |
| Targeted Next-Generation Sequencing (NGS) | Deeply sequences a panel of cancer-associated genes using unique molecular identifiers (UMIs) for error correction [63]. | Can profile multiple genes simultaneously, capturing a broader snapshot of heterogeneity. Tumor-informed approaches enhance sensitivity [63]. | ~0.02%-0.1% VAF (with UMI) [63] | Balanced sensitivity and breadth; customizable panels; identifies resistance mutations [63]. | Higher cost and complexity than dPCR; panel size limits full heterogeneity assessment [63]. |
| Whole-Genome Sequencing (WGS) | Sequences the entire genome, analyzing patterns like mutations and copy number variations [63]. | Most comprehensive; can identify unexpected and subclonal alterations across the entire genome [63]. | >1% VAF (standard WGS); lower with deep sequencing at high cost [63] | Unbiased discovery of heterogeneous genomic features. | Very high cost; low sensitivity for low VAF variants; massive data burden [63]. |
| Multi-Cancer Early Detection (MCED) Tests | Often uses NGS to analyze methylation patterns or fragmentomics on cfDNA [5]. | Infers tumor presence and origin from epigenetic patterns, which may be more consistent across heterogeneity [5]. | Varies by platform | "Pan-cancer" capability; does not require prior knowledge of mutation profile [5]. | Can struggle with low tumor shed; specificity challenges from non-malignant conditions[e.g., inflammation] [5]. |
Detailed Experimental Protocols for Key Assays
To ensure reproducibility and critical evaluation, here are the detailed methodologies for two prevalent approaches.
Tumor-Informed Targeted NGS (e.g., CAPP-Seq, TEC-Seq)
This protocol uses a "tumor-informed" approach to maximize sensitivity for minimal residual disease (MRD) detection, directly addressing the challenge of low abundance [63].
- Step 1: Tumor Whole Exome Sequencing (WES). First, DNA is extracted from a patient's tumor tissue (from a biopsy) and matched normal sample (e.g., blood or saliva). Whole exome sequencing is performed on both to identify a set of 16-50 somatic mutations (e.g., single nucleotide variants, small indels) unique to the patient's tumor [63].
- Step 2: Custom Panel Design. A personalized NGS panel is computationally designed to target the patient-specific mutations identified in Step 1. This focuses the sequencing power on highly specific markers, enhancing sensitivity [63].
- Step 3: Plasma Collection and cfDNA Extraction. Peripheral blood is collected from the patient into tubes containing cell-stabilizing agents. Plasma is separated via centrifugation, and cfDNA is extracted using commercial kits. The DNA is quantified [62] [63].
- Step 4: Library Preparation and UMI Ligation. The plasma cfDNA undergoes library preparation for sequencing. A critical step is the ligation of Unique Molecular Identifiers (UMIs)—random oligonucleotide barcodes—to each original DNA fragment before PCR amplification. This allows for bioinformatic correction of PCR and sequencing errors [63].
- Step 5: Hybridization Capture & Sequencing. The library is enriched for the patient-specific targets using hybridization capture with the custom panel, followed by high-depth sequencing (e.g., >100,000x coverage) [63].
- Step 6: Bioinformatic Analysis. Sequencing reads are grouped by their UMI to generate consensus sequences, filtering out errors. The presence or absence of the patient's tumor-derived mutations is then determined, and ctDNA levels are quantified [63].
Droplet Digital PCR (ddPCR) for Target Quantification
ddPCR provides highly sensitive absolute quantification of a specific mutation and is often used for longitudinal monitoring [62] [63].
- Step 1: Assay Design. Fluorescent probe-based assays are designed for a specific mutant allele (e.g., KRAS G12D) and the corresponding wild-type sequence. The probes for mutant and wild-type are labeled with different fluorescent dyes [62].
- Step 2: Sample Partitioning. The PCR reaction mixture, containing the extracted cfDNA, primers, probes, and master mix, is partitioned into approximately 20,000 nanoliter-sized droplets. The partitioning is stochastic, so each droplet contains zero, one, or a few DNA molecules [62].
- Step 3: Endpoint PCR Amplification. The droplets undergo a standard thermocycling PCR protocol. If a target DNA molecule is present in a droplet, it is amplified, generating a fluorescent signal [62].
- Step 4: Droplet Reading and Analysis. The droplets are read sequentially in a droplet flow cytometer. The fluorescence of each droplet is measured in two channels (one for mutant, one for wild-type). Droplets are classified as mutant-positive, wild-type-positive, or negative based on their fluorescence signature [62].
- Step 5: Absolute Quantification. The concentration of the original target molecule in the sample is calculated based on the fraction of positive droplets using Poisson statistics, providing an absolute count without the need for a standard curve [62].
Visualizing Experimental Workflows
The following diagram illustrates the logical workflow and critical decision points for the tumor-informed NGS pathway, a leading approach for handling heterogeneity and abundance challenges.
The Scientist's Toolkit: Essential Research Reagents
Successful ctDNA analysis relies on a suite of specialized reagents and tools. The following table details key components of the research pipeline.
Table 2: Key Research Reagent Solutions for ctDNA Analysis
| Research Tool / Reagent | Function & Application | Key Characteristics |
|---|---|---|
| Cell-Free DNA Blood Collection Tubes | Stabilizes nucleated blood cells to prevent genomic DNA contamination and preserve cfDNA profile during transport and storage [63]. | Contains cell-stabilizing preservatives; enables room-temperature shipping; critical for accurate pre-analytics. |
| Unique Molecular Identifiers (UMIs) | Short random nucleotide sequences ligated to each DNA fragment prior to PCR amplification in NGS workflows [63]. | Enables bioinformatic error correction by differentiating true mutations from PCR/sequencing errors; essential for ultra-sensitive detection. |
| Hybridization Capture Probes | Biotinylated oligonucleotide probes designed to target specific genomic regions (e.g., a gene panel or patient-specific mutations) for enrichment before sequencing [63]. | Allows for ultra-deep sequencing of regions of interest; improves cost-efficiency and sensitivity for targeted applications. |
| Digital PCR Master Mixes | Optimized reagent mixtures for droplet-based or chip-based digital PCR, containing polymerase, nucleotides, and buffer [62]. | Formulated for efficient amplification in partitioned reactions; often includes inhibitors to suppress wild-type amplification for enhanced specificity. |
| Methylation-Specific Assays | Chemical (bisulfite) or enzymatic treatments and associated PCR/NGS assays to detect cancer-specific DNA methylation patterns [64] [5]. | Exploits epigenetic changes, which can be more ubiquitous than genetic mutations, aiding in detecting heterogeneous tumors and cancer type prediction. |
The relentless advancement of ctDNA testing platforms demonstrates a concerted effort to overcome the intrinsic biological and technical hurdles of tumor heterogeneity and low analyte abundance. No single technology offers a perfect solution; the choice involves a strategic trade-off between the breadth of heterogeneity captured and the sensitivity for low-frequency variants. Digital PCR excels in ultra-sensitive tracking of known targets, while tumor-informed NGS strikes a powerful balance by focusing sensitivity on a patient-specific mutational fingerprint. Emerging multi-omics approaches that integrate fragmentomics and methylation profiling show promise in evading the limitations of relying solely on somatic mutations. For the research and drug development community, the future lies in continued refinement of error-corrected NGS, the development of integrated, multi-analyte liquid biopsy workflows, and the standardization of pre-analytical protocols to ensure that the full potential of ctDNA as a precise, non-invasive biomarker is realized across all cancer stages.
In the field of molecular diagnostics, standardization of testing methodologies and reporting practices is fundamental for ensuring consistent patient management and enabling valid cross-study comparisons. Nowhere is this challenge more evident than in the design and implementation of fluorescence in situ hybridization (FISH) panels for multiple myeloma (MM), a plasma cell neoplasm representing approximately 10% of all hematologic malignancies [48]. Despite FISH being recognized as the gold-standard clinical assay for detecting genetic abnormalities in MM, significant variations in FISH panel design, plasma cell enrichment methodologies, and reporting practices persist among laboratories worldwide [48]. This lack of standardization has created tangible clinical consequences, including confusion in interpreting results and potential misapplication of risk stratification frameworks that guide treatment decisions [48].
The experience with MM FISH panels offers valuable lessons for the broader field of cancer diagnostic platforms, particularly in understanding how technical and analytical variations impact the sensitivity and specificity of testing methodologies. This guide systematically compares MM FISH testing with alternative platforms, presenting experimental data and protocols to illustrate how standardization hurdles directly affect test performance and clinical utility in precision oncology.
Understanding MM FISH Testing: Methodologies and Standardization Challenges
Current Standard FISH Panel Design for Multiple Myeloma
The consensus recommendations from the Cancer Genomics Consortium Plasma Cell Neoplasm Working Group establish two primary FISH panels for MM assessment: an initial diagnostic panel and a relapsed MM panel [48]. For newly diagnosed MM (NDMM), minimal evaluation should include assessment for primary immunoglobulin heavy chain rearrangements (IGH-r), specifically t(4;14), t(14;16), t(14;20), and t(11;14), particularly when an IGH rearrangement is detected in initial screening [48]. Both diagnostic and relapsed panels must also evaluate key prognostic abnormalities including 17p deletion (encompassing the TP53 gene), 1p deletion, and 1q gain or amplification [48].
The testing algorithm typically employs an IGH break-apart (BAP) probe as an initial screen, with reflex testing using dual-color, dual-fusion (DC-DF) probes for specific translocations when abnormalities are detected [48]. This approach represents a cost-effective strategy that conserves often-limited enriched plasma cell samples while ensuring comprehensive detection of clinically significant rearrangements. Evidence supporting this methodology indicates that nearly all recurrent IGH rearrangements result in abnormal IGH BAP findings, with approximately 80% of these cases having a recurrent IGH-r and the remaining 20% representing other IGH rearrangements or deletions [48].
Key Technical Hurdles in FISH Testing Standardization
The standardization challenges in MM FISH testing originate from multiple technical sources that directly impact test reliability and inter-laboratory consistency:
- Plasma Cell Enrichment Methodologies: Variations in techniques for enriching plasma cells from bone marrow specimens create significant pre-analytical variability that affects sensitivity [48].
- FISH Probe Design and Panel Composition: Differences in probe selection, manufacturing, and panel composition across laboratories lead to inconsistent detection of genetic abnormalities [48].
- Interpretation Criteria and Cut-off Values: Establishing consistent thresholds for defining positivity, particularly for abnormalities with low variant allele frequencies, remains challenging [48] [65].
- Reporting Terminology: Inconsistent use of terminology in clinical reports, especially for copy number alterations like 1q gain versus amplification, creates confusion in risk stratification application [48].
These technical variations substantively impact the sensitivity and specificity of FISH testing. For instance, the failure to implement standardized probe validation procedures as outlined by the American College of Medical Genetics (ACMG) and Clinical Laboratory Improvement Amendments (CLIA) requirements can lead to both false-positive and false-negative results [65].
Table 1: Impact of Standardization Variables on FISH Test Performance
| Standardization Variable | Impact on Sensitivity | Impact on Specificity | Risk Stratification Implication |
|---|---|---|---|
| Plasma cell enrichment method | 5-15% variability in detection threshold | Minimal effect | Under-detection of minor clones |
| FISH probe targets | 5-10% variability in abnormality detection | Potential for false positives with non-specific probes | Incomplete risk profile |
| Positivity thresholds | Directly determines analytical sensitivity | Directly determines analytical specificity | Misclassification of risk category |
| Reporting terminology for 1q abnormalities | N/A | N/A | Inconsistent application of high-risk criteria |
Comparative Performance Analysis of Cancer Testing Platforms
Sensitivity and Specificity Across Methodologies
Understanding the relative performance of FISH compared to other testing platforms is essential for appropriate test selection in both clinical and research settings. The sensitivity and specificity profiles vary considerably across methodologies, with each platform offering distinct advantages and limitations for different applications in cancer diagnostics.
Table 2: Comparative Performance of Cancer Testing Platforms for Hematologic Malignancies
| Platform | Sensitivity | Specificity | Key Applications in MM | Major Limitations |
|---|---|---|---|---|
| Karyotyping | 5×10⁻² (5%) [66] | High for detected abnormalities [66] | Detection of hyperdiploidy [48] | Low sensitivity, requires metaphase cells [66] |
| FISH | 10⁻² (1%) [66] | High (87.8-96.2% depending on criteria) [67] | Targeted detection of specific translocations and copy number variations [48] | Limited to targeted abnormalities only [48] |
| qPCR | 10⁻⁴ to 10⁻⁶ [66] | High for specific targets [66] | Monitoring known fusion genes [66] | Only assesses one gene per assay [66] |
| Flow Cytometry | 10⁻³ to 10⁻⁶ (depending on colors) [66] | Moderate to high [66] | Minimal residual disease detection [66] | Immunophenotype changes can affect detection [66] |
| Next-Generation Sequencing (NGS) | 10⁻² to 10⁻⁶ [66] | High with appropriate validation [66] | Comprehensive mutation profiling, novel gene discovery [37] | Complex data analysis, higher cost, standardization challenges [37] [66] |
The data reveal a clear trade-off between the comprehensive genomic assessment provided by NGS and the highly specific, focused detection offered by FISH for known abnormalities. While NGS provides superior sensitivity (up to 10⁻⁶) and broader genomic coverage, FISH maintains important clinical utility for detecting specific structural variants and copy number alterations with high specificity, particularly in resource-limited settings [66].
Inter-Platform Concordance and Discrepancy Analysis
Studies directly comparing testing platforms highlight significant variability in results, underscoring the standardization challenges. A 2015 comparison of two commercially available NGS platforms (FoundationOne and Paradigm Cancer Diagnostic) found notable differences in turnaround time and clinically actionable results despite analyzing the same tumor samples [37]. The Paradigm test demonstrated significantly faster turnaround times (median 9 days earlier) and reported more biomarkers categorized as having commercially available drugs, highlighting how technical differences in testing methodologies (including coverage depth of ~250× versus >5,000×) can substantially impact clinical utility [37].
In MM specifically, discrepancies often emerge between FISH and conventional karyotyping, with FISH detecting critical abnormalities like deletion 13q14 that are frequently missed by chromosome banding analysis due to the low proliferative activity of plasma cells in culture [65]. This performance gap has established FISH as an essential adjunct to conventional cytogenetics in MM diagnosis and risk stratification [48] [65].
Experimental Protocols and Validation Standards
Recommended FISH Testing Algorithm for Multiple Myeloma
The Cancer Genomics Consortium Plasma Cell Neoplasm Working Group has established a standardized testing algorithm to optimize detection of clinically significant abnormalities in MM [48]. The following workflow represents the consensus approach for comprehensive MM FISH testing:
Diagram 1: MM FISH Testing Workflow
Analytical Validation Requirements for FISH Testing
For laboratories implementing FISH testing, rigorous validation is essential to ensure reliable results. The majority of FISH probes used clinically are classified as analyte-specific reagents (ASRs) and require extensive laboratory validation since they are not FDA-approved as standalone kits [65]. Key validation components include:
- Probe Validation: Establishing sensitivity and specificity parameters for each probe using samples with known abnormalities [65].
- Analytical Validation: Determining assay performance characteristics including precision, accuracy, and reportable range [65].
- Cut-off Establishment: Defining normal reference ranges through testing of normal control specimens to account for background noise and technical artifacts [65].
- Probe Specificity Verification: Confirming that probes hybridize specifically to intended targets without cross-hybridization [65].
Validation must also account for specimen-specific factors, such as the impact of plasma cell enrichment techniques on sensitivity and the requirements for analyzing different specimen types (e.g., bone marrow smears, formalin-fixed paraffin-embedded tissue) [65].
Standardization of Reporting and Interpretation Criteria
Consensus Reporting Frameworks for MM FISH
Significant variability in reporting practices represents a critical hurdle in MM FISH testing. To address this challenge, the Cancer Genomics Consortium has established guidelines aligned with the 2025 International Myeloma Society (IMS)/International Myeloma Working Group (IMWG) Updated Risk Stratification [48]. Standardized reporting should include:
- Clear Description of Genetic Abnormalities: Using consistent nomenclature for all reported alterations [48] [65].
- Risk Stratification Integration: Explicitly stating how detected abnormalities impact risk category assignment according to IMS/IMWG criteria [48].
- Technical Limitations: Acknowledging assay limitations and the potential for false negatives due to subclonal populations or technical factors [48] [65].
- Plasma Cell Percentage: Reporting the percentage of plasma cells in the analyzed sample to contextualize result reliability [48].
Standardization of terminology is particularly important for chromosome 1 abnormalities, where inconsistent use of "gain" versus "amplification" for 1q alterations has created confusion. The consensus defines gain of 1q as 3 total copies and amplification as 4 or more total copies relative to a diploid genome [48].
Impact of Interpretation Criteria on Test Performance
The criteria used to define a positive FISH result substantially impact both sensitivity and specificity, as demonstrated in a meta-analysis of FISH testing for biliary strictures which provides insights applicable to MM testing [67]. This analysis found that using polysomy as the threshold for positivity yielded a sensitivity of 49.4% with high specificity of 96.2%, while including tetrasomy/trisomy in the positive criteria increased sensitivity to 64.3% but reduced specificity to 78.9% [67]. Similarly, in MM, the specific criteria for defining 1p deletion (including the genomic region targeted and the percentage of cells requiring the abnormality) directly affect test performance and subsequent risk classification.
The Scientist's Toolkit: Essential Research Reagents and Materials
Table 3: Key Research Reagent Solutions for MM FISH Testing
| Reagent/Material | Function | Technical Specifications | Application in MM |
|---|---|---|---|
| IGH Break-Apart Probe | Initial screening for IGH rearrangements | Dual-color probe spanning IGH locus; detects rearrangements regardless of partner | Identifies samples requiring reflex testing for specific translocations [48] |
| Dual-Color Dual-Fusion Probes | Detection of specific IGH translocations | Probes for t(4;14), t(14;16), t(14;20), t(11;14) | Identifies primary translocations with prognostic significance [48] |
| Locus-Specific Enumeration Probes | Detection of copy number variations | Probes for 1p32 (CDKN2C), 1q21, 17p13 (TP53) with control probes | Identifies key secondary abnormalities affecting risk stratification [48] |
| Plasma Cell Enrichment Reagents | Enrichment of plasma cells from bone marrow | CD138 antibodies or other plasma cell markers coupled to magnetic beads | Improves sensitivity by increasing target cell concentration [48] |
| Hybridization and Detection System | Probe hybridization and signal detection | Buffers, blocking reagents, detection antibodies, and counterstains | Essential for specific probe binding and signal visualization [65] |
The standardization hurdles observed in MM FISH panels reflect broader challenges in cancer diagnostics across testing platforms. The experience with MM demonstrates that consistent performance requires standardization across the entire testing continuum—from specimen processing and analytical methodologies to interpretation criteria and reporting frameworks. As newer technologies like NGS become more prevalent in clinical practice, the lessons from FISH standardization remain relevant, particularly regarding the impact of technical variations on sensitivity, specificity, and ultimately, clinical decision-making.
For researchers and clinicians, selecting appropriate testing platforms requires careful consideration of both technical performance characteristics and standardization maturity. While FISH offers high specificity for targeted abnormalities in MM, emerging technologies like NGS provide broader genomic coverage with increasingly competitive sensitivity. Regardless of the platform chosen, rigorous validation, consistent implementation, and clear reporting are essential for ensuring reliable results that effectively guide risk stratification and treatment decisions in precision oncology.
Cancer remains a leading cause of death worldwide, with early detection and accurate genomic profiling being crucial for improving patient outcomes. [5] The emergence of novel diagnostic platforms—from multi-cancer early detection (MCED) tests to highly sensitive liquid biopsies and artificial intelligence (AI)-enhanced pathology—presents both opportunities and challenges for healthcare systems. These technologies differ fundamentally in their underlying methodologies, performance characteristics, and operational requirements, directly impacting their integration into clinical workflows and potential for equitable patient access. This guide provides an objective comparison of current cancer testing platforms, focusing on their sensitivity, specificity, and supporting experimental data to inform researchers, scientists, and drug development professionals.
Performance Comparison of Cancer Testing Platforms
The following tables summarize key performance metrics across different categories of cancer diagnostic technologies, based on recent clinical studies and validation data.
Table 1: Performance Metrics of Multi-Cancer Early Detection (MCED) Tests
| Test Name | Technology | Sensitivity | Specificity | PPV | NPV | Key Findings |
|---|---|---|---|---|---|---|
| Galleri MCED Test [8] | Targeted Methylation Sequencing | 40.4% (all cancers); 73.7% (for 12 high-mortality cancers) | 99.6% | 61.6% | NR | Detected >50 cancer types; 7-fold increase in cancer detection when added to standard screening |
| Carcimun Test [5] | Optical Extinction Measurement of Plasma Proteins | 90.6% | 98.2% | NR | NR | Distinguished cancer from healthy individuals and those with inflammatory conditions |
Table 2: Performance Metrics of Liquid Biopsy Platforms for Genomic Profiling
| Test Name | Technology | Sensitivity for SNVs/Indels | Sensitivity for CNVs | Limit of Detection (LOD95) | Key Findings |
|---|---|---|---|---|---|
| Northstar Select [9] | Single-Molecule Next-Generation Sequencing (smNGS) | Detected 51% more pathogenic variants than comparators | Detected 109% more CNVs than comparators | 0.15% VAF for SNVs; 2.1 copies for amplifications | 91% of additional actionable variants found below 0.5% VAF |
| Standard Liquid Biopsy Assays [9] | Various NGS approaches | Reference baseline | Reference baseline | Typically >0.5% VAF for SNVs; ~2.46-3.83 copies for amplifications | Performance varies by specific platform |
Table 3: Performance Metrics of Tissue-Based and AI-Enhanced Diagnostic Platforms
| Test Name/Platform | Technology | Sensitivity | Specificity | Concordance | Key Findings |
|---|---|---|---|---|---|
| Automated HER2 FISH (Leica BOND-III) [68] | Automated Fluorescent In Situ Hybridization | 0.95 (breast cancer); 1.0 (gastric cancer) | 0.97 (breast cancer); 1.0 (gastric cancer) | 98% with manual method | Significantly reduced hands-on time and supply costs |
| AI Virtual ICC [69] | Artificial Intelligence Analysis of Cell Morphology | 0.98 (CD3); 0.94 (PAX5) | 0.97 (CD3); 0.99 (PAX5) | NR | Enabled rapid evaluation of fine needle aspiration samples |
Experimental Protocols and Methodologies
Multi-Cancer Early Detection Test Validation
The Galleri MCED test was validated through the PATHFINDER 2 study, a prospective, multi-center, interventional study enrolling 35,878 participants aged 50 and older with no clinical suspicion of cancer. [8] The experimental protocol involved:
- Sample Collection: Single blood draw from each participant alongside standard-of-care cancer screenings.
- Testing Methodology: Targeted methylation sequencing of cell-free DNA to detect cancer signals and predict tissue of origin.
- Outcome Measurement: Participants with a cancer signal detected result underwent diagnostic evaluation based on the predicted cancer signal origin. The primary endpoints included safety, performance based on the number and type of diagnostic evaluations, and various performance measures including positive predictive value (PPV), negative predictive value (NPV), sensitivity, specificity, and cancer signal origin prediction accuracy.
- Follow-up: Participants were followed for at least 12 months to monitor for cancer diagnoses.
Comprehensive Genomic Profiling Assay Validation
The Northstar Select liquid biopsy assay was validated through a prospective head-to-head comparison study involving 182 patients with more than 17 solid tumor types. [9] The experimental protocol included:
- Sample Collection: Plasma samples collected from patients across six community oncology clinics and one large hospital.
- Testing Methodology: Single-molecule next-generation sequencing (smNGS) using Quantitative Counting Templates (QCT) technology to detect single nucleotide variants (SNVs), insertions/deletions (indels), copy number variants (CNVs), gene fusions, and microsatellite instability.
- Comparative Analysis: Direct comparison against six commercially available liquid biopsy assays from four CLIA/CAP laboratories with panel sizes between 73-523 genes.
- Orthogonal Validation: Digital droplet PCR (ddPCR) confirmation of detected variants to verify true positives.
- Specificity Controls: Matched buffy coat testing to identify and account for clonal hematopoiesis variants.
AI-Based Virtual Immunocytochemistry Development
The AI-based virtual immunocytochemistry platform was developed and validated using samples from 100 suspected cases of canine T-cell and B-cell lymph node lymphomas through fine needle aspiration (FNA). [69] The experimental workflow involved:
- Sample Preparation: Cytopathology slides initially stained with standard Wright-Giemsa and then re-stained with ICC reagents (anti-CD3 or anti-PAX5 antibodies), resulting in paired stained slides.
- Digital Processing: Slides were digitally scanned, and images underwent comprehensive pre-processing to separate stains of interest for nuclei segmentation.
- Feature Extraction: Following nuclei segmentation, cell features from processed image pairs were translated into a structured tabular features format with immuno-positive and negative labeled classes.
- AI Training: Geometrical features of 8.48 million segmented cells (4.24 million pairs) were used to train the AI algorithm to predict cell labels based on morphological features alone.
Signaling Pathways and Experimental Workflows
PI3K/Akt/mTOR Signaling Pathway in Endometrial Carcinoma
The PI3K/Akt/mTOR signaling pathway represents a critical transduction pathway frequently activated in endometrial cancer, serving as an important biomarker for diagnostic evaluation. [70] The following diagram illustrates this pathway and its clinical significance:
Pathway Diagram Title: PI3K/Akt/mTOR Signaling in Endometrial Cancer
Multi-Cancer Early Detection Test Workflow
The Galleri MCED test workflow integrates molecular biology, sequencing technology, and bioinformatics to detect cancer signals from blood samples, as illustrated below: [8]
Workflow Title: MCED Test Methodology from Blood Draw to Clinical Report
AI-Based Virtual Immunocytochemistry Workflow
The AI-based virtual immunocytochemistry platform transforms traditional diagnostic pathology through computational analysis, as shown in this workflow: [69]
Workflow Title: AI Virtual Immunocytochemistry Analysis Process
Essential Research Reagent Solutions
The following table details key reagents and materials essential for implementing the featured cancer diagnostic technologies, based on the experimental methodologies cited in this guide.
Table 4: Essential Research Reagent Solutions for Cancer Diagnostic Platforms
| Reagent/Material | Function | Example Application | Technical Specifications |
|---|---|---|---|
| Targeted Methylation Panels | Enrichment of cancer-associated methylated genomic regions | MCED tests like Galleri [8] | Designed to target >100,000 informative methylation regions |
| Single-Molecule Counting Technology | Quantitative analysis of low-abundance nucleic acid molecules | Northstar Select liquid biopsy [9] | Enables detection of variants at 0.15% VAF; QCT technology |
| Enzyme-Labelled Conjugates | Detection of antigen-antibody interactions in immunoassays | ELISA-based diagnostics [71] | Horseradish peroxidase (HRP) or alkaline phosphatase (AP) conjugates |
| Chromogenic Substrates | Visualization of enzyme activity in immunological assays | ELISA and immunohistochemistry [71] | TMB (tetramethylbenzidine) produces blue color; BCIP/NBT for AP |
| Automated Staining Platforms | Standardized processing of histological samples | Automated HER2 FISH testing [68] | Leica BOND-III system; reduces inter-operator variability |
| AI Training Datasets | Training and validation of computational pathology algorithms | Virtual immunocytochemistry [69] | Millions of labeled cell images with paired staining results |
| Cell-Free DNA Extraction Kits | Isolation of circulating tumor DNA from plasma samples | Liquid biopsy applications [8] [9] | High-sensitivity recovery of short-fragment DNA |
| Multiplex PCR Master Mixes | Amplification of multiple genomic targets simultaneously | PCR-based biomarker detection [72] | Contains optimized buffer systems and hot-start DNA polymerase |
Implications for Health System Readiness and Equitable Access
The performance characteristics and technical requirements of emerging cancer diagnostic platforms have direct implications for health system readiness and equitable access. Technologies demonstrating high sensitivity and specificity, such as the MCED tests achieving 73.7% sensitivity for high-mortality cancers and 99.6% specificity, must be evaluated within the context of their operational demands and economic considerations. [8] Automated platforms that reduce hands-on time by 50% while maintaining 98% concordance with manual methods address critical workflow constraints in pathology laboratories. [68] Similarly, AI-enhanced diagnostic tools that achieve 0.98 sensitivity and 0.97 specificity for immunocytochemical markers without the need for traditional antibody reagents present opportunities for both cost savings and standardization across healthcare settings. [69]
The demonstrated ability of advanced liquid biopsy platforms to detect 51% more pathogenic variants and 109% more copy number alterations than existing technologies, particularly for variants below 0.5% variant allele frequency where conventional tests typically fail, represents a significant advancement in comprehensive genomic profiling. [9] However, the implementation of such technologies requires careful consideration of bioinformatics infrastructure, specialized training, and reimbursement mechanisms to ensure equitable access across diverse healthcare settings. As these technologies continue to evolve, their integration into clinical pathways must be guided by robust evidence generation, standardized validation protocols, and strategic planning that addresses both technical performance and health system readiness factors.
Benchmarking Performance: A Rigorous Cross-Platform Evaluation
Comparative Analysis of Sensitivity and Specificity Across Major MCED Assays
Multi-cancer early detection (MCED) assays represent a transformative approach in oncology, enabling simultaneous screening for multiple cancers from a single liquid biopsy. Unlike traditional single-cancer screening methods that focus on specific anatomical sites, MCED tests analyze circulating tumor-derived biomarkers in the blood, identifying molecular changes before symptom onset [4]. The current standard of care screening paradigm only identifies approximately 14% of cancers in the population, leaving a significant diagnostic gap for many deadly cancer types [73]. MCED technologies aim to address this limitation by detecting a broad spectrum of cancers, potentially revolutionizing cancer screening and management.
The fundamental principle underlying MCED tests is the detection of cancer-derived components in the blood, primarily through analysis of cell-free DNA (cfDNA). These assays evaluate various molecular features, including DNA mutations, abnormal DNA methylation patterns, fragmented DNA, and other tumor-derived biomarkers that indicate the presence of cancer and can predict its tissue of origin [4]. The analytical and clinical performance of these tests are primarily assessed through two crucial parameters: sensitivity (the ability to correctly identify individuals with cancer) and specificity (the ability to correctly identify individuals without cancer). Understanding the comparative performance of major MCED assays is essential for researchers and clinicians navigating this rapidly evolving field.
Methodological Framework for MCED Evaluation
Key Performance Metrics and Evaluation Methodology
Evaluating MCED test performance requires careful consideration of standardized metrics and methodological rigor. Sensitivity measures the proportion of true positives detected out of all patients with cancer, while specificity measures the percentage of true negatives out of all subjects who do not have cancer [74]. These metrics are inversely related, creating a fundamental trade-off in test design [74]. Additional critical metrics include Positive Predictive Value (PPV), which determines the proportion of true positives out of all positive findings, and Negative Predictive Value (NPV), which determines the proportion of true negatives out of all negative findings [74]. Both PPV and NPV are significantly influenced by disease prevalence in the population being tested [74].
The accurate estimation of sensitivity and specificity in real-world settings presents methodological challenges. Studies often use an "accuracy assessment interval" – the period after a screening test used to estimate its accuracy [10]. The length of this interval can introduce bias; too short an interval may miss cancers truly present at screening, while too long an interval may include cancers that developed after screening [10]. For MCED tests, rigorous clinical validation in the intended-use population (asymptomatic adults with elevated cancer risk) is essential, as performance in retrospective case-control studies may not translate to real-world screening scenarios [73].
Critical Assessment Framework for MCED Studies
When comparing MCED assay performance, researchers must consider several methodological factors. First, the study design fundamentally impacts results; well-designed case-control studies can estimate test sensitivity, but interventional studies in the intended-use population provide estimates of "episode sensitivity" that are more applicable to clinical practice [73]. Second, the cancer case mix in the study population significantly influences performance characteristics, as populations enriched with indolent cancers or late-stage cancers will yield different results [73]. Third, the specificity level at which sensitivity is reported must be considered, as a test with 98.5% specificity has a three times higher false positive rate than a test with 99.5% specificity, which would typically allow for higher sensitivity estimates [73].
Additional considerations include the healthy volunteer effect in screening trials, where participants are often healthier than the general population with lower cancer incidence rates, and whether results are reported from the MCED test alone or in combination with other modalities [73]. These factors collectively underscore the importance of comparing tests validated in similar populations using comparable study designs and follow-up protocols.
Comparative Performance Analysis of Major MCED Assays
Performance Metrics Across MCED Platforms
Table 1: Comparative Performance Characteristics of Major MCED Assays
| MCED Test | Company/Developer | Sensitivity Range | Specificity | Detection Method | Detectable Cancer Types |
|---|---|---|---|---|---|
| Galleri | GRAIL | 51.5% (overall) | 99.5% | Targeted methylation sequencing | >50 cancer types [4] |
| CancerSEEK | Exact Sciences | 62% (overall) | >99% | Multiplex PCR + immunoassay | 8 cancer types [4] |
| Shield | Guardant Health | 83% (CRC), 65% (Stage I CRC) | 88% (for CRC detection) | Genomic mutations, methylation, DNA fragmentation | Colorectal cancer focus [4] |
| DEEPGENTM | Quantgene | 43% | 99% | Next-generation sequencing (NGS) | 7 cancer types [4] |
| DELFI | Delfi Diagnostics | 73% | 98% | cfDNA fragmentation profiles + machine learning | 7 cancer types [4] |
| PanSeer | Singlera Genomics | 87.6% | 96.1% | Semi-targeted PCR libraries and sequencing | 5 cancer types [4] |
| EpiPanGI Dx | - | 85-95% (AUC 0.88) | - | Bisulfite sequencing + machine learning | Gastrointestinal cancers [4] |
Table 2: Real-World Performance Data from Large-Scale MCED Implementation
| Performance Metric | Galleri MCED Test (Real-World Data) | Notes |
|---|---|---|
| Cancer Signal Detection Rate | 0.91% (1011/111,080) | Consistent with clinical studies and independent modeled values [75] |
| Empirical PPV (Asymptomatic) | 49.4% (128/259) | Higher than standard single-cancer screening tests [75] |
| Empirical PPV (Symptomatic) | 74.6% (53/71) | In individuals with cancer-associated symptoms [75] |
| Cancer Signal Origin Accuracy | 87% | Consistent with previous clinical studies [75] |
| Time to Diagnosis (Median) | 39.5 days | From result receipt to cancer diagnosis [75] |
Technology Platforms and Biomarker Approaches
MCED assays employ distinct technological approaches to detect cancer signals. The Galleri test uses targeted methylation sequencing of cell-free DNA, analyzing cancer-specific DNA methylation patterns to detect cancer and predict its tissue of origin [75]. This approach leverages machine learning algorithms trained on large-scale clinical studies. CancerSEEK utilizes a multi-analyte approach, combining analysis of eight cancer-associated proteins and 16 cancer gene mutations simultaneously, which increases the test's sensitivity compared to using either approach alone [4]. The Guardant Health Shield test integrates multiple biomarker types, including genomic mutations, methylation patterns, and DNA fragmentation patterns for early colorectal cancer detection [4].
Other platforms employ alternative strategies. The DELFI test analyzes cfDNA fragmentation profiles using machine learning, while DEEPGENTM uses next-generation sequencing [4]. Each technological approach has strengths and limitations in terms of sensitivity, specificity, detectable cancer types, and implementation requirements. Methylation-based approaches generally provide better tissue of origin prediction, while mutation-based approaches may offer better detection of specific cancer types.
Diagram 1: MCED Assay Workflow and Technology Platforms. This diagram illustrates the multi-analyte approach of MCED tests, from blood draw to result interpretation, highlighting the integration of various biomarker analyses.
Key Experimental Protocols and Validation Studies
Major Clinical Validation Trials and Protocols
Robust clinical validation is essential for demonstrating MCED test performance. The Galleri test was validated through the Circulating Cell-Free Genome Atlas (CCGA) study, a prospective, observational, longitudinal study that enrolled approximately 15,000 participants across North America [73] [75]. The PATHFINDER study, an interventional trial conducted under an FDA-approved investigational device exemption, further confirmed Galleri's performance in the intended-use population of adults aged 50 and above with no clinical suspicion of cancer [73]. This multi-center study demonstrated a positive predictive value of 43.1% and cancer signal origin accuracy of 87% [75].
The CancerSEEK assay was initially validated through a case-control study that reported specificity greater than 99% [73]. However, when studied in a clinical trial in the intended-use population, the specificity was 95.3% (representing at least a 4.7 times higher false-positive rate), with a positive predictive value of 5.9% [73]. This highlights the importance of validation in the appropriate screening population rather than relying solely on case-control studies.
The Guardant Health Shield test was evaluated in the ECLIPSE study, which enrolled over 20,000 average-risk adults for colorectal cancer detection [4]. This study demonstrated 83% sensitivity for colorectal cancer overall, with 65% sensitivity for Stage I CRC, and detected 13% of advanced adenomas [4]. The successful integration of multiple biomarkers in this test lays a promising foundation for future MCED development.
Analytical Validation Methodologies
Analytical validation ensures that MCED tests reliably detect their intended targets. For methylation-based assays like Galleri, this involves demonstrating reproducible detection of cancer-associated methylation patterns at low allele fractions. The analytical validation typically includes limit of detection studies using cell line-derived DNA spiked into healthy donor plasma at varying allele fractions, reproducibility assessments across multiple reagent lots and operators, and interference studies to assess the impact of potential interferents like genomic DNA or hemolyzed blood.
For hybrid approaches like CancerSEEK, analytical validation must address both the DNA and protein components. The DNA sequencing component requires demonstrating sensitive detection of mutations at low variant allele frequencies, while the protein analysis requires establishing sensitivity for low-abundance protein biomarkers. Cross-reactivity and interference studies are particularly important for multi-analyte tests to ensure that detection of one biomarker doesn't interfere with detection of others.
Research Reagent Solutions for MCED Development
Table 3: Essential Research Tools for MCED Assay Development
| Research Tool Category | Specific Examples | Research Application in MCED Development |
|---|---|---|
| Nucleic Acid Extraction Kits | cfDNA extraction kits | Isolation of high-quality cell-free DNA from plasma samples [4] |
| Bisulfite Conversion Kits | Commercial bisulfite conversion reagents | Conversion of unmethylated cytosines to uracils for methylation analysis [4] |
| Target Enrichment Systems | Hybridization capture kits, PCR target enrichment | Enrichment of cancer-associated genomic regions prior to sequencing [4] |
| Next-Generation Sequencing | Library preparation kits, sequencing reagents | Preparation and sequencing of cfDNA libraries [4] |
| Protein Detection Assays | Multiplex immunoassays, ELISA kits | Quantification of cancer-associated protein biomarkers [76] [77] |
| Reference Materials | Synthetic cfDNA controls, cancer cell line DNA | Assay validation, quality control, and standardization [73] |
| Data Analysis Tools | Machine learning platforms, bioinformatics pipelines | Development of classification algorithms [73] [75] |
Critical Pathways in MCED Test Interpretation
Diagram 2: MCED Test Result Interpretation and Clinical Pathways. This flowchart outlines the clinical decision pathways following MCED testing, highlighting true positive, false positive, and false negative scenarios.
The comparative analysis of major MCED assays reveals a rapidly evolving landscape with diverse technological approaches and performance characteristics. Methylation-based assays like Galleri demonstrate high specificity (99.5%) and broad cancer detection capabilities, while multi-analyte approaches like CancerSEEK show promising sensitivity through combined DNA and protein analysis. The real-world implementation data from over 100,000 Galleri tests demonstrates performance consistent with clinical validation studies, with 87% accuracy in predicting cancer signal origin [75].
Future MCED development will likely focus on improving sensitivity for early-stage cancers while maintaining high specificity. The integration of additional biomarker classes, including fragmentomics, proteomics, and transcriptomics, may enhance performance. Standardization of validation protocols and analytical benchmarks will be crucial for meaningful cross-assay comparisons. Additionally, addressing challenges related to clinical implementation, including equitable access, cost-effectiveness, and integration with existing screening paradigms, will determine the ultimate public health impact of MCED technologies.
For researchers in this field, careful consideration of study design, analytical validation approaches, and clinical utility endpoints is essential when evaluating MCED assays. As this technology continues to mature, MCED tests hold significant promise for transforming cancer screening by detecting more cancers earlier, particularly those without current screening options, potentially reducing cancer mortality through earlier intervention.
The accurate detection of cancer across its developmental continuum—from early, localized lesions to advanced, metastatic disease—represents a fundamental challenge in clinical oncology. The sensitivity and specificity of diagnostic platforms often exhibit significant stage-dependent variation, directly impacting their clinical utility for early intervention. Early detection is crucial, as survival rates for many cancers decrease dramatically with advancing stage. For instance, localized pancreatic cancer has a 5-year relative survival rate of 44%, compared to just 3% for metastatic disease [59]. This guide provides a comparative analysis of the stage-by-stage performance of modern cancer testing platforms, focusing on multi-cancer early detection (MCED) tests, AI-driven image analysis, and protein-based assays. We present objective performance data and detailed experimental methodologies to inform researchers, scientists, and drug development professionals in their evaluation of these rapidly evolving technologies.
Comparative Performance Data of Cancer Detection Platforms
The following tables summarize key performance metrics for several emerging cancer detection technologies, with a focus on their efficacy across different cancer stages.
Table 1: Overall Performance Metrics of Featured Cancer Detection Tests
| Test Name | Technology / Platform | Overall Sensitivity (%) | Overall Specificity (%) | Positive Predictive Value (PPV) (%) | Reported False Positive Rate (%) |
|---|---|---|---|---|---|
| Galleri (PATHFINDER 2) [8] | Targeted Methylation Sequencing of cfDNA | 40.4% (All Cancers) | 99.6% | 61.6% | 0.4% |
| Carcimun Test [5] | Conformational Changes in Plasma Proteins | 90.6% | 98.2% | Data Not Provided | 1.8% |
| Skin-DeepNet (ISIC 2019) [78] | Deep Learning on Dermoscopy Images | 99.65% (Accuracy) | 99.51% (Precision) | Data Not Provided | Data Not Provided |
Table 2: Stage-Dependent Sensitivity of Detection Platforms
| Test Name | Stage I Sensitivity | Stage II Sensitivity | Stage III Sensitivity | Stage IV/Late-Stage Sensitivity | Notes |
|---|---|---|---|---|---|
| Galleri (PATHFINDER 2) [8] | Data Not Provided | Data Not Provided | Data Not Provided | 73.7% | Episode sensitivity for 12 cancers responsible for 2/3 of U.S. cancer deaths. |
| Galleri (Other Studies) [59] | 24.2% | Data Not Provided | Data Not Provided | 95.3% | Sensitivity for early-stage disease is notably lower than for late-stage. |
| Carcimun Test [5] | Included in Cohort | Included in Cohort | Included in Cohort | Not Included | Study specifically included Stages I-III cancers; mean extinction values were significantly higher in cancer patients. |
Detailed Experimental Protocols and Methodologies
Understanding the experimental designs from which performance data are derived is critical for a nuanced interpretation of the results.
GRAIL's Galleri Test: The PATHFINDER 2 Study
- Study Design: The PATHFINDER 2 study is a prospective, multi-center, interventional registrational study designed to evaluate the safety and performance of the Galleri test in a real-world screening context [8].
- Cohort: The study enrolled 35,878 participants across the U.S. and Canada. The performance data came from a pre-specified analysis of the first 25,578 participants with at least 12 months of follow-up. The analyzable performance cohort included 23,161 adults aged 50 and older with no clinical suspicion of cancer [8].
- Testing Protocol: A single blood draw was collected from each participant. The Galleri test analyzes cell-free DNA (cfDNA) from the blood plasma, focusing on methylation patterns—chemical modifications to DNA that regulate gene expression and are often altered in cancer [8] [79]. The test uses a targeted methylation sequencing approach combined with machine learning to identify the presence of a cancer signal and predict the tissue of origin or Cancer Signal Origin (CSO) [8].
- Outcome Measures: In this prospective design, a key performance metric is "episode sensitivity," defined as the test's ability to detect a cancer that could be confirmed within 12 months after the blood draw. Participants with a "cancer signal detected" result underwent a diagnostic workup based on the predicted CSO to confirm the presence of cancer [8].
The Carcimun Test: A Protein-Based Assay
- Study Design: This prospective, single-blinded study aimed to evaluate the Carcimun test's performance, specifically including participants with inflammatory conditions to assess robustness against a common source of false positives [5].
- Cohort: The study included 172 participants: 80 healthy volunteers, 64 patients with various Stage I-III cancers (including pancreatic, colorectal, and lung cancer), and 28 individuals with inflammatory conditions (e.g., fibrosis, sarcoidosis, pneumonia) or benign tumors [5].
- Testing Protocol: The Carcimun test employs a fundamentally different methodology. It detects conformational changes in plasma proteins through optical extinction measurements. In practice:
- Plasma samples are mixed with 0.9% NaCl solution and distilled water.
- The mixture is incubated at 37°C for 5 minutes.
- A baseline absorbance measurement is taken at 340 nm.
- Acetic acid solution is added, and the final absorbance is measured again using a clinical chemistry analyzer.
- The change in extinction (absorbance) at 340 nm is used to differentiate between healthy individuals, those with inflammation, and cancer patients, using a pre-defined cut-off value of 120 [5].
Skin-DeepNet: An AI-Based Diagnostic Framework
- Study Design: This research involved the development and validation of a deep learning framework for the automated diagnosis and classification of skin cancer from dermoscopy images [78].
- Datasets: The model was trained and validated on two public benchmark datasets, ISIC 2019 and HAM10000, which contain thousands of dermoscopic images of various skin lesions [78].
- Algorithmic Workflow:
- Pre-processing: An image contrast enhancement technique (AGCWD) was applied, followed by a hair removal algorithm using morphological operations and inpainting.
- Segmentation: A robust segmentation step combining Mask R-CNN and the GrabCut algorithm was used to accurately delineate lesion boundaries from the background skin.
- Feature Extraction & Classification: A dual-feature extraction strategy was employed. A pre-trained High-Resolution Network (HRNet) model, combined with an attention block, served as a feature descriptor. Its outputs were fed into a Deep Belief Network (DBN) to capture high-level discriminative features.
- Decision Fusion: Predictions from the HRNet and DBN models were integrated using ensemble learning techniques like boosting (XGBoost) and stacking to achieve final high-accuracy classification [78].
Diagram 1: AI Skin Cancer Diagnosis Workflow
Signaling Pathways and Biological Mechanisms
The featured tests leverage distinct biological principles for cancer detection.
cfDNA Methylation in MCED Tests
Tests like Galleri are grounded in the biology of circulating tumor DNA (ctDNA). As tumor cells undergo apoptosis or necrosis, they release DNA fragments into the bloodstream. A key biomarker is the methylation pattern of this DNA. Methylation involves the addition of methyl groups to cytosine bases in CpG dinucleotides, which alters gene expression without changing the DNA sequence. Cancer cells exhibit widespread and aberrant methylation patterns (hypermethylation of tumor suppressor genes and hypomethylation of oncogenes). The Galleri test uses a targeted methylation sequencing approach to detect these cancer-specific epigenetic signatures in cfDNA, allowing it to not only detect the presence of cancer but also predict the tissue of origin with high accuracy (92% in PATHFINDER 2) [8] [59].
Diagram 2: cfDNA Methylation Cancer Detection
Protein Conformational Changes
The Carcimun test is based on the principle that the presence of cancer or acute inflammation can induce conformational changes in plasma proteins. These structural alterations can affect how proteins interact with light and other chemicals. The test quantifies these changes by measuring the optical extinction (absorbance) of plasma samples at 340 nm before and after the addition of a mild acetic acid solution. The acidification step likely causes these structurally altered proteins to aggregate or precipitate at a different rate or extent than proteins from healthy individuals, leading to a measurable difference in signal that correlates with disease status [5].
The Scientist's Toolkit: Essential Research Reagents and Materials
Table 3: Key Research Reagents and Materials for Featured Technologies
| Item / Reagent | Function / Application | Associated Test/Platform |
|---|---|---|
| Cell-free DNA (cfDNA) Extraction Kits | Isolation of circulating DNA fragments from blood plasma samples for downstream genomic analysis. | Galleri & other liquid biopsies [59] |
| Bisulfite Conversion Reagents | Chemical treatment that converts unmethylated cytosines to uracils, allowing for subsequent sequencing to discern methylation status. | Galleri (Methylation-Based MCED) [8] |
| Targeted Methylation Panels | Pre-designed sets of probes for capturing and sequencing genomic regions known to have cancer-specific methylation patterns. | Galleri (Methylation-Based MCED) [8] |
| Acetic Acid Solution | Used in the Carcimun test protocol to induce aggregation/precipitation of conformationally altered proteins, enabling photometric detection. | Carcimun Test [5] |
| Clinical Chemistry Analyzer | Automated instrument for performing photometric measurements, such as absorbance/extinction at specific wavelengths (e.g., 340 nm). | Carcimun Test [5] |
| Dermoscopy Datasets (e.g., ISIC, HAM10000) | Publicly available, annotated image repositories used for training and validating AI models for skin cancer classification. | Skin-DeepNet & other AI diagnostics [78] |
| Mask R-CNN & GrabCut Algorithms | Pre-built or custom-coded algorithms for precise image segmentation, crucial for isolating lesions from background skin. | Skin-DeepNet [78] |
The landscape of cancer detection is evolving beyond single-cancer, late-stage diagnosis towards multi-cancer, early-stage interception. The technologies compared herein—Galleri's methylation-based sequencing, the Carcimun protein assay, and the Skin-DeepNet AI platform—each demonstrate unique strengths and limitations in their stage-dependent performance. A consistent theme across liquid biopsy platforms is the inverse relationship between sensitivity and disease stage, underscoring the technical challenge of detecting scarce tumor-derived signals in early-stage disease. The high specificity of these novel tools is a critical asset for population screening, minimizing unnecessary invasive procedures. Future research, particularly data from randomized controlled trials with mortality endpoints, will be essential to fully validate the potential of these platforms to reduce cancer-specific mortality. For researchers and drug developers, the choice of platform must be guided by the specific clinical context, including the target cancer types, desired stage of detection, and the balance between sensitivity and specificity.
Cancer remains a leading cause of death worldwide, with early detection being crucial for effective treatment and improved patient outcomes. Traditional diagnostic methods, such as imaging and tissue biopsies, are often limited by invasiveness, cost, and variable sensitivity, especially for cancers that are asymptomatic or located in hard-to-reach areas [5]. While blood-based liquid biopsies using circulating tumor DNA (ctDNA) have emerged as promising alternatives, they face challenges with the low abundance of ctDNA in early-stage cancers and the significant heterogeneity across different cancer types [5]. In this evolving diagnostic landscape, a novel screening tool—the Carcimun test—utilizes a fundamentally different approach by detecting malignancy-associated conformational changes in plasma proteins through optical extinction measurements [80] [5]. This comparison guide provides an objective performance evaluation of the Carcimun test against other technological platforms, with supporting experimental data and detailed methodologies for the research community.
The Carcimun test represents an innovative approach in multi-cancer early detection (MCED). Unlike methods that target tumor-derived genetic material, it detects specific changes in the optical absorption spectra of blood plasma, which serve as a marker for general malignancy [80] [5]. The underlying hypothesis is that the pathological conditions of cancer induce detectable conformational changes in plasma proteins, which can be revealed through a standardized biochemical process and optical measurement protocol [80]. The molecular mechanism, while not yet fully elucidated, is thought to involve the humoral immune response, as test results have also been correlated with inflammatory conditions [80]. The core principle is that extinction values above a defined threshold indicate malignancy, provided that acute inflammation can be excluded as a confounder [80].
Scientific Basis of Protein Conformational Changes
Proteins are dynamic entities whose functions are governed by transitions between multiple conformational states, rather than static three-dimensional structures [81]. These dynamic conformations are essential for biological activity, with enzymes, transporters, and signaling proteins utilizing specific conformational transitions to perform their functions [81]. A protein's conformational landscape can be influenced by both intrinsic factors (such as disordered regions or domain architecture) and external factors (including pH, temperature, ion concentration, and ligand binding) [81]. In pathological conditions such as cancer, the cellular environment can alter, potentially inducing specific, detectable shifts in the conformational ensembles of circulating plasma proteins. The Carcimun test appears to capitalize on this phenomenon, detecting a malignancy-specific signature within this complex dynamic system.
Experimental Protocols & Methodologies
Carcimun Test Workflow and Protocol
The following diagram illustrates the standardized experimental workflow for the Carcimun test, as detailed in validation studies [5].
Figure 1: Carcimun Test Experimental Workflow
The detailed methodology for the Carcimun test has been described in recent validation studies [5]:
- Sample Collection and Preparation: Blood samples are collected in K3-EDTA tubes for plasma preparation. Plasma is immediately separated by centrifugation (3,000 rpm for 5 minutes at room temperature) and transferred to tubes without additives [80] [5].
- Biochemical Processing: According to a standardized protocol, 70 µL of 0.9% NaCl solution is added to the reaction vessel, followed by 26 µL of blood plasma, resulting in a total volume of 96 µL. Then, 40 µL of distilled water is added, increasing the volume to 136 µL and adjusting the NaCl concentration to 0.63%. The mixture is incubated at 37°C for 5 minutes to achieve thermal equilibration [5].
- Optical Measurement: After incubation, a blank measurement is recorded at 340 nm. Subsequently, 80 µL of 0.4% acetic acid solution (containing 0.81% NaCl) is added, resulting in a final volume of 216 µL. The final absorbance measurement is performed at 340 nm using a clinical chemistry analyzer (Indiko or Konelab PRIME 60) [80] [5].
- Data Analysis: Measurements are given in milli extinction units (mEU). A predefined cut-off value of 120 differentiates between healthy individuals (≤120) and cancer patients (>120). All measurements are performed in a blinded manner, with personnel unaware of the clinical or diagnostic status of the samples [80] [5].
Study Designs for Clinical Validation
The performance data for the Carcimun test come from two key prospective, single-blinded clinical studies:
- Study 1 (Medical University of Vienna): Included 307 participants (137 healthy volunteers and 170 cancer patients with proven malignancy across 16 different entities). Patients with acute or chronic inflammation were excluded based on primary exclusion criteria or testing for leukocytosis and increased levels of C-reactive protein and fibrinogen (secondary exclusion criteria) [80].
- Study 2 (University Hospital Regensburg): Included 172 participants (80 healthy volunteers, 64 cancer patients with various solid tumors at stages I-III, and 28 individuals with inflammatory conditions or benign tumors). This study specifically aimed to address the limitation of inflammatory confounders by including participants with conditions like fibrosis, sarcoidosis, and pneumonia [5] [82].
Performance Benchmarking: Comparative Data Analysis
Carcimun Test Performance Metrics
Table 1: Carcimun Test Performance Across Validation Studies
| Study Parameter | Study 1 (n=307) | Study 2 (n=172) | Study 2 (Cancer vs. Healthy Only) |
|---|---|---|---|
| Sensitivity | 88.8% | 90.6% | 90.6% |
| Specificity | 91.2% | 98.2% | 98.2% |
| Accuracy | 90.0% | 95.4% | 95.4% |
| Mean Extinction (Healthy) | 67.1 ± 6.8 mEU | 23.9 mEU | 23.9 mEU |
| Mean Extinction (Cancer) | 292.6 ± 15.6 mEU | 315.1 mEU | 315.1 mEU |
| Fold Increase (Cancer/Healthy) | 4.4-fold | 13.2-fold | 13.2-fold |
| Inflammatory Conditions | Excluded | Mean: 62.7 mEU | N/A |
The Carcimun test demonstrated significantly higher mean extinction values in cancer patients compared to healthy individuals across both studies [80] [5]. In Study 2, which included inflammatory conditions, the test maintained high specificity, with mean extinction values in inflammatory conditions (62.7 mEU) being substantially lower than in cancer patients (315.1 mEU) and only slightly higher than in healthy individuals (23.9 mEU) [5]. Furthermore, initial data from Study 1 suggested a positive correlation between extinction values and tumor stage in breast, colorectal, pancreas, and anal cancers, though subgroup numbers were low [80].
Comparison with Other Cancer Detection Platforms
Table 2: Technology Platform Comparison
| Platform | Technology | Biomarker | Reported Sensitivity | Reported Specificity | Key Advantages | Key Limitations |
|---|---|---|---|---|---|---|
| Carcimun Test | Optical extinction of plasma proteins | Protein conformational changes | 90.6% [5] | 98.2% [5] | Low-cost instrumentation, rapid results, broad cancer detection | Mechanism not fully elucidated, influenced by inflammation |
| Northstar Select | Single-molecule NGS (smNGS) | ctDNA (SNVs, Indels, CNVs, fusions) | Detects 51% more SNV/Indels & 109% more CNVs vs. comparators [9] | >99.9% [9] | Ultra-sensitive (LOD95: 0.15% VAF), guides targeted therapy | Higher cost, requires complex bioinformatics |
| GRAIL Galleri | Methylation sequencing | ctDNA methylation patterns | N/A (Panel of >50 cancers) | N/A | Tissue-of-origin prediction, very broad cancer coverage | High sequencing cost, limited clinical validation |
| Digital Pathology (AI) | AI-based image analysis | Tissue morphology patterns | High agreement with pathologists (high HER2) [83] | Variable in low HER2 [83] | Augments pathologist workflow, quantifies expression | Limited to specific biomarkers, requires tissue sample |
When compared to other advanced diagnostic platforms, each technology demonstrates distinct strengths. The Carcimun test offers a unique approach with performance metrics comparable to more established technologies, particularly in distinguishing cancer from non-cancer conditions [5]. Its practical advantages include the use of standard clinical chemistry analyzers, potentially lower per-test costs, and a universal detection principle not limited to specific genetic alterations.
In contrast, ctDNA-based approaches like Northstar Select offer the advantage of identifying specific actionable mutations to guide targeted therapies, with recent studies demonstrating superior sensitivity in detecting clinically actionable variants below 0.5% variant allele frequency where other assays typically fail [9]. However, these genomic approaches generally require more sophisticated and costly instrumentation and analysis.
AI-powered digital pathology tools represent another technological frontier, showing high agreement with expert pathologists in assessing biomarkers like HER2, particularly at high expression levels [83]. However, variability increases at low expression levels, and these tools require tissue samples rather than blood-based testing [83].
Essential Research Reagents and Materials
Table 3: Research Reagent Solutions for Carcimun Test Implementation
| Item | Specification | Function in Protocol |
|---|---|---|
| Blood Collection Tube | K3-EDTA tube (9 mL) | Prevents coagulation and preserves plasma components |
| Centrifuge | Standard clinical centrifuge | Separates plasma from blood cells (3,000 rpm, 5 min) |
| Saline Solution | 0.9% NaCl | Creates optimal salt environment for initial reaction |
| Diluent | Distilled water (aqua dest.) | Adjusts final reaction concentration |
| Acetic Acid Solution | 0.4% AA (with 0.81% NaCl) | Induces conformational changes in plasma proteins |
| Clinical Chemistry Analyzer | Thermo Scientific Indiko or Konelab PRIME 60 | Precisely measures optical extinction at 340 nm |
| Temperature Control Unit | 37°C incubator or heater | Maintains optimal temperature for biochemical reaction |
Discussion: Implications for Cancer Diagnostic Research
The development of the Carcimun test represents a paradigm shift in cancer diagnostics by focusing on protein conformational changes rather than genetic alterations. This approach aligns with growing scientific recognition that protein function is determined not by static structures but by dynamic transitions between conformational states [81]. Recent advances in computational methods, including AlphaFold2-based pipelines like CF-random, are now enabling large-scale prediction of alternative protein conformations, potentially illuminating the structural basis for tests like Carcimun [84].
From a clinical research perspective, the Carcimun test offers two potential application scenarios: as a screening tool in asymptomatic individuals, and for early diagnosis after the occurrence of initial symptoms and unclear clinical signs [80]. The test's ability to detect multiple cancer types from a single blood draw addresses a fundamental challenge in cancer screening—that while the lifetime risk for any cancer is high, the risk for one specific cancer at a certain time is rather low [80].
However, several research questions remain. The precise molecular mechanisms underlying the observed optical changes require further elucidation. While inflammation appears to be a confounder, the differential signature between cancer and inflammation demonstrated in Study 2 suggests this limitation may be addressable through refined cutoff values or additional biomarkers [5]. Future research directions should include larger prospective validation studies, further investigation of the relationship between extinction values and tumor stage across more cancer types, and exploration of how this technology might integrate with other diagnostic modalities in a comprehensive cancer detection strategy.
The Carcimun test represents a novel approach to multi-cancer early detection based on protein conformational changes, demonstrating high sensitivity (90.6%) and specificity (98.2%) in recent validation studies that included inflammatory controls [5]. When benchmarked against other emerging platforms such as ultrasensitive ctDNA assays and AI-driven digital pathology, each technology demonstrates distinct strengths—with the Carcimun test offering a unique mechanism of action, practical implementation advantages, and performance characteristics that support its potential role in cancer screening and diagnosis.
For the research community, continued investigation into the structural basis of protein conformational changes in cancer, coupled with technical refinement of detection methodologies, promises to advance both fundamental understanding and clinical application of this innovative approach. As the field of precision cancer medicine evolves beyond genomics to incorporate multiple layers of biological information [85], protein conformational analysis may provide a valuable dimension for comprehensive cancer detection and management strategies.
A central challenge in modern oncology is the accurate differentiation of early-stage cancer from non-malignant inflammatory conditions. Many cancer biomarkers are also elevated in inflammatory states, creating diagnostic ambiguity that can lead to delayed cancer diagnosis or unnecessary invasive procedures. This comparison guide evaluates the performance of three advanced multi-cancer early detection (MCED) platforms—Carcimun, OncoSeek, and Galleri—focusing on their specific capabilities to distinguish cancer from inflammatory conditions, a critical metric for clinical utility in real-world applications.
Comparative Performance Data
The following table summarizes the key performance metrics of each MCED test from recent clinical validations, with particular attention to studies that included participants with inflammatory conditions.
Table 1: Performance Comparison of MCED Tests in Differentiating Cancer from Inflammatory Conditions
| Test Name | Technology Platform | Study Population | Sensitivity | Specificity | Accuracy | Performance in Inflammatory Conditions |
|---|---|---|---|---|---|---|
| Carcimun | Optical extinction of plasma protein conformational changes | 172 participants (80 healthy, 64 cancer, 28 inflammatory/benign) [19] [5] | 90.6% [19] [5] | 98.2% [19] [5] | 95.4% [19] [5] | Mean extinction values: Cancer=315.1, Inflammatory=62.7, Healthy=23.9 (p<0.001) [19] [5] |
| OncoSeek | 7 protein tumor markers + AI analysis | 15,122 participants (3,029 cancer, 12,093 non-cancer) across 7 cohorts [20] | 58.4% (56.6-60.1%) [20] | 92.0% (91.5-92.5%) [20] | 70.6% (TOO prediction) [20] | Specificity maintained at 92.0% in large cohort; no specific inflammatory sub-group analysis reported [20] |
| Galleri | Targeted methylation sequencing of cell-free DNA | 111,080 real-world tests; 459 with outcome data [75] | Cancer Signal Detection Rate: 0.91% (real-world) [75] | PPV: 49.4% in asymptomatic patients [75] | CSO prediction: 87% [75] | Real-world performance consistent with clinical studies; no specific inflammatory condition data reported [75] |
Table 2: Cancer Type Detection Range and Inflammatory Condition Assessment
| Test Name | Cancer Types Detected | Inflammatory Conditions Tested | Key Differentiating Metric |
|---|---|---|---|
| Carcimun | Various types (pancreatic, bile duct, liver metastasis, esophageal, stomach, GIST, peritoneal, colorectal, lung) [19] [5] | Fibrosis, sarcoidosis, pneumonia, benign tumors [19] [5] | Optical extinction value with cut-off of 120 (5.0-fold increase in cancer vs. healthy) [19] [5] |
| OncoSeek | 14 common types representing 72% of global cancer deaths (bile duct, breast, cervical, colorectal, endometrial, gallbladder, head and neck, liver, lung, lymphoma, esophageal, ovarian, pancreatic, stomach) [20] | Not specifically reported in published results [20] | AI-powered algorithm integrating 7 protein tumor markers with clinical data [20] |
| Galleri | 32 cancer types reported in real-world data [75] | Not specifically reported in real-world outcomes [75] | Methylation patterns of cell-free DNA; Cancer Signal Origin prediction [75] |
Detailed Experimental Protocols
Carcimun Test Methodology
The Carcimun test employs a unique protein-based detection system. The experimental protocol from the recent validation study was as follows [19] [5]:
Sample Preparation:
- Blood plasma samples were collected from all participants
- 70 µl of 0.9% NaCl solution was added to the reaction vessel
- 26 µl of blood plasma was added, creating a total volume of 96 µl with final NaCl concentration of 0.9%
- 40 µl of distilled water was added, adjusting volume to 136 µl and NaCl concentration to 0.63%
- The mixture was incubated at 37°C for 5 minutes for thermal equilibration
Measurement Protocol:
- Blank measurement recorded at 340 nm to establish baseline
- 80 µl of 0.4% acetic acid solution (containing 0.81% NaCl) was added
- Final volume of 216 µl with 0.69% NaCl and 0.148% acetic acid
- Final absorbance measurement performed at 340 nm using Indiko Clinical Chemistry Analyzer (Thermo Fisher Scientific)
- All measurements performed in blinded manner
Statistical Analysis:
- Previously defined cut-off value of 120 was used to differentiate healthy from cancer subjects
- This threshold was determined in an independent cohort (n=241 non-pathologic and n=114 pathologic reference samples)
- Cut-off was optimized using ROC curve analysis and Youden Index
- One-way ANOVA with Tukey- and Games-Howell post-hoc tests conducted
- p-values ≤ 0.05 considered statistically significant
OncoSeek Test Methodology
The OncoSeek test utilizes a multi-analyte approach with artificial intelligence integration [20]:
Biomarker Analysis:
- Seven protein tumor markers (PTMs) were analyzed from blood samples
- Testing performed across multiple platforms (Roche Cobas e411/e601 and Bio-Rad Bio-Plex 200)
- Consistency validated across different laboratories with Pearson correlation coefficient of 0.99-1.00
AI Integration:
- Individual clinical data integrated with PTM results
- Machine learning algorithm developed to classify cancer vs. non-cancer
- Validated across diverse populations from three countries
Study Cohorts:
- Included training cohort and multiple validation cohorts
- Symptomatic cohort assessed for early diagnosis potential
- Large-scale validation across 15,122 participants
Galleri Test Methodology
The Galleri test employs a targeted methylation approach [75]:
Methylation Analysis:
- Cell-free DNA is isolated from peripheral blood samples
- Targeted methylation sequencing performed to identify cancer-specific patterns
- Machine learning algorithms analyze methylation patterns to detect cancer signals
Cancer Signal Origin Prediction:
- Algorithms predict tissue of origin based on methylation profiles
- Intended to guide diagnostic workup following positive result
Real-World Implementation:
- Tests processed with median turnaround time of 6.1 business days
- Quality controls include sample library concentration and depth of sequencing
- Tests cancelled for insufficient blood volume, severe hemolysis, or failed QC metrics (<2% of cases)
Signaling Pathways and Biological Mechanisms
The following diagram illustrates the fundamental challenge of differentiating cancer-related signals from inflammation-induced signals across various MCED technological approaches:
Diagram 1: Technological Approaches to Differentiate Cancer from Inflammation in MCED Tests
Experimental Workflow Visualization
The following diagram illustrates the comprehensive experimental workflow used in the Carcimun test validation, which specifically addressed inflammatory conditions:
Diagram 2: Carcimun Test Experimental Workflow with Inflammatory Cohort
The Scientist's Toolkit: Research Reagent Solutions
Table 3: Essential Research Reagents and Platforms for MCED Development
| Reagent/Instrument | Manufacturer | Function in MCED Development | Example Use Case |
|---|---|---|---|
| Indiko Clinical Chemistry Analyzer | Thermo Fisher Scientific | Optical density measurement at specific wavelengths | Carcimun test absorbance measurement at 340 nm [19] [5] |
| Roche Cobas e411/e601/e401 Analyzers | Roche Diagnostics | Automated immunoassay testing for protein biomarkers | OncoSeek protein tumor marker quantification across multiple sites [20] |
| Bio-Rad Bio-Plex 200 | Bio-Rad Laboratories | Multiplex assay system for protein biomarker analysis | Alternative platform for OncoSeek protein marker analysis [20] |
| Targeted Methylation Sequencing Platform | GRAIL, Inc. | Cell-free DNA methylation pattern analysis | Galleri test cancer signal detection and origin prediction [75] |
| High-Sensitivity Protein Assays | Multiple vendors | Quantification of low-abundance protein biomarkers | Detection of protein tumor markers in blood samples [20] |
| Cell-free DNA Isolation Kits | Multiple vendors | Extraction and purification of circulating DNA from plasma | Preparation of samples for methylation analysis [75] |
Discussion
The comparative analysis reveals significant differences in how current MCED technologies address the critical challenge of differentiating cancer from inflammatory conditions. The Carcimun test demonstrates a distinct methodological approach through its focus on plasma protein conformational changes, showing statistically significant differentiation between cancer patients (mean extinction value: 315.1), those with inflammatory conditions (62.7), and healthy individuals (23.9) [19] [5]. This 5.0-fold increase in mean extinction values between cancer and healthy participants, coupled with maintained significant differences from inflammatory conditions (p<0.001), suggests potential utility in clinical scenarios where inflammatory comorbidities are present.
The Galleri test demonstrates robust real-world performance with maintenance of consistent cancer signal detection rates (0.91%) across over 100,000 tests, closely aligning with previous clinical validation studies [75]. However, the available real-world data does not specifically address performance in patients with confirmed inflammatory conditions, leaving an evidence gap for this particular diagnostic challenge.
OncoSeek shows impressive scalability across diverse populations and platforms, with consistent AUC values (0.829 in the combined cohort of 15,122 participants) and maintenance of 92.0% specificity in a large validation set [20]. The test's affordability and accessibility features make it particularly relevant for LMIC applications, though specific data on inflammatory condition differentiation remains unreported.
The differentiation of cancer from inflammatory conditions remains a significant hurdle in MCED test development. Among the three platforms compared, only Carcimun has provided specific experimental data demonstrating its capability to maintain high sensitivity (90.6%) and specificity (98.2%) while explicitly including participants with inflammatory conditions such as fibrosis, sarcoidosis, and pneumonia [19] [5]. The protein conformational change approach may offer advantages in this specific diagnostic challenge compared to methylation-based or protein biomarker-based approaches, though larger prospective studies are needed to validate these findings.
For researchers and drug development professionals, these findings highlight the importance of including inflammatory condition cohorts in MCED validation studies and suggest that combining multiple technological approaches (protein conformational changes, methylation patterns, and protein biomarkers) may optimize discrimination capabilities in clinically challenging scenarios.
A fundamental challenge in the development of modern cancer diagnostics is balancing the need for high sensitivity to detect a broad spectrum of malignancies, including rare cancers, against the necessity for high specificity to avoid false positives that lead to unnecessary patient anxiety and invasive follow-up procedures. This trade-off is particularly acute in the field of multi-cancer early detection (MCED) tests, which aim to identify multiple cancer types from a single, minimally invasive sample [86]. The analytical and clinical performance of these platforms varies significantly based on their underlying technological principles—ranging from liquid biopsy approaches that detect circulating tumor DNA (ctDNA) to protein-based detection methods and immunohistochemical (IHC) assays for specific biomarkers [86] [5]. For researchers and drug development professionals, understanding these trade-offs is critical for selecting appropriate platforms for clinical trials, developing next-generation diagnostics, and interpreting the real-world clinical utility of cancer detection technologies. This guide provides an objective comparison of current testing methodologies, supported by experimental data and detailed protocols, to inform strategic decisions in oncologic diagnostic development.
Performance Metrics Comparison Across Testing Platforms
The performance of cancer diagnostics varies substantially across technology platforms, with clear trade-offs evident between sensitivity for specific cancer types and overall specificity. The table below summarizes quantitative performance data from recent studies and validation trials.
Table 1: Performance Metrics of Cancer Detection Platforms
| Test/Platform | Cancer Types Targeted | Reported Sensitivity | Reported Specificity | Key Strengths | Key Limitations |
|---|---|---|---|---|---|
| Immunovia Next-Gen Blood Test [87] | Pancreatic Ductal Adenocarcinoma | 77% (Stage I/II), 78% (overall) | 88%-92% | Superior to CA19-9 for early-stage detection; consistent performance in high-risk subgroups | Specificity slightly below target (90%); lower performance in cysts subgroup |
| Carcimun Test [5] | Multiple Cancers (Pancreatic, Bile Duct, Esophageal, etc.) | 90.6% | 98.2% | Effectively distinguishes cancer from inflammatory conditions; high overall accuracy | Limited validation across all cancer types; small cohort for some cancers |
| MCED/Liquid Biopsy (e.g., GRAIL's Galleri) [86] | >50 Cancer Types | Varies by cancer type and stage | Not specified in data | Broad cancer detection from single blood draw; non-invasive | Lower sensitivity for early-stage cancers; cost barriers |
| HER2 Testing (IHC/FISH/SISH/CISH) [88] [89] | Breast Cancer | 95-99% (vs. FISH) | 97-98% (vs. FISH) | High concordance between methods; validated on core-needle biopsies | False positives (~1.3%) and false negatives (~0.7%) reported |
| PD-L1 IHC Testing (22C3 assay) [90] | Multiple Solid Tumors | Not directly reported | Not directly reported | Standardized biomarker for immunotherapy selection | Expression varies by tumor type; interpretation challenges |
The data reveals that specialized tests targeting specific cancer types (e.g., Immunovia for pancreatic cancer, HER2 for breast cancer) generally achieve higher sensitivity for their intended indications but lack breadth. In contrast, MCED platforms cast a wider net for cancer detection but face challenges in maintaining uniformly high sensitivity across all cancer types, particularly for early-stage and rare malignancies [86] [87]. The high specificity demonstrated by protein-based approaches like the Carcimun test is notable given the critical importance of minimizing false positives in screening contexts [5].
Experimental Protocols and Methodologies
Liquid Biopsy and MCED Protocols
Circulating Tumor DNA (ctDNA) Analysis: MCED tests such as GRAIL's Galleri use targeted methylation sequencing to detect cancer-specific patterns in ctDNA. The protocol involves: (1) blood collection in cell-stabilization tubes to preserve nucleosomal patterns; (2) plasma separation via centrifugation; (3) extraction of cell-free DNA; (4) bisulfite conversion or enzymatic treatment to preserve methylation status; (5) library preparation and next-generation sequencing targeting informative methylation regions; and (6) bioinformatic analysis using machine learning classifiers to identify cancer signals and predict tissue of origin [86]. The "Chief" AI model developed by Harvard Medical School, which achieves 94% accuracy in cancer detection, was trained on large genomic and clinical datasets to recognize these patterns [86].
Protein Conformational Analysis (Carcimun Test): This methodology detects structural changes in plasma proteins associated with malignancy through optical measurements. The standardized protocol includes: (1) preparation of a 96μl solution of 0.9% NaCl with 26μl blood plasma; (2) addition of 40μl distilled water; (3) incubation at 37°C for 5 minutes; (4) blank measurement at 340nm; (5) addition of 80μl 0.4% acetic acid solution; and (6) final absorbance measurement at 340nm using a clinical chemistry analyzer [5]. The cut-off value of 120 for differentiating healthy from cancer subjects was established through ROC curve analysis and the Youden Index in previous validation studies [5].
Immunohistochemistry and In Situ Hybridization Protocols
HER2 Testing Algorithm: The comprehensive HER2 evaluation follows a strict protocol: (1) tissue fixation in 10% neutral buffered formalin for 6-72 hours; (2) paraffin embedding and sectioning; (3) IHC staining using validated antibodies (SP3, 4B5, or Herceptest); (4) scoring by pathologists according to ASCO/CAP guidelines (0: no staining; 1+: weak partial membrane staining; 2+: weak to moderate complete membrane staining; 3+: strong complete membrane staining); (5) reflex testing with in situ hybridization (SISH, CISH, or FISH) for equivocal cases (IHC 2+); (6) ISH scoring based on HER2 gene copy number or HER2:CEP17 ratio [88] [91]. Specimens with excessive crushing or retraction artifacts are considered unsuitable for reliable interpretation [89].
PD-L1 Immunohistochemistry: The protocol varies by antibody clone but generally includes: (1) tissue sectioning from FFPE blocks; (2) deparaffinization and rehydration; (3) epitope retrieval using specific pH buffers; (4) incubation with primary antibody (22C3, 28-8, SP142, or SP263); (5) detection with visualization systems; (6) scoring using approved methods (Tumor Proportion Score for some clones, Combined Positive Score for others) [90] [92]. The 22C3 and 28-8 clones have demonstrated 61% concordance in gastric cancer, with 28-8 identifying a higher proportion of PD-L1 positive cases [92].
Technology Workflows and Signaling Pathways
Liquid Biopsy Workflow
Diagram Title: Liquid Biopsy Workflow for MCED Tests
PD-1/PD-L1 Signaling Pathway
Diagram Title: PD-1/PD-L1 Immune Checkpoint Pathway
Research Reagent Solutions and Essential Materials
Table 2: Key Research Reagents for Cancer Diagnostic Development
| Reagent/Assay | Manufacturer/Provider | Primary Research Application | Technical Notes |
|---|---|---|---|
| PD-L1 IHC Antibody Clones (22C3, 28-8, SP142, SP263) | Various (DAKO, Ventana, etc.) | Immunotherapy biomarker detection | Clones show varying sensitivity; 61% concordance between 22C3 and 28-8 in gastric cancer [90] [92] |
| HER2 IHC Antibodies (SP3, 4B5, Herceptest) | LabVision, Ventana, DAKO | HER2 status determination in breast cancer | SP3 and 4B5 show high concordance (κ=0.787-0.833) with reference methods [88] |
| In Situ Hybridization Kits (SISH, CISH, FISH) | Ventana, Abbott, etc. | HER2 gene amplification detection | SISH/CISH show excellent concordance with FISH (κ=0.94-0.96) [89] |
| MSK-IMPACT | Memorial Sloan Kettering | Comprehensive tumor mutational profiling | NGS panel covering 505 cancer genes; FDA-approved; enables precision oncology [93] |
| Cell-free DNA Extraction Kits | Various | Liquid biopsy sample preparation | Critical for MCED test performance; preservation tubes stabilize nucleosomal patterns [86] |
| Clinical Chemistry Analyzer (Indiko) | Thermo Fisher Scientific | Protein conformational analysis | Used in Carcimun test for absorbance measurements at 340nm [5] |
Discussion and Research Implications
The evolving landscape of cancer diagnostics presents researchers with strategic decisions regarding technology platform selection based on intended application. For population screening programs, MCED tests with broad cancer detection capability offer significant potential, particularly as advancements in AI and methylation patterning improve early-stage sensitivity [86]. However, the current trade-offs in specificity (typically 88-98% across platforms) remain a concern for widespread implementation, as false positives can lead to diagnostic odysseys and unnecessary procedures [87] [5].
For therapy selection applications, highly specific immunohistochemical and in situ hybridization methods provide validated approaches for biomarker detection, though challenges persist in standardization and interpretation. The development of HER2-low and HER2-ultralow categorization in breast cancer exemplifies how diagnostic refinement continues to enable more precise patient stratification for targeted therapies [91]. Similarly, PD-L1 expression assessment, despite variability between antibody clones and scoring systems, remains essential for immunotherapy selection across multiple malignancies [94] [90] [92].
Future diagnostic development should focus on multi-analyte approaches that combine the strengths of different technologies—for example, integrating ctDNA methylation analysis with protein biomarker detection—to optimize both sensitivity for rare cancers and overall specificity. Additionally, standardized reference materials and inter-laboratory proficiency testing will be crucial for ensuring reproducibility across research institutions and clinical laboratories [88] [89]. As these technologies evolve, their successful translation into clinical practice will depend on maintaining this delicate balance between detection sensitivity and specificity across the full spectrum of human malignancies.
Conclusion
The landscape of cancer diagnostics is rapidly evolving, with novel platforms like MCED tests demonstrating significant potential to detect a broader spectrum of cancers, including those without standard screening options, at earlier, more treatable stages. Key takeaways reveal a trade-off between the wide net cast by MCEDs and the high accuracy of established, tissue-based methods like FISH and IHC. Future directions must focus on validating clinical utility through large-scale prospective trials, such as those conducted by the Cancer Screening Research Network (CSRN), standardizing reporting practices across laboratories, and developing efficient diagnostic pathways for positive screening results. For biomedical research, the imperative lies in enhancing the sensitivity for early-stage and pre-malignant conditions, improving the accuracy of cancer signal origin prediction, and integrating artificial intelligence to unlock complex biomarker patterns, ultimately paving the way for a new paradigm in precision cancer screening and interception.
References
- 1. Performance measures - Assessment of cancer screening [https://www.ncbi.nlm.nih.gov/books/NBK550207/]
- 2. Sensitivity, Specificity, Positive Predictive Value, and ... [https://pmc.ncbi.nlm.nih.gov/articles/PMC8156826/]
- 3. Statistics | Sensitivity, Specificity, PPV and NPV [https://geekymedics.com/sensitivity-specificity-ppv-and-npv/]
- 4. the potential of multi-cancer early detection (MCED) ... [https://pmc.ncbi.nlm.nih.gov/articles/PMC11785667/]
- 5. Evaluation of an innovative multi-cancer early detection test [https://www.frontiersin.org/journals/oncology/articles/10.3389/fonc.2025.1520869/full]
- 6. OPTIMIZATION OF DIAGNOSTIC ELISA - BASED TESTS ... [https://pmc.ncbi.nlm.nih.gov/articles/PMC5694676/]
- 7. Hallmarks of Cancer ELISA Kits and Multiplex Immunoassays [https://www.thermofisher.com/us/en/home/life-science/antibodies/immunoassays/immunoassay-research-areas/hallmarks-cancer-immunoassays.html]
- 8. GRAIL PATHFINDER 2 Results Show Galleri® Multi ... [https://grail.com/press-releases/grail-pathfinder-2-results-show-galleri-multi-cancer-early-detection-blood-test-increased-cancer-detection-more-than-seven-fold-when-added-to-uspstf-a-and-b-recommended-screenings/]
- 9. BillionToOne's Northstar Select® Demonstrates Superior ... [https://www.billiontoone.com/news-media/billiontoones-northstar-select-r-demonstrates-superior-sensitivity-in-prospective-head-to-head-validation-study-publication]
- 10. Estimating cancer screening sensitivity and specificity using healthcare utilization data: defining the accuracy assessment interval - PMC [https://pmc.ncbi.nlm.nih.gov/articles/PMC9484579/]
- 11. Diagnostic Accuracy of Digital Mammography in the ... [https://pmc.ncbi.nlm.nih.gov/articles/PMC5991925/]
- 12. Role of computed tomography (CT) scan in staging of cervical ... [https://pmc.ncbi.nlm.nih.gov/articles/PMC4140036/]
- 13. Sensitivity, Specificity and the Diagnostic Accuracy of PET ... [https://pmc.ncbi.nlm.nih.gov/articles/PMC7880779/]
- 14. Comparison of Sensitivity and Specificity of Biparametric ... [https://pmc.ncbi.nlm.nih.gov/articles/PMC8306749/]
- 15. Next-generation sequencing in liquid biopsy : cancer screening and... [https://humgenomics.biomedcentral.com/articles/10.1186/s40246-019-0220-8]
- 16. Liquid biopsy in cancer: current status, challenges and ... [https://www.nature.com/articles/s41392-024-02021-w]
- 17. Review Liquid biopsy-based multi-cancer early detection [https://www.sciencedirect.com/science/article/pii/S2095927325006565]
- 18. Liquid biopsy – a narrative review with an update on current ... [https://pmc.ncbi.nlm.nih.gov/articles/PMC12333414/]
- 19. Evaluation of an innovative multi-cancer early detection test [https://pmc.ncbi.nlm.nih.gov/articles/PMC11922694/]
- 20. A large-scale, multi-centre validation study of an AI- ... [https://www.nature.com/articles/s41698-025-01105-2]
- 21. A Liquid Biopsy-based Multicancer Early Detection Test ... [https://www.aacr.org/about-the-aacr/newsroom/news-releases/a-liquid-biopsy-based-multicancer-early-detection-test-may-detect-early-stage-disease-and-low-dna-shedding-cancers/]
- 22. Routine Liquid Biopsies Could Substantially Reduce Late- ... [https://www.insideprecisionmedicine.com/topics/oncology/routine-liquid-biopsies-could-substantially-reduce-late-stage-cancer-diagnoses/]
- 23. Exact Sciences Announces Expanded Clinical Validation ... [https://www.exactsciences.com/newsroom/press-releases/exact-sciences-announces-expanded-clinical-validation-of-the-oncodetect-test]
- 24. a roadmap for DNA methylation biomarkers in liquid biopsies [https://www.nature.com/articles/s41388-025-03624-5]
- 25. Multimodal analysis of methylomics and fragmentomics in ... [https://elifesciences.org/articles/89083]
- 26. The advances of DNA methylation in the liquid biopsy for ... [https://www.frontiersin.org/journals/oncology/articles/10.3389/fonc.2025.1547797/full]
- 27. Cell-free DNA methylation and fragmentomics-based liquid ... [https://pmc.ncbi.nlm.nih.gov/articles/PMC12648842/]
- 28. Cell-free DNA fragmentomics in cancer [https://pubmed.ncbi.nlm.nih.gov/41043439/?dopt=abstract]
- 29. Press Releases [https://investors.guardanthealth.com/press-releases/press-releases/2025/Guardant-Health-Announces-Clinical-Result-Update-for-Shield-Blood-Based-Colorectal-Cancer-Screening-Test/default.aspx]
- 30. New Blood Test Algorithm Shows Sensitivity, Specificity in ... [https://www.cancernetwork.com/view/new-blood-test-algorithm-shows-sensitivity-specificity-in-crc-screening]
- 31. Shield Blood Test Yields High Sensitivity, Specificity for ... [https://www.onclive.com/view/shield-blood-test-yields-high-sensitivity-specificity-for-crc-screening-in-expansion-cohort-of-average-risk-adults]
- 32. Clinical Data Bolster Efficacy of Blood-Based Colorectal ... [https://www.targetedonc.com/view/clinical-data-bolsters-efficacy-of-blood-based-colorectal-cancer-screening]
- 33. National Comprehensive Cancer Network (NCCN ... [https://investors.guardanthealth.com/press-releases/press-releases/2025/National-Comprehensive-Cancer-Network-NCCN-Updates-Colorectal-Cancer-Screening-Guidelines-to-Include-Shield-Blood-Based-Screening/default.aspx]
- 34. NCCN Adds 2 Tests to CRC Screening Guidelines [https://www.onclive.com/view/nccn-adds-2-tests-to-crc-screening-guidelines]
- 35. Shield Blood Test Approved for Colorectal Cancer Screening [https://www.cancer.gov/news-events/cancer-currents-blog/2024/shield-blood-test-colorectal-cancer-screening]
- 36. Galleri Test Sensitivity & Specificity | Galleri® for HCPs [https://www.galleri.com/hcp/galleri-test-performance]
- 37. Evaluation and comparison of two commercially available ... [https://pmc.ncbi.nlm.nih.gov/articles/PMC4423502/]
- 38. Comparison of AI software tools for automated detection ... [https://www.nature.com/articles/s41598-024-78568-z]
- 39. PATHFINDER 2: Galleri MCED test detects early-stage ... [https://touchoncology.com/insight/pathfinder-2-galleri-mced-detects-early-cancers/]
- 40. GRAIL Announces Positive Top-Line Results From The Galleri® PATHFINDER 2 Registrational Study - GRAIL [https://grail.com/press-releases/grail-announces-positive-top-line-results-from-the-galleri%E2%93%A1-pathfinder-2-registrational-study/]
- 41. Unlock the potential of multi-cancer early detection [https://www.galleri.com/hcp/the-galleri-test-2]
- 42. Sensitivity and specificity of immunohistochemistry for the ... [https://pubmed.ncbi.nlm.nih.gov/40347145/]
- 43. Artificial intelligence enables precision diagnosis of ... [https://www.nature.com/articles/s41467-024-48705-3]
- 44. Comparison Approach for Identifying Missed Invasive ... [https://pmc.ncbi.nlm.nih.gov/articles/PMC9030445/]
- 45. Artificial intelligence in cytopathological applications for ... [https://pmc.ncbi.nlm.nih.gov/articles/PMC11574989/]
- 46. Non-invasive multiple cancer screening using trained ... [https://www.nature.com/articles/s41598-024-79383-2]
- 47. The Evolving Landscape of Fungal Diagnostics, Current and ... [https://pmc.ncbi.nlm.nih.gov/articles/PMC7916227/]
- 48. Guidelines for the testing and reporting of cytogenetic results for risk stratification of multiple myeloma: a report of the Cancer Genomics Consortium Plasma Cell Neoplasm Working Group | Blood Cancer Journal [https://www.nature.com/articles/s41408-025-01286-w]
- 49. Modified cIg-FISH protocol for multiple myeloma in routine cytogenetic laboratory practice - PubMed [https://pubmed.ncbi.nlm.nih.gov/24485403/]
- 50. Cytogenetic testing by fluorescence in situ hybridization is improved by plasma cell sorting in multiple myeloma | Scientific Reports [https://www.nature.com/articles/s41598-022-11676-w]
- 51. Blood-based test provides new diagnostic approach for ... [https://www.broadinstitute.org/news/blood-based-test-provides-new-diagnostic-approach-multiple-myeloma]
- 52. Estimating the Burden of False Positives and ... [https://pmc.ncbi.nlm.nih.gov/articles/PMC11912434/]
- 53. Mammogram False Positives Affect Future Screening ... [https://www.cancer.gov/news-events/cancer-currents-blog/2024/mammogram-false-positives-affect-future-screening]
- 54. Association between False-Positive Results and Return to ... [https://pmc.ncbi.nlm.nih.gov/articles/PMC11970968/]
- 55. Natera Reports Strong Advanced Adenoma Data from ... [https://www.natera.com/company/news/natera-reports-strong-advanced-adenoma-data-from-prospective-proceed-crc-trial-demonstrating-22-5-sensitivity-and-91-5-specificity/]
- 56. A sensitive and specific non-invasive urine biomarker ... [https://pubmed.ncbi.nlm.nih.gov/40903311/]
- 57. New Grail cancer test data show progress but raise questions [https://www.statnews.com/2025/10/17/grail-galleri-blood-test-cancer-screening-study-results-2025/]
- 58. Multicancer early detection test: Preclinical, translational, ... [https://pmc.ncbi.nlm.nih.gov/articles/PMC12278325/]
- 59. Innovative Approaches to Early Detection of Cancer ... [https://pmc.ncbi.nlm.nih.gov/articles/PMC12153683/]
- 60. Tumour heterogeneity - Latest research and news [https://www.nature.com/subjects/tumour-heterogeneity]
- 61. Tumor heterogeneity: causes and consequences - PMC [https://pmc.ncbi.nlm.nih.gov/articles/PMC2814927/]
- 62. Revolution of Circulating Tumor DNA [https://pmc.ncbi.nlm.nih.gov/articles/PMC12192262/]
- 63. Circulating tumor DNA to monitor treatment response in ... [https://www.nature.com/articles/s41698-025-00876-y]
- 64. Fundamentals of ctDNA Biomarkers in Tumor Precision Medicine [https://www.sciencepublishinggroup.com/article/10.11648/j.sjcm.20251404.12]
- 65. Guidance for Fluorescence in Situ Hybridization Testing ... [https://pmc.ncbi.nlm.nih.gov/articles/PMC1867444/]
- 66. Minimal Residual Disease Detection: Implications for ... [https://pmc.ncbi.nlm.nih.gov/articles/PMC12079024/]
- 67. Diagnostic Accuracy Performance of Fluorescence In Situ ... [https://www.mdpi.com/2077-0383/13/21/6457]
- 68. Automation of fluorescent in situ hybridization (FISH) ... [https://pubmed.ncbi.nlm.nih.gov/40962484/]
- 69. AI-based virtual immunocytochemistry for rapid and robust ... [https://pubmed.ncbi.nlm.nih.gov/40676643/]
- 70. Immunocytochemical examination of Akt, mTOR, and Pax-2 ... [https://www.frontiersin.org/journals/medicine/articles/10.3389/fmed.2025.1576060/full]
- 71. An overview of ELISA: a review and update on best laboratory ... [https://pmc.ncbi.nlm.nih.gov/articles/PMC11808753/]
- 72. Polymerase Chain Reaction (PCR) - StatPearls - NCBI - NIH [https://www.ncbi.nlm.nih.gov/books/NBK589663/]
- 73. Not All MCED Tests are Created Equal: The Realities of ... [https://grail.com/stories/not-all-mced-tests-are-created-equal-the-realities-of-mced-test-development-and-validation/]
- 74. Diagnostic Testing Accuracy: Sensitivity, Specificity, Predictive ... [https://www.ncbi.nlm.nih.gov/books/NBK557491/]
- 75. Real-world data and clinical experience from over ... [https://www.nature.com/articles/s41467-025-64094-7]
- 76. Why are Sensitivity and Specificity Important Parameters ... [https://www.enzo.com/note/why-are-sensitivity-and-specificity-important-parameters-for-an-elisa/]
- 77. Multiplex assays for the identification of serological ... [https://pmc.ncbi.nlm.nih.gov/articles/PMC7837364/]
- 78. A deep learning framework for automated early diagnosis ... [https://www.nature.com/articles/s41598-025-15655-9]
- 79. Experimental Blood Test Shows Promise For Detecting ... [https://www.forbes.com/sites/greglicholai/2025/10/19/experimental-blood-test-shows-promise-for-detecting-cancers-earlier/]
- 80. Prospective and single-blinded evaluation of the multi-cancer ... [https://pcm.amegroups.org/article/view/7184/html]
- 81. Beyond static structures: protein dynamic conformations ... [https://pmc.ncbi.nlm.nih.gov/articles/PMC12262120/]
- 82. Evaluation of an innovative multi-cancer early detection test [https://pubmed.ncbi.nlm.nih.gov/40115017/]
- 83. Diagnostics World - Comparison of AI Digital Pathology ... [https://friendsofcancerresearch.org/news/diagnostics-world-comparison-of-ai-digital-pathology-tools-finds-means-to-measure-performance/]
- 84. Large-scale predictions of alternative protein ... [https://www.nature.com/articles/s41467-025-60759-5]
- 85. Precision cancer medicine 2025: some concerns - PMC [https://pmc.ncbi.nlm.nih.gov/articles/PMC12439214/]
- 86. The Breakthrough in Early Cancer Detection: Multi-Cancer Screening [https://blog.marketresearch.com/the-breakthrough-in-early-cancer-detection-multi-cancer-screening]
- 87. Next-Generation Test Shows Sensitivity/Specificity in Pancreatic Cancer | CancerNetwork [https://www.cancernetwork.com/view/next-generation-test-shows-sensitivity-specificity-in-pancreatic-cancer]
- 88. Determining sensitivity and specificity of HER2 testing in ... [https://pmc.ncbi.nlm.nih.gov/articles/PMC3446356/]
- 89. Accuracy of HER2 status determination on breast core- ... [https://www.nature.com/articles/modpathol2011201]
- 90. Immunohistochemical detection of PD-L1 among diverse ... [https://www.sciencedirect.com/science/article/pii/S0893395222010420]
- 91. International Expert Consensus Recommendations for ... [https://www.sciencedirect.com/science/article/pii/S0893395225002236]
- 92. PD-L1 expression in gastric cancer assessed with ... [https://www.nature.com/articles/s41598-025-25055-8]
- 93. Next-Generation Tumor Genetic Testing | Memorial Sloan Kettering Cancer Center [https://www.mskcc.org/cancer-care/diagnosis-treatment/diagnosing/next-generation-tumor-genetic-testing]
- 94. PD-L1 expression in human cancers and its association ... [https://pmc.ncbi.nlm.nih.gov/articles/PMC4990391/]