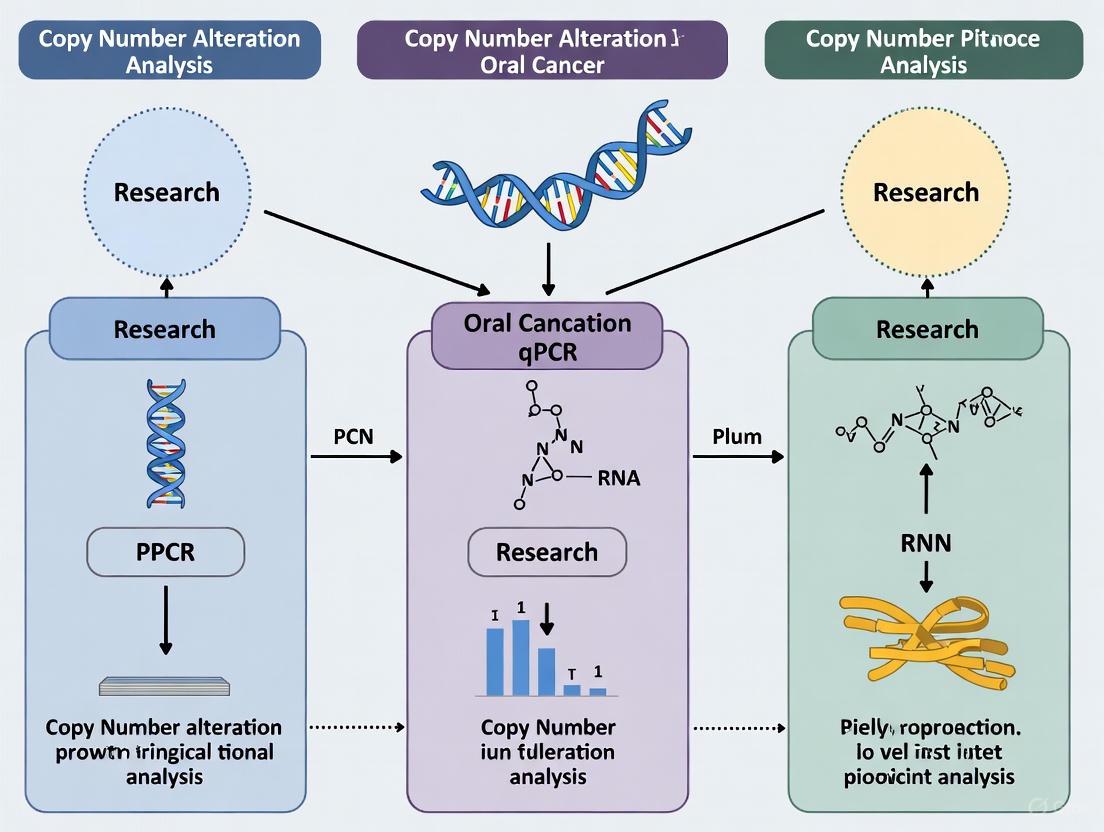
qPCR for Copy Number Alteration Analysis in Oral Cancer: A Comprehensive Guide for Biomarker Validation and Clinical Research
Copy number alterations (CNAs) are critical drivers of oral squamous cell carcinoma (OSCC), influencing oncogene activation, tumor suppressor silencing, and patient prognosis.
qPCR for Copy Number Alteration Analysis in Oral Cancer: A Comprehensive Guide for Biomarker Validation and Clinical Research
Abstract
Copy number alterations (CNAs) are critical drivers of oral squamous cell carcinoma (OSCC), influencing oncogene activation, tumor suppressor silencing, and patient prognosis. This article provides a comprehensive resource for researchers and drug development professionals on the application of quantitative PCR (qPCR) for CNA analysis. We explore the foundational role of CNAs in OSCC pathogenesis, detail robust qPCR methodologies from assay design to data analysis, and offer practical troubleshooting guidance. Furthermore, we present a critical comparison of qPCR with emerging technologies like nCounter NanoString and digital PCR, evaluating their concordance and clinical utility for biomarker validation. This guide aims to equip scientists with the knowledge to implement precise, reliable qPCR-based CNA detection in oral cancer research.
The Critical Role of Copy Number Alterations in Oral Cancer Pathogenesis and Prognosis
Copy number alterations (CNAs), defined as somatic gains or losses of genomic DNA, are fundamental drivers of tumorigenesis. These alterations play a critical role in activating oncogenes through amplification and inactivating tumor suppressor genes via deletion, thereby contributing significantly to cancer development and progression [1] [2]. In oral squamous cell carcinoma (OSCC), which represents over 50% of all head and neck squamous cell carcinomas, CNAs are imperative in determining patient prognostic and predictive status [1] [3]. The detection of recurrent CNAs provides a powerful means to assess malignant potential and understand disease biology, offering valuable insights for clinical management [2].
Techniques for CNA Detection
Comparison of Major Methodologies
Several technological platforms are available for detecting CNAs, each with distinct advantages and limitations. The selection of an appropriate validation technique is crucial to exclude the probability of random events and false-positive/negative results [1].
Table 1: Comparison of CNA Detection Techniques
| Method | Principle | Key Applications | Multiplexing Capacity | Key Considerations |
|---|---|---|---|---|
| Real-time PCR | Quantitative fluorescence monitoring of amplification cycles | Gold standard for validating global genomic profiling; clinical diagnostics | Relatively fewer genes | Robust, established method; requires reference genes [1] |
| nCounter NanoString | Hybridization with color-coded probes; direct digital readout | Customized multiplex analysis; rapid targeted profiling | Up to 800 genes | No enzymatic reactions required; high sensitivity [1] |
| Droplet Digital PCR (ddPCR) | Partitioning and endpoint PCR quantification | Absolute quantification; submicroscopic deletion detection; viral load assessment | Moderate multiplexing | Absolute quantification without standard curves; high sensitivity [2] |
| Microarrays (CGH/SNP) | Comparative hybridization or polymorphism analysis | Genome-wide CNA profiling | Genome-wide | Broad coverage but may miss submicroscopic alterations [2] |
Correlation Between Platforms
Studies have demonstrated variable correlation between different CNA detection platforms. A comprehensive comparison of real-time PCR and nCounter NanoString in 119 oral cancer samples across 24 genes revealed Spearman's rank correlation ranging from r = 0.188 to 0.517, showing weak to slightly moderate correlation [1]. Cohen's kappa score showed moderate to substantial agreement between these platforms. When comparing ddPCR with established methods, correlation coefficients for OSCC cell lines were determined to be 0.92 (ddPCR versus CGH array) and 0.95 (ddPCR versus SNP array), indicating strong agreement [2].
CNA Analysis by Real-Time PCR: Detailed Experimental Protocol
Primer and Probe Design Considerations
Design and selection of primers and probes are critical for robust CNA detection. Current design software (e.g., PrimerQuest, Primer Express) can select primer and probe sets from user-provided nucleic acid sequences [4]. Key considerations include:
- Design and empirically test at least 3 primer and probe sets
- Confirm specificity against host genome using tools like NCBI's Primer Blast
- Screen candidates in relevant biological matrices from study species
- For probe-based detection, TaqMan hydrolysis probes provide additional specificity and multiplexing capability [4]
Standard Curve Generation Using Artificial Templates
Absolute quantification in qPCR requires standard curves plotted from known concentrations of template DNA [5].
- Template Options: Plasmids, oligonucleotides, or purified PCR products
- gBlocks Gene Fragments: Double-stranded DNA fragments (up to 3000 bp) serve as excellent alternatives, allowing incorporation of multiple control amplicon sequences into a single construct [5]
- Dilution Scheme: Use at least five data points over several orders of magnitude (5- to 10-fold dilutions)
- Multi-target Standards: Combining control templates onto a single construct reduces pipetting error and experimental variability [5]
Experimental Workflow for CNA Detection
The following diagram illustrates the complete workflow for CNA analysis using real-time PCR:
qPCR Reaction Setup and Data Analysis
Reaction Components:
- DNA template (10-100 ng)
- Primer and probe sets (target and reference genes)
- Master mix (including DNA polymerase, dNTPs, buffers)
- Water to final volume (typically 10-20 μL)
Thermal Cycling Conditions:
- Initial denaturation: 95°C for 10 minutes
- 40 cycles of:
- Denaturation: 95°C for 15 seconds
- Annealing/Extension: 60°C for 1 minute
Data Analysis Methods:
- Absolute Quantification: Using standard curves to determine exact copy number
- Relative Quantification (ΔΔCt method): Comparing Ct values of target genes in tumor vs. normal tissue, normalized to reference genes
- Quality Control: Adherence to MIQE guidelines for publication-quality data [1] [4]
Essential Reagents and Research Solutions
Table 2: Essential Research Reagent Solutions for CNA Analysis by qPCR
| Reagent/Category | Specific Examples | Function/Application | Validation Requirements |
|---|---|---|---|
| Primer/Probe Sets | TaqMan assays; custom-designed primers | Target-specific amplification | Specificity testing in gDNA; efficiency determination [4] |
| Standard Curve Templates | gBlocks Gene Fragments; plasmids | Absolute quantification reference | Accurate quantification; sequence verification [5] |
| Reference DNA | Female pooled DNA; commercial human genomic DNA | Diploid copy number control | Quality assessment; concentration verification [1] |
| Reference Genes | Ta2776, eF1a, Cyclophilin (tissue-dependent) | Normalization control | Stability testing across tissues; minimal copy number variation [6] |
| qPCR Master Mix | HOT FIREPol EvaGreen; TaqMan Master Mix | Enzymatic amplification | Optimization for specific platform; validation with controls [6] |
Biological Significance of CNAs in Oral Cancer
Key Genetic Alterations in OSCC
CNAs in oral cancer affect critical cancer-related genes and pathways. Research has identified specific CNAs associated with prognosis in OSCC, including amplifications in genes such as ANO1, DVL1, ISG15, MVP, SOX8, and TNFRSF4, which were observed in more than 50% of samples in real-time PCR analyses [1]. Significant deletions have been documented in tumor suppressor genes including FAT1, CDKN2A, and FHIT, with some representing submicroscopic homozygous deletions that may be missed by some detection platforms [2].
Prognostic Implications
The prognostic significance of CNAs in oral cancer has been extensively demonstrated:
- In real-time PCR analysis, ISG15 was associated with better prognosis for RFS, DSS, and OS, while ATM, CASP4, and CYB5A correlated with poor RFS [1]
- Paradoxically, in nCounter NanoString analysis, ISG15 was associated with poor prognosis, highlighting platform-specific differences in clinical correlations [1]
- CDK11A showed association with poor prognosis for RFS in NanoString analysis [1]
- Novel cuproptosis-related lncRNAs have emerged as potential prognostic biomarkers, with an 8-CRL model effectively stratifying OSCC patients into high- and low-risk groups [3]
The following diagram illustrates how CNAs contribute to oral cancer pathogenesis through their effects on key cellular pathways:
Applications in Drug Development and Clinical Translation
The use of qPCR for CNA analysis extends beyond basic research into drug development pipelines. PCR-based technologies are extensively used to answer bioanalytical questions for novel modalities such as cell and gene therapies [4]. Specific applications in regulated bioanalysis include:
- Biodistribution Studies: Characterizing the distribution and persistence of gene/cell therapy products [4]
- Pharmacodynamic Biomarkers: Monitoring CNA changes in response to targeted therapies
- Companion Diagnostic Development: Validating CNA-based patient stratification assays
- Viral Shedding Studies: Quantifying release of virus-based gene therapy products [4]
For regulatory submissions, assay validation should include assessments of accuracy, precision, sensitivity, specificity, and robustness, with acceptance criteria appropriate to the context of use [4].
Copy number alterations (CNAs), defined as somatic gains or losses of genomic DNA, are fundamental drivers in oral squamous cell carcinoma (OSCC) tumorigenesis [2] [7]. These structural variations can lead to the activation of proto-oncogenes through amplification or inactivation of tumor suppressor genes via deletion [8]. The pattern of recurrent CNAs represents a hallmark of OSCC genomes, with specific chromosomal regions consistently altered across different patient populations [8] [9]. The progression from oral premalignant lesions to invasive carcinomas involves a sequential accumulation of these genetic changes, with the frequency and extent of alterations increasing with disease progression [7]. Understanding these recurrent CNAs provides crucial insights into OSCC pathogenesis and offers potential biomarkers for risk stratification, prognosis, and targeted therapy.
Common Recurrent CNAs in OSCC
Genome-wide profiling studies utilizing array comparative genomic hybridization (aCGH) and next-generation sequencing have identified consistent patterns of CNAs in OSCC. The most frequently amplified chromosomal regions include 3q, 5p, 7p, 8q, 9p, 11q, and 20q, while recurrent deletions predominantly occur at 3p, 4q, 8p, 9p, and 18q [7] [8]. These alterations often target key cancer-related genes that regulate critical cellular processes including cell cycle progression, signal transduction, and apoptosis.
Table 1: Frequently Amplified Genomic Regions in OSCC
| Chromosomal Region | Frequency Range | Key Candidate Genes |
|---|---|---|
| 3q | 36.5% [7] | TP63, PIK3CA |
| 5p | 23% [7] | TERT [2] |
| 7p | 21-72% [7] [9] | EGFR, MGAM [9] |
| 8q | 47-80% [7] [9] | MYC, LRP12 [8] |
| 9p | 10-54% [7] [9] | MLLT3 [7], CDKN2A (in some contexts) [10] |
| 11q | 45-57% [7] [9] | CCND1 [2] [8] |
| 20q | 31-61% [7] [9] | Multiple potential oncogenes |
Table 2: Frequently Deleted Genomic Regions in OSCC
| Chromosomal Region | Frequency Range | Key Candidate Genes |
|---|---|---|
| 3p | 37-54% [7] [9] | FHIT, CTNNB1 |
| 4q | Not specified | FAT1 [2] |
| 8p | 18% [7] | Multiple tumor suppressor genes |
| 9p | 10% [7] | CDKN2A [2] |
| 18q | 11% [7] | DCC, SMAD4 |
The co-alteration of specific regions, particularly co-amplification of 7p, 8q, 9p, and 11q, has been associated with advanced tumor stage, lymph node metastasis, and poor survival outcomes [8]. These CNA patterns not only provide prognostic information but may also reveal vulnerabilities that can be therapeutically exploited.
Biological and Clinical Implications
Impact on Key Signaling Pathways
Recurrent CNAs disrupt core signaling pathways that govern cell proliferation, survival, and differentiation. The diagram below illustrates how common CNA-driven gene alterations converge on key oncogenic pathways in OSCC.
Clinical Correlations and Prognostic Significance
The clinical significance of CNAs extends beyond tumorigenesis to influence disease behavior and patient outcomes. Specific CNA patterns correlate with advanced disease features, including larger tumor size (T3-T4), lymph node metastasis, and advanced pathological staging [8]. Co-amplification of regions on 7p, 8q, 9p, and 11q has been identified as an independent prognostic factor associated with significantly poorer survival in OSCC patients [8]. Furthermore, CNA profiles differ between etiological subtypes; for instance, betel quid chewing-associated OSCC shows distinct alterations, including copy gains of MAP3K13 and FADD and copy losses of CDKN2A [10].
The presence of CNAs can precede morphological changes during oral carcinogenesis. In oral leukoplakia, the detection of specific CNAs, particularly loss of 3p14 and gain of 20p11, provides powerful predictive value for malignant transformation risk stratification [11]. This highlights the potential clinical utility of CNA analysis in identifying high-risk premalignant lesions requiring intensified monitoring or intervention.
Analysis Methodologies and Technical Approaches
qPCR and Digital PCR-Based Detection
Quantitative PCR (qPCR) and droplet digital PCR (ddPCR) offer sensitive, targeted approaches for CNA detection that are particularly suitable for clinical validation of specific genomic regions. The workflow below outlines the key steps in a multiplexed ddPCR assay for OSCC-associated CNAs.
TaqMan-based qPCR assays provide a robust orthogonal method for validating CNAs detected through genome-wide screens. These assays demonstrate excellent agreement with microarray and next-generation sequencing platforms while offering advantages for analyzing formalin-fixed, paraffin-embedded (FFPE) samples with input DNA requirements as low as 5-20 ng [2] [12]. The high sensitivity of ddPCR enables detection of submicroscopic homozygous deletions, such as those affecting CDKN2A and FHIT, which may be missed by conventional CGH arrays [2].
The Scientist's Toolkit: Essential Research Reagents
Table 3: Key Research Reagents for CNA Analysis in OSCC
| Reagent/Assay | Function/Application | Specifications/Considerations |
|---|---|---|
| Multiplexed ddPCR Assay [2] | Detection of recurrent CNAs at 24 target loci | Includes 13 reference loci; compatible with FFPE-DNA; detects HPV16/18 |
| TaqMan Copy Number Assays [12] | Targeted CNA detection by qPCR | Compatible with low FFPE-DNA input (5-20 ng); validated for 13 cancer genes |
| OncoScan FFPE Express 2.0 [7] | Genome-wide CNA profiling from FFPE samples | Requires <80 ng input DNA; works with degraded DNA (40 bp probes) |
| SurePrint G3 Human CGH 1x1M [9] | High-resolution aCGH | 974,016 probes; ~2.1 kb resolution; requires high-quality DNA |
| DNeasy Blood & Tissue Kit [8] [9] | DNA extraction from fresh-frozen/FFPE tissue | Suitable for downstream CGH, qPCR, and NGS applications |
The comprehensive characterization of recurrent CNAs in OSCC has revealed consistent patterns of genomic instability that drive tumor development and progression. These alterations target key genes regulating critical cellular pathways and hold significant clinical relevance for diagnosis, prognosis, and risk stratification. The integration of targeted detection methods, particularly qPCR and ddPCR assays, into research protocols provides practical approaches for validating and monitoring these genomic alterations in clinical specimens. As our understanding of OSCC genomics deepens, CNA profiling promises to enhance personalized treatment strategies and ultimately improve outcomes for patients with this challenging malignancy.
Copy number alterations (CNAs) are a hallmark of genomic instability and play a crucial role in the initiation and progression of oral squamous cell carcinoma (OSCC). These somatic changes, involving the gain or loss of genomic material, are common drivers of tumorigenesis [2]. The identification of recurrent CNAs provides critical insights into the molecular pathogenesis of OSCC and offers potential biomarkers for early detection, prognosis, and targeted therapy. Among the numerous genetic alterations observed in OSCC, CNAs affecting CCND1, CDKN2A, FAT1, and EGFR emerge as particularly significant based on their frequency and functional impact on key cellular pathways. This application note delineates the biological implications of these CNAs within OSCC pathophysiology and provides detailed protocols for their detection using quantitative PCR (qPCR)-based methods, supporting advanced research and drug development initiatives.
Biological Significance of Key CNAs in OSCC
Frequency and Clinical Correlation of CNAs
CNAs in OSCC demonstrate distinctive frequency patterns and associations with clinicopathological parameters, underscoring their clinical relevance. The table below summarizes the prevalence and clinical correlations of key gene CNAs in OSCC.
Table 1: Prevalence and Clinical Correlations of Key Gene CNAs in OSCC
| Gene | CNA Type | Frequency in OSCC | Associated Clinical Parameters |
|---|---|---|---|
| EGFR | Gain/Amplification | 31% (79/257 cases) [13] | Advanced tumor stage, lymph node metastasis, higher tumor differentiation grade [13] |
| CCND1 | Gain/Amplification | 53% (135/257 cases) [13] | Advanced tumor stage, lymph node metastasis, higher tumor differentiation grade, alcohol drinking [13] |
| CDKN2A | Loss/Deletion | 26.1% in oral leukoplakias [14] | More common in lesions progressing to OSCC [14] |
| FAT1 | Loss/Deletion | Within common deleted region 4q35.2 [15] | Mutations and expression changes linked to prognosis [16] |
The co-occurrence of EGFR and CCND1 CNAs is particularly notable, observed in 22% (56/257) of OSCC samples [13]. This co-alteration exhibits synergistic effects, demonstrating significant associations with advanced tumor stage, lymph node metastasis, and poorer tumor differentiation [13]. The coordinated amplification of these genes suggests they play interconnected roles in OSCC pathogenesis.
Impact on Signaling Pathways and Cellular Processes
The identified CNAs converge on critical cellular pathways that govern tumor growth and survival:
- Cell Cycle Dysregulation: CCND1 (Cyclin D1) amplification and CDKN2A (p16INK4A) deletion represent complementary mechanisms disrupting the G1/S cell cycle checkpoint. CCND1 amplification increases cyclin D1 protein levels, promoting cell cycle progression, while CDKN2A deletion removes a critical inhibitor of CDK4/6, further accelerating G1/S transition [14] [13] [17].
- Proliferation and Survival Signaling: EGFR amplification enhances signaling through the MAPK and PI3K-AKT pathways, driving cellular proliferation and inhibiting apoptosis [15] [13]. This pathway interacts with CCND1, a downstream effector, creating a potent oncogenic axis.
- Context-Dependent Tumor Modulation: FAT1 exhibits dualistic functions, acting as either a tumor suppressor or oncogene in a context-dependent manner [18] [16]. In OSCC, evidence suggests an oncogenic role where its upregulation promotes proliferation, inhibits apoptosis, and correlates with poor prognosis [18]. Its deletion is also identified as a significant event in OSCC genomes [15].
The following pathway diagram illustrates how CNAs in these key genes disrupt normal cellular processes in OSCC:
Diagram 1: Key gene CNA pathways in OSCC. EGFR and CCND1 amplifications drive cell cycle and proliferation, CDKN2A deletion removes cell cycle inhibition, and FAT1 alterations affect migration and proliferation pathways.
Experimental Protocols for CNA Detection
This section provides a detailed methodology for detecting somatic copy number variations (SCNVs) of CCND1, CDKN2A, FAT1, and EGFR using quantitative PCR (qPCR)-based methods, adaptable for droplet digital PCR (ddPCR).
Multiplex qPCR Assay for CDKN2A Deletion
The P16-Light assay is a multiplex qPCR method designed to target a specific 5.1-kb common deletion region (CDR) within the CDKN2A gene, which is found in over 90% of cancers with CDKN2A deletion [17].
Table 2: P16-Light Assay Components and Reagents
| Component | Function | Details/Sequence |
|---|---|---|
| Primers/Probes for CDKN2A | Amplify target CDR in intron-2 | Custom-designed per Bacon Designer 8 software [17] |
| Primers/Probes for GAPDH | Endogenous control for normalization | Commercially available or custom-designed [17] |
| TaqMan Universal Master Mix | PCR reaction components | Includes uracil-N-glycosylase (UNG) for carryover prevention [17] |
| Genomic DNA Sample | Analytic | 5-10 ng per reaction, extracted via standard phenol/chloroform method [17] |
| Control DNA (RKO cells) | Positive control for 2 wild-type CDKN2A alleles | Human colorectal carcinoma cell line [17] |
| Control DNA (A549 cells) | Negative control for 0 CDKN2A alleles | Human lung carcinoma cell line [17] |
Procedure:
- DNA Preparation: Extract high-quality genomic DNA from OSCC tissue and matched surgical margin (control) samples. Quantify DNA using a spectrophotometer and dilute to a working concentration of 5-10 ng/µL [17].
- Reaction Setup: Prepare a 20 µL reaction mix containing:
- 5-10 ng of input DNA
- 10 µM each of forward and reverse primers and probe for CDKN2A intron-2
- 10 µM each of forward and reverse primers and probe for GAPDH
- 10 µL of 2x TaqMan Universal Master Mix II with UNG [17].
- qPCR Run: Perform amplification in a real-time PCR system with the following conditions:
- Initial Incubation: 95°C for 10 minutes
- 40 Cycles:
- Denaturation: 95°C for 20 seconds
- Annealing/Extension: 58°C for 60 seconds [17].
- Data Analysis:
- Calculate the ΔCt value (Ct[CDKN2A] - Ct[GAPDH]) for each sample.
- Determine the relative copy number using the 2^(-ΔΔCt) method, normalizing tumor DNA to matched control DNA.
- A sample is defined as positive for CDKN2A deletion if its relative copy number is significantly lower than the paired control sample [17].
The workflow for this assay is summarized in the following diagram:
Diagram 2: CDKN2A CNA detection workflow. The process involves DNA extraction, multiplex qPCR, Ct analysis, and copy number determination to classify genetic status.
Detection of CCND1 and EGFR Amplifications
The copy number gains of CCND1 and EGFR can be validated using TaqMan Copy Number (CN) assays and fluorescence in situ hybridization (FISH), respectively, adapted for qPCR/ddPCR detection [13].
CCND1 TaqMan CN Assay:
- Assay Selection: Use a commercially available TaqMan copy number assay specific for the CCND1 locus (11q13.3) and a reference assay (e.g., RNase P) [13].
- qPCR/ddPCR Setup: Prepare reactions according to the manufacturer's protocol. For ddPCR, partition the sample into nanodroplets.
- Amplification and Analysis: Perform PCR amplification. For ddPCR, count the positive droplets for target and reference. Calculate the copy number relative to the diploid control. A sample with a relative copy number > 2.5 is typically considered amplified [13].
EGFR FISH Validation (Reference Method):
- While FISH is not a qPCR method, it serves as an orthogonal validation technique. The protocol involves hybridizing locus-specific probes for EGFR (7p11.2) and a centromeric reference probe (CEN 7) on FFPE tissue sections. Amplification is defined by a specific signal pattern (e.g., EGFR/CEN7 ratio ≥ 2.0 or clustered signals) [14] [13].
Considerations for FAT1 Alteration Analysis
FAT1 can undergo both copy number losses [15] and mutational events [16]. While the COSMIC database can be consulted to identify common deleted regions for CNA assay design [17], a comprehensive analysis of FAT1's role should also include sequencing to detect inactivating mutations and qRT-PCR to evaluate its mRNA expression levels, which are frequently upregulated in OSCC and correlate with poor prognosis [18].
The Scientist's Toolkit
Table 3: Essential Research Reagent Solutions for CNA Analysis in OSCC
| Reagent / Material | Function / Application | Example / Specification |
|---|---|---|
| TaqMan Copy Number Assays | Target-specific quantification of gene copy number. | CCND1 (11q13.3), EGFR (7p11.2) assays with reference assay [13]. |
| Custom qPCR Primers/Probes | Detection of non-standard targets like specific CDRs. | Designed for CDKN2A CDR or FAT1 CDR using Bacon Designer or similar software [17]. |
| Cell Line DNA Controls | Essential positive and negative controls for assay validation. | RKO cells (2 wild-type CDKN2A alleles), A549 cells (0 CDKN2A alleles) [17]. |
| TaqMan Universal Master Mix | Provides optimized buffer, enzymes, and dNTPs for robust qPCR. | Includes UNG enzyme to prevent amplicon carryover contamination [17]. |
| High-Quality Genomic DNA | The primary analytic for CNA detection. | Extracted from FFPE or fresh-frozen tissue; purity (A260/A280) of ~1.8 [17]. |
The coordinated CNAs of CCND1, CDKN2A, FAT1, and EGFR are pivotal events in OSCC biology, driving tumorigenesis through the disruption of core cellular pathways including cell cycle control, proliferation signaling, and migration. The detailed qPCR protocols provided herein—particularly the sensitive P16-Light assay for CDKN2A deletion—offer robust, accessible methods for detecting these critical genetic alterations in clinical and research samples. The quantification of these CNAs provides valuable insights for prognostic stratification and the development of targeted therapeutic strategies, ultimately contributing to improved patient outcomes in oral cancer.
Copy number alterations (CNAs), comprising genomic gains and losses, are fundamental drivers in the pathogenesis and progression of oral squamous cell carcinoma (OSCC). These somatic changes can activate oncogenes or inactivate tumor suppressor genes, making them imperative for determining a patient's prognostic and predictive status [19]. Within the broader thesis on CNA analysis in oral cancer via qPCR, this document establishes the critical link between specific CNAs and clinical outcomes such as survival and treatment response. It provides detailed application notes and validated protocols to enable researchers and drug development professionals to robustly identify, validate, and implement these biomarkers in preclinical and clinical research.
CNAs as Prognostic Indicators in Oral Cancer
The prognostic value of CNAs in OSCC is demonstrated by their consistent correlation with key survival metrics, including recurrence-free survival (RFS), disease-specific survival (DSS), and overall survival (OS). The association between specific gene CNAs and patient prognosis, however, can be method-dependent, underscoring the need for thoroughly validated assays [19].
Table 1: Prognostic Gene CNAs Validated by Real-Time PCR and nCounter NanoString
| Gene | Technique | Associated Survival Outcome | Hazard Ratio (HR) [95% CI] | P-value | Prognostic Impact |
|---|---|---|---|---|---|
| ISG15 | Real-time PCR | RFS | HR 0.40 [0.20—0.81] | 0.009 | Better Prognosis |
| DSS | HR 0.31 [0.13—0.74] | 0.005 | Better Prognosis | ||
| OS | HR 0.30 [0.13—0.68] | 0.002 | Better Prognosis | ||
| ISG15 | nCounter NanoString | RFS | HR 3.40 [1.52—7.57] | 0.001 | Poor Prognosis |
| DSS | HR 3.42 [1.30—8.97] | 0.008 | Poor Prognosis | ||
| OS | HR 3.07 [1.18—7.97] | 0.015 | Poor Prognosis | ||
| CASP4 | Real-time PCR | RFS | HR 3.32 [1.29—8.48] | 0.008 | Poor Prognosis |
| CYB5A | Real-time PCR | RFS | HR 4.77 [1.85—12.30] | 0.000 | Poor Prognosis |
| ATM | Real-time PCR | RFS | HR 2.55 [1.00—6.51] | 0.041 | Poor Prognosis |
| CDK11A | nCounter NanoString | RFS | HR 2.54 [1.27—5.08] | 0.006 | Poor Prognosis |
Beyond specific gene alterations, broader genomic instability also holds prognostic power. For instance, a multiplexed droplet digital PCR (ddPCR) assay targeting common recurrent CNA loci in OSCC (e.g., on chromosomes 3q, 5p, 8q, 11q) can differentiate between benign oral lesions and those at high risk of progressing to cancer [2]. The ability to detect small, submicroscopic homozygous deletions (HDs), such as in the CDKN2A tumor suppressor gene at 9p21.3, is particularly valuable as these events are strong drivers of tumorigenesis but can be missed by lower-resolution techniques like array comparative genomic hybridization (aCGH) [2].
Correlation of CNA Detection Techniques
Selecting an appropriate validation technique is paramount to exclude random events and false-positive/negative results. A comprehensive cross-platform assessment of real-time PCR and the nCounter NanoString system in 119 OSCC samples for 24 genes provides critical performance data [19] [1].
Table 2: Comparison of Real-Time PCR and nCounter NanoString for CNA Analysis
| Parameter | Real-Time PCR | nCounter NanoString |
|---|---|---|
| Principle | Quantitative; monitors DNA amplification in real-time using fluorescent probes | Hybridization-based; uses color-coded probes for direct target measurement |
| Key Advantages | Considered the gold standard for validation; high sensitivity; compatible with FFPE DNA | No enzymatic reaction required; high multiplex capability (up to 800 targets); less laborious; digital readout |
| Throughput | Medium; typically validates fewer genes per run | High; can profile many targets simultaneously |
| DNA Input | Compatible with low input from FFPE samples (optimized at 5-20 ng) [12] | Requires sufficient DNA (insufficient DNA in 8/127 samples in one study [19]) |
| Sample Processing | Reactions performed in quadruplets per MIQE guidelines [19] | All reactions performed singly, as per manufacturer's guidelines [19] |
| Inter-platform Correlation (Spearman's r) | Weak to moderate correlation for most genes (r = 0.188 to 0.517) [19] | |
| Concordance (Cohen's Kappa) | Moderate to substantial agreement for 8/24 genes; slight to fair for 5; no agreement for 9 [19] |
The comparison revealed that while real-time PCR remains a robust and reliable method for validating genomic biomarkers, the correlation and agreement between the two platforms were variable. This highlights that observations from a single platform, especially for genes with weak correlation, should be rigorously validated in independent studies [19].
Experimental Protocols
Protocol 1: Validating CNAs using TaqMan-based Real-Time PCR
This protocol is optimized for validating CNAs in formalin-fixed, paraffin-embedded (FFPE) solid tumor samples [12].
Workflow
The following diagram illustrates the complete experimental workflow:
Materials and Equipment
- DNA Source: FFPE tissue sections or freshly frozen tissue. DNA is extracted using standard methods (e.g., phenol-chloroform) and quantified using a fluorometer.
- TaqMan Copy Number Assays: Includes sequence-specific forward and reverse primers and a FAM dye-labeled TaqMan probe for the target gene. A VIC dye-labeled TaqMan assay for a reference gene (e.g., RNase P) is required [12].
- TaqMan Genotyping Master Mix: Contains all necessary components for the PCR reaction.
- Real-Time PCR System: Any standard instrument (e.g., Applied Biosystems 7500 Fast Dx).
- Optical 96-well reaction plates and seals.
Step-by-Step Procedure
- DNA Input Optimization: Use 5-20 ng of total DNA per reaction. Assay sensitivity is maintained down to 5 ng input without affecting efficiency [12].
- Reaction Setup: Prepare reactions in quadruplets as per MIQE guidelines [19]. Each 20 µL reaction should contain:
- 1X TaqMan Genotyping Master Mix
- 1X TaqMan Copy Number Assay (Target)
- 1X Taman Copy Number Reference Assay
- 5-20 ng DNA Template
- Nuclease-free water to volume.
- Thermal Cycling Conditions:
- Hold Stage: 95°C for 10 min (enzyme activation)
- PCR Stage (40 cycles): 95°C for 15 sec (denaturation) → 60°C for 1 min (annealing/extension)
- Data Analysis: Use the CopyCaller software or the comparative Ct (ΔΔCt) method for analysis. The ΔΔCt method involves:
- Calculate ΔCt for each sample: ΔCt (Target) = Ct (Target Gene) - Ct (Reference Gene).
- Calculate ΔΔCt: ΔΔCt = ΔCt (Test Sample) - ΔCt (Calibrator Sample e.g., pooled normal DNA).
- Determine Copy Number: Copy Number = 2 × 2^(-ΔΔCt). A diploid genome is expected to have a copy number of 2.
Protocol 2: Multiplexed ddPCR for CNA Detection
Droplet digital PCR offers absolute quantification of copy number without the need for a standard curve and is highly sensitive in detecting submicroscopic alterations [2].
Workflow
Materials and Equipment
- QX200 Droplet Digital PCR System (Bio-Rad): Including a droplet generator and a droplet reader.
- DG32 Cartridges and Gaskets
- TaqMan Assays for target and reference loci.
- ddPCR Supermix for Probes (No dUTP)
- C1000 Touch Thermal Cycler with a deep-well reaction plate adapter.
Step-by-Step Procedure
- Assay Design: Design primers and probes to target recurrent CNA loci in OSCC (e.g., 3q, 5p, 8q, 9p, 11q) and multiple stable reference loci dispersed across the genome [2].
- Reaction Setup: Prepare a 20 µL reaction mixture containing:
- 1X ddPCR Supermix for Probes
- Target and Reference Assays (optimized concentrations)
- 5-50 ng of genomic DNA.
- Droplet Generation: Transfer the reaction mix to a DG32 cartridge, place a gasket, and generate droplets using the QX200 Droplet Generator.
- PCR Amplification: Carefully transfer the emulsified droplets to a 96-well PCR plate. Seal the plate and run on a thermal cycler with the following profile:
- 95°C for 10 min (1 cycle)
- 94°C for 30 sec and 60°C for 1 min (40 cycles)
- 98°C for 10 min (1 cycle)
- 4°C hold.
- Droplet Reading and Analysis: Read the plate on the QX200 Droplet Reader. Use QuantaSoft software to analyze the data. Apply a sample-specific clustering method to identify a set of stable reference loci, which is used to define a CNA-neutral benchmark. The normalized ratio of target loci copies relative to the average copy number of this benchmark (R_norm) is calculated to determine absolute copy number and infer ploidy [2].
The Scientist's Toolkit: Essential Research Reagents
Table 3: Key Reagent Solutions for CNA Analysis via qPCR
| Reagent / Material | Function / Application | Example & Notes |
|---|---|---|
| TaqMan Copy Number Assays | Target-specific detection of CNAs. | Contains primers and FAM dye-labeled MGB probe for the target gene. Compatible with FFPE DNA [12]. |
| TaqMan Copy Number Reference Assay | Internal reference for data normalization. | Typically targets a known diploid locus like RNase P, uses VIC dye. |
| Genomic DNA from FFPE Tissue | Common source of clinical tumor material. | Must be carefully extracted and quantified; compatible with qPCR and ddPCR [12] [2]. |
| TaqMan Genotyping Master Mix | Provides core components for qPCR. | Contains AmplTaq Gold DNA Polymerase UP, dNTPs, and optimized buffers. |
| ddPCR Supermix for Probes | Optimized reaction mix for droplet digital PCR. | Used in the QX200 system for partitioned PCR reactions. |
| Reference DNA (Calibrator) | Essential baseline for comparative ΔΔCt analysis. | Commercial human genomic DNA or pooled normal female DNA [19]. |
| Cell Line Controls | Assay validation and quality control. | Use well-characterized lines (e.g., SKBR3 for ERBB2 amplification, DLD1 as wild-type control) [12]. |
The analysis of copy number alterations provides powerful insights into the prognosis and biology of oral cancer. While techniques like nCounter NanoString and ddPCR offer advanced multiplexing and quantification capabilities, real-time PCR remains a robust, accessible, and gold-standard method for validating genomic biomarkers in both research and clinical diagnostics. The protocols and data presented here provide a framework for researchers to reliably correlate specific CNAs with survival outcomes, thereby facilitating the development of more personalized and effective treatment strategies for oral cancer patients. Future work should focus on the integration of CNA profiles with other molecular data and clinical parameters to build more comprehensive prognostic models.
Copy number alterations (CNAs), defined as somatic gains or losses of genomic DNA, are fundamental drivers in the development and progression of many cancers, including oral squamous cell carcinoma (OSCC) [19] [7]. These alterations can lead to the activation of oncogenes through amplification or the inactivation of tumor suppressor genes through deletion, significantly influencing patient prognosis and potential targeted treatment strategies [19] [2]. In the context of oral cancer research, the detection of CNAs provides crucial insights into tumorigenesis, with specific alterations serving as potential biomarkers for disease prognosis and prediction [19] [7].
Among the various techniques available for CNA validation, quantitative real-time PCR (qPCR) has established itself as a robust and reliable gold standard method [19]. Its widespread use is attributed to its simplicity, high sensitivity, compatibility with low-input DNA samples (such as those derived from formalin-fixed, paraffin-embedded or FFPE tissue), and cost-effectiveness, making it particularly suitable for clinical screening of a limited number of markers [12]. This article details the principle of CNA detection by qPCR and provides a detailed protocol for its application in oral cancer research.
The Fundamental Principle of qPCR for CNA Quantification
The core principle of qPCR in quantifying copy number relies on the direct relationship between the initial amount of a target DNA sequence in a sample and the point in the PCR amplification process at which fluorescent signal accumulation first exceeds a background threshold. This point is known as the threshold cycle (Ct) [20].
For CNA analysis, the Ct value of the target gene of interest is compared to the Ct value of a reference gene (or set of genes) assumed to be present in two stable copies per diploid genome. The difference in Ct values (ΔCt) between the target and reference is calculated for each sample. This ΔCt value is then used to determine the copy number state (e.g., normal, gain, or loss) of the target gene through further statistical analysis and ratio calculation [20] [21]. The accuracy of this quantification is heavily dependent on the PCR amplification efficiency of both the target and reference assays, which must be properly validated [20].
The following diagram illustrates the logical workflow and data analysis pipeline for CNA detection using qPCR.
Essential Reagents and Materials for qPCR CNA Analysis
Successful CNA detection requires careful selection and validation of research reagents. The following table summarizes the key components essential for a reliable TaqMan-based qPCR copy number assay.
Table 1: Key Research Reagent Solutions for qPCR-based CNA Detection
| Reagent/Material | Function & Importance | Considerations for Oral Cancer Research |
|---|---|---|
| TaqMan Copy Number Assays [12] | Sequence-specific probes and primers for quantifying target and reference genes. | Select assays for genes relevant to OSCC (e.g., CCND1, CDKN2A, FAT1, YAP1) [19] [2]. |
| Reference Gene Assays [20] [21] | Amplifies a genomic region with stable diploid copy number for normalization. | Validate reference gene stability in oral tissue and tumor samples; use multiple genes for robustness [21]. |
| qPCR Master Mix | Provides optimized buffer, enzymes, and dNTPs for efficient amplification. | Choose mixes compatible with FFPE-derived DNA and TaqMan probe chemistry. |
| DNA Input (5-20 ng) [12] | The template for qPCR reaction. | Optimize input amount; 5-20 ng of FFPE-derived DNA is typically sufficient for reliable detection [12]. |
Detailed Experimental Protocol for CNA Detection
This protocol is adapted from validated methodologies used in oral cancer research [19] [12].
Sample Preparation and DNA Extraction
- Source: Obtain OSCC tissue samples, ensuring appropriate ethical approval and informed consent [7].
- Extraction: Extract genomic DNA from tissues (fresh-frozen or FFPE) using a commercial kit. For FFPE samples, use kits specifically designed for cross-linked DNA.
- Quantification: Precisely quantify DNA using a fluorometric method. Assess DNA purity and integrity via spectrophotometry and gel electrophoresis.
- Input Optimization: Use 5-20 ng of total DNA per qPCR reaction as a starting point. Lower inputs may be used but require validation to maintain assay sensitivity and precision [12].
qPCR Reaction Setup and Run Conditions
- Assay Design: Use commercially available, pre-validated TaqMan copy number assays for the target and reference genes.
- Plate Setup: Perform reactions in quadruplicate (four replicates) for each sample and assay to ensure statistical reliability, as per MIQE guidelines [19]. Include a negative control (no template) for each assay.
- Reaction Mix: In a total volume of 20 µL, combine:
- 10 µL of 2X TaqMan Genotyping Master Mix.
- 1 µL of 20X TaqMan Copy Number Assay (Target or Reference).
- 5-20 ng of genomic DNA (e.g., in 5 µL volume).
- Nuclease-free water to the final volume.
- qPCR Cycling: Run the plate on a real-time PCR instrument with the following standard conditions [12]:
- Hold Stage: 95°C for 10 min (enzyme activation).
- PCR Stage (40 cycles): 95°C for 15 sec (denaturation) → 60°C for 1 min (annealing/extension).
Data Analysis and Interpretation
Calculation of Copy Number
The following table outlines the core calculations involved in determining copy number from raw Ct values, incorporating efficiency correction as per the Pfaffl method for higher accuracy [21].
Table 2: Key Formulas for qPCR CNA Data Analysis
| Calculation Step | Formula | Explanation |
|---|---|---|
| Efficiency-Corrected ΔCT (wΔCT) [21] | wΔCT = log₂(E_target) * Ct_target - log₂(E_ref) * Ct_ref |
Adjusts for any differences in amplification efficiency (E) between target and reference assays. If E=2 for both, this simplifies to ΔCt. |
| Relative Copy Number Ratio (R) [2] | R = 2^(-wΔCT) |
For a diploid genome, a ratio of R=1 indicates two copies. A ratio of ~1.5 suggests a gain (3 copies), and ~0.5 suggests a loss (1 copy). |
| Fold Change (FC) Expression [21] | FC = E_target^(-ΔCT_target) / E_ref^(-ΔCT_ref) |
Alternative calculation for relative quantification, equivalent to the Pfaffl method. |
After calculating the copy number ratio (R) for a group of samples, a sample-specific clustering method can be applied to define a set of stable reference loci. This establishes a CNA-neutral benchmark, allowing for the final normalized copy number ratio (R_i/b^Norm) to be calculated, which more accurately reflects the true biological alteration [2].
Statistical Correlation with Clinical Outcomes
In oral cancer research, the CNAs identified by qPCR are frequently correlated with clinical outcomes such as survival. The Spearman's rank correlation is used to assess the concurrence between different technical platforms (e.g., qPCR vs. nCounter NanoString) [19]. Furthermore, Kaplan-Meier survival analysis with the Log-rank test is employed to determine if specific CNAs are significantly associated with recurrence-free survival (RFS), disease-specific survival (DSS), or overall survival (OS) [19]. For instance, in OSCC, amplification of ISG15 as detected by qPCR has been associated with a better prognosis for RFS, DSS, and OS, while alterations in ATM, CASP4, and CYB5A were linked to poor RFS [19].
Application in Oral Cancer Research
qPCR-based CNA analysis has proven highly valuable in elucidating the molecular pathology of oral cancer. It effectively validates findings from genome-wide studies and identifies prognostic biomarkers.
Research has demonstrated that qPCR can detect clinically relevant CNAs that drive oral cancer progression, including submicroscopic homozygous deletions in tumor suppressor genes like CDKN2A and FAT1, which might be missed by some array-based methods [2]. Furthermore, the technique allows for the inference of ploidy level and quantification of high-level amplifications in oncogenes [2].
When comparing qPCR with newer digital PCR (ddPCR) platforms for CNA detection in oral cancer, studies show good agreement between the methods, with correlation coefficients (R) as high as 0.92 against comparative genomic hybridization (CGH) arrays and 0.95 against SNP arrays [2]. This confirms qPCR's continued robustness as a validation tool in the genomic analysis of oral cancer.
A Step-by-Step Protocol for qPCR-Based CNA Detection in Oral Cancer Samples
Copy number alteration (CNA) analysis represents a critical component of cancer genomics research, particularly in oral cancer where specific CNAs have demonstrated significant prognostic and predictive value [19] [7]. The reliability of these analyses, especially when utilizing quantitative PCR (qPCR) methodologies, is fundamentally dependent on the quality of the extracted DNA, which in turn is dictated by the sample preparation methods employed [12]. Formalin-fixed paraffin-embedded (FFPE) and fresh-frozen tissues represent the two primary archival formats for biological specimens in cancer research, each presenting distinct advantages and challenges for DNA extraction [22] [23]. This application note delineates optimized protocols and best practices for DNA extraction from both tissue types, contextualized within CNA analysis in oral cancer research, to ensure the generation of high-quality DNA suitable for sensitive downstream qPCR applications.
Comparative Analysis of Tissue Preservation Methods
The selection of tissue preservation method imposes significant implications on nucleic acid integrity, experimental workflow, and analytical outcomes. The table below summarizes the fundamental characteristics of each approach:
Table 1: Comparison of FFPE and Fresh-Frozen Tissue Preservation Methods
| Characteristic | FFPE Tissue | Fresh-Frozen Tissue |
|---|---|---|
| DNA Integrity | Fragmented and cross-linked due to formalin fixation [23] | High molecular weight, superior integrity [22] |
| Storage Requirements | Room temperature; cost-effective for biobanking [23] | Ultra-low temperature freezers (-80°C); vulnerable to power failures [23] |
| Tissue Morphology | Excellent architectural preservation for pathological assessment [23] | Moderate preservation, but proteins remain in native state [23] |
| Suitability for qPCR | Compatible with optimized extraction, but may affect amplification efficiency [12] | Ideal for long amplicon PCR and high-quality molecular analyses [22] |
| Clinical Availability | Abundant in hospital pathology archives [22] [23] | Less commonly available, requires prospective collection [23] |
Evidence from comparative studies indicates that while mutation analysis results between matched FFPE and fresh-frozen tissues show high concordance (>94%), the presence of variants unique to either sample type necessitates careful consideration when selecting tissue for analysis [22]. For CNA analysis via qPCR, DNA extraction methods must be tailored to overcome the specific limitations imposed by each preservation method.
DNA Extraction Protocols
Protocol 1: DNA Extraction from FFPE Tissues
The following protocol is optimized for the recovery of amplifiable DNA from FFPE tissue sections for CNA analysis [22] [7].
Materials and Reagents
- QIAamp DNA FFPE Tissue Kit (Qiagen) [7] or similar
- Xylene or specialized deparaffinization solution (e.g., AutoLys M Tubes) [24]
- Proteinase K
- Ethanol (absolute and 70%)
- Microcentrifuge tubes
- Heating block or water bath (56°C and 90°C)
- Microcentrifuge
Procedure
Sectioning and Deparaffinization: Cut 2-3 sections of 10 µm thickness from the FFPE block. For a standard protocol, transfer the sections to a microcentrifuge tube and add 1 mL of xylene. Vortex vigorously and incubate at room temperature for 5 minutes. Centrifuge at full speed for 5 minutes and carefully remove the supernatant. Add 1 mL of absolute ethanol to the pellet, vortex, and centrifuge again. Remove the supernatant and air-dry the pellet for 10-15 minutes [24]. Automated alternatives using heating steps instead of xylene are environmentally favorable and highly effective [24].
Lysis and Proteinase K Digestion: Add 180 µL of ATL buffer (from the kit) and 20 µL of Proteinase K to the deparaffinized pellet. Vortex thoroughly and incubate at 56°C for 3 hours or until the tissue is completely lysed, with occasional vortexing. For more complete cross-link reversal, a subsequent incubation at 90°C for 1 hour is recommended [22] [7].
DNA Binding and Washing: Follow the manufacturer's instructions for the selected kit. Typically, this involves adding AL buffer and ethanol to the lysate, applying the mixture to a silica membrane column, and centrifuging. Wash the column with AW1 and AW2 buffers, centrifuging between each wash [7].
DNA Elution: Elute the DNA in 50-100 µL of AE buffer or nuclease-free water pre-heated to 56°C. Allow the column to incubate with the elution buffer for 5 minutes before centrifuging.
Protocol 2: DNA Extraction from Fresh-Frozen Tissues
This protocol is designed to maximize the yield of high-integrity DNA from fresh-frozen tissues [22] [25].
Materials and Reagents
- QIAamp DNA Mini Kit (Qiagen) or similar [25]
- Liquid nitrogen
- Mortar and pestle or a dedicated tissue homogenizer (e.g., Fisherbrand 850 Homogenizer) [24]
- Proteinase K
- RNase A (optional)
- Ethanol (96-100%)
- PBS buffer
Procedure
Tissue Disruption and Lysis: Place approximately 25 mg of frozen tissue in a mortar pre-cooled with liquid nitrogen. Grind the tissue to a fine powder using the pestle. Alternatively, use a bead-beater or a mechanical homogenizer for efficient disruption [24]. Transfer the powder to a microcentrifuge tube containing 180 µL of ATL buffer. Add 20 µL of Proteinase K, mix by vortexing, and incubate at 56°C until completely lysed (1-3 hours). For tissues high in RNA, an RNase A treatment step (10 µg/µL final concentration, 2 minutes at room temperature) can be incorporated to minimize RNA contamination [24].
Optional Organic Purification (for high-purity needs): For downstream applications exceptionally sensitive to contaminants, an organic purification step can be added post-lysis. Add 200 µL of chloroform:isoamyl alcohol (24:1), vortex thoroughly, and centrifuge at 12,000 rpm for 8 minutes. Carefully transfer the upper aqueous phase to a new tube [26].
DNA Binding and Washing: Add 200 µL of AL buffer and 200 µL of ethanol (96-100%) to the lysate (or the aqueous phase from step 2), and mix by vortexing. Apply the mixture to the QIAamp Mini spin column and centrifuge. Wash the column by adding AW1 and AW2 buffers, centrifuging after each wash.
DNA Elution: Elute the DNA in 100 µL of AE buffer or nuclease-free water. Allow the column to stand for 5 minutes before the final centrifugation to increase DNA yield.
DNA Quality Control and Assessment
Rigorous quality control is non-negotiable for CNA analysis. The following table outlines the key QC parameters and their acceptable thresholds:
Table 2: DNA Quality Control Metrics for CNA Analysis
| QC Method | Parameter Assessed | Acceptable Range | Implications for CNA Analysis |
|---|---|---|---|
| Spectrophotometry (NanoDrop) | A260/A280 Ratio | 1.7 - 1.9 [27] | Ratios outside this range suggest protein (low) or RNA (high) contamination that can inhibit qPCR [26] [27]. |
| A260/A230 Ratio | >2.0 | Low ratios indicate contamination with salts or organic compounds (e.g., phenol) [28]. | |
| Fluorometry (Qubit) | DNA Concentration | Varies | Provides a highly specific quantification of dsDNA, superior to spectrophotometry for yield estimation [27]. |
| Agarose Gel Electrophoresis | DNA Integrity | High molecular weight smear (Frozen); Smear of lower fragments (FFPE) | Visual assessment of degradation. FFPE DNA will appear as a lower molecular weight smear [27]. |
| qPCR-based QC | Amplifiability | Pass/Fail based on Ct/Cq | Directly measures the quantity of amplifiable DNA, the most relevant metric for qPCR workflows [27] [12]. |
For CNA analysis via qPCR, a multiplex pre-amplification QC check targeting genomic regions of different lengths can effectively identify samples with sufficient integrity and a lack of PCR inhibitors [27] [12]. Studies have demonstrated that while UV absorbance methods can overestimate functional DNA quantity in compromised FFPE samples, qPCR-based QC is a more reliable predictor of performance in downstream CNA assays [27].
Application in Oral Cancer CNA Analysis
The integrity of DNA sample preparation directly impacts the reliability of CNA data and its correlation with clinical outcomes. A 2025 study comparing qPCR and nCounter NanoString for CNA validation in 119 oral cancer samples underscored the critical importance of the validation platform and the underlying sample quality [19]. For instance, the gene ISG15 was associated with better prognosis (RFS, DSS, OS) when analyzed via real-time PCR, but with poor prognosis when analyzed via nCounter, highlighting how technical and sample preparation variables can dramatically alter biological conclusions [19].
Research has established that successful CNA detection from FFPE-derived DNA is feasible with optimized protocols. A validation study of TaqMan qPCR assays for CNA detection in FFPE solid tumors found a 100% correlation with Molecular Inversion Probe (MIP) arrays for key genes like ERBB2 and MET when using an optimal DNA input of 5-10 ng per reaction [12]. This confirms that well-extracted DNA from FFPE samples, despite its fragmented nature, is a suitable substrate for targeted CNA analysis.
The Scientist's Toolkit: Research Reagent Solutions
Table 3: Essential Reagents and Kits for DNA Extraction from Tissue Samples
| Product Name/Type | Primary Function | Application Notes |
|---|---|---|
| QIAamp DNA FFPE Tissue Kit (Qiagen) | Manual silica-column-based DNA purification from FFPE tissue. | Effectively reverses formalin cross-links; includes necessary deparaffinization solutions [7]. |
| QIAamp DNA Mini Kit (Qiagen) | Manual silica-column-based DNA purification from fresh-frozen tissue and other samples. | Standard for high-quality DNA from frozen tissues; can be combined with mechanical homogenization [25]. |
| MagMAX DNA Multi-Sample Ultra 2.0 Kit | Magnetic bead-based DNA purification for automation. | Enables high-throughput processing of multiple sample types (blood, tissue, saliva) on KingFisher systems [24]. |
| Proteinase K | Enzymatic digestion of proteins and nucleases. | Critical for complete tissue lysis and inactivation of DNases that would degrade the target DNA [26] [22]. |
| RNase A | Digestion of RNA to prevent RNA contamination. | Recommended for tissue samples to ensure accurate DNA quantification and purity measurements [24]. |
| CTAB Buffer | Precipitation of DNA and removal of polysaccharides. | Particularly useful for challenging plant tissues; can be adapted for animal tissues high in carbohydrates [28]. |
Workflow Visualization
The following diagram illustrates the parallel DNA extraction workflows for FFPE and Fresh-Frozen tissues, highlighting the critical divergence in their initial steps due to the nature of the source material.
The accuracy of copy number alteration analysis in oral cancer research is fundamentally dependent on the initial sample preparation stages. While FFPE tissues offer logistical advantages for archival, fresh-frozen tissues provide superior nucleic acid integrity. The protocols and quality control measures detailed herein provide a robust framework for generating high-quality DNA from both sample types, ensuring the reliability of subsequent qPCR-based CNA analyses. Adherence to these best practices, coupled with careful consideration of the inherent limitations of each preservation method, will enhance the reproducibility and clinical relevance of genomic findings in oral cancer research.
This application note provides a comprehensive guide for designing robust TaqMan assays specifically adapted for copy number alteration (CNA) analysis in oral cancer research. We detail optimized protocols and design parameters for selecting primers and probes that ensure high specificity, sensitivity, and reproducibility in quantitative PCR (qPCR) experiments. Within the context of oral squamous cell carcinoma (OSCC) research, proper assay design is critical for accurately identifying genomic biomarkers that have prognostic and predictive value for clinical outcomes. The guidelines presented here incorporate rigorous bioinformatic checks and experimental validation procedures to address the unique challenges of working with cancer genomic DNA.
Copy number alterations are fundamental genetic changes in oral cancer, contributing to oncogene activation and tumor suppressor gene inactivation. Accurate detection of these CNAs using TaqMan qPCR provides a reliable, cost-effective method for validating findings from global genomic profiling studies [19]. This technique is particularly valuable for oral cancer research, where identifying prognostic biomarkers can guide treatment decisions and improve patient outcomes [29] [19]. However, the accuracy of CNV detection depends critically on proper assay design, which must account for factors such as sequence specificity, secondary structure, and optimization of reaction conditions [30].
The design process encompasses target selection based on genomic coordinates, development of primers and probes with appropriate thermodynamic properties, and incorporation of necessary controls. When properly executed, TaqMan assays enable researchers to distinguish between diploid and altered genomic regions with high confidence, making them indispensable for studies investigating gene amplifications and deletions in oral cancer pathogenesis and progression [31].
Core Design Principles for TaqMan Assays
Fundamental Parameters for Primer and Probe Design
Successful TaqMan assays depend on careful attention to multiple interdependent parameters that affect hybridization efficiency, specificity, and fluorescence detection.
Table 1: Essential Design Parameters for TaqMan Primers and Probes
| Parameter | Primers | TaqMan Probes |
|---|---|---|
| Length | 15-30 bases [32] | 18-30 bases [33] |
| Melting Temperature (Tm) | 58-60°C [34] or 60-64°C [33]; primers within 2°C of each other | 68-70°C; 5-10°C higher than primers [32] [33] |
| GC Content | 30-80% (ideal: 35-65%) [34] [33] | 30-80% [34] [32] |
| 3' End Stability | No more than 2 G/C in last 5 bases [34] | - |
| Amplicon Length | 50-150 bp (optimal) [34] [32]; up to 400 bp acceptable | |
| Specific Features | Avoid runs of 4+ identical nucleotides, especially G [34] | Avoid G at 5' end [32] [33]; more Cs than Gs [30] |
Specificity Considerations for Genomic Targets
When designing assays for copy number analysis in oral cancer, several specificity considerations are paramount:
- Sequence Uniqueness: Ensure primers and probes are specific to the target sequence by performing BLAST analysis against the human genome to avoid cross-homology with pseudogenes or related sequences [34] [33].
- SNP Avoidance: Design assays in regions free of known single nucleotide polymorphisms (SNPs) that might affect binding efficiency [34].
- Repetitive Element Masking: Avoid regions with repetitive sequences or low complexity DNA that can promote non-specific amplification [31].
- Genomic Context: Place assays in either exonic or intronic regions, ensuring the selected sequence is unique within the gene of interest and present in a single copy in the reference genome [30].
Experimental Protocol for TaqMan CNV Analysis
The following diagram illustrates the complete experimental workflow for TaqMan-based copy number analysis in oral cancer research:
Detailed Step-by-Step Protocol
Step 1: DNA Preparation
- Isolate genomic DNA from oral cancer tissue samples using validated extraction methods. For FFPE tissues, use specialized kits designed for degraded DNA.
- Quantify DNA concentration using spectrophotometry (e.g., Nanodrop) and normalize to working concentration of 5-20 ng/μL [30]. Assess DNA purity by ensuring A260/A280 ratio between 1.8-2.0.
- For accurate CNV analysis, use consistent DNA input amounts across samples (typically 1-10 ng per reaction) [30].
Step 2: Assay Design and Selection
- For predesigned assays: Select from commercially available TaqMan Copy Number Assays targeting genes relevant to oral cancer (e.g., CCND1, FAT1, MYC) [31].
- For custom design: Apply the parameters in Table 1 using design tools such as PrimerQuest [33] or Beacon Designer [32].
- Select appropriate reference assays: Use TaqMan Copy Number Reference Assays (e.g., RNase P for human samples) with known diploid copy number [31].
Step 3: Reaction Plate Setup
- Prepare master mix containing TaqPath ProAmp Master Mix (1X), test assay (1X), and reference assay (1X) [31].
- Aliquot appropriate volume of master mix to each well of a qPCR-compatible plate.
- Add normalized DNA samples (recommended: 20 ng total per reaction) to respective wells [30].
- Include necessary controls: diploid control DNA, no-template control, and potentially samples with known CNAs as positive controls.
- Perform reactions in triplicate or quadruplicate to ensure statistical reliability [19].
- Seal plate tightly and centrifuge briefly at 500×g to remove bubbles and ensure all liquid is at the bottom of wells [30].
Step 4: qPCR Amplification
- Use the following cycling conditions on a real-time PCR instrument:
- Initial denaturation: 95°C for 10 minutes
- 40 cycles of:
- Denaturation: 95°C for 15 seconds
- Annealing/Extension: 60°C for 60 seconds
- Ensure the probe detection step is performed during the annealing/extension phase of each cycle [30].
Step 5: Data Analysis
- Use CopyCaller Software or similar analytical tools to automatically determine copy number values [31].
- The software calculates ∆Ct values (Cttarget - Ctreference) and uses the 2^−∆∆Ct method to determine relative copy number compared to diploid control [30].
- Results falling between integers (e.g., 1.3) may require additional validation or replicate testing [30].
- For research purposes, establish copy number thresholds (typically <1.5 for deletion, >2.5 for amplification) based on control samples [19].
Oral Cancer-Specific Design Considerations
Target Gene Selection in OSCC
When designing TaqMan assays for oral cancer research, focus on genes with established roles in OSCC pathogenesis and prognosis. Based on recent studies, key genes of interest include:
Table 2: Clinically Relevant Genes for CNV Analysis in Oral Cancer
| Gene | Chromosomal Location | Biological Significance in OSCC | CNV Association |
|---|---|---|---|
| CCND1 | 11q13 | Cell cycle regulation; frequently amplified in HNSCC | Amplification associated with poor prognosis [19] |
| FAT1 | 4q35 | Cadherin-related tumor suppressor | Deletions common in OSCC [19] |
| ISG15 | 1p36 | Immune response modulation | Conflicting prognostic associations [19] |
| YAP1 | 11q22 | Transcriptional regulator in Hippo pathway | CNAs correlate with patient survival [19] |
| ANO1 | 11q13 | Calcium-activated chloride channel | Amplified in subset of OSCC [19] |
Technical Validation in Oral Cancer Studies
Recent comparative studies highlight important considerations for TaqMan assay validation in oral cancer research:
- Platform Correlation: TaqMan assays show moderate to substantial agreement (Cohen's kappa: 0.41-0.80) with other technologies like nCounter NanoString for genes including BIRC2, BIRC3, CCND1, FADD, FAT1, GHR, PDL1 and YAP1 [19].
- Survival Analysis: Properly designed TaqMan assays can identify CNAs with prognostic significance, such as ISG15 association with better RFS (HR 0.40), DSS (HR 0.31) and OS (HR 0.30) in OSCC patients [19].
- Multiplexing Potential: For high-throughput screening, designs can incorporate multiplex TaqMan assays using different fluorescent dyes, enabling simultaneous analysis of multiple targets in precious OSCC samples [31].
The Scientist's Toolkit: Essential Research Reagents
Table 3: Key Reagent Solutions for TaqMan CNV Analysis
| Reagent/Material | Function | Example Products |
|---|---|---|
| TaqMan Copy Number Assays | Target-specific primers and probes for CNV detection | Predesigned Human CNV Assays [31] |
| TaqMan Copy Number Reference Assays | Reference genes with known diploid copy number | RNase P, TERT Reference Assays [31] |
| qPCR Master Mix | Provides optimized buffer, enzymes, dNTPs for amplification | TaqPath ProAmp Master Mix [31] |
| DNA Isolation Kits | High-quality genomic DNA purification from tissue samples | Puregene DNA Isolation Kit [30] |
| qPCR Plates and Seals | Reaction vessels compatible with real-time PCR instruments | LightCycler 480 Multiwell Plates [30] |
| Analysis Software | Data interpretation and copy number calling | CopyCaller Software [31] |
Troubleshooting and Optimization
Common Design and Experimental Challenges
- Poor Amplification Efficiency: Check primer secondary structures using tools like OligoAnalyzer; ensure ∆G values for hairpins and dimers are weaker than -9.0 kcal/mol [33].
- Inconsistent Replicate Results: Verify DNA quality and quantity; ensure thorough mixing of reaction components; check for pipetting errors [30].
- Non-specific Amplification: Increase annealing temperature in 2°C increments; redesign primers with stricter specificity checks using BLAST [33].
- Abnormal Copy Number Values: Verify reference assay performance; check for sample contamination; confirm normal diploid controls give expected values [30].
Optimization Using Statistical Design of Experiments
For high-throughput applications, implement statistically designed experiments (DOE) to efficiently optimize multiple assay parameters simultaneously. This approach can identify significant factors, complex interactions, and nonlinear responses, greatly reducing optimization timelines compared to one-factor-at-a-time approaches [35].
Proper design of TaqMan probes and primers is fundamental to successful copy number analysis in oral cancer research. By adhering to the specified design parameters, experimental protocols, and validation procedures outlined in this application note, researchers can develop robust assays capable of detecting clinically relevant CNAs with high confidence. The structured approach presented here—incorporating rigorous bioinformatic design, appropriate controls, and oral cancer-specific considerations—provides a foundation for generating reproducible data that can advance our understanding of oral cancer genetics and contribute to improved patient stratification and treatment strategies.
Accurate data normalization is not merely a preliminary step in quantitative PCR (qPCR) analysis; it is the foundational pillar that supports the validity of all subsequent conclusions, particularly in the complex field of oral cancer research. In the context of copy number alteration (CNA) analysis and gene expression profiling in oral squamous cell carcinoma (OSCC), the selection of inappropriate reference genes can lead to significant data distortion, potentially obscuring true biological signals or generating false positives [36] [37] [38]. The stability of traditionally used "housekeeping" genes is not guaranteed, as their expression can be markedly influenced by the disease state itself, experimental treatments, and the specific biological matrix under investigation, such as saliva, tissue, or cultured cells [37] [38]. This article provides a detailed framework for the systematic selection and validation of reference genes, specifically tailored for qPCR studies of copy number alterations and biomarker expression in oral cancer.
The Critical Role of Reference Genes in Oral Cancer Research
Oral cancer research, especially studies focusing on lymph node metastasis and salivary biomarkers, presents unique challenges for qPCR normalization. Lymph node metastasis is a critical prognostic factor in OSCC, reducing survival by 50% [36]. Profiling studies using reverse transcription quantitative PCR (RT-qPCR) require reliable normalization to accurately interpret molecular patterns for biomarker development [36]. Furthermore, the use of saliva as a non-invasive diagnostic fluid introduces additional variability, as its composition can differ significantly between individuals [37].
Studies have demonstrated that commonly used reference genes can show differences in expression in the saliva of cancer and control patients, highlighting the necessity for rigorous validation in each specific context [37]. For instance, in dormant cancer cells generated by mTOR inhibition, the expression of commonly used reference genes like ACTB and ribosomal protein genes undergoes dramatic changes, rendering them "categorically inappropriate" for normalization [38]. This underscores a fundamental principle: a gene's stability must be empirically determined for each specific experimental condition and sample type; it cannot be assumed based on its function in cellular maintenance.
Strategies for Selecting Candidate Reference Genes
Initial Selection Criteria
The validation process begins with the careful selection of candidate reference genes. A typical panel includes 5-12 genes from various functional classes to minimize the chance of co-regulation. Common candidates include:
- Structural Genes: ACTB (β-actin), GAPDH (glyceraldehyde-3-phosphate dehydrogenase), TUBA1A (α-tubulin)
- Ribosomal Proteins: RPLP0 (ribosomal protein lateral stalk subunit P0), RPL13A, RPL27, RPL30, RPL37A, RPS17, RPS18, RPS23
- Transcription Factors: TBP (TATA-box binding protein)
- Metabolic Enzymes: HPRT1 (hypoxanthine phosphoribosyltransferase 1), PGK1 (phosphoglycerate kinase 1)
- Other Housekeeping Genes: B2M (β-2-microglobulin), UBC (ubiquitin C), YWHAZ (tyrosine 3-monooxygenase/tryptophan 5-monooxygenase activation protein zeta), CYC1 (cytochrome c1), EIF2B1 (eukaryotic translation initiation factor 2B subunit alpha)
When designing primers for these genes, several critical parameters must be considered [39]:
- Aim for a GC content between 40% and 60%.
- Ensure a primer length of 18-30 bases.
- Target a melting temperature (Tm) between 65°C and 75°C.
- Avoid regions with long (>4) repeats of a single base.
- Verify primer specificity using tools like BLAST.
Practical Considerations for Oral Cancer Studies
In OSCC research, the biological matrix is a crucial consideration. Saliva, lymph node tissues, and cultured cells may each require different optimized reference gene panels. For studies involving lymph node stromal cells (LNSCs) and lymph node tissues from OSCC patients, stability analysis has indicated that while RPLP0 and 18SrRNA were stable in both sample types, HPRT1 and RPL27 were uniquely stable in tissues, whereas ACTB and TBP were most stable in LNSCs [36]. This observation underscores the necessity of evaluating reference gene subsets based on both the disease and cellular context.
Table 1: Candidate Reference Genes for Oral Cancer Studies
| Gene Symbol | Full Name | Functional Class | Reported Stability in Oral Cancer Studies |
|---|---|---|---|
| RPLP0 | Ribosomal Protein Lateral Stalk Subunit P0 | Ribosomal Protein | Stable in lymph node tissues and stromal cells [36] |
| TBP | TATA-Box Binding Protein | Transcription Factor | Stable in lymph node stromal cells [36] |
| RPS17 | Ribosomal Protein S17 | Ribosomal Protein | Validated in saliva for OSCC detection [37] |
| B2M | Beta-2-Microglobulin | Immunoglobulin-related | Variable stability; context-dependent [37] [38] |
| YWHAZ | Tyrosine 3-Monooxygenase Activation Protein Zeta | Signaling/Scaffolding | Stable in certain cancer cell lines (e.g., A549) [38] |
| ACTB | Beta-Actin | Cytoskeletal Structural Protein | Often unstable; context-dependent [36] [38] |
| GAPDH | Glyceraldehyde-3-Phosphate Dehydrogenase | Glycolytic Enzyme | Often unstable; context-dependent [38] |
Comprehensive Validation Workflow
A robust validation protocol requires a multi-step workflow that moves from initial assessment to final verification. The entire process, from sample preparation to final validation, is summarized in Figure 1 below.
Figure 1. Workflow for reference gene validation. The process begins with careful sample collection and proceeds systematically through RNA quality control, cDNA synthesis, qPCR analysis, and statistical evaluation to select a final, validated reference gene panel.
Sample Preparation and qPCR Conditions
Sample Collection and RNA Extraction:
- Collect samples (e.g., saliva, lymph node tissue, cancer cells) under standardized conditions [36] [37].
- For saliva, centrifuge at 10,000 rpm for 10 minutes and use Trizol reagent or commercial kits (e.g., MagMax Viral RNA Isolation Kit) for RNA isolation [40] [37].
- Assess RNA quality using spectrophotometry (A260/A280 ratio >1.8) and confirm integrity by electrophoresis [36] [40].
- Treat RNA with DNase to remove genomic DNA contamination [40].
cDNA Synthesis and qPCR:
- Convert 500-1000 ng of total RNA to cDNA using high-capacity cDNA reverse transcription kits [36] [40].
- Perform qPCR reactions in triplicate using SYBR Green or TaqMan chemistry [36] [30] [41].
- Use appropriate cycling conditions: typically, 95°C for 10 minutes, followed by 40-45 cycles of 95°C for 15 seconds and 58-60°C for 30-60 seconds [30] [40].
- Include melt curve analysis to verify amplification specificity when using SYBR Green chemistry [36] [38].
Stability Analysis and Data Interpretation
The core of reference gene validation lies in the statistical evaluation of their expression stability. Multiple algorithms should be employed for a comprehensive assessment:
geNorm Analysis:
- Calculates a stability measure (M) for each gene based on the average pairwise variation with all other candidate genes [37].
- Genes with the lowest M-values are the most stable.
- Determines the optimal number of reference genes by calculating the pairwise variation (V) between sequential normalization factors.
NormFinder Analysis:
- Uses an ANOVA-based model to estimate expression variation [37].
- Provides a stability value that considers both intra- and inter-group variation.
- Genes with the lowest stability values are the most stable.
BestKeeper Analysis:
- Calculates the standard deviation (SD) and coefficient of variance of the Cq values [36].
- Genes with the lowest SD values (±1) are considered stable.
Comprehensive Ranking:
- Tools like Reffinder integrate results from geNorm, NormFinder, BestKeeper, and the comparative ΔCq method to generate a comprehensive ranking [36].
Table 2: Example Reference Gene Stability Rankings in Different Oral Cancer Sample Types
| Sample Type | Most Stable Genes | Least Stable Genes | Validation Tool | Reference |
|---|---|---|---|---|
| Lymph Node Tissues | RPLP0, HPRT1, RPL27 | VIM, GAPDH | Reffinder (geNorm, NormFinder, BestKeeper) | [36] |
| Lymph Node Stromal Cells | ACTB, TBP, RPLP0 | VIM, GAPDH | Reffinder (geNorm, NormFinder, BestKeeper) | [36] |
| Saliva (OSCC Detection) | MT-ATP6, RPL30, RPL37A, RPLP0, RPS17 | B2M, UBC | NormFinder, geNorm | [37] |
| Dormant Cancer Cells (A549) | B2M, YWHAZ | ACTB, RPS23, RPS18, RPL13A | NormFinder, geNorm | [38] |
Application to Copy Number Alteration Analysis in Oral Cancer
In copy number variation (CNV) analysis by qPCR, normalization is particularly critical as the goal is to distinguish true copy number differences from technical artifacts. The fundamental principle involves comparing the amplification of a target locus with unknown copy number to a reference locus with known copy number [30] [41].
qPCR Workflow for CNV Analysis
The specialized workflow for CNV analysis, incorporating reference gene normalization, is detailed in Figure 2.
Figure 2. qPCR workflow for copy number variation analysis. This specialized workflow for CNV analysis highlights the critical role of reference gene normalization in accurately determining gene copy numbers, which is essential for studying genomic alterations in oral cancer.
Critical Experimental Parameters:
- Use 6-50 ng of genomic DNA per reaction [30].
- Design primers to produce amplicons of 75-200 bp for optimal efficiency [30].
- Ensure primer specificity to unique genomic regions, avoiding repetitive sequences and known polymorphisms [30].
- Perform reactions in triplicate to ensure statistical reliability [30] [41].
- Include a reference sample with known copy number (typically two copies) to generate a baseline for relative quantification [41].
Data Analysis:
- Calculate ΔCt values for each sample: ΔCt = Ct(target gene) - Ct(reference gene) [30].
- Determine ΔΔCt values: ΔΔCt = ΔCt(sample) - ΔCt(calibrator sample with known copy number) [30].
- Calculate copy number using the formula: Copy Number = 2 × 2^(-ΔΔCt) [30] [41].
Impact of Improper Normalization
Failure to use properly validated reference genes in CNV analysis can lead to significant misinterpretation of data. In genomic studies, copy number differences among samples can drive, if not dominate, differential signals if not properly accounted for [42]. This is particularly relevant in oral cancer, where chromosomal instability is common. Normalization that does not consider copy number stability can inflate signals in regions with copy number gains and reduce signals in regions with losses, creating false positive and false negative results [42].
The Scientist's Toolkit: Essential Research Reagents
Table 3: Essential Research Reagents for Reference Gene Validation and qPCR
| Reagent/Category | Specific Examples | Function/Application | Key Considerations |
|---|---|---|---|
| RNA Isolation Kits | MagMax Viral RNA Isolation Kit, Trizol Reagent | Extraction of high-quality RNA from saliva, tissues, or cells | Assess yield and purity (A260/A280 ratio >1.8); check RNA integrity [36] [37] |
| Reverse Transcription Kits | High-Capacity cDNA Reverse Transcription Kit, SuperScript III RT-PCR System | Conversion of RNA to cDNA for qPCR analysis | Use consistent input RNA amount (500-1000 ng) [36] [37] |
| qPCR Master Mixes | SYBR Green Master Mix, TaqMan assays | Fluorescent detection of amplified DNA | SYBR Green is cost-effective; TaqMan offers greater specificity for CNV assays [30] [41] |
| Reference Gene Assays | TaqMan Endogenous Control Panels, Custom-designed primers | Amplification of candidate reference genes | Pre-designed assays ensure optimized performance; custom primers must be validated for efficiency [37] [38] |
| Quality Control Tools | Nanodrop spectrophotometer, Bioanalyzer | Assessment of nucleic acid quantity and quality | Essential for verifying sample integrity before proceeding with costly downstream applications [36] [30] |
The systematic selection and validation of reference genes is not an optional refinement but an essential component of rigorous qPCR analysis in oral cancer research. By implementing the comprehensive workflow and methodologies outlined in this article—from careful candidate gene selection through multi-algorithm stability analysis to final validation in an independent cohort—researchers can establish a robust normalization strategy that ensures the reliability of their gene expression and copy number alteration data. This rigorous approach to reference gene validation provides the critical foundation upon which accurate biological interpretations and meaningful clinical insights into oral squamous cell carcinoma can be built.
In the context of copy number alteration (CNA) analysis in oral cancer research, robust and reproducible quantitative PCR (qPCR) is paramount. Accurate validation of CNAs, such as those identified in genes like MLLT3 and ISG15 in oral squamous cell carcinoma (OSCC), relies heavily on optimized reaction setup and thermal cycling conditions [19] [7]. Inconsistent qPCR results can lead to divergent biological interpretations, as evidenced by a recent study where ISG15 CNAs were associated with either better or poor prognosis depending on the validation technique used [19]. This application note provides detailed protocols for optimizing master mix composition and thermal cycling parameters to ensure reliable and efficient qPCR, specifically for sensitive applications like CNA analysis.
Critical Components for Optimization
Master Mix and Reagent Optimization
The foundation of a successful qPCR lies in the careful preparation and consistency of the reaction components. The following steps are crucial:
- Template Quality and Integrity: Never skip the quality check of purified DNA or RNA. For CNA analysis, use qualified isolation kits and verify sample integrity using a bioanalyzer or gel electrophoresis [43]. In OSCC research, DNA extracted from formalin-fixed paraffin-embedded (FFPE) tissue specimens has been successfully used for CNA analysis, though it requires specialized kits capable of handling potentially degraded DNA [7].
- qPCR Reagents: Use a high-quality, dedicated qPCR master mix. Consistency is critical; once a suitable reagent is identified, maintain its use across experiments to enable valid comparisons. Budget-friendly options like the biotechrabbit Capital qPCR Mix are available, but the key is to adhere to the manufacturer's protocol initially and then optimize by changing one parameter at a time [43].
- Primer and Probe Design: Proper design is non-negotiable for specificity and efficiency.
- Primers: The ideal amplicon length for CNA analysis is between 50-200 bp. Primers should be specific, with a length of 28 bp or larger to reduce primer-dimer formation. The optimal GC content is 40-60%, and the melting temperature (Tm) should be between 58°C and 65°C, with a difference of no more than 4°C between forward and reverse primers. The 3' end should avoid runs of more than three G/C bases [43].
- Probes (For probe-based assays): The probe Tm should be approximately 10°C higher than the primer Tm to ensure it binds first. The length can range from 9-40 bp, and GC content should be between 30-70%, avoiding G repeats, especially at the 5' end, which can quench fluorescence [43].
Thermal Cycling Conditions
Optimizing the thermal profile is essential for maximizing reaction efficiency and specificity. The parameters below should be systematically tested. A summary of optimal parameters is provided in Table 1.
- Initial Denaturation/Enzyme Activation: This step is critical for activating hot-start polymerases and fully denaturing complex genomic DNA. A temperature of 95°C is standard. The duration can vary from 30 seconds for simple, short templates to several minutes for genomic DNA or when specified by the master mix manufacturer for antibody-mediated hot-start polymerases [43] [44].
- Cycling Parameters (Denaturation, Annealing/Extension):
- Denaturation: Short cycles at 95°C for 5-15 seconds are typically sufficient for most amplicons, preventing excessive enzyme inactivation [43].
- Annealing and Extension: A two-step protocol (shuttle PCR) combining annealing and extension at 60°C for 1 minute is a common and efficient starting point for many assays, including those using SYBR Green or TaqMan probes [43]. The stringency of the annealing temperature is key; a higher temperature can enhance discrimination against incorrectly bound primers, reducing non-specific amplification [44]. For amplicons longer than 400 bp or primers with a high Tm, separate annealing and extension steps are recommended. The extension time can be calculated based on polymerase speed (e.g., 30 seconds for 450 bp at 72°C) [43].
- Cycle Number: While 40 cycles is a common preset, if amplification reaches the plateau phase early, reducing the cycle number to 30 can save time and reduce the accumulation of non-specific products [43] [44].
The following diagram illustrates the logical workflow for optimizing the qPCR reaction setup and conditions:
Figure 1. qPCR Optimization Workflow. This flowchart outlines the key sequential steps for establishing a robust qPCR protocol.
Table 1: Summary of Key Optimization Parameters for qPCR Setup
| Parameter | Optimal Range or Condition | Considerations for CNA Analysis |
|---|---|---|
| Template Quality | High-purity, intact DNA | FFPE samples from OSCC studies may require specialized DNA extraction kits [7]. |
| Amplicon Length | 50 - 200 bp [43] | Smaller fragments are more tolerant of PCR conditions and amplify efficiently. |
| Primer Tm | 58°C - 65°C [43] | A difference of ≤4°C between forward and reverse primers is ideal. |
| GC Content | 40% - 60% [43] | Avoid >3 consecutive G/C bases, especially at the 3' end. |
| Initial Denaturation | 95°C for 30 sec - 5 min [43] [44] | Duration depends on template complexity and polymerase activation requirements. |
| Cycling Denaturation | 95°C for 5 - 15 sec [43] | Sufficient for short templates; prevents polymerase damage. |
| Annealing/Extension | 60°C for 1 min (2-step) [43] | A combined step saves time; optimize temperature in 0.1°C steps for specificity. |
| Cycle Number | 30 - 40 cycles [43] | Reduce cycles if plateau is reached early to minimize non-specific products. |
Advanced Optimization Strategies
Annealing Temperature Optimization
The annealing temperature is one of the most critical variables. A gradient thermal cycler is invaluable for empirically determining the optimal temperature in a single run. Techniques like touchdown PCR, where the annealing temperature starts high (e.g., 10°C above the primer Tm) and is lowered incrementally every cycle, can increase specificity by favoring the accumulation of the correct amplicon in the early cycles [43] [44].
Data Analysis and Validation
Accurate data analysis is the final, crucial step. For CNA analysis using the relative quantification (ΔΔCq) method, proper baseline and threshold settings are essential for determining reliable Cq values.
- Baseline and Threshold Setting: The baseline should be set within the early cycles where fluorescence is stable (e.g., cycles 3-15). The threshold must be set sufficiently above the baseline, within the exponential phase of all amplification curves, where they are parallel. Incorrect settings can lead to significant inaccuracies in Cq values [45].
- PCR Efficiency: Reaction efficiency must be determined using a standard curve of serial dilutions. Efficiency between 90% and 105% is generally acceptable, with 100% representing perfect doubling every cycle [46]. The efficiency value is critical for accurate relative quantification. The Pfaffl method is recommended for calculating fold-changes when the efficiency of the target and reference genes differs [45] [46].
Table 2: Essential Reagents and Tools for qPCR in CNA Research
| Item | Function/Description | Example Products/Brands |
|---|---|---|
| Nucleic Acid Isolation Kit | To obtain high-quality, intact DNA from tissue samples (e.g., OSCC biopsies). | QIAamp DNA FFPE Tissue Kit [7], innuPREP isolation kits [43] |
| qPCR Master Mix | A pre-mixed solution containing DNA polymerase, dNTPs, salts, and optimized buffer. | biotechrabbit Capital qPCR Mix [43] |
| Specific Detection Chemistry | For fluorescent detection of amplicons. SYBR Green is cost-effective; probes offer higher specificity. | SYBR Green I, EVAgreen [43], Hydrolysis probes (e.g., TaqMan) [19] |
| Optimized Primers & Probes | For specific amplification of the target gene and reference genes. | Designed per MIQE guidelines [43] [19] |
| Gradient Thermal Cycler | Instrument that allows for temperature optimization across different wells in a single run. | qTOWERiris [43] |
| White-Well Plates & Seals | Plasticware that reduces optical cross-talk between wells and improves signal detection. | Ultra-clear caps or seals [43] |
Meticulous optimization of the master mix and thermal cycling conditions is not merely a procedural step but a fundamental requirement for generating publication-quality data in copy number alteration analysis. By adhering to the detailed protocols and considerations outlined in this application note—from stringent primer design and reagent consistency to empirical thermal profile optimization—researchers can ensure their qPCR data is both accurate and reproducible. This rigor is essential for reliably linking genetic alterations, such as amplifications in MLLT3 or ISG15, to clinical outcomes in oral cancer and for advancing our understanding of the disease's molecular drivers [19] [7].
Copy number alteration (CNA) analysis is a fundamental technique in molecular oncology research, providing critical insights into gene amplification events that drive cancer pathogenesis. In oral cancer research, the identification of amplified oncogenes through quantitative PCR (qPCR) offers valuable prognostic information and potential therapeutic targets. The ΔΔCq (comparative quantification cycle) method provides a robust, accessible approach for determining gene copy number variations (CNVs) directly from genomic DNA, enabling researchers to investigate oncogene amplification without requiring complex microarray or sequencing platforms. This protocol details the application of the ΔΔCq method specifically for copy number analysis in oral cancer research, following MIQE guidelines to ensure reproducible and reliable results [47] [48].
Theoretical Foundation of ΔΔCq for Copy Number Analysis
The ΔΔCq method for copy number calculation relies on the principle that each two-fold difference in template quantity produces approximately a 1-cycle difference in quantification cycle (Cq) when amplification efficiency is optimal. For copy number analysis, this method compares the Cq value of a target gene in test samples to a calibrator sample with known diploid copy number, normalized to a reference gene assumed to be copy-number neutral [47].
The fundamental formula for copy number calculation is:
Copy Number = 2 × 2^(-ΔΔCq)
Where:
- ΔΔCq = (Cq-target - Cq-reference)sample - (Cq-target - Cq-reference)calibrator
- The multiplier 2 accounts for the diploid (2 copies) nature of the calibrator sample
This approach enables precise determination of gene amplification events, which are clinically significant in oral squamous cell carcinoma (OSCC), particularly for oncogenes within frequently amplified chromosomal regions like 11q13.3 [47].
Materials and Experimental Setup
Research Reagent Solutions
Table 1: Essential Reagents and Materials for Copy Number Analysis
| Reagent/Material | Specification | Function/Application |
|---|---|---|
| TaqMan Copy Number Assay | Pre-designed probe/primer sets (e.g., Hs01625513_cn for FADD analysis) | Target-specific amplification with fluorescence detection [47] |
| Reference Assay | RNase P TaqMan Copy Number Reference Assay (or other single-copy gene) | Internal control for normalization [47] |
| qPCR Master Mix | TaqMan Genotyping Master Mix (2×) | Provides optimized buffer, enzymes, and dNTPs for amplification [47] |
| Genomic DNA | High-quality gDNA (≥10 ng/μL) | Template for amplification; purity (A260/280 ~1.8-2.0) is critical [47] |
| Calibrator Sample | DNA from healthy control tissue or commercially available diploid DNA | Baseline for comparative quantification [47] |
Equipment Requirements
- Real-time PCR system with capability for copy number analysis (e.g., 7500 Fast Real-Time PCR System)
- Optical 96-well plates and seals compatible with the detection system
- Centrifuge for plate preparation
- Nanodrop or equivalent for DNA quantification
- Laminar flow hood to prevent contamination
Step-by-Step Experimental Protocol
Step 1: Sample Preparation and DNA Quality Control
- Extract genomic DNA from oral cancer tissue samples using standardized phenol-chloroform or column-based methods.
- Quantify DNA concentration using spectrophotometry, ensuring A260/280 ratios between 1.8-2.0.
- Dilute DNA samples to working concentration of 5-10 ng/μL in nuclease-free water.
- Include control samples:
- Calibrator sample: Commercial diploid DNA or confirmed normal tissue DNA
- No-template control: Water instead of DNA template
- Positive control: DNA with known amplification (if available)
Step 2: qPCR Reaction Setup
Prepare reaction mix for each sample in triplicate:
- 5 μL TaqMan Genotyping Master Mix (2×)
- 0.5 μL Target TaqMan Copy Number Assay (20×)
- 0.5 μL Reference Assay (RNase P, 20×)
- 2 μL Genomic DNA (~10 ng)
- 2 μL Nuclease-free water
- Total reaction volume: 10 μL [47]
Loading protocol:
- Aliquot reaction mix into optical 96-well plates
- Include triplicate reactions for each sample and control
- Seal plates thoroughly to prevent evaporation
- Centrifuge briefly to collect contents at bottom of wells
Step 3: Thermal Cycling Conditions
Table 2: Standard Thermal Cycling Protocol for TaqMan Copy Number Assays
| Step | Temperature | Time | Cycles | Purpose |
|---|---|---|---|---|
| Initial Denaturation | 95°C | 10 minutes | 1 | Enzyme activation and initial denaturation |
| Amplification | 95°C | 15 seconds | 40 | Denaturation |
| 60°C | 60 seconds | 40 | Annealing/extension with data collection |
Step 4: Data Collection and Analysis
- Set fluorescence thresholds during exponential amplification phase
- Record Cq values for both target and reference assays
- Export data to spreadsheet software for further calculation
Data Analysis and Statistical Interpretation
Calculation of Copy Number
The step-by-step calculation procedure for determining gene copy number:
Calculate ΔCq for each sample: ΔCq-sample = Cq-target - Cq-reference
Calculate ΔCq for calibrator: ΔCq-calibrator = Cq-target - Cq-reference
Calculate ΔΔCq: ΔΔCq = ΔCq-sample - ΔΔCq-calibrator
Calculate copy number: Copy Number = 2 × 2^(-ΔΔCq)
Table 3: Example Data Set for FADD Copy Number Analysis in Oral Cancer
| Sample Type | Cq-Target | Cq-Reference | ΔCq | ΔΔCq | Calculated Copy Number | Interpretation |
|---|---|---|---|---|---|---|
| Calibrator (Diploid) | 25.4 | 23.8 | 1.6 | 0.0 | 2.0 | Normal |
| Tumor Sample 1 | 23.1 | 23.5 | -0.4 | -2.0 | 8.0 | Amplified |
| Tumor Sample 2 | 25.2 | 23.9 | 1.3 | -0.3 | 2.2 | Normal |
| Tumor Sample 3 | 22.8 | 23.6 | -0.8 | -2.4 | 10.6 | Amplified |
Interpretation Criteria
- Normal copy number: 1.5-2.5 copies (diploid range)
- Low-level amplification: 2.5-5.0 copies
- High-level amplification: >5.0 copies [47]
For clinical interpretation in oral cancer research, a comparative ΔΔCq > 0.59 typically indicates gene amplification, corresponding to approximately >3 copies [47].
Statistical Analysis for Research Studies
Descriptive Statistics:
- Report copy number values as mean ± standard deviation from triplicate measurements
- Calculate coefficient of variation (CV) for technical replicates (<5% acceptable)
Group Comparisons:
- Employ non-parametric tests (Mann-Whitney U or Kruskal-Wallis) for copy number comparisons between clinical subgroups
- For oral cancer studies, compare amplification frequency between:
- Different tumor stages
- With/without lymph node metastasis
- Various histological grades
Survival Analysis:
- Use Kaplan-Meier curves to visualize survival differences
- Log-rank test to compare survival between amplified vs. non-amplified groups
- Cox proportional hazards regression for multivariate analysis [47]
Experimental Workflow Visualization
Quality Control and Troubleshooting
Essential QC Parameters
PCR Efficiency Validation:
- Establish standard curves for each assay using serial dilutions
- Acceptable efficiency range: 90-110%
- Correlation coefficient (R²) > 0.98 [49]
Reference Gene Stability:
Reproducibility Assessment:
- Coefficient of variation (CV) between technical replicates <5%
- Inter-assay CV <10% for the same sample
Troubleshooting Common Issues
- High variation between replicates: Check pipetting accuracy, template quality, and ensure thorough mixing
- No amplification: Verify DNA quality, reaction components, and thermal cycling conditions
- Abnormal reference gene Cq values: Re-evaluate reference gene choice or DNA degradation
- Inconsistent copy number calculations: Confirm calibrator sample is truly diploid and calculations are correct
Applications in Oral Cancer Research
The ΔΔCq method for copy number analysis has proven particularly valuable in oral cancer research for:
Oncogene Amplification Detection:
- Identification of amplified oncogenes (e.g., FADD, CCND1) in OSCC [47]
- Correlation of amplification with clinical parameters and survival
Prognostic Stratification:
Therapeutic Target Identification:
- Amplified genes represent potential therapeutic targets
- Enables patient stratification for targeted therapies
Statistical Relationships in Copy Number Analysis
The ΔΔCq method provides a robust, accessible approach for gene copy number analysis in oral cancer research. When properly validated and executed according to MIQE guidelines, this technique generates reliable data on oncogene amplification events with direct clinical relevance. The statistical interpretation of copy number data enables correlation with clinicopathological parameters, offering insights into disease mechanisms and potential therapeutic targets. Implementation of this protocol will strengthen molecular studies in oral squamous cell carcinoma and contribute to improved patient stratification and treatment strategies.
Optimizing qPCR Assays: Solving Common Challenges in CNA Analysis
Addressing DNA Quality and Quantity Issues from Challenging Samples
Obtaining high-quality DNA from challenging biological samples is a critical prerequisite for reliable copy number alteration (CNA) analysis in oral cancer research using quantitative PCR (qPCR). Compromised DNA integrity directly impacts the accuracy of detecting clinically relevant genomic alterations, such as gains in oncogenes CCND1 or losses in tumor suppressor CDKN2A, which are common in oral squamous cell carcinoma (OSCC) [2] [50]. This application note provides evidence-based methodologies and detailed protocols for overcoming DNA degradation challenges specifically within the context of OSCC CNA analysis, enabling researchers to generate more reproducible and clinically meaningful data.
Understanding DNA Degradation Challenges in Oral Cancer Samples
DNA degradation presents a significant obstacle in oral cancer research, particularly when working with formalin-fixed paraffin-embedded (FFPE) tissues, low-yield salivary samples, or compromised biopsy specimens. The degradation process occurs through several distinct mechanisms that can compromise sample integrity before analysis [51].
Primary Degradation Mechanisms
- Oxidative Damage: Reactive oxygen species modify nucleotide bases, leading to strand breaks that interfere with PCR amplification. This is particularly problematic in samples exposed to environmental stressors or inflammatory tumor microenvironments common in OSCC [51].
- Hydrolytic Damage: Water molecules break phosphodiester bonds in the DNA backbone, causing depurination and fragmentation. Maintaining stable pH conditions during storage is crucial to minimize this damage [51].
- Enzymatic Breakdown: DNases naturally present in tissues rapidly degrade DNA if not properly inactivated during collection. This is especially relevant in salivary samples containing high enzymatic activity [51].
- Mechanical Shearing: Overly aggressive homogenization or pipetting can physically fragment DNA molecules, creating challenges for amplifying longer genomic regions needed for comprehensive CNA analysis [51].
Sample Preservation and Collection Strategies
Effective DNA preservation begins at sample collection. Proper stabilization methods are critical for maintaining DNA integrity in OSCC samples destined for sensitive CNA detection.
Advanced Preservation Methods
Table 1: DNA Preservation Methods for Oral Cancer Samples
| Method | Protocol Specifications | Optimal Storage Conditions | Suitable OSCC Sample Types | Impact on Downstream qPCR |
|---|---|---|---|---|
| Flash Freezing | Immediate immersion in liquid nitrogen | -80°C long-term storage | Fresh tissue biopsies, surgical specimens | Preserves long DNA fragments >1000bp ideal for multi-amplicon CNA panels |
| EDTA Preservation | Immersion in 0.5M EDTA, pH 8.0 [52] | Room temperature or 4°C | Buccal swabs, salivary samples, transportation specimens | Chelates metal ions to inhibit DNases; improves DNA yield for low-input samples |
| Chemical Preservatives | Commercially available nucleic acid stabilizers | Ambient temperature for transport | Gargle fluid, cytology brushes, remote collections | Prevents degradation during shipping; may require additional purification steps |
For OSCC samples, the recent discovery that EDTA effectively preserves DNA during the thawing process represents a significant advancement. Traditional freezing methods often subject samples to degradation during thawing before DNA extraction. Using EDTA as a thawing solution protects DNA by chelating metal ions required for DNase activity, thereby maintaining integrity for accurate CNA quantification [52].
Optimized DNA Extraction Protocols for Challenging OSCC Samples
Protocol: DNA Extraction from Difficult OSCC Tissues
This protocol is specifically optimized for fibrous OSCC tissues, FFPE samples, and low-cellularity specimens like gargle fluid or salivary samples.
Materials and Reagents:
- Bead Ruptor Elite homogenizer (or equivalent mechanical disruptor) [51]
- Specialist DNA extraction kits for challenging samples (e.g., Zymo Research)
- EDTA-containing lysis buffers [52]
- RNAse A solution
- Proteinase K (molecular biology grade)
- Solid tissue samples: FFPE sections, frozen biopsies
- Liquid samples: gargle fluid collection, salivary samples
Procedure:
Sample Preparation:
- For tissue samples: Cut into ≤25mg pieces using sterile scalpel. For FFPE samples, follow deparaffinization protocol with xylene and ethanol washes.
- For liquid samples: Concentrate cells by centrifugation at 3000×g for 10 minutes.
Mechanical Homogenization:
Enzymatic Digestion:
- Add 25μL Proteinase K (20mg/mL) and 5μL RNAse A (10mg/mL)
- Incubate at 56°C with agitation (750rpm) for 3 hours (overnight for FFPE)
DNA Purification:
- Follow manufacturer's protocol for column-based purification
- Include optional inhibitor removal steps for samples with PCR inhibitors
- Elute in 50-100μL elution buffer (10mM Tris-HCl, pH 8.5)
Quality Assessment:
- Quantify using fluorometric methods (Qubit)
- Assess purity via spectrophotometry (A260/A280 ratio: 1.8-2.0)
- Evaluate integrity through genomic DNA screen or PCR-amplification of housekeeping genes
Specialized Extraction Considerations
For bone-invading OSCC samples, a combined demineralization and extraction approach is necessary. Begin with EDTA demineralization (0.5M EDTA, pH 8.0, 24-48 hours at 4°C) followed by extended proteinase K digestion (overnight at 56°C) before mechanical homogenization [51].
Quality Control for CNA Analysis in Oral Cancer Research
Rigorous quality control is essential for reliable CNA detection in OSCC samples. The MIQE 2.0 guidelines provide a framework for ensuring qPCR data reliability [53].
Quality Assessment Protocol
Table 2: Quality Control Parameters for OSCC DNA Samples in CNA Analysis
| QC Parameter | Acceptance Criteria | Assessment Method | Impact on CNA Analysis |
|---|---|---|---|
| DNA Concentration | ≥5ng/μL for liquid samples, ≥15ng/μL for tissues | Fluorometric quantification (Qubit) | Ensures sufficient template for reference and target amplifications |
| Purity Ratio | A260/A280: 1.8-2.0; A260/A230: 2.0-2.2 | Spectrophotometry (NanoDrop) | Detects contaminants that inhibit PCR amplification |
| DNA Integrity | DIN ≥7.0 (genomic), >200bp amplifiable fragments | Fragment analyzer, PCR of housekeeping genes | Ensures representative amplification of target loci |
| PCR Inhibitors | ΔCq <1 between diluted and undiluted samples | Spike-in control, dilution test | Prevents false negative CNA calls |
| Amplification Efficiency | 90-110% with R² >0.98 | Standard curve analysis | Ensures accurate quantification of copy number ratios |
Implement fragment analysis to assess DNA integrity, particularly for degraded samples. This technique provides a size distribution profile that predicts amplification success across multiple genomic loci targeted in CNA panels [51].
The Scientist's Toolkit: Research Reagent Solutions
Table 3: Essential Reagents for DNA Workflow from Challenging OSCC Samples
| Reagent/Category | Specific Examples | Function in Workflow | Application Notes for OSCC |
|---|---|---|---|
| Nuclease Inhibitors | EDTA, EGTA, commercial nuclease inactivation solutions | Chelates metal cofactors required for DNase activity | Critical for salivary samples with high DNase activity [52] |
| Mechanical Homogenization | Ceramic beads (2.8mm), stainless steel beads, specialized bead tubes | Physically disrupts tough tissue matrices | Essential for fibrous OSCC tissues; prevents excessive heat buildup [51] |
| Enzymatic Digestion | Proteinase K, RNAse A, lysozyme (for microbial contamination) | Breaks down cellular structures, degrades RNA | Extended digestion improves yield from FFPE samples |
| Specialized Buffers | Lysis buffers with optimized pH, binding buffers with chaotropic salts | Creates optimal conditions for DNA release and stabilization | EDTA-containing buffers improve DNA recovery during thawing [52] |
| Purification Technologies | Silica membrane columns, magnetic beads, organic extraction | Separates DNA from proteins, inhibitors, and other contaminants | Column-based methods preferred for inhibitor-rich samples |
Experimental Workflow for CNA Analysis in OSCC
The following diagram illustrates the complete workflow from sample collection to CNA analysis in oral cancer research:
Addressing DNA quality and quantity challenges from difficult OSCC samples requires an integrated approach spanning collection, preservation, extraction, and quality control. By implementing these evidence-based protocols and maintaining rigorous quality standards per MIQE 2.0 guidelines, researchers can significantly improve the reliability of CNA analysis in oral cancer research. These methodologies enable more accurate detection of clinically relevant copy number alterations, ultimately advancing our understanding of OSCC progression and treatment response.
Accurate copy number alteration (CNA) analysis in oral squamous cell carcinoma (OSCC) provides crucial prognostic and predictive information for patient management [19]. Quantitative PCR (qPCR) remains a robust, gold-standard method for validating genomic biomarkers identified through global profiling techniques due to its sensitivity, specificity, and compatibility with formalin-fixed paraffin-embedded (FFPE) samples [19] [12]. The exquisite sensitivity and specificity of qPCR assays depend overwhelmingly on optimal primer and probe design, which directly controls technical precision and prevents false positive/negative results [54]. This application note provides detailed protocols for designing and optimizing qPCR primers and probes specifically for CNA analysis in oral cancer research, ensuring data reliability for critical diagnostic and therapeutic decisions.
Table 1: Key Challenges in CNA Analysis for Oral Cancer Research
| Challenge | Impact on Data Quality | Solution Approach |
|---|---|---|
| Low DNA input from FFPE samples [12] | Reduced sensitivity and failed reactions | Optimize DNA input (5-20 ng); validate with diluted samples |
| Presence of PCR inhibitors [55] | Amplification efficiency >100%; inaccurate quantification | Spectrophotometric purity assessment (A260/280 >1.8); sample dilution |
| Cross-platform validation discrepancies [19] | Inconsistent prognostic biomarker identification | Rigorous primer validation; orthogonal confirmation |
| Submicroscopic copy number variations [2] | Missed clinically relevant deletions | Multiplex ddPCR designs targeting specific fragile sites |
Foundational Principles of qPCR Primer and Probe Design
Core Design Parameters for Primers
Effective primer design requires balancing multiple thermodynamic and sequence-based factors to ensure specific and efficient amplification [33]. The optimal melting temperature (Tm) for primers is 60-64°C, with forward and reverse primers differing by no more than 2°C to enable simultaneous binding [33]. GC content should be maintained between 35-65% (ideal 50%) to provide sufficient sequence complexity while avoiding excessive stability [33]. Primer length typically falls between 18-30 bases, ultimately determined by the target Tm requirements rather than arbitrary length constraints [33].
Secondary structures like hairpins, self-dimers, and cross-dimers must be screened using tools such as the OligoAnalyzer Tool, with ΔG values weaker than -9.0 kcal/mol to prevent formation of stable interfering structures [33]. The 3' ends of primers should terminate in G or C residues (GC clamp) to increase binding specificity, while avoiding stretches of 4 or more consecutive G residues, which can promote non-specific annealing [33] [56].
Key Considerations for Hydrolysis Probes
Hydrolysis probes (such as TaqMan probes) require additional design considerations to ensure specific detection of amplified products [33]. Probes should have a Tm 5-10°C higher than the accompanying primers to ensure hybridization before primer annealing, and should be positioned in close proximity to—but not overlapping with—primer binding sites [33]. For double-quenched probes, incorporating internal quenchers like ZEN or TAO provides lower background fluorescence compared to single-quenched designs, especially for longer probes [33]. Avoid placing a guanine base at the 5' end, as it can quench fluorophore fluorescence even after cleavage [33].
Amplicon Characteristics
Amplicon design significantly impacts qPCR efficiency and specificity [54]. For optimal amplification, target amplicons of 70-150 base pairs, which are sufficiently long for unique sequence identification while remaining efficiently amplified under standard cycling conditions [33] [56]. When working with RNA or assessing genes with potential pseudogenes, design assays to span exon-exon junctions where possible to prevent amplification of genomic DNA contaminants [33]. Before finalizing designs, perform BLAST analysis to verify target specificity, ensuring primers and probes are unique to the intended sequence [33].
Experimental Protocol: A Step-by-Step Workflow
In Silico Design and Evaluation
Step 1: Target Sequence Acquisition
- Obtain the nucleotide sequence of your gene of interest from curated databases (e.g., NCBI RefSeq using accession numbers NM_ for curated mRNA sequences) [54].
- For oral cancer CNA analysis, focus on genes with established prognostic value such as CCND1, CDKN2A, FAT1, and MLLT3 based on their documented roles in OSCC pathogenesis [19] [7] [2].
Step 2: Primer and Probe Design
- Utilize specialized design tools such as Primer-BLAST, PrimerQuest, or Eurofins Genomics qPCR Assay Design Tool with parameters specified in Table 2 [57] [56].
- Input the target sequence and define the specific region for amplification based on the CNA of interest.
- For oral cancer applications, ensure designs avoid regions with known single nucleotide polymorphisms that are prevalent in OSCC populations.
Step 3: Specificity Verification
- Perform in silico specificity checking against the appropriate genome assembly using Primer-BLAST parameters [56].
- Verify absence of significant homology to pseudogenes or related gene family members.
- For oral cancer research, cross-reference with OSCC-specific sequence databases when available.
Figure 1: Comprehensive qPCR assay design and validation workflow encompassing both in silico and experimental phases.
Wet Laboratory Validation
Step 4: Efficiency and Sensitivity Determination
- Prepare a 5-10 point serial dilution series (typically 1:10 or 1:5 dilutions) of template DNA spanning the expected concentration range [55].
- For oral cancer CNA analysis, use control samples with known copy numbers (e.g., cell lines with documented CNAs such as SCC-25 for oral cancer) [2].
- Run qPCR reactions with diluted samples and plot Ct values against log template concentration.
- Calculate amplification efficiency using the formula: E = -1+10^(-1/slope), with ideal efficiency between 90-110% [55].
Step 5: Specificity Assessment
- Analyze amplification curves for sigmoidal shape and absence of secondary peaks.
- Perform melt curve analysis for SYBR Green-based assays to verify single product formation.
- For oral cancer applications, test against related genes and pseudogenes to ensure no cross-reactivity.
Step 6: Robustness Testing
- Perform temperature gradient experiments (typically ±5°C from calculated annealing temperature) to determine optimal and robust cycling conditions [54].
- Test different DNA inputs (e.g., 5, 10, 20 ng) to establish the optimal working range [12].
- For FFPE-derived samples common in oral cancer research, include samples with varying degradation levels to assess performance across sample qualities.
Step 7: Validation in Biological Context
- Apply optimized assays to well-characterized oral cancer cell lines with known CNAs before analyzing clinical samples [2].
- For clinical OSCC samples, include appropriate normal adjacent tissue controls to establish baseline copy number values [19].
- Correlate qPCR results with orthogonal methods (e.g., nCounter, ddPCR, or SNP arrays) to verify technical accuracy [19] [2].
Data Analysis and Interpretation
Calculating qPCR Efficiency
Amplification efficiency is calculated from the standard curve generated using serial dilutions [55]. The slope of the trend line through the data points is used in the equation: E = -1+10^(-1/slope). Ideal efficiency of 100% corresponds to a slope of -3.32, with each 10-fold dilution resulting in a ΔCt of approximately 3.32 cycles [55]. Efficiencies significantly exceeding 100% often indicate polymerase inhibition in concentrated samples, which can be addressed by sample dilution or additional purification [55].
Table 2: Optimal Design Parameters for qPCR Primers and Probes
| Parameter | Primers | Hydrolysis Probes | Importance |
|---|---|---|---|
| Length | 18-30 bases [33] | 20-30 bases (single-quenched) [33] | Balanced specificity and binding efficiency |
| Melting Temperature (Tm) | 60-64°C (≤2°C difference between pairs) [33] | 5-10°C higher than primers [33] | Ensures simultaneous primer binding and probe hybridization |
| GC Content | 35-65% (ideal 50%) [33] | 35-65% [33] | Provides sequence complexity while maintaining appropriate stability |
| 3' End Requirement | G or C residue (GC clamp) [56] | N/A | Precreases binding specificity; prevents non-specific extension |
| Amplicon Length | 70-150 bp (up to 500 bp possible) [33] | Positioned within amplified region | Shorter amplicons amplify more efficiently; important for degraded FFPE DNA |
Troubleshooting Common Issues
Poor Efficiency (<90% or >110%)
- Redesign primers if secondary structures are identified [55].
- Optimize Mg2+ concentration and annealing temperature [54].
- Check DNA purity (A260/280 ratios >1.8 for DNA) and consider inhibitor removal [55].
Non-Specific Amplification
- Increase annealing temperature incrementally (1-2°C steps).
- Reduce primer concentration (typically 50-900 nM) to minimize primer-dimer formation [54].
- Utilize hot-start polymerase to prevent mispriming during reaction setup.
Inconsistent Replicate Results
- Verify consistent pipetting and template quality.
- Ensure complete mixing of reaction components.
- Check for well-to-well temperature variation in thermal cycler.
Application to Oral Cancer CNA Analysis
Oral Cancer-Specific Considerations
OSCC presents unique challenges for CNA analysis due to the diverse etiological factors (betel quid chewing, tobacco, HPV infection) that influence genetic alterations [7]. When designing primers and probes for oral cancer genes, consider the specific CNAs prevalent in OSCC, including amplifications at 3q, 5p, 7p, 8q, 11q, and 20q, and deletions at 3p, 8p, 9p, and 18q [7] [2]. Target genes with established prognostic significance in OSCC, such as ISG15 (associated with survival outcomes), CCND1 (11q13 amplification), and CDKN2A (9p21 deletion) [19] [2].
For analyzing FFPE-derived DNA from OSCC samples, which is often fragmented, design shorter amplicons (70-100 bp) to ensure efficient amplification across degraded templates [12]. Include reference genes located in chromosomally stable regions for accurate copy number normalization; the nCounter NanoString technique uses multiple reference probes for this purpose, a strategy that can be adapted to qPCR by including several reference assays [19].
Interplatform Validation
Recent studies comparing qPCR with emerging technologies like nCounter NanoString reveal important considerations for oral cancer CNA analysis [19]. While qPCR remains robust for biomarker validation, researchers should be aware that different platforms may yield varying prognostic associations for the same gene (e.g., ISG15 showed opposite prognostic correlations between qPCR and nCounter) [19]. This underscores the importance of rigorous optimization and validation of qPCR assays specifically for their intended biological context.
Table 3: Essential Research Reagent Solutions for Oral Cancer CNA Analysis
| Reagent/Category | Specific Examples | Function/Application |
|---|---|---|
| qPCR Master Mixes | inhibitor-tolerant chemistries; multiplex PCR mixes | Robust amplification from challenging FFPE-derived DNA; simultaneous multi-gene analysis |
| DNA Extraction Kits | QIAamp DNA FFPE Tissue Kit [7] | High-quality DNA recovery from archival oral cancer samples |
| Reference Assays | TaqMan Copy Number Reference Assays [12] | Normalization to diploid genomic regions for accurate CNA quantification |
| Control Materials | OSCC cell lines (SCC-4, SCC-9, SCC-25) [2] | Positive controls with known CNAs; assay validation |
| Design Tools | PrimerQuest [33], OligoAnalyzer [33], Primer-BLAST [56] | In silico design and validation of primers and probes |
Optimal primer and probe design is fundamental to reliable CNA analysis in oral cancer research, directly impacting assay specificity, sensitivity, and reproducibility. By following the detailed protocols outlined in this application note—incorporating appropriate design parameters, rigorous validation workflows, and oral cancer-specific considerations—researchers can develop robust qPCR assays capable of detecting clinically relevant CNAs. As molecular profiling continues to inform prognostic stratification and therapeutic decisions in OSCC, technically sound qPCR methodologies provide an accessible, reliable platform for validating genomic biomarkers in both research and clinical settings.
In the context of copy number alteration (CNA) analysis in oral cancer research, precise and reproducible quantitative PCR (qPCR) results are paramount. The accuracy of data used for drug development and clinical research decisions hinges on the fine-tuning of thermal cycler protocols, specifically the annealing and extension steps. Proper optimization ensures maximum amplification efficiency, specificity, and sensitivity, which is critical when quantifying subtle genetic variations such as gene amplifications or deletions in oral squamous cell carcinoma (OSCC) [43] [58]. This application note provides a detailed, stepwise protocol for researchers and scientists to optimize these key qPCR parameters.
Stepwise Optimization Methodology
A methodical, one-factor-at-a-time approach is essential for effective optimization. The following sequential procedure ensures that each parameter is calibrated for optimal performance before proceeding to the next.
Step 1: Primer Design and Validation
Optimization begins with robust primer design. For CNA analysis in oral cancer, where homologous genes or highly similar pseudogenes may be present, primers must be designed to be uniquely specific to the target locus.
- Design Specifications: Target an amplicon size of 50-200 bp for efficient amplification [43]. Primer length should optimally be 28 base pairs or larger to reduce primer-dimer formation [43]. The GC content should be maintained between 40-60%, and the 3' end should avoid runs of more than three G or C nucleotides [43].
- Sequence Specificity: Crucially, design primers based on single-nucleotide polymorphisms (SNPs) that differentiate the target gene from its homologous sequences in the genome. This ensures the primer pair is specific for the gene of interest, a non-negotiable requirement for accurate CNA analysis [58].
- In Silico Validation: Use tools like BLAST and Primer-BLAST to verify primer specificity and check for potential off-target binding sites [43] [58].
Step 2: Annealing Temperature Optimization
The annealing temperature (Ta) is the most critical variable governing primer specificity and yield.
- Theoretical Calculation: Calculate the melting temperature (Tm) for each primer. The optimal Ta is typically 3-5°C below the lowest Tm of the primer pair, but this must be determined empirically [59] [60].
- Empirical Determination with Gradient PCR: Utilize a gradient thermal cycler to test a range of annealing temperatures in a single run. A typical initial gradient span of 8-10°C (e.g., from 55°C to 65°C) is highly effective for identifying the optimal window [60].
- Analysis: The optimal Ta is identified as the highest temperature that produces the maximum yield of the specific target amplicon with minimal or no non-specific products or primer-dimers [60]. This high-temperature stringency is vital for discriminating between specific and non-specific amplification in complex genomic DNA samples.
Step 3: Annealing and Extension Time Adjustment
Once the optimal Ta is established, fine-tune the duration of the annealing and extension steps.
- Annealing Time: For most reactions, 15-30 seconds is sufficient. The time should be long enough to allow for specific primer binding but not so long as to promote non-specific binding [43].
- Extension Time: Calculate the extension time based on the polymerase's synthesis speed and the amplicon length. A common guideline is 1 minute per 1,000 bp, but for the short amplicons (50-200 bp) typical in qPCR, 10-30 seconds is often adequate. Some systems may require a longer extension time (e.g., >30 seconds) for optimal fluorescent signal detection [43]. A two-step PCR protocol, which combines annealing and extension at 60°C, can also be used to save time [43].
Step 4: Cycle Number and Efficiency Calculation
- Cycle Number: Standard protocols often run for 40 cycles. If the amplification curve reaches the plateau phase early, consider reducing the cycle number to 30 to save time and reduce background signal [43].
- Efficiency Calculation: PCR efficiency must be calculated to validate the optimized protocol. Prepare a standard curve using a serial dilution (e.g., 1:10, 1:100, 1:1000) of the DNA template. Plot the log of the dilution factor against the Ct value and calculate the slope. Efficiency (E) is calculated as: Efficiency (%) = (10^(-1/Slope) - 1) x 100 [61]. An ideal, optimized reaction has an efficiency between 90% and 105% (or 85-110% as a broader acceptable range) with a correlation coefficient (R²) of ≥ 0.99 [61] [58].
The following workflow diagram summarizes the stepwise optimization process:
Quantitative Optimization Parameters
The table below summarizes the key variables and their optimal ranges for fine-tuning annealing and extension steps.
Table 1: Key Parameters for Annealing and Extension Optimization
| Parameter | Optimal Range | Considerations for Oral Cancer CNA Analysis |
|---|---|---|
| Annealing Temperature (Tₐ) | 3-5°C below primer Tₘ (theoretical start) | Use gradient PCR for empirical determination; higher stringency reduces false priming from homologous sequences [60]. |
| Annealing Time | 15-30 seconds | Sufficient for specific binding; longer times may increase non-specific amplification [43]. |
| Extension Time | 10-30 seconds (for amplicons <200 bp) | Based on polymerase speed (e.g., 1,000 bp/min). For fast enzymes, shorter times are possible [43]. |
| Amplicon Length | 50-200 bp | Shorter fragments amplify more efficiently and are tolerant of a wider range of PCR conditions [43]. |
| Target PCR Efficiency | 90-105% | Efficiency outside this range can lead to inaccurate fold-change calculations in CNA analysis [61]. |
| Gradient Range (Initial Test) | 8-10°C | A wide range (e.g., 55°C to 65°C) efficiently identifies the optimal temperature window [60]. |
The Scientist's Toolkit: Research Reagent Solutions
The following table details essential materials and their functions for successfully implementing this optimized protocol.
Table 2: Essential Reagents and Materials for qPCR Optimization
| Item | Function / Importance | Optimization Note |
|---|---|---|
| High-Fidelity Master Mix | Provides reliable, hot-start polymerase, buffer, dNTPs. Essential for specific amplification. | Choose a mix with a proprietary buffer formulated for robust performance; consistency is key [43]. |
| Gradient Thermal Cycler | Allows simultaneous testing of multiple annealing temperatures in a single run. | Dramatically reduces optimization time and reagent consumption compared to sequential runs [60]. |
| White-Well qPCR Plates | Reduce light refraction and crosstalk between wells, enhancing fluorescence signal detection. | Improves well-to-well consistency and signal-to-noise ratio [43] [62]. |
| Optically Clear Seals/Caps | Minimize distortion of the fluorescent signal as it is read by the instrument. | Critical for ensuring accurate fluorescence measurements across all wells [43] [62]. |
| Nuclease-Free Water | Serves as the reaction solvent. | Must be certified free of nucleases and contaminants to prevent reaction degradation [62]. |
Application to Oral Cancer Copy Number Alteration Analysis
In oral cancer research, particularly in studies investigating genes like FN1, CXCL8, and MMP9 which are implicated in lymph node metastasis, precise qPCR is non-negotiable [63]. Accurate copy number analysis demands a protocol with high efficiency and specificity to confidently distinguish between diploid and altered genomic states. The optimized annealing temperature prevents false positives from non-specific amplification of homologous regions or pseudogenes, which is a common risk in genomic DNA analysis. Furthermore, a validated protocol with known efficiency is a prerequisite for using reliable quantification methods, such as the 2^(-ΔΔCt) method, ensuring that observed differences in gene dosage are real and biologically significant [61] [58].
Troubleshooting Common Issues
Even with a standardized protocol, issues can arise. The table below connects common problems to their potential causes and solutions related to annealing and extension.
Table 3: Troubleshooting Guide for Annealing and Extension
| Observation | Possible Cause | Recommended Solution |
|---|---|---|
| Low or No Amplification | Annealing temperature is too high. | Widen the gradient range to test lower temperatures. Re-check primer Tₘ calculations [59]. |
| Multiple or Non-Specific Bands | Annealing temperature is too low; primer-dimer formation. | Increase annealing temperature incrementally. Verify primer specificity and re-design if necessary [59] [60]. |
| Low PCR Efficiency (<85%) | Suboptimal reaction conditions; poor primer design; inhibitor presence. | Re-optimize Ta and times. Check primer sequences. Purify template DNA. Ensure fresh, properly diluted reagents are used [61] [59]. |
| High PCR Efficiency (>110%) | Presence of PCR inhibitors; template contamination. | Further purify the DNA template. Use clean, nuclease-free plastics and workspace. Check for contamination [61]. |
| High Well-to-Well Variation | Inconsistent thermal transfer; poor sealing. | Use thin-walled PCR plates compatible with the cycler block. Ensure seals are firmly and evenly applied [62]. |
Fine-tuning the annealing and extension parameters of a thermal cycler protocol is a critical, non-negotiable process in generating publication-grade data for copy number alteration analysis in oral cancer. By adhering to the structured, stepwise optimization methodology outlined herein—validating primers, empirically determining the optimal annealing temperature via a gradient cycler, adjusting times, and rigorously calculating efficiency—researchers can establish a robust and reliable qPCR assay. This rigorous approach ensures the accuracy and reproducibility required for meaningful conclusions in both basic research and applied drug development.
Troubleshooting Poor Amplification Efficiency and High Background Noise
In the molecular analysis of oral cancer, quantitative PCR (qPCR) is a cornerstone technique for validating copy number alterations (CNAs) identified through broader genomic screens. The sensitivity and specificity of qPCR are paramount for accurately quantifying gene dosage changes in oncogenes and tumor suppressor genes. However, poor amplification efficiency and high background noise frequently compromise data integrity, leading to inaccurate CNA estimates and false conclusions. This application note provides a systematic troubleshooting guide to identify, diagnose, and resolve these common issues, ensuring reliable qPCR data for oral cancer research.
Understanding and Diagnosing Common qPCR Issues
Accurate problem identification is the first step in effective troubleshooting. The table below summarizes the core symptoms, common causes, and initial diagnostic steps for the two primary issues addressed in this note.
Table 1: Diagnostic Overview of Poor Amplification Efficiency and High Background Noise
| Symptom | Primary Indicators | Common Causes | Immediate Diagnostic Actions |
|---|---|---|---|
| Poor Amplification Efficiency | High Ct values, shallow amplification curve slope, low yield [64] [65] | Suboptimal primer/probe design, PCR inhibitors, degraded template, suboptimal reaction conditions [64] | Calculate PCR efficiency via standard curve; check primer dimers with melt curve analysis [65] |
| High Background Noise | Elevated baseline fluorescence, non-specific amplification, multiple peaks in melt curve [66] [65] | Non-specific primer binding, primer-dimer formation, contaminated reagents, excessive fluorescent dye [64] [66] | Run a no-template control (NTC); analyze melt curve for product homogeneity [66] |
The following diagram outlines a systematic workflow for diagnosing these problems based on their observed symptoms.
Figure 1: A logical workflow for diagnosing the root cause of poor qPCR results.
The Scientist's Toolkit: Essential Reagents and Controls
Employing the correct reagents and controls is fundamental to robust qPCR experiments, especially when working with challenging samples like clinical oral cancer biopsies.
Table 2: Key Research Reagent Solutions for qPCR Troubleshooting
| Reagent/Material | Function | Troubleshooting Application |
|---|---|---|
| High-Quality Master Mix | Provides buffer, dNTPs, polymerase, and optimized salts [66]. | Use hot-start enzymes to reduce primer-dimer formation; select a mix compatible with your detection chemistry (probe vs. intercalating dye) [66]. |
| Nuclease-Free Water | A critical solvent for preparing reaction mixes. | Use for all dilutions to avoid RNase/DNase contamination that degrades template and reagents. |
| No-Template Control (NTC) | A reaction containing all components except the template DNA/cDNA [66]. | Essential for detecting contamination or primer-dimer formation that causes high background noise. |
| No Reverse Transcriptase Control (-RT) | Contains RNA template but omits the reverse transcriptase enzyme [66]. | Used in RT-qPCR to detect amplification from contaminating genomic DNA. |
| Intercalating Dye (e.g., SYBR Green) | Fluoresces when bound to double-stranded DNA [66] [65]. | A cost-effective option for melt curve analysis to verify amplicon specificity and identify non-specific products. |
| Exon-Spanning Primers | Primers designed to bind across an exon-exon junction. | When working with RNA, ensures amplification from cDNA and not contaminating genomic DNA, reducing background. |
| Standard Curve Dilutions | A series of known template concentrations. | Required for calculating PCR efficiency and assessing dynamic range; confirms the assay is quantifiable [65]. |
Experimental Protocols for Troubleshooting and Optimization
Protocol: Determining PCR Amplification Efficiency
Accurate quantification, essential for discerning subtle copy number variations in oral cancer genes, relies on high and consistent PCR efficiency [67] [65].
- Template Dilution: Prepare a serial dilution of a known positive template (e.g., plasmid DNA or cDNA). Use a dilution factor of 1:10 or 1:5, creating at least 5 data points spanning the expected concentration range of your experimental samples.
- qPCR Run: Amplify each dilution in triplicate using your standard qPCR protocol.
- Data Analysis: Record the mean Ct value for each dilution.
- Plot the mean Ct (Y-axis) against the logarithm (base 10) of the relative template concentration (X-axis).
- Perform a linear regression analysis to obtain the slope of the trendline.
- Efficiency Calculation:
- Calculate the PCR efficiency (E) using the formula: E = [10(-1/slope)] - 1.
- Multiply by 100 to express as a percentage [65].
- Interpretation: An ideal reaction has an efficiency of 100% (slope = -3.32). Acceptable efficiency typically ranges from 90% to 110% [65]. Efficiency outside this range requires optimization.
Protocol: Investigating and Reducing High Background Noise
High background signal can obscure the true amplification curve, leading to inaccurate Ct value determination [64] [66].
- Run Controls:
- Include a No-Template Control (NTC) to check for reagent contamination or primer-dimer formation.
- For RT-qPCR, include a No-Reverse-Transcriptase (-RT) control to assess genomic DNA contamination.
- Analyze Melt Curves (for SYBR Green assays):
- After amplification, run a melt curve analysis by gradually increasing the temperature and measuring fluorescence loss.
- A single sharp peak indicates a single, specific PCR product. Multiple peaks or a broad peak suggest non-specific amplification or primer-dimer formation [66].
- Optimize Annealing Temperature:
- If non-specific products are detected, perform a temperature gradient qPCR.
- Test a range of annealing temperatures (e.g., 55°C to 65°C) to identify the temperature that maximizes specific product yield and minimizes background.
- Verify Primer Specificity:
- Use software to check for secondary structures and self-complementarity in your primers.
- Consider redesigning primers if optimization fails to resolve non-specific amplification [64].
The following diagram illustrates the integrated workflow for performing these diagnostic and optimization protocols.
Figure 2: An experimental workflow for determining PCR efficiency and assessing amplification specificity.
Data Analysis and Statistical Considerations
Proper data analysis is critical for interpreting qPCR results, particularly in copy number analysis where fold-change differences can be small. The two most common methods for relative quantification are the Livak (2^(-ΔΔCt)) and Pfaffl methods [21] [65].
The Livak method is simpler but assumes the amplification efficiencies of the target and reference genes are equal and close to 100%. The Pfaffl method is more robust as it incorporates actual, experimentally derived efficiency values for both the target and reference genes, providing greater accuracy when efficiencies are not perfect [21]. Statistical analysis should be applied to the efficiency-weighted ΔCt values, which follow a normal distribution, allowing for the use of t-tests or analysis of variance (ANOVA) to calculate confidence intervals and significance levels [21] [67]. Tools like the R rtpcr package can facilitate this robust statistical analysis [21].
Effective troubleshooting of qPCR, focusing on achieving optimal amplification efficiency and minimizing background noise, is non-negotiable for producing reliable data in oral cancer research. By adhering to the diagnostic workflows, experimental protocols, and analysis methods outlined in this application note, researchers can significantly improve the quality of their copy number alteration data. A systematic approach to qPCR optimization not only enhances data credibility but also strengthens the molecular insights into oral cancer pathogenesis and progression.
The Minimum Information for Publication of Quantitative Real-Time PCR Experiments (MIQE) guidelines establish a standardized framework for designing, executing, and reporting qPCR experiments to ensure reproducibility and credibility of results [68]. First published in 2009, these guidelines have recently been updated to MIQE 2.0, reflecting advances in qPCR technology and addressing the evolving complexities of contemporary applications [69]. The revised guidelines provide clear recommendations for sample handling, assay design, validation, and data analysis, emphasizing that transparent and comprehensive reporting of all experimental details is essential for repeatability [69].
The MIQE guidelines were developed by an international consortium of multidisciplinary experts in molecular biology, clinical diagnostics, statistics, regulatory science, and bioinformatics [70]. Despite widespread awareness of MIQE, compliance remains problematic, with serious deficiencies persisting in experimental transparency, assay validation, and data reporting [70]. This matters profoundly because qPCR is not a niche technique but arguably the most commonly employed molecular tool in life science and clinical laboratories, with results underpinning decisions in biomedical research, diagnostics, pharmacology, and public health [70].
MIQE 2.0: Key Updates and Requirements
Core Principles and Reporting Requirements
The MIQE 2.0 guidelines maintain the original goal of promoting transparent and comprehensive reporting while updating specific recommendations to reflect technological advances [69]. A fundamental principle is the conversion of quantification cycle (Cq) values into efficiency-corrected target quantities reported with prediction intervals, along with detection limits and dynamic ranges for each target [69]. The guidelines also emphasize that instrument manufacturers should enable raw data export to facilitate thorough analyses and re-evaluation by manuscript reviewers and interested researchers [69].
The reporting requirements have been clarified and streamlined to encourage researchers to provide all necessary information without undue burden [69]. This includes detailed information about sample handling, nucleic acid quality, assay validation, normalization strategies, and data analysis procedures. The aim is to promote more rigorous and reproducible qPCR research by ensuring all critical experimental parameters are documented [69].
Critical Areas Often Overlooked
Analysis of published literature reveals several areas where MIQE compliance remains particularly problematic [70]. These include:
- Nucleic acid quality and integrity are not properly assessed [70]
- Assay efficiencies are assumed, not measured [70]
- Normalization is based on reference genes that are neither stable nor validated [70]
- Small fold-changes (1.2- or 1.5-fold) are routinely reported as biologically meaningful without assessment of measurement uncertainty or technical variance [70]
- Inappropriate statistical methods and overinterpretation of results [70]
These are not marginal oversights but fundamental methodological failures that compromise data integrity and reproducibility [70].
Application to Copy Number Alteration Analysis in Oral Cancer
qPCR Workflow for Copy Number Analysis
The analysis of copy number alterations (CNA) in oral cancer research using qPCR requires careful experimental design and validation. A high-throughput qPCR-based method for detecting CNA in tumors can serve as an alternative approach to next-generation sequencing in routine clinical practice [71]. The fundamental workflow involves proper sample selection, DNA extraction, assay design and validation, qPCR execution, and data analysis using the comparative ΔΔCq method.
Table 1: Essential Components for Copy Number Alteration Analysis in Oral Cancer
| Component | Specification | Application in Oral Cancer CNA Analysis |
|---|---|---|
| Sample Quality | DNA integrity number (DIN) >7.0 | Ensures reliable amplification and quantification of genomic regions |
| Reference Genes | Multiple diploid genes on different chromosomes | Corrects for sample-to-sample variation; 8 reference genes recommended [71] |
| Target Genes | Oral cancer-related genes (e.g., oncogenes, tumor suppressors) | Identifies clinically relevant copy number alterations |
| Assay Validation | Efficiency 90-110%, R² >0.98 | Ensures precise and accurate quantification |
| qPCR Chemistry | Intercalating dyes or hydrolysis probes | Provides specific detection of target sequences |
| Data Analysis | Comparative ΔΔCq method with efficiency correction | Calculates copy number variations relative to normal diploid genome |
Reference Gene Selection Strategy
In CNA analysis, proper selection of reference genes is critical. Research demonstrates that using multiple reference genes located on different chromosomes and various chromosomal regions improves the accuracy and reliability of the qPCR approach [71]. A robust strategy involves selecting 8 reference genes located on different chromosomes (e.g., chr1, chr4, chr6, chr7, chr14, chr15, chr17, chr19) and on various chromosomal regions (close to the centromere, close to the telomere, and in between) that are known to have two copies in a diploid genome [71].
In tumor tissues, the copy number of each gene is calculated by the comparative ΔΔCq method obtained from the tumor and control tissue (e.g., normal oral mucosa) pairs of each patient [71]. The relative copy number of each gene is determined in comparison to the other reference genes in each sample. The acceptable range for relative copy numbers where the copy numbers in the tumor and reference control tissue are equal is within 0.8 and 1.25 with a 90% confidence interval (α = 0.1) [71].
Experimental Protocol for CNA Detection in Oral Cancer
Protocol: Copy Number Alteration Analysis in Oral Cancer Tissue
Sample Preparation
- Tissue Collection: Obtain oral cancer tissue samples and matched normal oral mucosa (control) during surgical resection. Snap-freeze immediately in liquid nitrogen and store at -80°C.
- DNA Extraction: Isolate genomic DNA using a commercial DNA extraction kit. Determine DNA concentration using fluorometry and assess quality by spectrophotometry (A260/A280 ratio 1.8-2.0) and agarose gel electrophoresis.
- DNA Normalization: Dilute all DNA samples to a uniform concentration (e.g., 10 ng/μL) in nuclease-free water.
Assay Design and Validation
- Target Selection: Identify oral cancer-relevant genes for CNA analysis (e.g., oncogenes frequently amplified in oral cancer, tumor suppressor genes frequently deleted).
- Reference Gene Selection: Choose multiple reference genes located on different chromosomes. The study by [71] successfully used ALB, B2M, BCKDHA, F5, CD36, MPO, TBP, and RPPH1.
- Primer/Probe Design: Design assays with amplicons 50-150 bp. Verify specificity using BLAST against the human genome.
- Efficiency Testing: Perform serial dilutions (at least 5 points) of control DNA to create a standard curve. Calculate PCR efficiency using the formula: Efficiency (%) = (10^(-1/slope) - 1) × 100 [72]. Acceptable efficiency ranges from 90-110% with R² >0.98.
qPCR Execution
- Reaction Setup: Prepare reactions in triplicate containing 20 ng DNA, 1× master mix, and primers/probe according to manufacturer's recommendations.
- qPCR Conditions: Program thermal cycler as follows: 95°C for 10 min (initial denaturation), followed by 40 cycles of 95°C for 15 sec and 60°C for 1 min.
- Quality Control: Include no-template controls for each assay to detect contamination. Use interplate calibrators to account for run-to-run variation.
Data Analysis
- Cq Determination: Set threshold in the exponential phase of amplification where PCR efficiency is highest and most consistent [73].
- Copy Number Calculation: Use the comparative ΔΔCq method with efficiency correction [72]. Calculate the relative copy number for each target gene relative to the reference genes and normal control sample.
- Statistical Analysis: Determine the confidence interval for copy number alterations. Copy number changes are significant when values fall outside the 0.8-1.25 range (with 90% confidence interval, α = 0.1) [71].
Implementation of MIQE 2.0 in Experimental Design
Sample Handling and Quality Control
Proper sample handling is foundational to generating reliable qPCR data. The MIQE guidelines emphasize comprehensive documentation of sample origin, handling, and storage conditions [69]. For oral cancer research, this includes:
- Sample metadata: Anatomical site, histopathological diagnosis, tumor stage, patient demographics
- Processing details: Time between collection and preservation, preservation method, storage duration and conditions
- Quality assessment: DNA quantity, purity (A260/A280, A260/A230 ratios), and integrity (gel electrophoresis or genomic DNA integrity number)
Nucleic acid quality has measurable impact on gene expression results, making rigorous quality assessment essential [70]. The MIQE 2.0 guidelines provide specific recommendations for documenting RNA quality in gene expression studies, which similarly apply to DNA quality in CNA analysis.
Assay Design and Validation
The MIQE guidelines provide detailed recommendations for assay design and validation to ensure specificity, sensitivity, and reproducibility [69]. For CNA analysis in oral cancer:
- Specificity: Verify amplification of a single product through melt curve analysis (for SYBR Green) or sequence verification. Check against genomic databases to ensure uniqueness.
- Efficiency: Determine through serial dilution of template DNA as described in the protocol section. Efficiency between 90-110% is acceptable [72].
- Sensitivity: Establish the limit of detection and limit of quantification for each assay.
- Dynamic range: Verify linear quantification over at least 4 orders of magnitude.
For TaqMan assays, Thermo Fisher Scientific provides the assay ID along with an amplicon context sequence which is compliant with MIQE guidelines 2.0 [68]. To fully comply with MIQE guidelines on assay sequence disclosure, the probe or amplicon context sequence in addition to the Assay ID needs to be provided [68].
Data Analysis and Normalization Strategies
Proper data analysis is critical for accurate interpretation of CNA results. The MIQE 2.0 guidelines emphasize that Cq values should be converted into efficiency-corrected target quantities and reported with prediction intervals [69]. Key considerations include:
- Normalization: Use multiple reference genes for robust normalization. Statistical algorithms such as geNorm or NormFinder can help identify the most stable reference genes.
- Efficiency correction: Incorporate PCR efficiency into all calculations using established models such as the Pfaffl method, especially when target and reference gene efficiencies differ [72].
- Statistical analysis: Report measures of variability (standard deviation, confidence intervals) and results of statistical tests. For CNA analysis, the acceptable range for copy number alterations should be predefined (e.g., 0.8-1.25 for diploid status) [71].
Table 2: Essential Research Reagent Solutions for qPCR CNA Analysis
| Reagent/Category | Specific Examples | Function/Application |
|---|---|---|
| DNA Extraction Kits | DNeasy Blood & Tissue Kit (Qiagen) | High-quality genomic DNA isolation from oral tissue specimens |
| qPCR Master Mixes | TaqMan Genotyping Master Mix, SYBR Green Master Mix | Provides enzymes, buffers, dNTPs for efficient amplification |
| Assay Formats | Pre-designed TaqMan assays, Custom designed primers/probes | Target-specific detection of genomic regions of interest |
| Reference Assays | TaqMan Copy Number Reference Assays | Diploid reference genes for normalization in CNA studies |
| Quality Control Tools | Digital PCR, Electrophoresis kits | Verification of assay performance and sample quality |
| Control Materials | Human Genomic DNA (normal diploid), DNA Molecular Weight Markers | Standard curves, positive controls, and size determination |
Visualization of qPCR Workflow for CNA Analysis
The following diagram illustrates the complete workflow for copy number alteration analysis in oral cancer research, from sample collection to data interpretation, highlighting critical quality control checkpoints:
CNA Analysis Workflow with Quality Control
Adherence to MIQE 2.0 guidelines is essential for generating publication-quality qPCR data in copy number alteration analysis for oral cancer research. The guidelines provide a comprehensive framework for ensuring experimental rigor, analytical transparency, and reproducible results. As qPCR continues to be a cornerstone technology in molecular biology and clinical research, implementation of these standards is not merely optional but fundamental to scientific integrity.
The cultural change needed for widespread MIQE compliance requires collective commitment from researchers, reviewers, journal editors, and regulatory agencies [70]. By treating qPCR with the same expectations for transparency, validation, and reproducibility demanded of other molecular techniques, the scientific community can ensure that qPCR results are not just published, but are robust, reproducible, and reliable. The credibility of molecular diagnostics and the integrity of the research that supports it depends on this commitment to quality [70].
Benchmarking qPCR Performance: Comparison with NanoString, Digital PCR, and NGS
Copy number alterations (CNAs) are crucial structural variants in cancer genomics, playing an instrumental role in activating oncogenes and inactivating tumor suppressor genes in oral squamous cell carcinoma (OSCC) [19] [74]. The accurate detection of these alterations is paramount for prognostic assessment and personalized treatment strategies. While real-time quantitative PCR (qPCR) has long been considered the gold standard for validating CNAs identified through global genomic profiling methods, the nCounter NanoString platform has emerged as a promising alternative offering multiplexing capabilities and digital readouts [19] [1]. This application note provides a detailed comparative analysis of these two technologies within the context of OSCC research, presenting structured quantitative data, experimental protocols, and analytical workflows to guide researchers in their selection and implementation of CNA detection methods.
Comparative Performance in Oral Cancer Research
Technical Concordance Assessment
A comprehensive cross-platform assessment was performed on 119 OSCC patient samples to evaluate 24 genes with known prognostic significance in oral cancer [19] [1]. The correlation between qPCR and nCounter NanoString was systematically evaluated using statistical measures including Spearman's rank correlation and Cohen's Kappa score for agreement on copy number gains and losses.
Table 1: Interplatform Correlation for 24 Genes in OSCC
| Gene | Spearman Correlation (r) | Cohen's Kappa Agreement |
|---|---|---|
| TNFRSF4 | 0.513 | No agreement |
| YAP1 | 0.517 | Moderate to substantial |
| CDK11A | 0.188 | No agreement |
| ISG15 | Weak correlation | No agreement |
| ATM | Weak correlation | Fair agreement |
| CASP4 | No correlation | Fair agreement |
| BIRC2/BIRC3 | Weak correlation | Moderate to substantial |
| CCND1 | Weak correlation | Moderate to substantial |
| 16 genes total | Weak correlation | Varying agreement |
The Spearman's rank correlation between platforms ranged from r = 0.188 to 0.517 across the 24 genes analyzed [19]. Only two genes, TNFRSF4 (r = 0.513) and YAP1 (r = 0.517), demonstrated moderate correlation, while the majority showed weak correlation, and six genes including CASP4, CDK11B, and MVP showed no significant correlation [19] [1].
Cohen's Kappa score, which measures agreement on calling copy number gains or losses, showed moderate to substantial agreement for eight genes including BIRC2, BIRC3, CCND1, and FAT1 [19]. However, nine genes including CDK11A, ISG15, and SOX8 showed no agreement between platforms, highlighting significant technical disparities for specific genetic targets [19].
Prognostic Biomarker Discrepancies
The clinical implications of technological differences were starkly evident in survival analyses, where contrasting prognostic associations emerged between platforms for specific genes [19].
Table 2: Contrasting Survival Associations Between Platforms
| Gene | qPCR Association with Survival | nCounter NanoString Association with Survival |
|---|---|---|
| ISG15 | Better prognosis for RFS, DSS, and OS | Poor prognosis for RFS, DSS, and OS |
| CASP4 | Poor RFS | Not significant |
| CYB5A | Poor RFS | Not significant |
| ATM | Poor RFS | Not significant |
| CDK11A | Not significant | Poor RFS |
Most notably, the ISG15 gene was associated with better prognosis for recurrence-free survival (RFS), disease-specific survival (DSS), and overall survival (OS) when measured by qPCR, but with poor prognosis for all three endpoints when measured by nCounter NanoString [19]. Similarly, genes including CASP4, CYB5A, and ATM showed significant associations with poor RFS in qPCR data but not in nCounter data, while CDK11A was uniquely associated with poor RFS only in nCounter data [19].
Experimental Protocols for CNA Analysis
qPCR Workflow for Copy Number Validation
The qPCR protocol follows MIQE guidelines with specific modifications optimized for CNA detection in oral cancer samples [19] [12].
DNA Extraction and Qualification
- Extract genomic DNA from FFPE or fresh-frozen OSCC tissue using commercial kits (e.g., DNeasy Blood & Tissue Kit, Qiagen)
- Assess DNA purity spectrophotometrically (A260/280 ratio of 1.8-2.0)
- Quantify DNA using fluorometric methods for accurate concentration determination
Reaction Setup
- Use TaqMan copy number assays with hydrolysis probes
- Perform reactions in quadruplicate to ensure statistical reliability
- Utilize 5-20 ng DNA input per reaction, with 10 ng optimal for most applications
- Include two reference genes (e.g., RNase P, TERT) for normalization
- Run female pooled DNA as reference for each plate
Thermal Cycling Conditions
- Initial denaturation: 95°C for 10 minutes
- 40 cycles of:
- Denaturation: 95°C for 15 seconds
- Annealing/Extension: 60°C for 60 seconds
Data Analysis
- Calculate ΔΔCt values relative to reference genes and control DNA
- Apply statistical algorithms for copy number calling
- Threshold set at 2^(-ΔΔCt) > 2.3 for amplification and <1.7 for deletion [12]
nCounter NanoString Workflow
The nCounter NanoString protocol utilizes unique color-coded reporter probes without enzymatic amplification [19] [1].
Sample Preparation
- Use 300 ng genomic DNA per sample
- Design 3 probes for genes associated with amplification and 5 probes for deletion genes
- Include reference probes for normalization
Hybridization Protocol
- Combine 5 μL sample (20 ng/μL) with 3 μL reporter codeset, 5 μL hybridization buffer, and 2 μL capture probeset
- Incubate at 65°C for 16-20 hours
- Perform post-hybridization processing using nCounter Prep Station
Data Collection and Analysis
- Immobilize probe complexes on cartridge for digital counting
- Use nCounter Digital Analyzer with CCD camera imaging
- Analyze data with nSolver software (version 4.0+)
- Apply positive control and codeset normalization
- Use geometric mean of reference genes for sample normalization
Visualization of Methodological Comparison
Figure 1: Comparative Workflow: qPCR vs. nCounter NanoString. This diagram illustrates the parallel procedural pathways for copy number alteration analysis in oral cancer research using qPCR (red) and nCounter NanoString (blue) platforms, highlighting key methodological differences including replication strategies (quadruplicate vs. single reaction) and detection principles (fluorescence vs. digital counting).
The Scientist's Toolkit: Essential Research Reagents
Table 3: Key Research Reagent Solutions for CNA Analysis
| Reagent/Kit | Application | Function | Considerations |
|---|---|---|---|
| DNeasy Blood & Tissue Kit (Qiagen) | Nucleic Acid Extraction | DNA purification from FFPE/frozen tissue | Optimal for degraded samples from archive tissues |
| TaqMan Copy Number Assays | qPCR Analysis | Target-specific amplification with fluorescence detection | Pre-validated assays available for cancer genes |
| nCounter CNV Cancer Panel | NanoString Analysis | Multiplexed copy number variant detection | Customizable design with 3-5 probes per target |
| Maxwell RSC RNA FFPE Kit | Nucleic Acid Extraction | RNA purification for expression correlation | Compatible with challenging sample types |
| High-Capacity RNA-to-cDNA Kit | Reverse Transcription | cDNA synthesis for expression studies | Essential for qPCR gene expression correlation |
Analytical Framework for Resolution of Discrepant Findings
The significant discrepancies observed between qPCR and nCounter platforms, particularly for critical biomarkers like ISG15, necessitate a systematic approach to resolving conflicting results.
Figure 2: Discrepancy Resolution Pathway. This workflow outlines a systematic approach for resolving conflicting CNA results between qPCR and nCounter platforms, incorporating technical verification, orthogonal validation, biological context assessment, and clinical correlation.
Orthogonal Validation with ddPCR For genes showing discrepant results between platforms, droplet digital PCR (ddPCR) provides an additional validation method [2]. This approach is particularly valuable for:
- Absolute quantification without reliance on reference standards
- Detection of submicroscopic alterations below the resolution of other methods
- Assessment of tumor heterogeneity through precise allele frequency measurement
The protocol involves:
- Designing target-specific primers and probes
- Partitioning samples into nanoliter droplets
- Endpoint PCR amplification
- Digital counting of positive/negative droplets
- Poisson correction for absolute copy number determination
This comprehensive comparison demonstrates that while both qPCR and nCounter NanoString platforms offer viable approaches for CNA detection in oral cancer research, they show significant discrepancies in both technical correlation and clinical associations for key biomarkers. Researchers should consider platform-specific strengths—qPCR's established robustness versus nCounter's multiplexing efficiency—when designing validation studies. The provided protocols, analytical frameworks, and reagent solutions offer practical guidance for implementing these technologies while emphasizing the critical importance of orthogonal validation for clinically significant biomarkers. Future efforts should focus on standardized reference materials and harmonized analysis protocols to improve interplatform reproducibility in oral cancer genomics.
Copy number alterations (CNAs), comprising somatic gains or losses of genomic material, are fundamental drivers of tumorigenesis in oral squamous cell carcinoma (OSCC) and other cancers [2]. The detection of specific, recurrent CNAs provides critical diagnostic and prognostic information, enabling risk stratification and guiding targeted therapeutic strategies [50]. This application note provides a detailed, experimentalist-focused comparison of the detection limits for focal amplifications and deletions across three core technologies: quantitative PCR (qPCR), droplet digital PCR (ddPCR), and the nCounter NanoString system. Framed within a broader thesis on CNA analysis in oral cancer, we present summarized quantitative data, detailed protocols, and essential research tools to facilitate robust assay design and implementation in research and diagnostic settings.
Technology Comparison: Sensitivity and Specificity
The choice of platform for CNA analysis hinges on key performance parameters including sensitivity, specificity, limit of detection (LoD), and limit of quantification (LoQ). Table 1 provides a comparative overview of these characteristics for the primary technologies discussed.
Table 1: Comparative Analysis of CNA Detection Technologies
| Technology | Principle | Reported Sensitivity (LoD) | Key Advantages | Key Limitations |
|---|---|---|---|---|
| Quantitative PCR (qPCR) | Fluorescence-based real-time quantification of target DNA during amplification. | Defines LoD based on sample replicates and statistical probability [75]. | Considered gold standard for validation; robust, widely available [19]. | Requires standard curve for relative quantification; precision impacted by system variation [76]. |
| Droplet Digital PCR (ddPCR) | Partitioning of sample into thousands of nanoliter reactions for absolute counting of target molecules via Poisson statistics [77]. | Capable of detecting homozygous deletions as small as 6.9 kbp; identifies single-molecule events [2]. | Calibration-free absolute quantification; high sensitivity and precision; detects submicroscopic CNAs [77] [2]. | Requires specialized instrumentation and optimized partitioning. |
| nCounter NanoString | Direct, multiplexed measurement using color-coded reporter probes without enzymatic reaction [19]. | Sensitivity higher than microarrays and comparable to qPCR [19]. | High multiplexing capability; minimal sample input; direct digital readout [19]. | May show lower copy number detection and moderate correlation with qPCR [19]. |
A 2017 study developing a multiplexed ddPCR assay for OSCC demonstrated its exceptional capability to detect submicroscopic homozygous deletions (HDs), a critical type of focal alteration. The assay successfully identified and sized HDs in genes like CDKN2A and FHIT, with results orthogonally confirmed by SNP arrays [2]. Table 2 summarizes the specific HDs detected.
Table 2: Detection of Homozygous Deletions (HDs) in OSCC Cell Lines via Multiplexed ddPCR [2]
| Target Locus | Genomic Location | Cell Line(s) with HD | Size of Deletion |
|---|---|---|---|
| FHIT (FRA3B) | 3p14.2 | CAL27, SCC-9 | Between 12.8 kbp and 551.1 kbp |
| CDKN2A | 9p21.3 | POE9n tert, SCC-25, SCC-9 | Between 6.9 kbp and 285.3 kbp |
| FAT1 | 4q | SCC-4, SCC-9, SCC-25 | Not specified in study |
A direct, comprehensive comparison between real-time PCR and nCounter NanoString for validating CNAs in 119 oral cancer samples revealed important distinctions. Spearman's rank correlation between the two methods ranged from weak to moderate (r = 0.188 to 0.517), and Cohen's kappa score showed moderate to substantial agreement for only 8 of 24 genes [19]. Notably, the prognostic implications of specific genes, such as ISG15, were contradictory between the platforms, underscoring that the choice of validation technique can significantly impact biological and clinical interpretation [19].
Detailed Experimental Protocols
Protocol: Multiplexed ddPCR for CNA Detection in OSCC
This protocol is adapted from a study that detected clinically relevant CNAs in oral cancer progression [2].
1. Assay Design
- Select Target Loci: Choose genomic targets based on recurrent CNAs in OSCC (e.g.,
CCND1at 11q13.3 for gain,CDKN2Aat 9p21.3 for loss) [2]. - Select Reference Loci: Identify a panel of 10-13 reference loci located in genomically stable regions for robust normalization. The final assay should target a total of 20-25 loci [2].
- Primer/Probe Design: Design PCR primers and hydrolysis probes (e.g., FAM or VIC-labeled) for each target and reference locus.
2. DNA Sample Preparation
- Extract genomic DNA from patient tissue or cell lines using a standardized kit (e.g., QIAamp DNA FFPE Tissue Kit).
- Quantify DNA using a fluorometric method and dilute to a working concentration of 10-50 ng/µL.
3. Partitioning and PCR Amplification
- Prepare the PCR reaction mixture containing:
- 10 µL of ddPCR Supermix for Probes (no dUTP)
- 1.1 µL of multiplexed primer/probe assay (final concentrations as optimized)
- 20-50 ng of genomic DNA
- Nuclease-free water to a final volume of 20-22 µL
- Generate droplets from the reaction mixture using a droplet generator. Typically, one reaction yields ~20,000 droplets.
- Transfer the emulsified sample to a 96-well PCR plate and seal it.
- Perform PCR amplification on a thermal cycler using a standard probe amplification protocol (e.g., 95°C for 10 min, followed by 40 cycles of 94°C for 30 sec and 60°C for 60 sec, with a final 98°C step for 10 min).
4. Droplet Reading and Data Analysis
- Load the PCR plate into a droplet reader.
- The reader will count the number of positive (fluorescent) and negative droplets for each target.
- Use the following formula to calculate the normalized copy number ratio ((R{i/b})) for a target locus
i: (R{i/b} = \frac{(Copies per partition of target_i)}{(Average copies per partition of stable reference loci)}) - Analyze data using manufacturer's software (e.g., QuantaSoft) and a sample-specific clustering algorithm to determine stable reference loci and call CNAs [2]. A ratio significantly different from 1.0 indicates a copy number alteration.
Protocol: Determining LoD and LoQ in qPCR
This protocol is based on standard statistical methods for qPCR data analysis [75].
1. Experimental Setup for LoD/LoQ
- Prepare a 2-fold dilution series of the target DNA, covering a range from a high concentration down to a theoretical concentration near the expected detection limit.
- Analyze each sample concentration in a high number of replicates (e.g., n=64 or 128) to ensure robust statistical analysis [75].
2. Data Collection
- Run the dilution series on the qPCR instrument.
- Record the quantification cycle (Cq) value for each replicate.
3. Data Analysis for LoD
- Define a cut-off Cq value (Co) based on the amplification profile of negative controls.
- For each concentration, calculate the proportion of positive replicates (Cq < Co).
- Fit a logistic regression model to the binomial data (positive/total replicates vs. log2 concentration).
- The LoD is the lowest concentration at which a specified detection probability (e.g., 95%) is achieved, as derived from the fitted model [75].
4. Data Analysis for LoQ
- The LoQ is the lowest concentration that can be quantified with acceptable precision and accuracy.
- Calculate the coefficient of variation (CV) for the measured concentrations at each dilution level.
- The LoQ is the concentration at which the CV exceeds a pre-defined acceptable threshold (e.g., 25-35%) [75].
Signaling Pathways in Oral Cancer CNAs
CNAs in oral cancer do not occur in isolation but directly impact key signaling pathways that drive tumor development and progression. Integrated multi-omics analyses have delineated a core set of pathways frequently dysregulated in OSCC, often through coordinated CNAs and mutations [78] [50].
Genomic analyses of OSCC, particularly in cases with lymph node metastasis, have identified significant mutations in genes within the MAPK, TGF-β, and WNT signaling pathways, which are essential for tumor development [78]. Proteogenomic integration has further highlighted how these pathways facilitate lymph node dissemination. A key finding is the role of POSTN (Periostin) in reorganizing the extracellular matrix (ECM) and interacting with TGF-β, which subsequently disrupts cell cycle regulation and suppresses the immune response by reducing VCAM1 activity [78]. Single-cell and spatial transcriptome analyses reveal that cancer-associated fibroblasts (CAFs) secrete TGF-β1/2, activating the TGF-β pathway in cancer cells and promoting metastasis through the induction of the epithelial-mesenchymal transition (EMT) program [78]. This intricate crosstalk between CAFs, the ECM, and cancer cells creates an immunosuppressive tumor microenvironment, a hallmark of aggressive disease. Consequently, CNAs affecting key nodes in these pathways (e.g., amplifications of receptor tyrosine kinases or deletions of tumor suppressors) have profound functional consequences.
The Scientist's Toolkit: Research Reagent Solutions
Successful CNA analysis requires a suite of reliable research reagents and tools. The following table details essential materials for the experiments described in this note.
Table 3: Essential Research Reagents and Materials
| Item | Function/Application | Example/Note |
|---|---|---|
| ddPCR System | Partitioning, thermocycling, and droplet fluorescence reading for absolute quantification. | Bio-Rad QX200 Droplet Digital PCR system or equivalent. |
| nCounter System | Multiplexed, enzymatic-reaction-free digital detection of up to 800 targets. | NanoString nCounter Analysis System [19]. |
| qPCR Instrument | Real-time fluorescence monitoring for relative quantification of nucleic acids. | Applied Biosystems QuantStudio series or equivalent [76]. |
| Fluorometric DNA Quant Kits | Accurate quantification of low-concentration DNA, superior to spectrophotometry. | Qubit dsDNA HS Assay Kit or equivalent. |
| Multiplex PCR Master Mix | Robust enzyme mix and buffers for efficient amplification in partitioned reactions. | ddPCR Supermix for Probes (no dUTP) [2]. |
| Validated Reference Assays | qPCR/dPCR assays for stable reference genes for reliable normalization. | Assays targeting stable genomic loci (e.g., TERT, ALB). Commercial options include ValidPrime [75]. |
| OSCC CNA Assay Panels | Pre-designed multiplex assays targeting known OSCC-associated CNAs. | Custom panels targeting regions like 3q, 5p, 8q, 11q (e.g., CCND1), 9p (e.g., CDKN2A) [2]. |
| Bioinformatics Tools | Data analysis software for CNA calling, statistical analysis, and visualization. | GenEx software for qPCR data analysis [75]; R packages (maftools, ggplot2) for NGS/CNA data [79]. |
The accurate detection of copy number alterations (CNAs) is a critical component of cancer genomics, providing essential diagnostic, prognostic, and predictive biomarkers. In oral squamous cell carcinoma (OSCC), recurrent CNAs—such as gains at the CCND1 locus or losses at CDKN2A—are established drivers of tumorigenesis and progression [2]. Quantitative PCR (qPCR) has long been the gold standard for validating CNAs discovered through genome-wide profiling methods [1]. However, the conventional uniplex approach, which processes a single target per reaction, is limited by sample consumption, time, and reagent costs. Multiplex qPCR and its digital PCR (dPCR) counterparts overcome these limitations by enabling the simultaneous quantification of multiple targets in a single reaction. This application note provides a practical assessment of multiplexing technologies within the context of CNA analysis in oral cancer, offering structured data comparisons, detailed experimental protocols, and essential workflows to guide researchers and drug development professionals in implementing these efficient genomic tools.
Technology Comparison for CNA Detection
Multiple platforms are available for the detection of CNAs, each with distinct advantages and limitations. The table below provides a comparative summary of key technologies, highlighting their applicability in a research and potential clinical diagnostics setting for oral cancer.
Table 1: Technology Comparison for Copy Number Alteration Analysis
| Technology | Principle | Multiplexing Capability | Key Advantages | Key Limitations |
|---|---|---|---|---|
| Real-time PCR (qPCR) | Fluorescence-based monitoring of amplification in real-time [1]. | Moderate (Fewer genes per reaction) [80]. | Established gold standard; robust validation method; cost-effective [1]. | Lower multiplexing capacity can increase sample and time requirements. |
| Digital PCR (dPCR) | Absolute quantification by partitioning a sample into thousands of individual reactions [2]. | High (e.g., 5-plex and 24-plex demonstrated) [81] [2]. | High sensitivity and precision; absolute quantification without standard curves; detects submicroscopic alterations [2] [81]. | Higher initial instrument cost; limited throughput compared to NGS. |
| nCounter NanoString | Direct hybridization of color-coded reporter probes without enzymatic reaction [1]. | Very High (Up to 800 targets) [1]. | High sensitivity and multiplexing; no amplification step minimizes bias; digital readout [1]. | Weak to moderate correlation with qPCR in some CNA studies [1]. |
| Next-Generation Sequencing (NGS) | Massively parallel sequencing of fragmented DNA [2]. | Genome-wide. | Comprehensive, hypothesis-free genome-wide analysis [2]. | Higher cost and complexity; requires sophisticated bioinformatics [2]. |
A 2025 study directly comparing real-time PCR and nCounter NanoString for CNA analysis in 119 oral cancer samples found a "weak to slightly moderate correlation" between the two methods, with Spearman’s rank correlation ranging from r = 0.188 to 0.517 [1]. This underscores the importance of platform selection, as the choice of technology can influence the observed CNAs and their subsequent association with clinical outcomes such as survival [1].
Experimental Protocol: A Multiplexed ddPCR Assay for OSCC CNAs
The following protocol is adapted from a published study that developed a novel multiplexed droplet digital PCR (ddPCR) assay for detecting recurrent CNAs in oral cancer progression [2]. This assay targets key genomic loci, including CCND1 (11q13.3), CDKN2A (9p21.3), and the subtelomeric region of 3q, and can concurrently assess the viral load of high-risk HPV types 16 and 18 [2].
The diagram below illustrates the complete experimental workflow, from sample preparation to data analysis.
Detailed Materials and Methods
- Sample Preparation: Extract genomic DNA from OSCC cell lines (e.g., CAL 27, SCC-25) or clinical tissue samples using a qualified isolation kit. Assess DNA purity and integrity using a spectrophotometer (e.g., A260/A280 ratio ~1.8) and/or automated gel electrophoresis (e.g., Agilent Bioanalyzer) [2] [43]. For complex genomic DNA, perform restriction digestion (e.g., with HindIII) to improve droplet generation efficiency and ensure a uniform fragment profile [81].
- Multiplex ddPCR Assay Setup:
- Reaction Mix: Prepare a 20-22 µL reaction volume containing:
- 1X ddPCR Supermix for Probes (no dUTP).
- Custom-designed hydrolysis (TaqMan) primer and probe sets for target loci (e.g., CCND1, CDKN2A, FAT1, FHIT) and stable reference genes (e.g., at least 7-13 loci to establish a CNA-neutral benchmark) [2] [81].
- Primers targeting the E6 region of HPV16 and HPV18 can be included for concurrent viral load assessment [2].
- Approximately 50-100 ng of digested genomic DNA template.
- Droplet Generation: Transfer the reaction mix to a DG8 cartridge for droplet generation using a QX200 Droplet Generator. Following generation, carefully transfer the emulsified samples to a 96-well PCR plate [2].
- Reaction Mix: Prepare a 20-22 µL reaction volume containing:
- PCR Amplification: Seal the plate and perform endpoint PCR on a thermal cycler using the following profile:
- Data Acquisition and Analysis:
- Read the plate using a QX200 Droplet Reader to measure the fluorescence amplitude in each droplet.
- Analyze the data using vendor-supplied software (e.g., QuantaSoft). Set the threshold to distinguish positive and negative droplets for each fluorescent channel.
- Calculate the normalized ratio of target loci (i) to the benchmark (b) of stable reference genes (R_{i/b}^{Norm}) to determine copy number states. A ratio of ~1 indicates diploid copy number, >1 indicates gain/amplification, and <1 indicates loss/deletion [2]. The method can infer ploidy level and quantify high-level gains or homozygous deletions, even at the submicroscopic level [2].
The Scientist's Toolkit: Essential Reagents and Materials
Successful implementation of a multiplex CNA assay relies on a suite of specialized reagents and tools. The following table details the key components.
Table 2: Research Reagent Solutions for Multiplex CNA Analysis
| Item | Function/Description | Implementation Example |
|---|---|---|
| Multiplex ddPCR Master Mix | Provides optimized buffers, nucleotides, and polymerase for efficient amplification in a partitioned format. | ddPCR Supermix for Probes; TaqPath DuraPlex Master Mix [80] [82]. |
| Hydrolysis (TaqMan) Probes & Primers | Target-specific assays for CNA loci and reference genes. Probes are labeled with different fluorophores (e.g., FAM, HEX/VIC) for multiplexing. | Custom-designed assays for CCND1, CDKN2A, and stable reference genes [2]. |
| Specialized Probes for High-Plexing | Probes with novel quenchers (e.g., QSY, QSY2) to reduce background and enable greater multiplexing capacity in a single channel. | Applied Biosystems TaqMan Custom QSY-based probes [82]. |
| Droplet Generation & Reading System | Instrumentation for partitioning samples into nanoliter droplets and subsequently reading the fluorescence of each droplet. | QX200 Droplet Generator and Droplet Reader [2]. |
| DNA Integrity Assessment Tool | Critical for verifying the quality and quantity of input DNA, which is a key variable in assay performance. | Automated Gel Electrophoresis System (e.g., Agilent Bioanalyzer) or Fluorometer (e.g., Qubit Flex) [43] [81]. |
| Restriction Enzymes | Used to digest long genomic DNA into smaller fragments, promoting more efficient and uniform droplet generation in dPCR. | HindIII restriction endonuclease [81]. |
Multiplexed PCR technologies, particularly ddPCR, offer a robust and practical solution for CNA analysis in oral cancer research. They bridge the gap between high-throughput, discovery-based genomics and targeted, clinical validation by providing high sensitivity, precision, and workflow efficiency. The ability to simultaneously query multiple oncogenic drivers and tumor suppressor losses in a single reaction, while also detecting clinically relevant events like submicroscopic homozygous deletions and viral integration, makes these assays powerfully concise. As the field moves towards more precise molecular diagnostics and liquid biopsy applications, the adoption of optimized multiplexed protocols, as detailed in this application note, will be instrumental in advancing both our biological understanding of oral cancer and the development of targeted therapeutic strategies.
The Emerging Role of Droplet Digital PCR (ddPCR) for Absolute CNA Quantification
Copy number alterations (CNAs), defined as somatic gains or losses of genomic DNA, are fundamental drivers in the development and progression of numerous cancers, including oral squamous cell carcinoma (OSCC) [2]. The ability to accurately detect and quantify these alterations is crucial for cancer research, prognostication, and the development of targeted therapies. While techniques like comparative genomic hybridization (CGH) arrays and single nucleotide polymorphism (SNP) arrays provide genome-wide CNA profiles, they often lack the sensitivity to detect focal or submicroscopic alterations and are not ideally suited for routine clinical use due to cost and complexity [2].
Droplet Digital PCR (ddPCR) has emerged as a powerful tool for the absolute quantification of nucleic acids, offering a highly sensitive and precise method for detecting specific CNAs without the need for a standard curve [83] [84]. This application note details the use of a multiplexed ddPCR assay for the detection of clinically relevant CNAs in oral cancer, providing a robust protocol that can be integrated into a research pipeline alongside qPCR-based CNA analysis.
Technical Comparison of CNA Detection Platforms
The selection of a methodology for CNA detection depends on the research question, required sensitivity, and available resources. The table below compares the key characteristics of mainstream platforms.
Table 1: Comparison of CNA and Genetic Alteration Detection Platforms
| Platform | Principle | Key Advantages | Key Limitations | Best Suited For |
|---|---|---|---|---|
| ddPCR | Partitioning into nanodroplets for absolute quantification via Poisson statistics [83] | High sensitivity and precision; absolute quantification without standard curves; detects submicroscopic alterations and rare targets [2] [85] | Limited multiplexing in a single well; targeted approach (not genome-wide) | Validating specific CNAs; detecting focal deletions/gains; liquid biopsy applications [2] [86] |
| qPCR | Relative quantification based on fluorescence amplification curves | Cost-effective; high-throughput; familiar technology in most labs | Requires standard curve for quantification; lower precision and sensitivity vs. dPCR [87] | Initial, high-throughput screening of known CNAs |
| CGH/SNP Array | Hybridization to genome-wide probes | Genome-wide view of CNAs; high resolution for large alterations [2] | Cannot detect very small (<50 kbp) alterations; lower sensitivity for mosaic events [2] | Discovery phase to identify novel CNA regions across the genome |
| Next-Generation Sequencing (NGS) | High-throughput sequencing of DNA fragments | Most comprehensive view (CNAs, SNVs, fusions); genome-wide | Higher cost and complex data analysis; may require deeper sequencing for low-frequency CNAs | Comprehensive genomic profiling; discovery of novel alterations in combination with SNVs |
A 2024 meta-analysis on detecting circulating tumor HPV DNA (ctHPVDNA) underscores the performance differences, reporting a pooled sensitivity of 0.81 for ddPCR compared to 0.51 for qPCR, highlighting ddPCR's superior capability for detecting low-abundance targets [87].
ddPCR Workflow for CNA Quantification
The following diagram and protocol outline the core workflow for a multiplexed ddPCR assay designed to quantify CNAs in oral cancer samples.
Diagram: The core ddPCR workflow for CNA quantification, from sample preparation to data analysis.
Detailed Experimental Protocol
Sample Preparation and DNA Extraction
- Source: Use genomic DNA extracted from oral cell lines (normal, dysplastic, OSCC) or clinical samples (tissue, plasma cfDNA) [2] [88].
- Quality Control: Quantify DNA using a fluorometer and assess integrity. For cfDNA from liquid biopsies, use a high-sensitivity kit and size analysis (e.g., TapeStation) to confirm fragment size of ~160-180 bp [86] [88].
Multiplexed ddPCR Assay Design
- Target Selection: Design primers and probes (TaqMan) for recurrent CNA loci in OSCC (e.g., 9p21.3 CDKN2A, 11q13.3 CCND1, 3q subtelomeric region) [2].
- Reference Assays: Include at least two reference assays targeting known stable genomic regions (e.g., on chromosomes 1, 2, or 5) to control for total DNA input and ploidy [2].
- HPV Co-detection: Optionally include primers/probes for high-risk HPV types (e.g., HPV16 E6/E7) to concurrently assess viral status and load [2] [85].
Reaction Setup and Droplet Generation
- Prepare a 20 µL reaction mixture containing:
- 10 µL of 2x ddPCR Supermix for Probes (No dUTP)
- 1 µL of each primer/probe assay (20x working concentration)
- 40 ng of genomic DNA (or equivalent volume of cfDNA)
- Nuclease-free water to volume [86]
- Generate droplets using the QX200 Droplet Generator (Bio-Rad). A successful generation typically produces ~20,000 droplets per sample [86].
PCR Amplification
- Transfer the droplet emulsion to a 96-well plate and seal.
- Perform PCR on a thermal cycler using the following conditions:
Droplet Reading and Data Analysis
- Read the plate using the QX200 Droplet Reader.
- Analyze the raw data with vendor software (e.g., QuantaSoft). The software will automatically apply Poisson correction to calculate the absolute copy number concentration (copies/µL) for each target and reference in the reaction [83].
- Calculate the normalized copy number ratio (R~i/b~) for each target locus (i) relative to the average copy number of the stable reference loci (b). A ratio of ~1 indicates diploid copy number, >1 indicates gain, and <1 indicates loss [2].
The Scientist's Toolkit: Essential Reagents and Materials
Table 2: Key Research Reagent Solutions for ddPCR CNA Analysis
| Item | Function/Description | Example Product/Catalog Number |
|---|---|---|
| ddPCR System | Instrumentation for droplet generation, thermal cycling, and droplet reading. | QX200 Droplet Digital PCR System (Bio-Rad) [2] [86] |
| ddPCR Supermix | Optimized PCR master mix for droplet-based reactions. | ddPCR Supermix for Probes (No dUTP) (Bio-Rad, #1863024) [85] [86] |
| Primer/Probe Assays | Target-specific reagents for amplification and fluorescence detection. | Custom-designed TaqMan assays for target CNAs and reference genes [2] [89] |
| DNA Extraction Kit | For purification of high-quality genomic DNA or cfDNA. | QIAamp DNA Mini Kit (for cells/tissue), QIAamp Circulating Nucleic Acid Kit (for plasma/serum) [85] [86] |
| Restriction Enzymes | Optional. Used to digest genomic DNA and improve access to target sequences. | HaeIII, EcoRI [90] [86] |
Application Data: CNAs in Oral Cancer Progression
Validation of ddPCR Performance
The multiplexed ddPCR assay demonstrates excellent concordance with established genomic techniques. Analysis of OSCC cell lines showed high correlation between ddPCR and orthogonal methods: R = 0.92 (vs. CGH array) and R = 0.95 (vs. SNP array) [2]. Furthermore, the assay can infer sample ploidy and quantify high-level amplifications.
Detection of Submicroscopic Homozygous Deletions
A key advantage of ddPCR is its ability to detect and size very small, submicroscopic homozygous deletions (HDs) that are often missed by CGH arrays [2]. This is critical for identifying the loss of tumor suppressor genes like CDKN2A.
Table 3: Sizing of Submicroscopic Homozygous Deletions in OSCC Cell Lines via ddPCR
| Cell Line | Deleted Gene/Region | Deletion Size Determined by ddPCR |
|---|---|---|
| CAL27 | FHIT (FRA3B, 3p14.2) | Between 12.8 kbp and 551.1 kbp [2] |
| SCC-9 | FHIT (FRA3B, 3p14.2) | Between 12.8 kbp and 551.1 kbp [2] |
| SCC-25 | CDKN2A (9p21.3) | As small as 6.9 kbp [2] |
| SCC-9, POE9n tert | CDKN2A (9p21.3) | Between 6.9 kbp and 285.3 kbp [2] |
Liquid Biopsy and Mutation Detection
ddPCR's sensitivity makes it ideal for analyzing cell-free DNA (cfDNA) from liquid biopsies. In OSCC, ddPCR has been successfully used to detect TP53 mutations in plasma cfDNA, with mutations correlating with lymph node metastasis [86]. Optimized ddPCR workflows for HPV16 DNA in cfDNA have increased sensitivity by loading 1200-fold more total cfDNA without restriction enzyme digestion, enabling non-invasive disease monitoring [85].
Oral squamous cell carcinoma (OSCC) is a leading subtype of head and neck cancer with high global incidence and mortality rates [91]. Despite advancements in treatment, approximately one-third of patients experience relapse, creating an urgent need for precise molecular diagnostics and personalized treatment approaches [91]. Copy number alterations (CNAs) represent a fundamental class of genomic alterations driving OSCC tumorigenesis, affecting a large fraction of the genome through gains or losses of chromosomal material [2]. These CNAs can range from microscopic alterations involving entire chromosomes to submicroscopic alterations where up to a 500 kbp segment of genomic DNA is gained or lost [2].
In OSCC research and clinical applications, quantitative PCR (qPCR) has emerged as a powerful, accessible, and cost-effective method for targeted CNA detection. However, the establishment of a rigorous orthogonal validation framework integrating qPCR with comprehensive genomic profiling techniques is essential for verifying data accuracy, controlling for methodological biases, and ensuring research reproducibility [92]. Orthogonal validation is defined as the process where "data from an antibody-dependent experiment is corroborated by data derived from a method that does not rely on antibodies" [92] - a concept that extends directly to genomic applications where qPCR data requires verification via non-qPCR-based methodologies.
This application note provides a detailed framework for implementing orthogonal validation strategies that integrate targeted qPCR assays with global genomic profiling techniques specifically for CNA analysis in OSCC research. By establishing this rigorous validation approach, researchers and drug development professionals can enhance data reliability while advancing precision medicine applications in oral oncology.
Conceptual Framework of Orthogonal Validation
Principles and Definitions
Orthogonal validation operates on the fundamental principle of verifying results through methodologically independent approaches. In the context of analytical techniques, orthogonal methods are those that "monitor the same critical quality attribute(s) in a biotherapeutic formulation but use different measurement principles" [93]. For genomic applications, this translates to techniques that measure the same genomic features (e.g., CNAs) but employ fundamentally different detection chemistries, instrumentation, and sample processing methods.
The International Working Group on Antibody Validation's proposal for validation pillars has been widely accepted in life sciences research, with the orthogonal approach representing one key validation methodology [92]. As explained by Katherine Crosby, Senior Director of Antibody Applications & Validation at Cell Signaling Technology, "Just as you need a different, calibrated weight to check if a scale is working correctly, you need antibody-independent data to cross-reference and verify the results of an antibody-driven experiment" [92]. This same principle applies directly to genomic validation, where qPCR results require verification through non-PCR-based genomic analysis methods.
Benefits in OSCC CNA Analysis
Implementing orthogonal validation strategies for CNA analysis in OSCC research provides multiple critical advantages. First, it controls for technique-specific biases - each analytical method introduces unique artifacts and systematic errors based on its underlying detection principles [93]. By employing methodologically independent verification, researchers can identify and account for these biases. Second, orthogonal approaches enhance data reliability and reproducibility, which is particularly important for translational research applications where findings may influence clinical decision-making. Third, this validation framework strengthens conclusions by providing convergent evidence from multiple technological platforms, reducing the likelihood of false discoveries.
For OSCC specifically, where common recurrent CNAs include gains at 3q, 7p, 8q, and 11q and losses at 3p, 8p, 9p, and 18q [94], orthogonal validation ensures accurate detection of these clinically relevant alterations. This is particularly important for focal CNAs involving genes such as CCND1 at 11q13.3 or loss of CDKN2A at 9p21.3, which are observed in a significant proportion of OSCC cases [2].
qPCR Assay Design and Optimization for CNA Detection
Target Selection Based on OSCC Genomics
Effective CNA analysis in OSCC begins with strategic target selection informed by the established genomic landscape of this malignancy. Research has identified frequent CNAs affecting multiple chromosomal regions that drive OSCC progression. The following table summarizes key genomic targets for qPCR assay development in OSCC research:
Table 1: Key Genomic Targets for CNA Analysis in OSCC
| Chromosomal Region | Gene/Feature | Alteration Type | Frequency in OSCC | Clinical/Functional Significance |
|---|---|---|---|---|
| 11q13.3 | CCND1 | Gain | High | Oncogene activation; cell cycle progression |
| 9p21.3 | CDKN2A | Loss/HD | High | Tumor suppressor inactivation; cell cycle dysregulation |
| 3q | Multiple oncogenes | Gain | High | Contains multiple putative oncogenes |
| 7p11.2 | EGFR | Gain | Moderate | EGFR signaling activation; targeted therapy response |
| 4q | FAT1 | Loss/HD | Moderate | Tumor suppressor inactivation |
| 3p14.2 | FHIT | Loss/HD | Moderate | Fragile site; tumor suppressor inactivation |
| 5p | TERT | Gain | Moderate | Telomerase activation; cellular immortality |
These targets are derived from extensive genomic characterization of OSCC [91] [2] [94]. When designing qPCR assays, researchers should prioritize targets with established clinical relevance, such as those with predictive value for treatment response. For instance, recent multi-omics analyses have identified that "A3A and EGFR exhibit an inverse correlation, which serves as a basis for OSCC patient stratification" and that "RRAS may serve as a novel prognostic marker for tumor recurrence" [91].
qPCR Assay Design Parameters
Well-designed qPCR assays require careful attention to multiple parameters to ensure specificity, sensitivity, and reproducibility. The following experimental protocol outlines key considerations for qPCR assay development for CNA detection:
Primer and Probe Design Specifications:
- Primer Tm: Design primers with Tm values of approximately 60-62°C (±2°C) [95]
- Primer length: Optimal length is 18-30 bases to achieve the target Tm [95]
- GC content: Maintain 35-65% GC content (ideally ~50%) and avoid runs of >4 Gs to prevent G-quadruplex formation [95]
- Probe design: Probes should have Tm values 5-10°C higher than primers, be limited to ~30 bases for effective quenching, and avoid G bases at the 5' end which can quench common dyes like FAM [95]
- Amplicon size: Ideal size ranges from 70-200 bp for optimal amplification efficiency [95]
Genomic DNA Considerations:
- For CNA analysis, high-quality genomic DNA is essential with A260/A280 ratios of 1.8-2.0
- Include reference assays targeting genomically stable regions for normalization
- Design assays to avoid SNPs or other common genetic variations that might affect amplification
Experimental Controls:
- No template controls (NTC) for each assay to detect contamination
- Reference samples with known diploid copy number for calibration
- Inter-plate calibrators to normalize across multiple qPCR runs
The selection of appropriate reference genes is particularly critical for accurate CNA quantification. Reference targets should be located in genomically stable regions unaffected by copy number changes in OSCC. Multiple reference assays should be employed to improve normalization accuracy.
Global Genomic Profiling Techniques for Orthogonal Validation
Comparative Genomic Hybridization (CGH) Arrays
CGH arrays represent a well-established methodology for genome-wide CNA detection, providing a robust orthogonal validation platform for targeted qPCR findings. The fundamental principle involves competitive hybridization of test and reference DNA samples to genomic probes arrayed on a chip, with fluorescence ratios indicating copy number changes [2].
Protocol for CGH Array Validation of qPCR Results:
- Sample Preparation: Extract high-molecular-weight DNA from OSCC specimens and sex-matched reference DNA using standardized protocols
- DNA Labeling: Label test and reference DNA with different fluorescent dyes (typically Cy5 and Cy3) using random priming or nick translation
- Hybridization: Co-hybridize labeled test and reference DNA to array platforms containing probes spanning the genome with particular density in regions relevant to OSCC (e.g., 3q, 11q, 9p)
- Image Acquisition and Analysis: Scan arrays using a laser scanner and extract fluorescence intensity ratios for each probe
- Data Normalization: Apply normalization algorithms to correct for technical artifacts and calculate log2 ratios
- CNA Calling: Use segmentation algorithms to identify genomic regions with significant deviation from diploid baseline
CGH arrays effectively detect macroscopic CNAs but have limitations in resolving submicroscopic alterations, particularly small homozygous deletions [2]. When used for orthogonal validation, CGH should demonstrate concordance with qPCR findings for larger CNAs while recognizing its limitations for very focal alterations.
Single Nucleotide Polymorphism (SNP) Arrays
SNP arrays provide an alternative genome-wide approach that offers additional genetic information beyond CNA detection, including loss of heterozygosity (LOH) and genotype data. This technique employs probes targeting specific SNP locations throughout the genome [2].
Protocol for SNP Array Validation:
- Sample Processing: Extract DNA and assess quality following manufacturer specifications for the specific platform (e.g., Affymetrix, Illumina)
- Array Processing: Perform whole-genome amplification, fragmentation, labeling, and hybridization according to manufacturer protocols
- Data Analysis: Process raw intensity data to obtain B-allele frequency and log R ratio values for each SNP position
- CNA and LOH Calling: Implement specialized algorithms to identify regions of CNA and LOH based on deviation from expected patterns
SNP arrays generally offer superior performance compared to CGH arrays for detecting homozygous deletions and can provide additional information about copy-neutral LOH [2]. In one study comparing detection methods, "good agreement in both gains and losses at the different target loci was observed between the ddPCR assay and either CGH array or SNP array data sets" with correlation coefficients of 0.92 (ddPCR vs. CGH) and 0.95 (ddPCR vs. SNP) [2].
Next-Generation Sequencing (NGS) Approaches
NGS technologies provide the most comprehensive orthogonal validation through whole-genome sequencing (WGS) or targeted sequencing approaches. These methods offer base-pair resolution and can detect a broad range of genomic alterations beyond CNAs.
Whole-Genome Sequencing Protocol for Orthogonal Validation:
- Library Preparation: Fragment DNA and attach platform-specific adapters following established protocols
- Sequencing: Perform massively parallel sequencing on platforms such as Illumina, PacBio, or Oxford Nanopore to achieve sufficient coverage (typically 30-60x for WGS)
- Read Alignment: Map sequence reads to the reference genome using optimized aligners
- CNA Detection: Apply read-depth-based algorithms to identify regions of deviation from expected coverage
NGS approaches represent the most powerful orthogonal validation method but require significant computational resources and expertise. For focused orthogonal validation, targeted sequencing panels covering OSCC-relevant genes offer a cost-effective alternative.
Integrated Data Analysis and Interpretation
Concordance Assessment Across Platforms
The core of orthogonal validation lies in systematic comparison of results across methodological platforms. This requires quantitative assessment of concordance rather than qualitative comparison. The following workflow diagram illustrates the integrated analytical process for orthogonal validation of CNA data:
For quantitative concordance assessment, calculate correlation coefficients between log2 ratio values obtained from qPCR and orthogonal methods across overlapping genomic targets. Establish pre-defined thresholds for acceptable concordance (e.g., R > 0.85) based on the specific application requirements. Additionally, assess sensitivity and specificity metrics for CNA detection between platforms, particularly for clinically relevant alterations.
Addressing Discordant Results
Discordant findings between qPCR and orthogonal methods require systematic investigation rather than automatic assumption of methodological error. Potential sources of discordance include:
- Technical artifacts: Probe or primer design issues, sample quality problems, or platform-specific biases
- Sensitivity differences: Varying detection limits for focal alterations or mosaicism
- Data processing variations: Different normalization approaches or statistical thresholds for calling alterations
- Biological factors: Tumor heterogeneity or subclonal populations differentially detected by various methods
When discordance occurs, implement additional verification experiments such as:
- Alternative qPCR assays targeting the same region
- Digital PCR for absolute quantification
- Fluorescence in situ hybridization (FISH) on tissue sections
- Replication in independent sample sets
Practical Implementation in OSCC Research
Case Study: Validating CDKN2A Homozygous Deletions in OSCC
A practical application of orthogonal validation in OSCC research involves detection of CDKN2A homozygous deletions, which occur frequently in OSCC and have clinical significance. The following protocol outlines a systematic approach for validating these alterations:
- Initial Detection by qPCR: Implement multiplexed qPCR assays targeting multiple regions within the CDKN2A locus and appropriate reference genes
- Orthogonal Validation by SNP Array: Process the same DNA samples on SNP arrays with high probe density in the 9p21.3 region
- Resolution of Discordant Results: When discrepancies occur (as reported in one study where "HDs at 3p14.2 and 9p21.3 would classify them as being submicroscopic and as noted here were not detected by CGH arrays" [2]), employ additional validation using digital droplet PCR (ddPCR) for absolute quantification
- Functional Correlation: Assess protein expression by immunohistochemistry to confirm functional impact of genetic alterations
This approach demonstrated success in OSCC research, where "with additional target loci used at either 3p14.2 or 9p21.1, our assay was able to determine the size of the HD regions" using ddPCR, enabling detection of "submicroscopic homozygous deletions" that were missed by some array-based methods [2].
Research Reagent Solutions
The following table provides essential research reagents and materials for implementing orthogonal validation of CNA analysis in OSCC research:
Table 2: Essential Research Reagents for Orthogonal Validation of CNA Analysis
| Reagent Category | Specific Examples | Function/Application | Key Considerations |
|---|---|---|---|
| Nucleic Acid Extraction | QIAamp DNA Mini Kit, DNeasy Blood & Tissue Kit | High-quality DNA extraction from OSCC specimens | Assess DNA purity (A260/280), integrity (electrophoresis), and quantity |
| qPCR Master Mixes | TaqMan Universal Master Mix II, SYBR Green Master Mix | Amplification and detection of target sequences | Probe-based for specificity; SYBR Green with melt curve analysis |
| qPCR Assays | Custom TaqMan assays, PrimeTime qPCR Probe Assays | Target-specific amplification | Design to span exon junctions, avoid SNPs, optimize concentrations |
| Reference Assays | RNase P, TERT, ALB reference assays | Normalization of copy number | Multiple reference targets recommended |
| Array Platforms | Affymetrix Cytoscan HD, Illumina Infinium HD | Genome-wide CNA profiling | Platform selection based on resolution, content, and throughput needs |
| NGS Library Prep | Illumina Nextera Flex, TruSeq DNA PCR-Free | Library preparation for sequencing | PCR-free protocols reduce bias in CNA detection |
| Bioinformatics Tools | CNVkit, GATK, Nexus Copy Number | Data analysis and CNA calling | Platform-specific algorithms optimized for different technologies |
Orthogonal validation represents an essential framework for ensuring data quality and reproducibility in OSCC genomic research. By integrating targeted qPCR approaches with comprehensive genomic profiling techniques, researchers can establish robust, verified findings that advance our understanding of OSCC pathogenesis and treatment. The protocols and guidelines presented in this application note provide a practical roadmap for implementation of these validation strategies, emphasizing systematic concordance assessment, discordance resolution, and application to clinically relevant genomic alterations in oral cancer.
As precision medicine continues to evolve in oncology, rigorous validation approaches will become increasingly critical for translating molecular findings into clinical applications. The orthogonal validation framework outlined here serves not only to enhance research quality but also to build the evidentiary foundation necessary for future clinical adoption of molecular biomarkers in OSCC diagnosis, prognosis, and treatment selection.
Conclusion
Quantitative PCR remains a robust, accessible, and gold-standard method for validating copy number alterations in oral cancer research, particularly for targeted gene analysis. Its strong correlation with clinical outcomes underscores its reliability for prognostic biomarker studies. However, the observed discrepancies with platforms like nCounter, especially for genes with contrasting prognostic associations, highlight the necessity of rigorous assay optimization and orthogonal validation. Future directions should focus on standardizing qPCR protocols across laboratories, developing multiplex assays for complex genomic regions, and integrating qPCR data with other omics layers in multi-omics studies. As we move toward personalized medicine, the precise CNA data generated by optimized qPCR assays will be indispensable for patient stratification, drug development, and ultimately, improving clinical outcomes for oral cancer patients.
References
- 1. Comparison of real-time PCR and nCounter NanoString ... [https://pmc.ncbi.nlm.nih.gov/articles/PMC12217074/]
- 2. Detection of clinically relevant copy number alterations in ... [https://www.nature.com/articles/s41598-017-11201-4]
- 3. Bioinformatic analysis and experimental validation ... - Hereditas [https://hereditasjournal.biomedcentral.com/articles/10.1186/s41065-024-00311-5]
- 4. Recommendations for Method Development and ... [https://link.springer.com/article/10.1208/s12248-023-00880-9]
- 5. Designing standard curves for qPCR | IDT [https://www.idtdna.com/page/support-and-education/decoded-plus/easily-designed-standard-curves-for-qpcr/]
- 6. Validated reference genes for normalization of RT-qPCR in ... [https://www.nature.com/articles/s41598-025-08295-6]
- 7. Characterization of Copy Number Variations in Oral Cavity ... [https://pmc.ncbi.nlm.nih.gov/articles/PMC6975970/]
- 8. Genome wide profiling in oral squamous cell carcinoma ... [https://pmc.ncbi.nlm.nih.gov/articles/PMC5383235/]
- 9. Genome Wide Analysis of Chromosomal Alterations in Oral ... [https://journals.plos.org/plosone/article?id=10.1371/journal.pone.0054705]
- 10. Multimodal profiling of oral squamous cell carcinoma ... [https://www.sciencedirect.com/science/article/pii/S1476558625000971]
- 11. New insights into the genetic progression of cancer through ... [https://pmc.ncbi.nlm.nih.gov/articles/PMC12438000/]
- 12. Validation of quantitative PCR-based assays for detection ... [https://www.sciencedirect.com/science/article/abs/pii/S2210776217300984]
- 13. Amplification of the EGFR and CCND1 Are Coordinated ... [https://www.mdpi.com/2072-6694/11/6/760]
- 14. Recurrent copy number alterations involving EGFR ... [https://pmc.ncbi.nlm.nih.gov/articles/PMC9546103/]
- 15. Amplification of the EGFR and CCND1 Are Coordinated ... [https://pmc.ncbi.nlm.nih.gov/articles/PMC6627096/]
- 16. Clinical significance of FAT1 gene mutation and mRNA ... [https://pmc.ncbi.nlm.nih.gov/articles/PMC9019907/]
- 17. Detection of Somatic Copy Number Deletion of the ... [https://www.medrxiv.org/content/10.1101/2021.09.16.21263412v6.full-text]
- 18. FAT1 Upregulates in Oral Squamous Cell Carcinoma and ... [https://pmc.ncbi.nlm.nih.gov/articles/PMC9130556/]
- 19. Comparison of real-time PCR and nCounter NanoString ... [https://www.nature.com/articles/s41598-025-08036-9]
- 20. How To Interpret RT-qPCR Results [https://www.goldbio.com/blogs/articles/how-to-interpret-rt-qpcr-results?srsltid=AfmBOoqXLnH8gm_Pw9FD2VqxlqklTGUV5ehdpsEXyVZVH5lEryAvoVTQ]
- 21. rtpcr: a package for statistical analysis and graphical ... [https://pmc.ncbi.nlm.nih.gov/articles/PMC12530193/]
- 22. Comparison of Fresh Frozen Tissue With Formalin-Fixed ... [https://pmc.ncbi.nlm.nih.gov/articles/PMC7083147/]
- 23. FFPE vs Frozen Tissue Samples [https://www.biochain.com/blog/ffpe-vs-frozen-tissue-samples/]
- 24. DNA Extraction Guide: Mastering 7 Essential Sample Types [https://www.thermofisher.com/blog/life-in-the-lab/dna-extraction-guide-mastering-7-essential-sample-types/]
- 25. Comparison of Automated and Manual DNA Isolation ... [https://www.sciencedirect.com/science/article/pii/S2472630322015059]
- 26. Highly Effective DNA Extraction Method from Fresh, Frozen ... [https://pmc.ncbi.nlm.nih.gov/articles/PMC3648961/]
- 27. DNA sample QC for NGS [https://www.qiagen.com/us/knowledge-and-support/knowledge-hub/bench-guide/ngs/dna-sequencing/dna-sample-qc-for-ngs]
- 28. Comparison of three genomic DNA extraction methods to ... [https://plantmethods.biomedcentral.com/articles/10.1186/s13007-016-0152-4]
- 29. Prognostic modeling of oral cancer by gene profiles and ... [https://pmc.ncbi.nlm.nih.gov/articles/PMC5601734/]
- 30. Quantitative Analysis of Copy Number Variants Based on ... [https://pmc.ncbi.nlm.nih.gov/articles/PMC3949243/]
- 31. Copy Number Variation (CNV) with Real-Time PCR [https://www.thermofisher.com/us/en/home/life-science/pcr/real-time-pcr/real-time-pcr-applications/genetic-variation-analysis-using-real-time/copy-number-variation-cnv-with-real-time-pcr.html]
- 32. TaqMan® probe design tips [http://www.premierbiosoft.com/tech_notes/TaqMan.html]
- 33. Rules and Tips for PCR & qPCR Primer Design | IDT [https://www.idtdna.com/page/support-and-education/decoded-plus/how-to-design-primers-and-probes-for-pcr-and-qpcr/]
- 34. Designing a TaqMan Gene Expression Assay [https://www.thermofisher.com/us/en/home/life-science/pcr/real-time-pcr/real-time-pcr-learning-center/gene-expression-analysis-real-time-pcr-information/designing-taqman-gene-expression-assay.html]
- 35. Assay Optimization: A Statistical Design of Experiments ... [https://www.sciencedirect.com/science/article/pii/S1535553505004077]
- 36. Reference gene evaluation for normalization of gene ... [https://pmc.ncbi.nlm.nih.gov/articles/PMC11413728/]
- 37. Validation of Reference Genes for Oral Cancer Detection ... [https://journals.plos.org/plosone/article?id=10.1371/journal.pone.0158462]
- 38. Selection and validation of reference genes for RT-qPCR ... [https://www.nature.com/articles/s41598-025-02951-7]
- 39. PCR Primer Design Tips - Behind the Bench [https://www.thermofisher.com/blog/behindthebench/pcr-primer-design-tips/]
- 40. A rapid, early detection of oral squamous cell carcinoma [https://pmc.ncbi.nlm.nih.gov/articles/PMC6510212/]
- 41. PCR Applications for Copy Number Variation Assays [https://blog.addgene.org/pcr-applications-for-copy-number-variant-assays]
- 42. Copy number normalization distinguishes differential signals ... [https://bmcgenomics.biomedcentral.com/articles/10.1186/s12864-025-11442-y]
- 43. How to optimize qPCR in 9 steps? [https://westburg.eu/knowledge/pcr_qpcr/hate_optimizing_qpcr]
- 44. Thermal Cycling Optimization [https://www.aatbio.com/resources/application-notes/thermal-cycling-optimization]
- 45. PCR/qPCR Data Analysis [https://www.sigmaaldrich.com/US/en/technical-documents/technical-article/genomics/qpcr/data-analysis?srsltid=AfmBOoqpR0vS6FzY08VsT4Dxs-z6aMusGciklGy7RkpAB81gBEf1cdR8]
- 46. How To Interpret RT-qPCR Results [https://www.goldbio.com/blogs/articles/how-to-interpret-rt-qpcr-results?srsltid=AfmBOopeb0SP4-CjKXo68BGAo0C64nWlVtHD72K4AwJu-4AOwPMtBMx2]
- 47. Clinical Implications of FADD Gene Amplification and Protein ... [https://journals.plos.org/plosone/article?id=10.1371/journal.pone.0164870]
- 48. Evidence‐based selection of reference genes for RT ... [https://pmc.ncbi.nlm.nih.gov/articles/PMC9033546/]
- 49. Evaluation of normalisation strategies for qPCR data ... [https://www.nature.com/articles/s41598-025-06657-8]
- 50. Early Molecular Diagnosis and Comprehensive Treatment ... [https://www.mdpi.com/1467-3045/47/6/452]
- 51. How to Work with Challenging or Limited Genomic ... [https://blog.omni-inc.com/blog/how-to-work-with-challenging-or-limited-genomic-samples-updated-for-2025]
- 52. Preserving biological specimens for DNA analysis just got easier [https://news.northeastern.edu/2025/10/14/dna-preservation-breakthrough-sample-storage/]
- 53. MIQE 2.0 and the Urgent Need to Rethink qPCR Standards [https://pmc.ncbi.nlm.nih.gov/articles/PMC12154065/]
- 54. qPCR primer design revisited - PMC - PubMed Central - NIH [https://pmc.ncbi.nlm.nih.gov/articles/PMC5702850/]
- 55. Understanding qPCR Efficiency and Why It Exceeds 100% [https://biosistemika.com/blog/qpcr-efficiency-over-100/]
- 56. qPCR Primer Design: A Handy Step-by-Step Guide [https://bitesizebio.com/10041/designing-qpcr-primers/]
- 57. qPCR Primer & Probe Design Tool [https://eurofinsgenomics.eu/en/ecom/tools/qpcr-assay-design/]
- 58. An optimized protocol for stepwise optimization of real-time ... [https://www.nature.com/articles/s41438-021-00616-w]
- 59. PCR Troubleshooting Guide [https://www.neb.com/en-us/tools-and-resources/troubleshooting-guides/pcr-troubleshooting-guide?srsltid=AfmBOoqSQceRsU2GArSbR_q-0MkBEiCF15SeHzN9xFBHwfCRmAsjNuXJ]
- 60. Gradient Thermal Cyclers: When and How to Use Them [https://www.labx.com/resources/gradient-thermal-cyclers-when-and-how-to-use-them/5580]
- 61. How To Interpret RT-qPCR Results [https://www.goldbio.com/blogs/articles/how-to-interpret-rt-qpcr-results?srsltid=AfmBOoocCUsqzO-eIBF6UM1oObecOSkhMQA_98EARP58C1f1x8k9sczO]
- 62. PCR/qPCR Plates and Tubes Troubleshooting Guide [https://www.thermofisher.com/us/en/home/life-science/cloning/cloning-learning-center/invitrogen-school-of-molecular-biology/pcr-education/pcr-qpcr-plastics/pcr-qpcr-plastics-troubleshooting.html]
- 63. Integrated computational screening and liquid biopsy ... [https://www.nature.com/articles/s41598-023-41348-2]
- 64. qPCR Troubleshooting: How to Ensure Successful ... [https://dispendix.com/blog/qpcr-troubleshooting]
- 65. How To Interpret RT-qPCR Results [https://www.goldbio.com/blogs/articles/how-to-interpret-rt-qpcr-results?srsltid=AfmBOoozhIlnB8bOmYr2msgJvYl0T1v5qcQ4mcEHXyTxdunHV0urIIVC]
- 66. qPCR Terms Explained: Methods, Controls and Types | IDT [https://www.idtdna.com/page/support-and-education/decoded-plus/qpcr-terminology-what-does-it-mean/]
- 67. Statistical analysis of real-time PCR data - BMC Bioinformatics [https://bmcbioinformatics.biomedcentral.com/articles/10.1186/1471-2105-7-85]
- 68. MIQE Guidelines | Thermo Fisher Scientific - US [https://www.thermofisher.com/us/en/home/life-science/pcr/real-time-pcr/real-time-pcr-assays/why-choose-taqman-assays/publish-real-time-pcr-results.html]
- 69. MIQE 2.0: Revision of the Minimum Information for ... [https://pubmed.ncbi.nlm.nih.gov/40272429/]
- 70. MIQE 2.0 and the Urgent Need to Rethink qPCR Standards [https://www.mdpi.com/1422-0067/26/11/4975]
- 71. Potential Association of Cytochrome P450 Copy in... Number Alteration [https://pmc.ncbi.nlm.nih.gov/articles/PMC10487787/]
- 72. How To Interpret RT-qPCR Results [https://www.goldbio.com/blogs/articles/how-to-interpret-rt-qpcr-results?srsltid=AfmBOooqfsPCmtMHZm83UTPtpy16OGcJmFWFGOgy7q3ucPtz8U6pBrHd]
- 73. Introduction to Quantitative PCR (qPCR) Gene Expression ... [https://www.thermofisher.com/us/en/home/life-science/pcr/real-time-pcr/real-time-pcr-learning-center/gene-expression-analysis-real-time-pcr-information/introduction-gene-expression.html]
- 74. Genome wide profiling in oral squamous cell carcinoma ... [https://journals.plos.org/plosone/article?id=10.1371/journal.pone.0174865]
- 75. Methods to determine limit of detection and ... [https://pmc.ncbi.nlm.nih.gov/articles/PMC5496743/]
- 76. Quantitative PCR (qPCR) Data Analysis [https://www.thermofisher.com/us/en/home/life-science/pcr/real-time-pcr/real-time-pcr-learning-center/gene-expression-analysis-real-time-pcr-information/precision-qpcr.html]
- 77. Digital PCR: from early developments to its future application ... [https://pubs.rsc.org/en/content/articlehtml/2025/lc/d5lc00055f]
- 78. Proteogenomic characterisation of primary oral cancer unveils ... [https://pmc.ncbi.nlm.nih.gov/articles/PMC11879901/]
- 79. Combining single-cell and bulk RNA sequencing to identify ... [https://www.nature.com/articles/s41598-025-14979-w]
- 80. Innovative Tools for Multiplexing in Your qPCR Workflow [https://www.technologynetworks.com/genomics/webinars/mastering-multiplexing-innovative-tools-for-multiplexing-in-your-qpcr-workflow-389825]
- 81. Multiplexed Digital PCR Reference Gene Measurement for ... [https://www.mdpi.com/2073-4409/14/19/1544]
- 82. Innovative Tools for Multiplexing in Your qPCR Workflow [https://www.labroots.com/webinar/mastering-multiplexing-innovative-tools-multiplexing-qpcr-workflow?srsltid=AfmBOoo5RdtFh10dDJzkutumfFb_t_L99NWL1FHipne0l6ngacu2lEQ4]
- 83. Digital PCR: from early developments to its future application ... [https://pmc.ncbi.nlm.nih.gov/articles/PMC12278255/]
- 84. Medical diagnostic value of digital PCR (dPCR) [https://www.sciencedirect.com/science/article/pii/S2667099223000221]
- 85. Rapid and Sensitive Digital Droplet PCR Assays for ... [https://pmc.ncbi.nlm.nih.gov/articles/PMC11683180/]
- 86. Droplet digital polymerase chain reaction for detection and ... [https://pmc.ncbi.nlm.nih.gov/articles/PMC8925125/]
- 87. Comparing the Diagnostic Performance of Quantitative ... [https://pmc.ncbi.nlm.nih.gov/articles/PMC10918646/]
- 88. Cell-Free DNA as a Prognostic Biomarker in Oral ... [https://www.mdpi.com/2072-6694/17/14/2366]
- 89. Development of a high-performance multi-probe droplet ... [https://www.sciencedirect.com/science/article/abs/pii/S136883752300132X]
- 90. Comparing the precision of two digital PCR applications for ... [https://www.nature.com/articles/s41598-025-13143-8]
- 91. Integrated multi-omics analyses of oral squamous cell ... [https://www.sciencedirect.com/science/article/pii/S0304383525000461]
- 92. Antibody Validation Essentials: Orthogonal Strategy - CST Blog [https://blog.cellsignal.com/hallmarks-of-validation-orthogonal-strategy]
- 93. The role of orthogonal and complementary analytical ... [https://www.news-medical.net/whitepaper/20240718/Enhancing-biotherapeutic-research-The-role-of-orthogonal-and-complementary-analytical-techniques.aspx]
- 94. Molecular and Genetic Pathogenesis of Oral Cancer [https://pmc.ncbi.nlm.nih.gov/articles/PMC12293024/]
- 95. qPCR Steps: Creating a Successful Experiment | IDT [https://www.idtdna.com/page/support-and-education/decoded-plus/successful-qpcr/]