Pharmacophore Virtual Screening: Accelerating Lead Identification in Modern Drug Discovery
Pharmacophore-based virtual screening (VS) has evolved into a cornerstone strategy for efficient lead identification in drug discovery.
Pharmacophore Virtual Screening: Accelerating Lead Identification in Modern Drug Discovery
Abstract
Pharmacophore-based virtual screening (VS) has evolved into a cornerstone strategy for efficient lead identification in drug discovery. This article explores the integral role of pharmacophore models, which abstract key steric and electronic features essential for biological activity, in streamlining the hunt for novel therapeutic candidates. We delve into foundational concepts, contrasting ligand-based and structure-based approaches, and examine cutting-edge methodologies powered by artificial intelligence and deep learning. The discussion extends to practical applications across diverse therapeutic areas, including antiviral and anticancer research, alongside critical troubleshooting for model optimization and validation. By synthesizing current trends and real-world case studies, this resource provides researchers and drug development professionals with a comprehensive framework for leveraging pharmacophore VS to navigate vast chemical spaces and accelerate the development of bioactive molecules.
Understanding Pharmacophores: The Blueprint for Bioactivity
The pharmacophore concept, a cornerstone of modern medicinal chemistry and drug discovery, provides an abstract framework for understanding molecular recognition. According to the International Union of Pure and Applied Chemistry (IUPAC), a pharmacophore is defined as "an ensemble of steric and electronic features that is necessary to ensure the optimal supramolecular interactions with a specific biological target structure and to trigger (or block) its biological response" [1] [2] [3]. This definition emphasizes that a pharmacophore represents not a specific molecular structure, but rather the essential molecular interaction capacities shared by a group of compounds that recognize the same biological target [1]. Historically, the modern concept was popularized by Lemont Kier in the 1960s and 1970s, though elements of the concept appeared earlier in the work of Schueler and others [1] [2].
The fundamental principle underlying pharmacophore modeling is that ligands sharing common biological activity against a specific target must contain a set of common functional features in a specific three-dimensional arrangement that enables optimal interactions with the target's binding site [2]. These features typically include hydrogen bond acceptors (HBA), hydrogen bond donors (HBD), hydrophobic areas (H), positively and negatively ionizable groups (PI/NI), aromatic rings (AR), and metal-coordinating regions [2] [3]. By abstracting beyond specific atoms or functional groups to focus on these generalized chemical features, pharmacophore models enable the identification of structurally diverse compounds with similar target recognition capabilities, facilitating critical drug discovery processes such as scaffold hopping and virtual screening [1] [4].
Core Features and Model Development
Fundamental Pharmacophore Features
Pharmacophore features represent the key steric and electronic properties that facilitate molecular interactions between a ligand and its biological target. These features are derived from the functional groups present in active ligands and their complementary interaction sites on the target protein. The most significant feature types include [1] [2]:
- Hydrogen bond acceptors (HBA) and donors (HBD): These features represent the capacity to form directional hydrogen bonding interactions, crucial for specific molecular recognition.
- Hydrophobic areas (H): These represent regions of the ligand that participate in van der Waals interactions with non-polar protein residues.
- Positively and negatively ionizable groups (PI/NI): These features account for electrostatic interactions, including ionic bonds and charge-assisted hydrogen bonds.
- Aromatic rings (AR): These facilitate π-π stacking and cation-π interactions with complementary protein residues.
- Metal coordinating areas: These represent the ability to interact with metal ions in metalloprotein active sites.
A well-defined pharmacophore model typically incorporates both hydrophobic volumes and hydrogen bond vectors to comprehensively represent the interaction landscape [1]. These features may be located directly on the ligand structure or represented as projected points presumed to be located in the receptor environment [1].
Pharmacophore Model Development Workflow
The process of developing a pharmacophore model follows a systematic workflow that can be applied to both structure-based and ligand-based approaches. The general framework involves several key stages [1]:
- Training Set Selection: A structurally diverse set of molecules is selected, typically including both active and inactive compounds to enable discrimination of bioactivity.
- Conformational Analysis: For each molecule in the training set, a set of low-energy conformations is generated, aiming to include the bioactive conformation.
- Molecular Superimposition: The low-energy conformations of the training molecules are superimposed to identify the best spatial alignment of common functional groups.
- Abstraction: The aligned molecular structures are transformed into an abstract representation, replacing specific functional groups with generalized pharmacophore features.
- Validation: The pharmacophore model is validated for its ability to account for the biological activities of known compounds and predict new actives.
Table 1: Key Stages in Pharmacophore Model Development
| Stage | Key Activities | Output |
|---|---|---|
| Training Set Selection | Curate structurally diverse active/inactive compounds | Representative molecular set |
| Conformational Analysis | Generate low-energy conformers | Bioactive conformation candidates |
| Molecular Superimposition | Align conformations based on common features | Optimal spatial arrangement |
| Abstraction | Replace specific groups with abstract features | Preliminary pharmacophore model |
| Validation | Test model against known actives/inactives | Validated pharmacophore hypothesis |
This systematic approach ensures the resulting pharmacophore model captures the essential molecular features required for biological activity while accommodating structural diversity among active compounds.
Methodological Approaches: Structure-Based vs. Ligand-Based
Structure-Based Pharmacophore Modeling
The structure-based approach to pharmacophore modeling relies on the three-dimensional structural information of the biological target, typically obtained from X-ray crystallography, NMR spectroscopy, or homology modeling [2]. When experimental structures are unavailable, computational models generated by tools like AlphaFold2 can provide reliable protein structures for analysis [2]. The workflow begins with critical protein preparation steps, including the assignment of protonation states, addition of hydrogen atoms, and correction of any structural deficiencies [2].
The binding site analysis represents a crucial step in structure-based pharmacophore generation. This can be accomplished using various computational tools: GRID employs different molecular probes to sample protein regions and identify energetically favorable interaction points, while LUDI uses knowledge-based rules derived from protein-ligand complexes to predict potential interaction sites [2]. When a protein-ligand complex structure is available, the pharmacophore features can be derived directly from the observed interactions, resulting in highly accurate models that may include exclusion volumes to represent steric restrictions of the binding pocket [2].
A recent application of structure-based pharmacophore modeling demonstrated its effectiveness in identifying novel FAK1 inhibitors. Researchers used the FAK1-P4N complex (PDB ID: 6YOJ) to generate pharmacophore models, which were then employed to screen the ZINC database [5]. The resulting hits underwent molecular docking, ADMET filtering, and molecular dynamics simulations, leading to the identification of several promising candidates with strong binding affinity and favorable pharmacokinetic profiles [5].
Ligand-Based Pharmacophore Modeling
When the three-dimensional structure of the target protein is unavailable, ligand-based pharmacophore modeling provides a powerful alternative approach. This method develops pharmacophore hypotheses based on the structural and physicochemical properties of known active ligands [2] [6]. The fundamental assumption is that compounds sharing common biological activity must contain a set of common features in a specific three-dimensional arrangement that enables target recognition [2].
The ligand-based approach typically begins with the selection of a training set of active compounds, preferably with diverse structural scaffolds but similar biological activity. For example, in a study to identify novel CCR5 inhibitors, researchers selected nine highly active CCR5 inhibitors (IC~50~ values ranging from 0.5 nM to 3.5 nM) as the training set [6]. Conformational analysis is then performed for each compound, followed by molecular alignment to identify the common spatial arrangement of pharmacophoric features.
In the CCR5 inhibitor study, researchers used the Common Feature Generation protocol in Discovery Studio to generate multiple pharmacophore hypotheses [6]. The optimal hypothesis (Hypo1) consisted of three hydrophobic features, two hydrogen bond acceptors, and one hydrogen bond donor, which effectively represented the essential features for CCR5 antagonism [6]. This model was subsequently used for virtual screening of chemical databases, leading to the identification of novel hit compounds with potential CCR5 inhibitory activity.
Comparative Performance Evaluation
A benchmark study comparing pharmacophore-based virtual screening (PBVS) against docking-based virtual screening (DBVS) across eight diverse protein targets demonstrated the effectiveness of pharmacophore approaches [7]. The study found that in fourteen of sixteen virtual screening experiments, PBVS achieved higher enrichment factors than DBVS [7]. The average hit rates at 2% and 5% of the highest-ranked database compounds were significantly higher for PBVS across all targets, establishing it as a powerful method for active compound retrieval in drug discovery campaigns [7].
Experimental Protocols and Methodologies
Structure-Based Pharmacophore Modeling Protocol
The following detailed protocol outlines the structure-based pharmacophore modeling process as applied in a recent FAK1 inhibitor study [5]:
Protein Structure Preparation
- Retrieve the three-dimensional structure of the target protein from the Protein Data Bank (PDB). For example, the FAK1 kinase domain in complex with P4N (PDB ID: 6YOJ) was used in the referenced study.
- Address missing residues or loops using modeling tools such as MODELLER via the Chimera interface. Generate multiple models and select the one with the lowest zDOPE score for subsequent analysis.
- Perform protein preparation steps including hydrogen atom addition, protonation state assignment for residues, and energy minimization.
Binding Site Analysis and Pharmacophore Feature Generation
- Identify the ligand-binding site through analysis of the protein-ligand complex or using binding site detection tools such as GRID or LUDI.
- Upload the protein-ligand complex to pharmacophore modeling software such as Pharmit.
- Identify critical pharmacophoric features involved in ligand-receptor interactions. Pharmit initially detected eight features for the FAK1-P4N complex.
- Generate multiple pharmacophore models (e.g., six models with five or six features each) for subsequent validation.
Pharmacophore Model Validation
- Compile a set of known active compounds and decoys (inactive compounds) from databases such as DUD-E (Directory of Useful Decoys - Enhanced). The FAK1 study used 114 actives and 571 decoys.
- Screen these validation sets against each pharmacophore model and calculate statistical metrics:
- Sensitivity = (Ha / A) × 100 [where Ha is number of active hits, A is total actives]
- Specificity = (Hd / D) × 100 [where Hd is number of decoy hits, D is total decoys]
- Enrichment Factor (EF) and Goodness of Hit (GH)
- Select the model with the highest validation performance for virtual screening.
Ligand-Based Pharmacophore Modeling Protocol
The following protocol details the ligand-based approach as implemented in a CCR5 inhibitor identification study [6]:
Training Set Compilation
- Collect a set of known active compounds with measured biological activity (e.g., IC~50~ values). The CCR5 study used nine potent inhibitors with IC~50~ values between 0.5 nM and 3.5 nM.
- Obtain 2D structures from databases such as PubChem and draw them using chemical drawing tools like BIOVIA Draw.
- Convert 2D structures to 3D and perform energy minimization using algorithms such as Steepest Descent in molecular modeling software.
Feature Mapping and Pharmacophore Generation
- Use the Feature Mapping protocol in software such as Discovery Studio to identify common chemical features present in the training set compounds.
- Based on feature mapping results, employ the Common Feature Generation protocol to generate multiple pharmacophore hypotheses.
- Evaluate generated hypotheses based on rank score, feature composition, and alignment with training set compounds.
- Select the best hypothesis (e.g., Hypo1 in the CCR5 study with three hydrophobic features, two hydrogen bond acceptors, and one hydrogen bond donor) for virtual screening.
Pharmacophore Validation
- Validate the selected pharmacophore model using methods such as the Güner-Henry method to ensure its ability to distinguish active from inactive compounds.
- Test the model against a test set of known actives and inactives to calculate enrichment factors and other validation metrics.
Applications in Virtual Screening and Lead Identification
Virtual Screening Workflows
Pharmacophore-based virtual screening has emerged as a powerful strategy for identifying novel bioactive compounds from large chemical databases. The general workflow integrates pharmacophore screening with complementary computational techniques [5] [6]:
Database Preparation: Compile and prepare large chemical databases (e.g., ZINC, Asinex, Specs) for screening, including format conversion, tautomer generation, and energy minimization.
Pharmacophore Screening: Use the validated pharmacophore model as a 3D query to screen the chemical database and retrieve compounds that match the essential feature arrangement.
Molecular Docking: Subject the pharmacophore-matched compounds to molecular docking studies using programs such as AutoDock Vina, SwissDock, or Glide to evaluate binding modes and affinities.
ADMET Filtering: Evaluate the top-ranking compounds for acceptable pharmacokinetic properties and low predicted toxicity using tools like SwissADME or admetSAR.
Molecular Dynamics Simulations: Perform MD simulations (e.g., using GROMACS) on selected protein-ligand complexes to assess stability and interaction persistence over time.
Binding Free Energy Calculations: Apply methods such as MM/PBSA (Molecular Mechanics/Poisson-Boltzmann Surface Area) to calculate binding free energies and identify the most promising candidates.
Table 2: Key Software Tools for Pharmacophore Applications
| Application Area | Software Tools | Key Features |
|---|---|---|
| Pharmacophore Modeling | Catalyst/Discovery Studio, LigandScout, Phase, MOE | Model generation, 3D-QSAR, virtual screening |
| Molecular Docking | AutoDock Vina, GOLD, Glide, SwissDock | Binding pose prediction, scoring |
| Molecular Dynamics | GROMACS, AMBER, NAMD | Complex stability, dynamic behavior |
| Binding Energy Calculations | MM/PBSA, MM/GBSA | Free energy estimation |
| ADMET Prediction | SwissADME, admetSAR, Molsoft | Pharmacokinetic and toxicity profiling |
Case Study: Identification of Novel FAK1 Inhibitors
A comprehensive study demonstrating the application of pharmacophore-based virtual screening led to the identification of novel FAK1 inhibitors with potential anticancer activity [5]. The researchers developed a structure-based pharmacophore model from the FAK1-P4N complex, which they validated using statistical metrics. This model was used to screen the ZINC database, followed by molecular docking that identified seventeen compounds with acceptable binding properties and pharmacokinetic profiles [5]. Further refinement through more precise docking and MD simulations narrowed the candidates to four promising leads, with ZINC23845603 emerging as the top candidate due to its strong binding energy, stable complex behavior, and interaction features similar to the known ligand P4N [5]. This case demonstrates how pharmacophore-based screening efficiently narrows large chemical databases to a manageable number of high-quality leads for experimental validation.
Case Study: Discovery of CCR5 Antagonists
In another application, researchers employed ligand-based pharmacophore modeling to identify novel CCR5 antagonists for HIV therapy [6]. After developing and validating a pharmacophore model from known CCR5 inhibitors, the team performed virtual screening of several chemical libraries. The identified hits underwent molecular docking studies, MD simulations, and binding free energy calculations, revealing that two hits (Hit1 and Hit2) demonstrated better binding energy than the FDA-approved drug Maraviroc and formed stable interactions with key CCR5 residues throughout 100 ns MD simulations [6]. This success illustrates the power of pharmacophore approaches to identify promising drug candidates, particularly for targets like CCR5 where structural information may be limited.
Table 3: Essential Research Reagents and Computational Tools for Pharmacophore Studies
| Resource Category | Specific Tools/Databases | Primary Function |
|---|---|---|
| Protein Structure Databases | RCSB Protein Data Bank (PDB) | Source of experimental protein structures for structure-based modeling |
| Chemical Databases | ZINC, PubChem, Asinex, Specs, InterBioScreen | Libraries of compounds for virtual screening |
| Active/Decoy Compound Sets | DUD-E (Directory of Useful Decoys - Enhanced) | Validated sets of active and decoy compounds for pharmacophore validation |
| Pharmacophore Modeling Software | Catalyst/Discovery Studio, LigandScout, Phase, MOE, Pharmit | Generation, visualization, and application of pharmacophore models |
| Molecular Docking Tools | AutoDock Vina, GOLD, Glide, SwissDock | Prediction of ligand binding modes and affinity scoring |
| Molecular Dynamics Software | GROMACS, AMBER, NAMD | Simulation of protein-ligand complex stability and dynamics |
| Binding Free Energy Calculations | MM/PBSA, MM/GBSA | Quantification of protein-ligand binding affinities |
| ADMET Prediction Platforms | SwissADME, admetSAR, Molsoft | Prediction of pharmacokinetic properties and toxicity profiles |
Advanced Integration and Future Perspectives
Integration with Artificial Intelligence and Machine Learning
Recent advances in artificial intelligence (AI) and machine learning (ML) are revolutionizing pharmacophore modeling and virtual screening approaches. AI-driven molecular representation methods, including graph neural networks (GNNs), variational autoencoders (VAEs), and transformer models, enable more sophisticated characterization of molecular structures and properties [4]. These approaches learn continuous, high-dimensional feature embeddings directly from large datasets, capturing both local and global molecular features that may be overlooked by traditional methods [4].
Quantitative Pharmacophore Activity Relationship (QPhAR) methods represent another significant advancement, combining traditional pharmacophore modeling with machine learning to create predictive models for activity optimization [8]. This integration enables more accurate activity prediction and facilitates lead optimization in drug discovery projects. The synergy between AI and pharmacophore modeling is particularly valuable for scaffold hopping, where the goal is to identify novel core structures that maintain biological activity while improving other properties [4]. Modern AI methods can capture nuanced structural relationships that enable identification of scaffolds previously difficult to discover using traditional similarity-based approaches [4].
Synergy with Molecular Dynamics Simulations
The integration of pharmacophore modeling with molecular dynamics (MD) simulations has emerged as a powerful strategy for addressing the dynamic nature of protein-ligand interactions. While static pharmacophore models provide valuable insights, they may overlook conformational flexibility and induced fit effects. MD simulations complement pharmacophore approaches by providing temporal dimension to the analysis of binding interactions [5] [6].
In the FAK1 inhibitor study, researchers used MD simulations to evaluate the stability of four potential inhibitor complexes over time, monitoring root-mean-square deviation (RMSD) and specific protein-ligand interactions [5]. This approach confirmed that the top candidate (ZINC23845603) maintained stable binding interactions throughout the simulation period, validating the initial pharmacophore-based predictions [5]. Similarly, in the CCR5 antagonist study, 100 ns MD simulations demonstrated that the identified hits maintained stable interactions with key residues, providing confidence in their potential as drug candidates [6]. These case studies highlight how MD simulations can confirm the stability and persistence of pharmacophore-identified interactions under dynamic conditions.
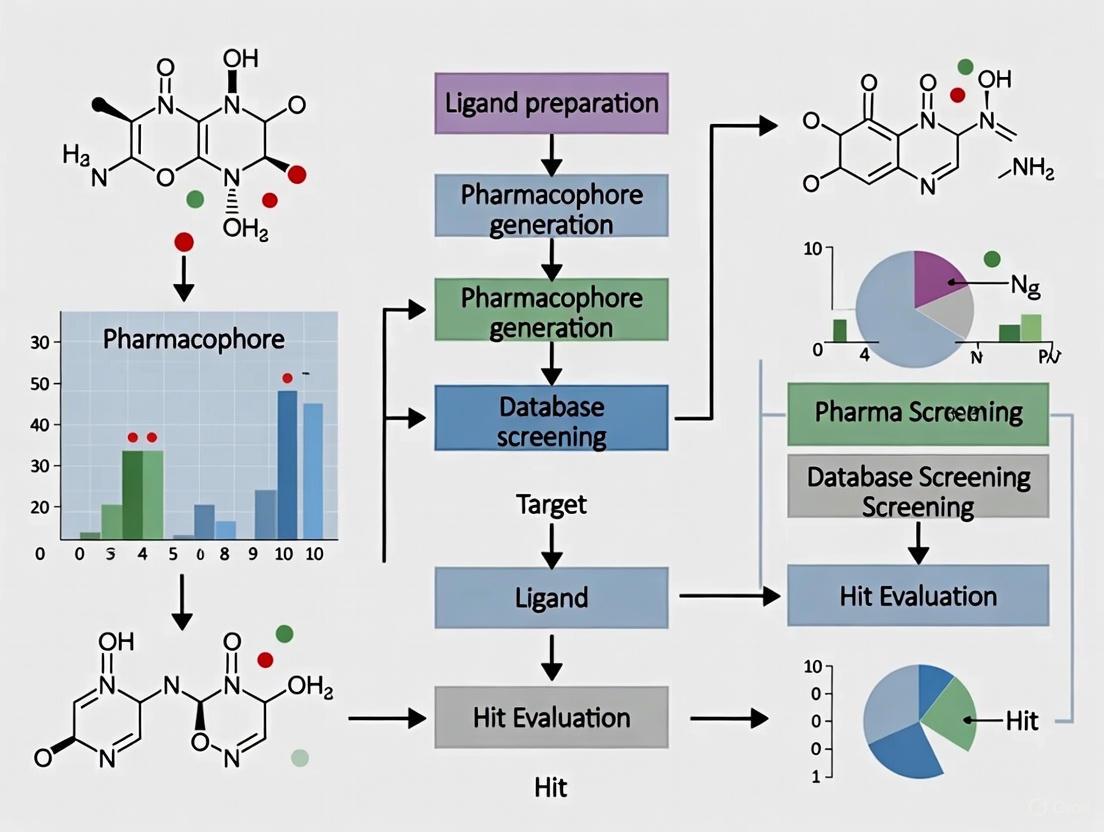
Workflow Visualization
Diagram 1: Integrated Pharmacophore Modeling and Virtual Screening Workflow. This flowchart illustrates the two primary approaches (structure-based and ligand-based) and their convergence into a common virtual screening and validation pipeline.
The pharmacophore concept has evolved from an abstract theoretical framework to a practical and indispensable tool in modern drug discovery. By distilling the essential steric and electronic features required for molecular recognition, pharmacophore models provide a powerful approach for navigating complex chemical spaces and identifying novel bioactive compounds. The integration of pharmacophore-based virtual screening with complementary computational methods—including molecular docking, MD simulations, and binding free energy calculations—creates a robust pipeline for lead identification and optimization. As AI and machine learning continue to advance, their synergy with traditional pharmacophore approaches promises to further enhance the efficiency and success of drug discovery efforts, particularly in challenging areas such as scaffold hopping and polypharmacology. Through continued methodological refinements and integrative applications, pharmacophore modeling remains a cornerstone of computational drug design, enabling researchers to translate abstract molecular features into concrete therapeutic candidates.
Pharmacophore modeling is a foundational concept in computer-aided drug design (CADD), defined by IUPAC as "the ensemble of steric and electronic features that is necessary to ensure the optimal supramolecular interactions with a specific biological target and to trigger (or to block) its biological response" [2]. This approach abstracts molecular interactions into core chemical features—such as hydrogen bond acceptors (HBA), hydrogen bond donors (HBD), hydrophobic areas (H), and ionizable groups—thereby enabling the identification of bioactive compounds regardless of their underlying scaffold [2]. Within modern virtual screening (VS) workflows for lead identification, pharmacophore approaches provide an efficient method for prioritizing candidates from extensive chemical libraries, significantly reducing time and costs compared to experimental screening alone [2].
The two primary methodologies for pharmacophore model development are ligand-based and structure-based modeling, each with distinct requirements, workflows, and applications. This review provides a detailed technical comparison of these approaches, focusing on their implementation, performance, and strategic role in lead discovery research.
Methodological Foundations and Workflows
Ligand-Based Pharmacophore Modeling
Ligand-based pharmacophore modeling is applied when the three-dimensional structure of the target protein is unknown, but a set of known active ligands is available. This approach operates on the principle that compounds sharing common biological activity against a specific target must possess essential chemical features arranged in a conserved spatial orientation [2].
Experimental Protocol:
- Training Set Compilation: Curate a structurally diverse set of known active compounds, ideally with associated quantitative activity data (e.g., IC₅₀, Ki) [9].
- Conformational Sampling: Generate a representative set of low-energy conformations for each ligand in the training set. This is typically achieved using algorithms such as Monte Carlo methods or systematic torsional sampling [9].
- Molecular Superimposition: Identify the optimal alignment of the training compounds that maximizes the spatial overlap of their common chemical functionalities. Common software tools include DISCO, GASP, or PHASE [9].
- Feature Abstraction and Hypothesis Generation: From the superimposed consensus, extract the common steric and electronic features critical for biological activity to form one or more pharmacophore hypotheses [2].
- Model Validation: Validate the generated model using a test set of active and inactive/decoy compounds. Metrics such as the Enrichment Factor (EF) and the Area Under the ROC Curve (AUC) are calculated to quantify the model's ability to distinguish active from inactive molecules [10]. For example, a validated model for XIAP protein inhibitors achieved an EF1% of 10.0 and an AUC of 0.98, demonstrating excellent predictive power [10].
The following diagram illustrates this multi-step workflow:
Structure-Based Pharmacophore Modeling
Structure-based pharmacophore modeling requires a three-dimensional structure of the target macromolecule, which can be obtained from experimental methods (X-ray crystallography, NMR) or computational modeling (e.g., homology modeling with tools like AlphaFold2) [2] [11]. The approach involves analyzing the target's binding site to identify key interaction points that a ligand must satisfy.
Experimental Protocol:
- Protein Structure Preparation: Obtain and refine the 3D structure from the PDB or via homology modeling. Critical steps include adding hydrogen atoms, assigning correct protonation states, and repairing missing residues [2] [11].
- Binding Site Characterization: Identify and delineate the ligand-binding pocket. This can be done manually based on co-crystallized ligand location or using automated tools like GRID or LUDI, which probe the site with different functional groups to map favorable interaction energies [2] [11].
- Interaction Feature Mapping: Analyze the binding site to pinpoint locations suitable for key interactions (HBA, HBD, hydrophobic contacts, ionic interactions). In advanced protocols, tools like Multiple Copy Simultaneous Search (MCSS) place functional group fragments into the site, which are then energy-minimized to identify optimal positions and orientations [11].
- Model Assembly and Refinement: Select the most critical interaction points from the mapping to construct the pharmacophore hypothesis. Exclusion volumes (XVOL) are often added to represent steric constraints from the protein, preventing clashes [2] [11].
- Performance Evaluation: Similar to ligand-based models, the final structure-based model is evaluated by screening a database of known actives and decoys, with performance quantified by EF and GH (goodness-of-hit) scores [11].
The workflow for the structure-based approach is summarized below:
The following table summarizes the core characteristics, advantages, and limitations of each pharmacophore modeling strategy.
Table 1: Comparative overview of ligand-based and structure-based pharmacophore modeling approaches
| Aspect | Ligand-Based Pharmacophore | Structure-Based Pharmacophore |
|---|---|---|
| Primary Input Data | Set of known active ligands [2] | 3D structure of the target protein (experimental or modeled) [2] |
| Key Requirements | Multiple, structurally diverse active compounds; biological activity data is beneficial [9] | High-quality protein structure; binding site definition [2] [11] |
| Fundamental Principle | Extracts common chemical features from a superposition of active ligands [2] | Derives interaction features from the analysis of the protein's binding site [2] |
| Ideal Application Context | Targets with no known 3D structure but multiple known ligands (e.g., GPCRs) [9] | Targets with available 3D structure, including orphan targets with no known ligands [11] |
| Major Advantages | - Does not require protein structure- Directly captures ligand-derived activity patterns- Excellent for scaffold hopping [2] [9] | - Can be applied without known ligands- Provides mechanistic insight into binding- Incorporates exclusion volumes (XVOL) for specificity [2] [11] |
| Inherent Limitations | - Quality depends on diversity and quality of the training set- Cannot discover novel binding modes- Lacks direct structural context of the target [2] [9] | - Quality is highly dependent on the input protein structure- May generate an overabundance of features requiring pruning- Computationally more intensive [2] [11] |
Performance and Validation in Virtual Screening
Quantitative validation is critical for establishing the utility of a pharmacophore model in a virtual screening campaign. Key metrics include the Enrichment Factor (EF), which measures how much better the model is at identifying actives compared to random selection, and the Goodness-of-Hit (GH) score, which balances the yield of actives with the false-negative rate [11].
Table 2: Representative virtual screening performance of pharmacophore models
| Target Protein | Modeling Approach | Performance Metrics | Key Findings |
|---|---|---|---|
| XIAP [10] | Structure-Based | EF1% = 10.0; AUC = 0.98 | Model successfully identified natural compounds with potential anti-cancer activity, validated by molecular dynamics. |
| Class A GPCRs (13 targets) [11] | Structure-Based (Score-based) | High EF and GH scores; Logistic regression classifier PPV: 0.88 (experimental structures), 0.76 (modeled structures) | A machine learning "cluster-then-predict" workflow effectively selected high-performing pharmacophore models, even for homology models. |
| PARP1, USP1, ATM [12] | Structure-Based (CMD-GEN framework) | Sampled pharmacophores accurately mirrored binding modes of known inhibitors (e.g., Isocarbostyril core in PARP1). | The framework enabled rapid sampling of pharmacophore combinations for selective inhibitor design, confirmed by wet-lab validation for PARP1/2. |
Table 3: Key software and data resources for pharmacophore-based research
| Tool / Resource Name | Primary Function | Application Context |
|---|---|---|
| LigandScout [10] | Creates structure-based and ligand-based pharmacophore models from protein-ligand complexes or ligand sets, and performs virtual screening. | Used to generate and validate the structure-based model for XIAP, identifying key hydrophobic, HBD, and HBA features [10]. |
| MCSS (Multiple Copy Simultaneous Search) [11] | Places numerous copies of functional group fragments into a protein's binding site to map optimal interaction points for pharmacophore feature generation. | Core to the score-based structure-based pharmacophore modeling workflow for GPCRs [11]. |
| PHASE [9] [13] | Performs ligand-based pharmacophore model development, 3D-QSAR analysis, and database screening. | Allows for the development of quantitative pharmacophore models and pharmacophore field-based QSAR [13]. |
| HypoGen/Discovery Studio [13] | Algorithm and software for generating quantitative pharmacophore models from a set of active and inactive training molecules. | One of the few commercially available tools for building directly quantitative models from pharmacophore features [13]. |
| ZINC Database [10] | A curated collection of commercially available chemical compounds prepared for virtual screening (e.g., in 3D formats). | Sourced for natural compound libraries in the virtual screening for novel XIAP antagonists [10]. |
| DUDe (Database of Useful Decoys) [10] | Provides benchmark decoy sets for specific targets to rigorously validate virtual screening methods and avoid false positives. | Used to validate the XIAP pharmacophore model with 10 active compounds and 5199 decoys [10]. |
Emerging Trends and Advanced Applications
The field of pharmacophore modeling is being revitalized by integration with artificial intelligence and deep learning, enhancing its predictive power and application scope.
- Quantitative Pharmacophore Activity Relationship (QPHAR): This novel method constructs robust quantitative SAR models directly from pharmacophore features, demonstrating an average RMSE of 0.62 in cross-validation on over 250 diverse datasets. Its low requirement for training set size (as few as 15-20 samples) makes it particularly viable for lead optimization [13].
- Pharmacophore-Guided Deep Learning for Molecular Generation: Models like PGMG (Pharmacophore-Guided Molecule Generation) use pharmacophore hypotheses as input to generate novel, drug-like molecules with high validity, uniqueness, and novelty [14]. This approach provides a flexible strategy for de novo design in both ligand-based and structure-based contexts.
- Integrated Frameworks for Selective Inhibitor Design: Advanced frameworks such as CMD-GEN combine coarse-grained pharmacophore sampling from diffusion models with hierarchical molecular generation. This addresses challenges of molecular stability and drug-likeness, showing promise for designing selective inhibitors, as validated for PARP1/2 [12].
- Machine Learning for Model Selection: The "cluster-then-predict" workflow employing K-means clustering and logistic regression can classify and select high-enrichment structure-based pharmacophore models with high positive predictive value (0.82 true positive rate), a crucial advancement for applying these models to targets with no known ligands [11].
Ligand-based and structure-based pharmacophore modeling are powerful, complementary strategies within the virtual screening toolkit for lead identification. The choice between them is dictated primarily by the available structural and ligand data. The convergence of classic pharmacophore concepts with modern AI and machine learning is creating a new generation of intelligent tools. These tools, including QPHAR and PGMG, are enhancing the quantitative prediction, de novo design, and overall effectiveness of pharmacophore approaches, solidifying their critical role in accelerating rational drug discovery.
In the realm of computer-aided drug design, a pharmacophore is defined as the ensemble of steric and electronic features that is necessary to ensure optimal supramolecular interactions with a specific biological target and to trigger (or block) its biological response [2] [15]. This abstract representation captures the essential three-dimensional arrangement of molecular functionalities—such as hydrogen-bond donors and acceptors, hydrophobic regions, and charged groups—shared by ligands that exhibit similar biological activity against a given target [15]. Unlike a molecular scaffold, which refers to a specific core structure, a pharmacophore emphasizes the spatial arrangement and types of interaction features rather than the underlying atomic connectivity [15]. This conceptual framework serves as a foundational tool for understanding ligand-target recognition and provides the structural basis for virtual screening (VS) campaigns aimed at identifying novel lead compounds from vast chemical libraries [2] [16]. By distilling the complex phenomenon of binding into a set of critical features, pharmacophore models bridge the gap between chemistry and biology, facilitating the rational design of therapeutics in a time- and cost-efficient manner [2] [17].
Defining the Core Pharmacophoric Features
The predictive power of a pharmacophore model hinges on the accurate identification and spatial representation of key chemical features. These features are the functional units that mediate non-covalent interactions with the biological target. The most critical features, which form the cornerstone of most pharmacophore models, are hydrogen bond donors/acceptors, hydrophobic regions, and ionic groups [16] [18].
Table 1: Core Pharmacophoric Features and Their Characteristics
| Feature | Atomic/Groups Involved | Interaction Type | Representation in Model | Tolerance Parameters |
|---|---|---|---|---|
| Hydrogen Bond Donor (HBD) | OH, NH, (less commonly SH) [16] | Directional electrostatic interaction with acceptor [18] | Vector or sphere; often a "torus" for sp³ hybridized atoms [18] | Distance: ~1.5–2.5 Å to acceptor; Angle: ~30° deviation for sp³ [15] [18] |
| Hydrogen Bond Acceptor (HBA) | Carbonyl O, ether O, aromatic N [16] | Directional electrostatic interaction with donor [18] | Vector or sphere; often a "cone" for sp² hybridized atoms [18] | Distance: ~1.5–2.5 Å to donor; Angle: ~50° deviation for sp² [15] [18] |
| Hydrophobic Region (H) | Alkyl chains, aromatic ring systems [15] [16] | van der Waals forces, entropic gain from desolvation [15] | Sphere or volume [15] | Spherical centroid with radius typically 1–2 Å [15] |
| Positive Ionizable (PI) | Protonated amines, quaternary ammonium [16] | electrostatic attraction, salt bridges [15] | Sphere with defined charge [19] | pKa-based (e.g., basic groups with pKa 7–10 at pH 7.4) [15] |
| Negative Ionizable (NI) | Carboxylates, phosphates, sulfonates [16] | electrostatic attraction, salt bridges [15] | Sphere with defined charge [19] | pKa-based (e.g., acidic groups with pKa 3–5 at pH 7.4) [15] |
Hydrogen Bond Donors and Acceptors
Hydrogen bond donors are functional groups capable of donating a hydrogen atom to form a hydrogen bond with a complementary acceptor group. These typically include amino (NH, NH₂), hydroxyl (OH), and, less commonly, thiol (SH) groups [16]. Hydrogen bond acceptors, conversely, are atoms or groups with a lone pair of electrons that can accept a hydrogen bond from a donor. Common examples are carbonyl oxygen, ether oxygen, and aromatic nitrogen atoms [16]. These interactions are highly directional and play a crucial role in determining the specificity and affinity of a ligand for its target [18]. In pharmacophore models, they are represented as vectors or spheres with specific angular tolerances. For instance, interactions at sp² hybridized atoms are often depicted as a cone with a default angular range of 50 degrees, while those at sp³ atoms are represented by a torus with a ~34-degree angular range to account for flexibility [18].
Hydrophobic Regions
Hydrophobic regions are non-polar areas of a molecule that tend to avoid interaction with water and prefer to associate with other non-polar surfaces. These regions often consist of alkyl chains or aromatic rings (e.g., benzene, pyridine) and contribute significantly to the overall lipophilicity of a molecule [16]. The interaction is driven by the desolvation of the non-polar surfaces and the resulting entropic gain and van der Waals contacts, which collectively stabilize the ligand in the binding pocket [15]. In a model, these features are abstracted as spherical centroids or volumes, often with a radius of 4–6 Å, representing the space occupied by the hydrophobic group [15].
Ionic Groups
Ionic groups introduce formal charges that enable strong, long-range electrostatic interactions, such as salt bridges. Positive ionizable features include protonated amines (e.g., in ammonium groups) and are modeled based on their protonation state at physiological pH (typically, basic groups with pKa 7–10 remain protonated) [15] [16]. Negative ionizable features include carboxylates, phosphates, and sulfonates, which are deprotonated and negatively charged at physiological pH (typically, acidic groups with pKa 3–5 are deprotonated) [15] [16]. The energetic contribution of these charged groups to binding can be substantial, and their representation in a pharmacophore model often includes tolerances based on pKa to ensure the correct ionization state is considered [15].
Diagram 1: Workflow for developing and applying a pharmacophore model, showing the decision point between ligand-based and structure-based approaches.
Experimental Protocols for Pharmacophore Model Development
The development of a robust pharmacophore model is a multi-step process that relies heavily on the quality of input data and the rigor of computational protocols. The two primary methodologies are structure-based and ligand-based pharmacophore modeling, with a growing trend of integrating both for enhanced reliability [2] [16] [18].
Structure-Based Pharmacophore Modeling
This protocol is employed when the three-dimensional structure of the target protein (often with a bound ligand) is available from sources like the RCSB Protein Data Bank (PDB), or through computational techniques like homology modeling (e.g., AlphaFold2) [2].
Table 2: Key Research Reagents and Tools for Structure-Based Modeling
| Item/Tool | Function/Description | Application Note |
|---|---|---|
| Protein Data Bank (PDB) | Repository for 3D structural data of proteins and nucleic acids [2]. | Critical first step for obtaining a reliable starting structure. |
| Molecular Dynamics (MD) Software (e.g., GROMACS, AMBER) | Simulates physical movements of atoms and molecules over time [18]. | Accounts for protein flexibility; refines static models. |
| FTMap / E-FTMap Server | Computationally maps binding "hot spots" using small molecular probes [20]. | Identifies key interaction regions in a binding site. |
| Structure-Based Pharmacophore Generation Software (e.g., MOE, LigandScout) | Automatically extracts interaction features from a protein-ligand complex [2] [19]. | Generates initial pharmacophore hypotheses. |
Step 1: Protein Structure Preparation. The retrieved 3D structure (e.g., from PDB) is prepared by adding hydrogen atoms, assigning protonation states to residues (like Asp, Glu, His) at physiological pH, and correcting for any missing atoms or residues. This step is crucial as the quality of the input structure directly dictates the quality of the final pharmacophore model. Energy minimization may be performed to relieve steric clashes [2].
Step 2: Binding Site Identification and Analysis. The ligand-binding site is identified, either from the coordinates of a co-crystallized ligand or using binding site detection programs like GRID or LUDI. GRID, for instance, uses different functional groups as probes to sample the protein surface on a grid, identifying points with energetically favorable interactions and generating molecular interaction fields [2].
Step 3: Pharmacophore Feature Generation and Selection. The protein-ligand complex is analyzed to map key interaction points (e.g., a hydrogen bond between a ligand carbonyl and a backbone NH in the protein). Initially, many features are generated. The model is refined by selecting only those features that are essential for bioactivity, such as removing features that do not strongly contribute to binding energy or preserving residues with key functions from mutagenesis studies. Exclusion volumes (XVOL) are often added to represent regions occupied by the protein, preventing steric clashes in screened molecules [2] [19].
Ligand-Based Pharmacophore Modeling
This approach is used when the 3D structure of the target is unknown but a set of known active ligands is available. It operates on the principle that these active molecules share a common spatial arrangement of functional features responsible for their activity [2] [21].
Step 1: Ligand Selection and Conformational Analysis. A training set of structurally diverse but biologically active compounds is assembled. Conformational analysis is then performed for each ligand using methods like systematic search or molecular dynamics to generate an ensemble of low-energy conformers. This step is critical because the pharmacophore must be based on the bioactive conformation, which may not be the global minimum [15] [16].
Step 2: Molecular Alignment and Superimposition. The multiple low-energy conformers of the active ligands are aligned in 3D space to identify the maximal common substructure and overlapping chemical features. This can be achieved through rigid-body alignment, flexible alignment, or feature-based alignment algorithms. The principle of superposition is the cornerstone of this approach, aiming to find the best overlap of pharmacophoric points like hydrogen-bond donors and hydrophobic centroids [15] [21].
Step 3: Pharmacophore Hypothesis Generation and Validation. Common chemical features shared by the aligned ligands are identified and used to generate a pharmacophore hypothesis. This involves selecting the most relevant features (e.g., 3 hydrophobic, 2 HBA, 1 HBD) and defining their spatial constraints (distances, angles) [21]. The model is then validated using a set of known active and inactive compounds. Statistical metrics like the Güner-Henry (GH) score and Enrichment Factor (EF) are calculated to evaluate its ability to discriminate actives from inactives. A good model should have a high GH score and EF, indicating its predictive power for virtual screening [21].
Diagram 2: Data flow for structure-based (top) and ligand-based (bottom) pharmacophore modeling methodologies.
Application in Virtual Screening for Lead Identification
Pharmacophore-based virtual screening represents one of the most impactful applications of this technology in modern drug discovery. A validated pharmacophore model serves as a 3D query to efficiently search large chemical databases (e.g., ZINC, PubChem) and identify compounds that match the essential steric and electronic features, thereby predicting potential biological activity [2] [17].
The process involves screening millions of compounds in silico, drastically reducing the number of candidates that proceed to costly and time-consuming experimental testing [16] [17]. This approach is particularly powerful for scaffold hopping—the identification of novel core structures (scaffolds) that present the required pharmacophoric features in the correct spatial orientation but are chemically distinct from known actives. This helps in discovering new chemical entities and navigating around existing patents [4] [16]. Tools like the publicly accessible pharmit web server facilitate this process by allowing researchers to search databases using pharmacophore queries, with additional filters for drug-like properties (e.g., molecular weight, logP, rotatable bonds) [19].
A compelling case study demonstrating this application is the identification of novel Cysteine-Cysteine Chemokine Receptor 5 (CCR5) inhibitors to block HIV cellular entry [21]. Researchers developed a ligand-based common feature pharmacophore model (Hypo1) from a set of nine known active CCR5 inhibitors. The model consisted of three hydrophobic features, two hydrogen bond acceptors, and one hydrogen bond donor. After successful validation (GH score = 0.79, indicating a good model), it was used as a 3D query for the virtual screening of drug-like databases from Asinex, Specs, and other libraries. The resulting hits were further refined by molecular docking, dynamics simulations, and binding free energy calculations, leading to the identification of two potential leads (Hit1 and Hit2) that showed better binding energy than the FDA-approved drug Maraviroc and formed stable interactions with key residues [21]. This integrated workflow underscores the utility of pharmacophore-based VS as a primary engine for initiating lead identification campaigns.
The core pharmacophoric features—hydrogen bond donors/acceptors, hydrophobic regions, and ionic groups—constitute the fundamental language of molecular recognition. Their precise definition and spatial arrangement within a pharmacophore model provide an powerful abstract framework that transcends specific chemical structures. As demonstrated, these models are indispensable tools in the drug discovery pipeline, particularly in structuring and accelerating virtual screening for lead identification. The rigorous experimental protocols for model development, whether structure-based or ligand-based, ensure the derivation of robust and predictive hypotheses. When coupled with other computational techniques like molecular docking and dynamics simulations, pharmacophore-based virtual screening forms a powerful, integrated strategy for navigating the vastness of chemical space and identifying novel, promising leads for further development, thereby solidifying its critical role in modern rational drug design.
The Synergy Between Lead Compounds and Pharmacophore Models in Drug Design
In the landscape of computer-aided drug design (CADD), the integration of lead compounds and pharmacophore models represents a cornerstone strategy for efficient lead identification and optimization [2]. Pharmacophores provide an abstract representation of the steric and electronic features essential for a molecule to interact with a biological target and trigger its pharmacological response [2]. This technical guide delves into the synergistic relationship between known lead compounds and the pharmacophore models derived from them, framing this interaction within the context of virtual screening (VS) for lead identification research. We explore foundational methodologies, advanced quantitative and AI-driven approaches, and provide detailed protocols and resources to empower drug development professionals.
Pharmacophore Fundamentals and Modeling Approaches
A pharmacophore is defined by the International Union of Pure and Applied Chemistry (IUPAC) as "the ensemble of steric and electronic features that is necessary to ensure the optimal supramolecular interactions with a specific biological target structure and to trigger (or to block) its biological response" [2]. These features are represented geometrically as points, spheres, planes, and vectors in three-dimensional space, abstracting key molecular interactions from specific atomic structures [2].
The core pharmacophore feature types include [2]:
- Hydrogen Bond Acceptors (HBA) and Donors (HBD)
- Hydrophobic areas (H)
- Positively and Negatively Ionizable groups (PI/NI)
- Aromatic rings (AR)
- Metal Coordinating areas
Exclusion volumes (XVOL) can be added to represent steric constraints of the binding pocket [2]. This abstraction enables the identification of new chemotypes through "scaffold hopping," a primary advantage of pharmacophore-based virtual screening [13].
There are two principal methodologies for pharmacophore model development, each with distinct synergies with lead compounds:
Structure-Based Pharmacophore Modeling
This approach relies on the three-dimensional structure of the macromolecular target, typically obtained from sources like the Protein Data Bank (PDB) [2]. The workflow involves:
- Protein Preparation: Critical evaluation and optimization of the target structure, including protonation states and missing atoms [2].
- Ligand-Binding Site Detection: Identification of the key binding site using tools like GRID or LUDI, which analyze protein surfaces for potential interaction sites [2].
- Feature Generation and Selection: Derivation of a pharmacophore hypothesis from the interactions between the protein and a bound lead compound (in a co-crystal structure) or from an analysis of the empty binding pocket to identify essential chemical features for bioactivity [2].
Ligand-Based Pharmacophore Modeling
When a 3D protein structure is unavailable, pharmacophore models can be built from a set of known active lead compounds [2]. This method assumes that compounds sharing common biological activity possess common pharmacophoric features. The model is generated by identifying the steric and electronic features shared among these active ligands, often incorporating their bioactive conformations [2].
Quantitative and Automated Advances: Enhancing Synergy with Machine Learning
Traditional pharmacophore modeling can be tedious and reliant on expert knowledge. Recent advancements aim to automate this process and introduce quantitative predictive power, deepening the synergy with lead compound data.
The QPhAR Workflow: From Compounds to Ranked Hits
The Quantitative Pharmacophore Activity Relationship (QPhAR) methodology introduces a fully automated, ligand-based workflow for building predictive models from a small set of lead compounds (typically 15–50 ligands with known activity values like IC₅₀ or Kᵢ) [22]. The end-to-end process transforms qualitative models into quantitative screening tools:
- Dataset Preparation: A dataset for the target of interest is prepared and split into training and test sets [22].
- QPhAR Model Generation: A quantitative pharmacophore model is generated using the training set molecules. This model is validated on the separate test set [22].
- Pharmacophore Refinement: An algorithm automatically selects features that drive pharmacophore model quality using Structure-Activity Relationship (SAR) information extracted from the validated QPhAR model, resulting in a refined pharmacophore with high discriminatory power [22].
- Virtual Screening and Hit Ranking: The refined pharmacophore is used for virtual screening of large compound databases. Crucially, the hits obtained are ranked by their predicted activity values from the QPhAR model, providing a prioritized list for biological testing [22].
This workflow demonstrates how lead compound data are directly leveraged to create an optimized, quantitative tool for identifying and prioritizing new chemical matter.
AI-Driven Conformation Generation with DiffPhore
Deep learning is now being applied to pharmacophore-guided tasks. DiffPhore is a knowledge-guided diffusion framework for 3D ligand-pharmacophore mapping [23]. Its main concept is to utilize ligand-pharmacophore matching knowledge to guide the generation of ligand conformations that maximally map to a given pharmacophore model [23].
The framework consists of three core modules:
- Knowledge-Guided LPM Encoder: Encodes the ligand conformation and pharmacophore model as a geometric graph, incorporating explicit rules for pharmacophore type and directional matching [23].
- Diffusion-Based Conformation Generator: Estimates translation, rotation, and torsion transformations for the ligand conformation at each denoising step, parameterized by an SE(3)-equivariant graph neural network [23].
- Calibrated Conformation Sampler: Adjusts the conformation perturbation strategy to reduce the discrepancy between training and inference phases [23].
DiffPhore has shown state-of-the-art performance in predicting binding conformations and superior power in virtual screening for lead discovery, successfully identifying structurally distinct inhibitors for targets like human glutaminyl cyclases [23].
Experimental Protocols and Workflows
Protocol 1: Structure-Based Pharmacophore Modeling and Virtual Screening
This protocol is applicable when a high-resolution structure of the target protein, preferably in complex with a lead compound, is available [2].
Required Input:
- 3D structure of the target protein (e.g., from PDB) or a reliable homology model.
- Structure of a known active lead compound (if available for complex-based modeling).
Methodology:
- Protein Preparation: Using a molecular modeling environment (e.g., Maestro, MOE), add hydrogen atoms, assign protonation states, and correct any structural anomalies. Energy minimization may be performed.
- Binding Site Analysis: If no ligand is bound, use tools like GRID or LUDI to identify and characterize the binding pocket [2].
- Model Generation:
- For a protein-ligand complex, analyze the specific interactions (H-bonds, hydrophobic contacts, ionic interactions) between the lead compound and the protein.
- Use software like LigandScout or MOE to automatically translate these interactions into pharmacophore features (HBA, HBD, H, etc.).
- Manually curate the features, retaining those critical for binding, and add exclusion volumes to represent the protein's steric constraints [2].
- Model Validation: Validate the model by screening a small, diverse library containing known actives and inactives. Assess its ability to enrich actives (Enrichment Factor) and discriminate them from inactives.
- Virtual Screening: Use the validated model as a query to screen large molecular databases (e.g., ZINC, ChEMBL). Compounds matching the pharmacophore hypothesis are selected as hits.
Protocol 2: Ligand-Based QPhAR Modeling and Hit Prioritization
This protocol is used when multiple lead compounds with known activity data are available, enabling the construction of a quantitative model [22].
Required Input:
- A set of 15-50 compounds with measured activity (e.g., IC₅₀, Kᵢ) for the same target.
- Chemical structures of the compounds.
Methodology:
- Data Curation and Conformation Generation: Prepare the dataset by generating representative 3D conformations for each input molecule [13].
- Model Training and Validation:
- Split the dataset into training and test sets.
- Input the training set into the QPhAR algorithm, which will automatically generate a consensus (merged) pharmacophore and align all training pharmacophores to it [13].
- The algorithm builds a machine learning model that relates the spatial arrangement of features in the merged pharmacophore to the biological activity [13].
- Validate the model's predictive power on the held-out test set using metrics like R² and RMSE [22].
- Pharmacophore Refinement: Use the built-in algorithm to extract a refined pharmacophore from the QPhAR model, optimized for virtual screening performance based on SAR [22].
- Virtual Screening and Quantitative Ranking:
- Screen a database with the refined pharmacophore.
- Instead of a binary result, the QPhAR model predicts a continuous activity value for each hit [22].
- Output a rank-ordered list of virtual hits based on their predicted potency, guiding the selection of compounds for experimental testing.
Data Presentation and Analysis
Table 1: Performance Comparison of QPhAR-Based Refined Pharmacophores versus Baseline Shared-Feature Pharmacophores. The baseline models were generated from the most active compounds in the training set, while QPhAR models were generated using the automated algorithm. Performance was scored using a composite metric (F~Composite~) that emphasizes the identification of true positives while reducing false positives, a key objective in virtual screening [22].
| Data Source | Baseline F~Composite~-Score | QPhAR F~Composite~-Score | QPhAR Model R² | QPhAR Model RMSE |
|---|---|---|---|---|
| Ece et al. [22] | 0.38 | 0.58 | 0.88 | 0.41 |
| Garg et al. (hERG) [22] | 0.00 | 0.40 | 0.67 | 0.56 |
| Ma et al. [22] | 0.57 | 0.73 | 0.58 | 0.44 |
| Wang et al. [22] | 0.69 | 0.58 | 0.56 | 0.46 |
| Krovat et al. [22] | 0.94 | 0.56 | 0.50 | 0.70 |
Table 2: Essential Research Reagents and Computational Tools for Pharmacophore Modeling. This table details key software, databases, and resources that form the foundational toolkit for conducting pharmacophore-based virtual screening studies.
| Tool / Resource Name | Type | Primary Function in Pharmacophore Modeling |
|---|---|---|
| RCSB Protein Data Bank (PDB) [2] | Database | Source of experimental 3D protein structures for structure-based pharmacophore modeling. |
| ZINC [23] | Database | Large, publicly available database of commercially available compounds for virtual screening. |
| ChEMBL [13] | Database | Database of bioactive molecules with drug-like properties and associated bioactivity data. |
| LigandScout [24] | Software | Platform for creating structure-based and ligand-based pharmacophore models and performing virtual screening. |
| PHASE [13] | Software (Schrödinger) | Tool for developing ligand-based pharmacophore hypotheses and performing 3D-QSAR studies. |
| HypoGen/Catalyst [13] | Software (BioVia) | Algorithm for generating quantitative pharmacophore models from a set of active and inactive compounds. |
| ELIXIR-A [24] | Software Tool | An open-source, Python-based application for refining and comparing multiple pharmacophore models. |
| Pharmit [24] | Online Tool | Interactive online tool for pharmacophore-based virtual screening. |
| QPhAR [22] [13] | Algorithm/Method | A novel method for constructing quantitative pharmacophore models from a set of ligands with activity data. |
| DiffPhore [23] | AI Framework | A knowledge-guided diffusion model for 3D ligand-pharmacophore mapping and conformation generation. |
The synergy between lead compounds and pharmacophore models is a powerful driving force in modern drug discovery. This guide has detailed how lead compounds serve as the critical input for constructing both structure-based and ligand-based pharmacophore models, which in turn become intelligent queries for identifying novel chemical matter. The emergence of quantitative methods like QPhAR and AI-powered frameworks like DiffPhore marks a significant evolution in this field. These technologies automate complex modeling steps, enhance predictive robustness, and provide deeper, data-driven insights from lead compound datasets. By integrating these advanced computational approaches, researchers can more effectively navigate chemical space, accelerating the identification and optimization of novel therapeutic agents in a cost- and time-efficient manner.
Implementing Pharmacophore Screening: From AI to Real-World Case Studies
Workflow of a Pharmacophore Virtual Screening Campaign
Pharmacophore-based virtual screening (VS) represents a cornerstone of modern computer-aided drug discovery (CADD), serving as an efficient strategy to identify novel hit compounds from extensive chemical libraries by defining the essential steric and electronic features necessary for molecular recognition at a biological target [2]. This approach significantly reduces the time and cost associated with experimental high-throughput screening while enabling scaffold hopping—the identification of structurally diverse compounds that share the same pharmacophoric features [2] [13]. Within the broader context of lead identification research, pharmacophore VS serves as a powerful triage tool, rapidly prioritizing candidate molecules for further experimental validation and accelerating the early drug discovery pipeline [25] [26]. This technical guide details the comprehensive workflow of a pharmacophore virtual screening campaign, providing researchers with a structured methodology applicable to diverse therapeutic targets.
Theoretical Foundations of Pharmacophore Models
Definition and Core Features
A pharmacophore is formally defined by the International Union of Pure and Applied Chemistry (IUPAC) as "the ensemble of steric and electronic features that is necessary to ensure the optimal supramolecular interactions with a specific biological target structure and to trigger (or to block) its biological response" [2]. This abstract representation focuses on molecular interaction capabilities rather than specific chemical structures, enabling the identification of chemically distinct compounds that exhibit similar biological activity.
The most critical pharmacophoric features include [2]:
- Hydrogen Bond Acceptors (HBA) and Donors (HBD): Atoms or groups capable of participating in hydrogen bonding.
- Hydrophobic Areas (H): Non-polar regions favoring van der Waals interactions.
- Positively/Negatively Ionizable Groups (PI/NI): Functional groups that can become charged under physiological conditions.
- Aromatic Rings (AR): Planar systems enabling π-π stacking and cation-π interactions.
- Exclusion Volumes (XVOL): Spatial constraints representing forbidden regions occupied by the target protein.
Pharmacophore Generation Approaches
The construction of a pharmacophore hypothesis can be achieved through two principal methodologies, each with distinct requirements and applications as shown in Table 1.
Table 1: Comparison of Pharmacophore Modeling Approaches
| Approach | Required Input Data | Key Steps | Strengths | Limitations |
|---|---|---|---|---|
| Structure-Based | 3D Protein Structure (with or without bound ligand) [2] | 1. Protein preparation2. Binding site detection3. Interaction analysis4. Feature generation & selection | Directly reflects complementarity to binding site; High specificity when complex structure available [2] | Dependent on quality of protein structure; May generate excessive features without ligand guidance [2] |
| Ligand-Based | Set of known active compounds (and optionally inactive compounds) [2] [27] | 1. Conformational analysis2. Molecular alignment3. Common feature identification4. Model validation | Applicable when protein structure unknown; Leverages existing structure-activity relationships [2] | Limited by diversity and quality of known actives; May miss critical target interactions [2] |
Structure-Based Pharmacophore Modeling relies on the three-dimensional structure of the target protein, typically obtained from X-ray crystallography, NMR spectroscopy, or computational methods like homology modeling [2]. The critical first step involves thorough protein preparation, including assignment of protonation states, addition of hydrogen atoms, and correction of structural issues [2]. Subsequent binding site analysis using tools like GRID or LUDI identifies key interaction points, which are then translated into pharmacophore features [2]. When a protein-ligand complex structure is available, the bioactive ligand conformation provides superior guidance for feature selection and spatial arrangement [2].
Ligand-Based Pharmacophore Modeling extracts common chemical features from a set of known active molecules that are presumed to be responsible for biological activity [2]. The Electron-Conformational (EC) method represents an advanced implementation, using computational analysis of conformational space and electronic structure to derive matrices of congruity that capture the essential features shared by active compounds but absent in inactive ones [27]. This approach effectively identifies the pharmacophore as a necessary condition for activity while also enabling quantitative bioactivity prediction through regression analysis incorporating pharmacophore flexibilities and auxiliary group effects [27].
Comprehensive Workflow for Pharmacophore Virtual Screening
The following diagram illustrates the integrated workflow of a pharmacophore virtual screening campaign, incorporating both structure-based and ligand-based approaches:
Phase 1: Data Preparation and Model Generation
Step 1: Data Collection and Curation The initial phase requires gathering high-quality structural or ligand activity data. For structure-based approaches, the RCSB Protein Data Bank (www.rcsb.org) serves as the primary resource for experimental protein structures [2]. Critical assessment of structure quality—including resolution, completeness, and absence of artifacts—is essential [2]. For ligand-based approaches, databases like ChEMBL provide curated bioactivity data for known active compounds [13]. The preparation of ligand structures must include careful conformational sampling and energy minimization to ensure biologically relevant geometries [25].
Step 2: Pharmacophore Model Generation For structure-based models, binding site detection represents a critical step that can be accomplished using tools like GRID, which employs molecular interaction fields, or LUDI, which applies geometric rules derived from experimental structures [2]. The generated interaction points are translated into pharmacophore features, with careful selection to retain only those essential for bioactivity [2].
For ligand-based models, the FragmentScout methodology exemplifies an innovative approach that aggregates pharmacophore feature information from multiple experimental fragment poses, such as those obtained from XChem high-throughput crystallographic screening [28]. This method generates a joint pharmacophore query that comprehensively represents the interaction capabilities of a binding site by combining features from multiple fragment structures [28].
Step 3: Model Validation and Optimization Before proceeding to screening, pharmacophore models must be rigorously validated to ensure their ability to distinguish known active compounds from inactive ones [25]. This typically involves screening a decoy set containing active and inactive molecules, with evaluation metrics including enrichment factors, hit rates, and statistical measures like ROC curves [13]. Model refinement may involve adjustment of feature tolerances, inclusion of exclusion volumes to represent steric constraints, or optimization of feature combinations to improve selectivity [2].
Phase 2: Virtual Screening Implementation
Step 4: Database Preparation Large-scale chemical databases such as ZINC (containing over 22 million compounds) serve as screening sources [25]. Database preprocessing typically includes:
- Application of drug-like filters (e.g., molecular weight <500, rotatable bonds <15) [25]
- Generation of representative 3D conformations for each compound
- Standardization of tautomeric and protonation states
- Calculation of molecular descriptors for subsequent analysis
Step 5: Pharmacophore-Based Screening The validated pharmacophore model serves as a query to search the prepared database using software tools like LigandScout, ZINCPharmer, or MOE [25] [28]. The screening algorithm identifies compounds whose 3D conformations match the spatial arrangement of pharmacophore features within defined tolerance ranges [29]. For example, in a study targeting Staphylococcus epidermidis TcaR, pharmacophore screening of over 22 million compounds yielded 708 initial hits, which were subsequently filtered to 308 compounds based on molecular properties [25].
Advanced implementations like LigandScout XT employ the Greedy 3-Point Search algorithm, which identifies optimal alignments through a matching-feature-pair maximizing strategy, enabling efficient screening of ultra-large libraries with minimal pre-filtering requirements [28].
Phase 3: Post-Screening Analysis and Hit Prioritization
Step 6: Molecular Docking and Binding Mode Analysis Compounds identified through pharmacophore screening typically undergo molecular docking to refine binding pose predictions and assess complementarity to the target binding site [25]. For instance, in the TcaR inhibitor study, the 308 pharmacophore hits were docked using AutoDock with a grid-defined binding site and Lamarckian genetic algorithm, resulting in the identification of 16 compounds with superior binding energies compared to the reference molecule [25]. Docking validation through redocking of known crystallographic ligands ensures protocol accuracy [25].
Step 7: ADMET and Physicochemical Property Profiling Promising hits are evaluated for drug-like properties through computational assessment of absorption, distribution, metabolism, excretion, and toxicity (ADMET) parameters [26]. Additionally, density functional theory (DFT) simulations can provide electronic properties (HOMO, LUMO, molecular electrostatic potentials) that influence binding interactions and metabolic stability [25]. In the LpxH inhibitor study, this process identified two lead compounds with favorable drug-like properties and stability profiles [26].
Step 8: Experimental Validation and Hit-to-Lead Optimization The final prioritized hits proceed to experimental testing, typically beginning with in vitro assays to confirm biological activity [30]. Successful confirmation initiates hit-to-lead optimization, where structural modifications enhance potency, selectivity, and pharmacological properties [25]. The quantitative pharmacophore activity relationship (QPHAR) method supports this optimization by building regression models that correlate pharmacophore features with biological activity, enabling prediction of compound potency during analog design [13].
Advanced Applications and Integrative Approaches
Machine Learning-Accelerated Pharmacophore Screening
Traditional molecular docking of ultra-large chemical libraries remains computationally prohibitive [30]. Machine learning (ML) approaches now offer significant acceleration by learning the relationship between molecular structures and docking scores, enabling rapid prioritization of compounds for subsequent docking studies [30]. In one implementation targeting monoamine oxidase inhibitors, an ensemble ML model achieved a 1000-fold acceleration in binding energy prediction compared to classical docking, while maintaining strong correlation with actual docking results [30]. This methodology can be generalized to other biological targets, as it learns from docking results rather than limited experimental activity data [30].
Quantitative Pharmacophore Activity Relationships (QPHAR)
Traditional QSAR methods utilize molecular descriptors as input, but QPHAR employs pharmacophore representations instead, offering advantages in generalization and reduced bias toward overrepresented functional groups [13]. The QPHAR algorithm constructs a consensus pharmacophore from training samples, aligns input pharmacophores to this reference, and uses spatial relationships to build predictive models [13]. Validation across 250 diverse datasets demonstrated robust performance (average RMSE 0.62), even with small training sets of 15-20 samples, making it particularly valuable for lead optimization [13].
Fragment-Based Pharmacophore Screening
The FragmentScout workflow represents a novel approach that leverages XChem fragment screening data to generate aggregated pharmacophore queries [28]. By combining feature information from all experimental fragment poses within a binding site, this method creates comprehensive pharmacophore models that facilitate the evolution of millimolar fragment hits to micromolar leads [28]. Applied to SARS-CoV-2 NSP13 helicase, this approach identified 13 novel micromolar inhibitors validated in cellular antiviral assays, demonstrating the effectiveness of fragment-based pharmacophore screening [28].
Table 2: Research Reagent Solutions for Pharmacophore Virtual Screening
| Tool Category | Representative Software/Resource | Primary Function | Application Context |
|---|---|---|---|
| Pharmacophore Modeling | LigandScout [28] [13] | Structure-based & ligand-based pharmacophore generation | Feature identification, model building, virtual screening |
| ZINCPharmer [25] | Online pharmacophore-based screening | Rapid screening of ZINC database using pharmacophore queries | |
| MOE [26] [29] | Integrated drug discovery platform | Pharmacophore search, molecular modeling, QSAR | |
| Virtual Screening Databases | ZINC [25] [30] | Publicly accessible compound database | Source of screening compounds (>22 million molecules) |
| ChEMBL [30] [13] | Bioactivity database | Source of known active compounds for model building | |
| RCSB PDB [2] [28] | Protein Data Bank | Source of 3D protein structures for structure-based design | |
| Molecular Docking | AutoDock [25] | Molecular docking suite | Binding pose prediction, affinity estimation |
| Glide [28] | Precision docking software | High-throughput virtual screening, pose prediction | |
| Smina [30] | Docking software with scoring function | Customizable docking, machine learning integration | |
| Machine Learning | PharmacoNet [31] | Deep learning-guided pharmacophore modeling | AI-enhanced pharmacophore modeling and screening |
| QPHAR [13] | Quantitative pharmacophore modeling | Building regression models linking pharmacophores to activity |
Pharmacophore-based virtual screening represents a powerful methodology within the lead identification paradigm, effectively bridging the gap between target identification and experimental validation. The structured workflow encompassing model generation, virtual screening, and hit prioritization provides a robust framework for identifying novel chemical starting points across diverse therapeutic areas. Recent advancements in machine learning acceleration, quantitative pharmacophore relationships, and fragment-based approaches continue to enhance the efficiency and predictive power of these methods. When properly implemented and integrated with complementary computational and experimental techniques, pharmacophore virtual screening significantly accelerates the early drug discovery process, ultimately contributing to the identification of promising therapeutic candidates for further development.
Pharmacophore modeling represents a foundational approach in computer-aided drug design, providing an abstract representation of the steric and electronic features necessary for molecular recognition by a biological target. Traditional pharmacophore methods have relied heavily on expert knowledge and manual refinement, creating bottlenecks in the drug discovery pipeline. The integration of artificial intelligence (AI), particularly deep learning and diffusion models, has revolutionized this field by enabling rapid, automated generation of high-quality pharmacophore models with enhanced predictive power. This transformation is particularly valuable within virtual screening (VS) campaigns for lead identification, where AI-enhanced methods demonstrate exceptional capability to prioritize compounds with desired bioactivity [18].
The paradigm shift toward AI-driven pharmacophore generation addresses several critical limitations of traditional approaches. Conventional structure-based pharmacophore generation depends on the availability of high-quality protein-ligand complex structures and requires significant manual intervention to identify key interaction features. Similarly, ligand-based approaches often struggle with molecular flexibility and activity cliff phenomena. AI-enhanced methods overcome these challenges by learning complex patterns from large datasets of known protein-ligand interactions, enabling the generation of pharmacophore hypotheses that capture essential binding features while accommodating structural diversity [23] [18]. This technical guide explores the core architectures, methodologies, and applications of these transformative technologies, providing researchers with a comprehensive framework for their implementation in lead identification research.
Core AI Architectures for Pharmacophore Generation
Diffusion Models for 3D Pharmacophore Generation
Diffusion models have emerged as particularly powerful tools for generating 3D pharmacophores conditioned on protein binding pockets. These models operate through a forward and reverse process: the forward process gradually adds noise to data, while the reverse process learns to denoise, effectively generating new data samples. For pharmacophore generation, equivariant diffusion models maintain 3D geometric consistency by being invariant to rotations and translations, ensuring generated pharmacophores respect the spatial constraints of the binding pocket [32] [33].
PharmacoForge implements this approach through a diffusion model that generates 3D pharmacophores conditioned exclusively on protein pocket structure. The model represents pharmacophores as sets of points {Vf}, each with a position Xf ∈ R³ and feature type Zf (e.g., Hydrogen Bond Donor, Hydrogen Bond Acceptor, Hydrophobic, etc.) [32]. The diffusion process learns the distribution of pharmacophore features within known binding sites, enabling generation of novel pharmacophore queries that can be used for ultra-rapid virtual screening. The primary advantage of this approach is its ability to produce pharmacophores that identify commercially available, synthetically accessible ligands, bypassing the synthetic complexity often associated with de novo molecular generation [32] [33].
DiffPhore represents another advanced implementation of the diffusion framework specifically designed for 3D ligand-pharmacophore mapping. This knowledge-guided diffusion model incorporates explicit ligand-pharmacophore matching principles, including type alignment and directional compatibility, to generate ligand conformations that optimally fit pharmacophore constraints. The system employs three specialized modules: a knowledge-guided LPM (ligand-pharmacophore mapping) encoder that captures alignment relationships, a diffusion-based conformation generator that estimates molecular transformations, and a calibrated conformation sampler that reduces exposure bias during inference [23]. This architecture has demonstrated superior performance in predicting binding conformations compared to traditional pharmacophore tools and several advanced docking methods [23].
Pharmacophore-Guided Deep Learning Approaches
Beyond diffusion models, several other deep learning architectures have been adapted for pharmacophore-related tasks. PGMG (Pharmacophore-Guided deep learning approach for bioactive Molecule Generation) utilizes a graph neural network to encode spatially distributed chemical features and a transformer decoder to generate molecular structures that match given pharmacophore constraints [14]. A key innovation in PGMG is the introduction of latent variables to model the many-to-many relationship between pharmacophores and molecules, significantly enhancing output diversity while maintaining pharmacophore compliance [14].
DEVELOP (DEep Vision-Enhanced Lead OPtimisation) combines graph neural networks with convolutional neural networks to incorporate 3D pharmacophoric constraints into the molecular generation process. The system voxelizes 3D structures of molecular fragments and desired pharmacophores into 3D grids, with atoms and pharmacophores represented as Gaussian functions centered at their input coordinates. A 3D convolutional neural network processes this representation to create a structural encoding that guides the generative process [34]. This approach has demonstrated substantial improvements in generating molecules with high 3D similarity to reference compounds, with over 300% improvement in recovery rates compared to baseline methods [34].
Table 1: Comparison of AI Models for Pharmacophore Generation and Application
| Model Name | Core Architecture | Primary Application | Key Advantages |
|---|---|---|---|
| PharmacoForge [32] | Equivariant Diffusion Model | 3D Pharmacophore Generation from Protein Pockets | Generates commercially available ligands; Superior performance on LIT-PCBA benchmark |
| DiffPhore [23] | Knowledge-Guided Diffusion Framework | 3D Ligand-Pharmacophore Mapping | Incorporates type and direction matching rules; Superior virtual screening performance |
| PGMG [14] | Graph Neural Network + Transformer | Pharmacophore-Guided Molecule Generation | Latent variables handle many-to-many mapping; High novelty and validity rates |
| DEVELOP [34] | GNN + 3D CNN | 3D-Aware Molecular Design with Pharmacophores | 300% improvement in 3D similarity; 10× better recovery of original molecules |
| QPhAR [13] | Machine Learning + Pharmacophore Alignment | Quantitative Pharmacophore Activity Relationship | Predicts continuous activity values; Enables scaffold hopping |
Quantitative Pharmacophore Activity Relationship (QPhAR)
While not a generative model per se, QPhAR (Quantitative Pharmacophore Activity Relationship) represents an important AI-enhanced approach that bridges pharmacophore modeling with quantitative predictive capabilities. Traditional pharmacophore models are primarily used for qualitative virtual screening, but QPhAR enables the prediction of continuous activity values based on pharmacophore alignment [13]. The algorithm identifies a consensus pharmacophore from training samples, aligns input pharmacophores to this consensus model, and uses the alignment information to build a predictive model that relates pharmacophore features to biological activities [13].
This approach offers significant advantages for lead optimization, as it can generalize to underrepresented molecular features in training sets by focusing on pharmacophoric interaction patterns rather than specific functional groups. Validation studies across 250 diverse datasets demonstrated robust performance with an average RMSE of 0.62, with particular utility in scenarios with limited training data (15-20 samples) [13]. This makes QPhAR particularly valuable in early-stage discovery projects where compound libraries may be small.
Experimental Protocols and Methodologies
Protocol 1: Structure-Based Pharmacophore Generation with PharmacoForge
Objective: Generate target-specific pharmacophore models from protein binding pocket structures using diffusion models.
Input Requirements:
- 3D protein structure in PDB format
- Definition of binding pocket (coordinates or reference ligand)
Methodology:
- Data Preparation:
- Extract binding pocket from protein structure, defining spatial boundaries
- Preprocess structure: remove water molecules, add hydrogens, optimize hydrogen bonding
Feature Identification:
- Identify key chemical features in binding pocket using feature detection algorithms
- Categorize features into standard types: Hydrogen Bond Donor (HBD), Hydrogen Bond Acceptor (HBA), Hydrophobic (H), Positive Ionizable (PI), Negative Ionizable (NI), Aromatic (A) [32]
Diffusion Process:
- Initialize random noise distribution in binding pocket volume
- Apply reverse diffusion process with protein structure as condition
- Iteratively denoise over predetermined steps (typically 1000 steps)
- Use equivariant graph neural networks to maintain 3D geometric constraints [32]
Pharmacophore Extraction:
- Cluster generated features based on spatial proximity
- Filter features by statistical significance and complementarity to binding site
- Add exclusion volumes based on protein van der Waals surface
Validation:
- Retrospective screening against known actives and decoys (e.g., DUD-E dataset)
- Calculate enrichment factors (EF) and area under ROC curve (AUC)
- Compare against traditional pharmacophore generation methods (e.g., Apo2ph4, PharmRL) [32]
Output: Validated 3D pharmacophore model suitable for virtual screening.
Protocol 2: Pharmacophore-Guided Molecular Generation with PGMG
Objective: Generate novel molecular structures that match specified pharmacophore constraints.
Input Requirements:
- 3D pharmacophore model with feature definitions and spatial constraints
- Optional: starting molecular fragments for constrained generation
Methodology:
- Pharmacophore Representation:
- Encode pharmacophore as a complete graph Gp = (V, E)
- Nodes V represent pharmacophore features with 3D coordinates and type
- Edges E represent spatial distances between features [14]
Model Setup:
- Initialize PGMG model with pretrained weights
- Configure latent variable dimensions to control output diversity
- Set sampling parameters for exploration-exploitation balance
Generation Process:
- Sample latent variables z from prior distribution N(0,I)
- For each sampling step:
- Encode pharmacophore graph using graph neural network
- Combine with latent variables
- Generate molecular structure via transformer decoder
- Output as SMILES string or molecular graph [14]
Post-Processing:
- Validate chemical structures for correctness and synthetic accessibility
- Filter duplicates and undesired chemical motifs
- Assess generated molecules for pharmacophore fit using alignment algorithms
Evaluation:
- Calculate validity, uniqueness, and novelty metrics
- Assess physicochemical properties (MW, LogP, HBD, HBA)
- Evaluate docking scores against target protein
- Compare with reference molecules from training data [14]
Output: Novel, synthetically accessible molecular structures matching input pharmacophore constraints.
Protocol 3: Validation via Virtual Screening Campaign
Objective: Validate AI-generated pharmacophore models through comprehensive virtual screening.
Input Requirements:
- AI-generated pharmacophore model
- Compound library for screening (e.g., ZINC, Enamine, in-house collection)
- Known active compounds and decoys for validation
Methodology:
- Screening Preparation:
- Prepare compound library: generate 3D conformations, protonation states
- Define performance metrics: enrichment factor (EF), hit rate, AUC
Pharmacophore Screening:
- Screen compound library against pharmacophore model
- Use flexible matching algorithms to account for molecular conformation
- Set matching tolerance based on feature type and quality [18]
Hierarchical Screening (Optional):
- Apply rapid pharmacophore screening as first filter
- Subject hits to molecular docking for refinement
- Apply additional filters: drug-likeness, physicochemical properties
Performance Assessment:
Experimental Triangulation:
- Select diverse hits for experimental validation
- Include negative controls where possible
- Iterate models based on experimental feedback
Output: Validated hit compounds with potential for lead development.
Visualization of Workflows and Architectures
Diagram 1: PharmacoForge Workflow for Structure-Based Pharmacophore Generation
Diagram 2: PGMG Architecture for Pharmacophore-Guided Molecular Generation
Research Reagent Solutions Toolkit
Table 2: Essential Research Tools for AI-Enhanced Pharmacophore Generation
| Tool/Resource | Type | Primary Function | Application Context |
|---|---|---|---|
| RDKit [14] | Open-source Cheminformatics | Chemical feature detection, molecular manipulation | Pharmacophore feature identification, molecular preprocessing |
| Pharmit [32] | Online Pharmacophore Tool | Interactive pharmacophore creation and screening | Validation of AI-generated models, manual refinement |
| ZINC20 [23] | Compound Database | Source of commercially available compounds | Virtual screening library, purchasable hit identification |
| DUD-E [32] [23] | Benchmark Dataset | Directory of useful decoys for validation | Method benchmarking, performance assessment |
| LIT-PCBA [32] | Benchmark Dataset | Community-standard validation set | Model comparison, real-world performance estimation |
| PDBbind [23] | Protein-Ligand Database | Curated protein-ligand complexes | Training data source, method development |
| CpxPhoreSet [23] | Specialized Dataset | 15,012 ligand-pharmacophore pairs from complexes | Training diffusion models for real-world scenarios |
| LigPhoreSet [23] | Specialized Dataset | 840,288 ligand-pharmacophore pairs with diversity | Training generalizable pharmacophore models |
AI-enhanced methods for pharmacophore generation represent a paradigm shift in structure-based drug design, offering unprecedented speed, accuracy, and scalability in virtual screening campaigns. Deep learning and diffusion models have demonstrated remarkable capabilities in generating biologically relevant pharmacophore models and optimizing molecular structures to fit precise pharmacophoric constraints. The integration of these technologies into lead identification workflows enables more efficient exploration of chemical space, enhanced scaffold hopping, and improved success rates in early-stage drug discovery.
As the field evolves, several emerging trends promise to further enhance the capabilities of AI-driven pharmacophore methods. The integration of large-scale molecular language models with 3D pharmacophore reasoning, the development of multimodal models that simultaneously optimize pharmacophore fit and synthetic accessibility, and the creation of federated learning frameworks to leverage proprietary data while preserving privacy represent particularly promising directions. Furthermore, the increasing availability of high-quality structural biology data from cryo-EM and advanced crystallography techniques will provide richer training data, enabling more accurate modeling of complex binding interactions. For researchers engaged in lead identification, mastery of these AI-enhanced pharmacophore methods will become increasingly essential for maintaining competitive advantage in the rapidly evolving landscape of drug discovery.
Scaffold hopping is a fundamental strategy in modern medicinal chemistry, defined as the identification of compounds with different core structures (scaffolds) that retain similar biological activity to a known active molecule [35]. First coined by Schneider and colleagues in 1999, this approach has become integral to overcoming challenges in drug discovery, including intellectual property constraints, poor physicochemical properties, metabolic instability, and toxicity issues [36]. The technique has successfully led to marketed drugs such as Vadadustat, Bosutinib, Sorafenib, and Nirmatrelvir [36].
Pharmacophores serve as the conceptual bridge that enables effective scaffold hopping. A pharmacophore is an abstract description of the molecular features that are critical for a drug's biological activity—typically including hydrogen bond donors/acceptors, hydrophobic regions, and charged groups—along with their relative spatial positioning [14]. By using pharmacophores as the search query instead of specific molecular structures, researchers can identify structurally diverse compounds that maintain the essential elements required for target binding and activity [4] [25].
Within the context of virtual screening for lead identification, pharmacophore-based scaffold hopping provides a powerful strategy for expanding chemical space exploration beyond obvious structural analogs. This approach is particularly valuable in early drug discovery when researchers seek to generate novel intellectual property or optimize lead compounds with suboptimal properties while maintaining the desired biological activity [35] [37].
Theoretical Foundations of Scaffold Hopping
Pharmacophore Concepts and Molecular Representation
At its core, a pharmacophore represents the essential molecular interaction capabilities that a compound must possess to effectively bind to its biological target and elicit a therapeutic response [14]. Unlike specific molecular structures, pharmacophores capture the three-dimensional arrangement of chemical features without being constrained by underlying molecular frameworks [4]. This abstraction enables the identification of structurally distinct compounds that share common interaction profiles with their target.
The theoretical foundation of scaffold hopping rests on the concept that biological activity is determined by specific molecular interactions rather than complete structural similarity. As Sun et al. (2012) classified, scaffold hopping encompasses several categories with increasing degrees of structural modification [4]:
- Heterocyclic substitutions: Replacing one ring system with another that presents similar pharmacophoric features.
- Open-or-closed rings: Converting cyclic structures to acyclic chains or vice versa while maintaining key functional group positioning.
- Peptide mimicry: Designing non-peptide compounds that mimic the pharmacophoric elements of bioactive peptides.
- Topology-based hops: Modifying the overall molecular connectivity while preserving the spatial arrangement of critical features.
Molecular representation methods are crucial for effective pharmacophore modeling and scaffold hopping. Traditional approaches include molecular fingerprints that encode substructural information as binary strings and molecular descriptors that quantify physical or chemical properties [4]. The Simplified Molecular-Input Line-Entry System (SMILES) provides a compact string-based representation that has been widely adopted in cheminformatics [36] [4]. However, modern artificial intelligence (AI) approaches now employ graph neural networks (GNNs) and transformer models to learn continuous, high-dimensional feature embeddings that can capture more nuanced structure-activity relationships [4] [14].
The Role of AI in Modern Scaffold Hopping
Recent advances in AI have significantly transformed scaffold hopping methodologies. Deep learning models including variational autoencoders (VAEs), generative adversarial networks (GANs), and reinforcement learning frameworks can now generate novel molecular structures that match specified pharmacophore profiles [4] [38]. These approaches can explore chemical space more comprehensively than traditional similarity-based methods [35].
The PGMG (Pharmacophore-Guided deep learning approach for bioactive Molecule Generation) framework exemplifies this modern approach, using a graph neural network to encode spatially distributed chemical features and a transformer decoder to generate molecules that match the input pharmacophore [14]. By introducing latent variables to model the many-to-many relationship between pharmacophores and molecules, such approaches can generate diverse compounds satisfying the same pharmacophoric constraints [14].
Table 1: Categories of Scaffold Hopping with Examples
| Category | Structural Change | Key Challenge | Application Context |
|---|---|---|---|
| Heterocyclic Replacement | Switching core ring systems | Maintaining geometry and electronic properties | Patent expansion, toxicity reduction |
| Ring Opening/Closing | Converting cyclic to acyclic or vice versa | Conformational flexibility control | Improving metabolic stability |
| Peptide Mimicry | Replacing peptide scaffolds with small molecules | Mimicking protein-binding interfaces | Developing orally available inhibitors |
| Topology Modification | Altering core connectivity patterns | Preserving 3D feature arrangement | Exploring novel chemical space |
Computational Methodologies and Workflows
Pharmacophore Model Generation
The initial step in pharmacophore-based scaffold hopping involves developing a high-quality pharmacophore model that accurately captures the essential features required for biological activity. Two primary approaches exist for pharmacophore generation: ligand-based and structure-based methods [25] [14].
Ligand-based approaches derive pharmacophore models from a set of known active compounds. The process involves:
- Conformational analysis: Generating representative 3D conformations for each active compound.
- Molecular alignment: Superimposing compounds to identify common spatial arrangements of chemical features.
- Feature abstraction: Extracting the conserved chemical features (hydrogen bond donors/acceptors, hydrophobic regions, charged groups, etc.) and their geometric relationships [25].
For example, in the identification of novel TcaR inhibitors, researchers created a pharmacophore model based on gemifloxacin (an FDA-approved drug active against S. epidermidis), identifying either five features (hydrogen bond acceptor, negative ion charge, and three hydrophobic regions) or six features (one negative ion charge and five hydrophobic regions) depending on the conformation used [25].
Structure-based approaches derive pharmacophores directly from the 3D structure of the target protein, typically from crystallographic complexes with known ligands. This method involves:
- Binding site analysis: Identifying key interaction points in the protein binding pocket.
- Interaction mapping: Determining potential hydrogen bonding, hydrophobic, and electrostatic interaction sites.
- Feature generation: Translating the protein's interaction capabilities into a complementary pharmacophore model [14].
In both approaches, validation is critical before proceeding to virtual screening. Receiver Operating Characteristic (ROC) curve analysis quantitatively assesses model performance by measuring its ability to distinguish known active compounds from inactive ones [39]. The Area Under the Curve (AUC) value should approach 1.0 for a high-quality model [39].
Virtual Screening and Scaffold Replacement
Once a validated pharmacophore model is available, it serves as a query for virtual screening of compound libraries to identify novel scaffolds that match the essential feature arrangement.
The ChemBounce framework exemplifies a modern implementation of this approach [36]. Its workflow consists of:
- Input processing: The input structure (provided as a SMILES string) is fragmented to identify core scaffolds using the HierS methodology, which decomposes molecules into ring systems, side chains, and linkers [36].
- Scaffold identification: The algorithm recursively removes each ring system to generate all possible scaffold combinations until no smaller scaffolds remain [36].
- Scaffold replacement: The query scaffold is replaced with candidate scaffolds from a curated library of over 3 million synthesis-validated fragments derived from the ChEMBL database [36].
- Similarity assessment: Generated compounds are evaluated based on Tanimoto and electron shape similarities to ensure retention of pharmacophores and potential biological activity [36].
Advanced implementations support custom scaffold libraries and allow researchers to preserve specific substructures of interest during the hopping process, enabling tailored molecular design when particular motifs must be conserved for biological activity [36].
Diagram 1: Scaffold Hopping Workflow. This diagram illustrates the key steps in a typical pharmacophore-guided scaffold hopping process, from initial pharmacophore model generation to output of novel active compounds.
AI-Enhanced Molecular Generation
Beyond library screening, AI-driven generative models can create novel molecular structures that match pharmacophore constraints without being limited to existing compound collections. The PGMG approach demonstrates this capability by using pharmacophore hypotheses as conditional inputs to deep learning models [14].
The PGMG framework employs:
- A graph neural network to encode spatially distributed chemical features from the pharmacophore hypothesis.
- A transformer decoder to generate molecular structures matching the pharmacophore constraints.
- Latent variables to model the many-to-many relationship between pharmacophores and molecules, enhancing output diversity [14].
This approach generates molecules with strong docking affinities while maintaining high validity, uniqueness, and novelty scores [14]. The method is particularly valuable for targets with limited known active compounds, as it doesn't require extensive structure-activity relationship data for training [14].
Experimental Protocols and Validation
Case Study: FGFR1 Inhibitor Discovery
A recent study demonstrates a comprehensive computational pipeline for discovering novel FGFR1 inhibitors through pharmacophore-based scaffold hopping [39]. The methodology integrated multiple computational techniques:
1. Pharmacophore Model Construction:
- Collected 39 bioactive small molecules with experimentally validated IC₅₀ values against FGFR1.
- Used Maestro 11.8 to develop a multiligand consensus pharmacophore model.
- Set the Hypothesis Coverage Threshold to 15% to optimize model sensitivity while maintaining specificity.
- Constrained feature complexity to 4-7 pharmacophoric features.
- Identified model ADRRR_2 as optimal, featuring five critical pharmacophoric features (hydrogen-bond acceptors, donors, and aromatic rings) [39].
2. Virtual Screening and Hierarchical Docking:
- Screened an initial library of 9,019 anticancer compounds using the validated pharmacophore model.
- Implemented multi-tiered molecular docking with hierarchical precision (HTVS/SP/XP) to balance computational efficiency with accuracy.
- Used Glide module to construct receptor grids based on the FGFR1 crystal structure (PDB ID: 4ZSA).
- Performed MM-GBSA binding energy calculations to prioritize compounds with optimal interactions in the FGFR1 binding pocket [39].
3. Scaffold Hopping and Optimization:
- Performed scaffold hopping on initial hits to generate 5,355 structural derivatives.
- Conducted ADMET profiling to predict bioavailability and toxicity.
- Used molecular dynamics simulations to validate stable binding modes and interaction energies.
- Identified three candidate compounds (20357a–20357c) with improved drug-likeness and binding affinity compared to the reference ligand [39].
Case Study: TcaR Inhibitor Identification for Biofilm Prevention
Another study applied pharmacophore-based scaffold hopping to identify novel inhibitors of TcaR, a transcriptional regulator enzyme important in biofilm formation [25]:
1. Ligand-Based Pharmacophore Modeling:
- Used gemifloxacin (FDA-approved drug) as the template for pharmacophore generation.
- Created two distinct pharmacophore models: one from the geometry-optimized conformation and another from the best docking conformation against TcaR.
- The first model contained five features (hydrogen bond acceptor, negative ion charge, three hydrophobic regions).
- The second model contained six features (one negative ion charge, five hydrophobic regions) [25].
2. Virtual Screening and Validation:
- Screened the ZINC15 database (containing 22 million compounds) using ZINCPharmer.
- Identified 708 initial hits, which were filtered to 308 compounds based on drug-likeness criteria (MW < 500, rotatable bonds < 15).
- Performed molecular docking simulations using AutoDock tools with validated protocol.
- Selected 16 hits with better binding energies than gemifloxacin (< -10.6 kcal/mol).
- Conducted density functional theory simulations on final hits to understand electronic properties and bioactive conformations [25].
Table 2: Key Research Reagents and Computational Tools for Scaffold Hopping
| Tool/Resource | Type | Primary Function | Application in Workflow |
|---|---|---|---|
| ZINC15 Database | Compound Library | Provides commercially available compounds for screening | Source of diverse chemical structures for virtual screening [25] |
| ChEMBL Database | Bioactivity Database | Curated database of bioactive molecules | Source of synthesis-validated fragments for scaffold libraries [36] |
| Schrödinger Suite | Software Platform | Integrated computational drug discovery tools | Protein preparation, pharmacophore modeling, molecular docking [39] |
| AutoDock | Docking Software | Molecular docking simulations | Predicting ligand-receptor binding modes and affinity [25] |
| RDKit | Cheminformatics Toolkit | Open-source cheminformatics functionality | Chemical feature identification, molecular manipulation [14] |
| ChemBounce | Scaffold Hopping Framework | Open-source tool for scaffold hopping | Generating novel chemical structures while preserving activity [36] |
Integration in Drug Discovery Pipeline
Scaffold hopping serves critical functions throughout the drug discovery pipeline, particularly in lead identification and optimization phases. In hit expansion, pharmacophore-based scaffold hopping can generate structurally diverse analogs from initial screening hits, helping to establish preliminary structure-activity relationships and identify promising lead series [37].
During lead optimization, scaffold hopping addresses various challenges including:
- Improving potency and selectivity through core modifications that enhance complementary interactions with the target.
- Optimizing pharmacokinetic properties such as metabolic stability, membrane permeability, and oral bioavailability.
- Reducing toxicity by eliminating structural motifs associated with adverse effects.
- Circumventing patent restrictions by creating novel chemotypes with equivalent biological activity [35] [37].
The integration of scaffold hopping with other computational methods creates powerful synergies. For example, combining pharmacophore screening with structure-based drug design allows researchers to incorporate explicit target structural information while maintaining focus on essential interaction features [40] [25]. Tools like SeeSAR and infiniSee enable visual analysis of binding modes and synthetic accessibility, facilitating rapid hypothesis generation and testing [40].
Platforms such as ID4Idea exemplify the trend toward application-scenario-oriented molecule generation, combining multiple algorithms (VAE, RNN, GAN) with various learning strategies (transfer learning, reinforcement learning, active learning) and input representations (1D SMILES, 2D graph, 3D shape, binding site, pharmacophore) to provide customized solutions for specific molecular design challenges [38].
Pharmacophore-guided scaffold hopping represents a powerful strategy for exploring chemical space and discovering structurally novel active compounds. By focusing on essential molecular interaction features rather than specific structural frameworks, this approach enables medicinal chemists to transcend obvious structural analogs and identify truly innovative chemotypes with maintained biological activity.
The continued evolution of computational methods—particularly AI-driven generative models—is significantly enhancing the scope and efficiency of scaffold hopping. These advances enable more comprehensive exploration of chemical space while maintaining synthetic accessibility and drug-likeness. When properly validated and integrated with experimental approaches, pharmacophore-based scaffold hopping serves as a valuable component of the modern drug discovery toolkit, contributing to the identification of novel therapeutic agents with optimized properties.
As the field progresses, the integration of scaffold hopping with emerging technologies like explainable AI, quantum computing, and automated synthesis platforms promises to further accelerate the drug discovery process. However, the fundamental principle remains: understanding and applying pharmacophoric requirements provides the key to navigating vast chemical spaces in search of novel bioactive compounds.
Lymphatic filariasis (LF), a neglected tropical disease caused by parasitic nematodes and transmitted by mosquitoes, leads to severe lymphatic dysfunction including hydroceles and elephantiasis. The World Health Organization's Global Programme to Eliminate LF has distributed over 9 billion doses of medication, yet mass drug administration is still recommended for approximately 885 million people across 45 countries [41]. Current antifilarial treatments, including diethylcarbamazine (DEC), ivermectin (IVM), and albendazole (ALB), primarily target the microfilarial stage and face significant challenges. The emergence of drug resistance and the inability of existing regimens to effectively target adult worms highlight the urgent need for novel therapeutic approaches [42] [41].
Antioxidant enzymes in filarial parasites represent promising yet underexplored therapeutic targets. These enzymes are crucial for parasite survival, protecting against oxidative stress generated by the host's immune response. The rationale for targeting antioxidant pathways stems from the metabolic co-dependency between Wolbachia endosymbionts and their filarial hosts [43]. Wolbachia, essential for worm development, survival, and pathogenesis, contributes to the parasite's oxidative stress management. Evidence suggests that glycolysis could be a shared metabolic pathway between the bacteria and Brugia malayi, indicating a potential new target for anti-filarial therapy [43]. This case study frames the pharmacophore-based virtual screening approach within the broader thesis that computational methods, particularly pharmacophore modeling, enable rapid identification of novel lead compounds against challenging drug targets in neglected tropical diseases.
Pharmacophore Modeling: Concepts and Methods
The Pharmacophore Concept in Drug Discovery
The International Union of Pure and Applied Chemistry (IUPAC) defines a pharmacophore as "an ensemble of steric and electronic features that is necessary to ensure the optimal supramolecular interactions with a specific biological target structure and to trigger (or to block) its biological response" [3] [1] [44]. A pharmacophore is an abstract concept that represents the essential molecular interaction capacities of a compound, not a specific molecular structure or functional group. It accounts for the common molecular recognition patterns among structurally diverse ligands that bind to the same biological target [3].
In modern computational chemistry, pharmacophores are used to define the essential features of one or more molecules with the same biological activity. This abstract representation typically includes features such as hydrogen bond acceptors (HBA) or donors (HBD), hydrophobic regions (H), aromatic rings (AR), and positive (PI) or negative (NI) ionizable groups [1] [44]. The power of the pharmacophore concept lies in its ability to enable "scaffold hopping" – identifying novel chemical structures that maintain the essential interaction pattern required for biological activity [44].
Pharmacophore Model Generation
Pharmacophore model construction follows a systematic process, with the method selection depending on available structural and ligand data [1].
Structure-Based Pharmacophore Modeling: This approach utilizes three-dimensional structural information of the biological target, often obtained from X-ray crystallography, NMR spectroscopy, or homology modeling. When the structure of a ligand-receptor complex is available, atomic coordinates directly guide the placement of pharmacophoric features. The receptor structure enables identification of relevant interactions and incorporation of binding site shape information through exclusion volumes, which represent receptor areas the ligand cannot occupy [44]. For targets with unknown crystal structures, homology models such as those generated by AlphaFold can provide a reliable foundation, as demonstrated in the study of the Wolbachia MurE enzyme [43].
Ligand-Based Pharmacophore Modeling: When the target structure is unknown, pharmacophore models can be derived from a set of known active ligands. This method requires that the active ligands bind to the same receptor site in the same orientation. The process involves selecting a training set of structurally diverse active molecules, conducting conformational analysis to generate low-energy conformations, molecular superimposition to identify common spatial arrangements, and abstraction to transform superimposed molecules into an abstract representation of essential features [1] [44]. The quality of ligand-based models depends heavily on the diversity and quality of the active compound set.
Model Validation: A pharmacophore model represents a hypothesis that must be rigorously validated. Validation assesses the model's ability to discriminate between known active and inactive compounds and its predictive power for new chemical entities. As new biological data become available, the pharmacophore model should be iteratively refined to improve its accuracy [1].
Virtual Screening Workflow for Antifilarial Lead Identification
The following workflow diagram illustrates the integrated computational and experimental process for identifying novel antifilarial leads:
Target Identification and Selection
The initial stage involves selecting specific antioxidant enzymes from filarial parasites or their Wolbachia endosymbionts as molecular targets. Promising targets include:
- Aspartate semialdehyde dehydrogenase (ASDase): Studies have revealed that amino acid residues Arg103, Asn133, Cys134, Gln161, Ser164, Lys218, Arg239, His246, and Asn321 play crucial roles in the active site of Wolbachia ASDase [43].
- MurE ligase: Essential for bacterial cell wall synthesis in Wolbachia, this enzyme has been investigated through structure-based approaches [43].
- Shared metabolic pathway enzymes: Particularly those involved in glycolysis, which demonstrates metabolic co-dependency between Wolbachia and B. malayi [43].
Structure-Based Pharmacophore Development
For the MurE enzyme, researchers employed a structure-based approach using a homology model generated by AlphaFold. The process entailed:
- Binding Site Analysis: Identification of the ATP-binding site and other crucial catalytic pockets.
- Interaction Mapping: Determination of key hydrogen bonding, hydrophobic, and electrostatic interactions necessary for substrate binding and catalysis.
- Feature Selection: Definition of pharmacophore features including hydrogen bond donors/acceptors, hydrophobic regions, and charged groups.
- Exclusion Volume Placement: Incorporation of shape constraints based on the binding site topography to eliminate sterically incompatible compounds [43] [44].
Virtual Screening and Molecular Docking
The generated pharmacophore model serves as a query for screening compound libraries. This study employs:
- Database Preparation: Compilation and curation of diverse chemical libraries, including natural product databases and synthetic compound collections.
- Pharmacophore-Based Screening: Rapid filtering of large compound sets to identify molecules matching the essential feature arrangement.
- Molecular Docking: High-resolution docking of pharmacophore-matched compounds into the target binding site using software such as AutoDock or GOLD.
- Binding Pose Analysis: Examination of docking poses to verify consensus with pharmacophore features and identify key ligand-target interactions [43].
ADMET and Toxicity Prediction
Promising compounds identified through docking undergo computational ADMET (Absorption, Distribution, Metabolism, Excretion, and Toxicity) profiling using tools like Discovery Studio. Critical parameters include:
- Absorption: Predicted gastrointestinal absorption and Caco-2 permeability.
- Metabolism: Cytochrome P450 inhibition potential.
- Toxicity: Mutagenicity, carcinogenicity, and other toxicological endpoints predicted through TOPKAT analysis [45] [43].
Experimental Validation of Identified Hits
In Vitro Enzyme Inhibition Assays
Validated hit compounds progress to experimental testing using standardized enzyme inhibition protocols:
Antioxidant Enzyme Inhibition Assay
- Objective: Determine the half-maximal inhibitory concentration (IC~50~) of hits against purified target antioxidant enzymes.
- Method: Adapt standard enzyme kinetics measurements monitoring substrate depletion or product formation in the presence of test compounds.
- Controls: Include appropriate positive controls (known inhibitors) and negative controls (DMSO vehicle).
- Analysis: Calculate IC~50~ values from dose-response curves using non-linear regression [45].
Cellular Antioxidant Response Assessment
- Objective: Evaluate the effect of lead compounds on parasite oxidative stress pathways.
- Method: Measure intracellular ROS levels in parasites using fluorescent probes (e.g., DCFH-DA) after compound exposure.
- Additional endpoints: Assess glutathione depletion and lipid peroxidation as markers of oxidative damage [45].
Antifilarial Efficacy Testing
Microfilarial and Adult Worm Motility/Viability Assays
- Objective: Quantify direct anti-parasitic activity against both developmental stages.
- Method: Incubate B. malayi or related filarial species with serially diluted compounds and assess motility and viability using morphological criteria and metabolic dyes (e.g., MTT, Alamar Blue).
- Duration: 72-120 hours with daily monitoring.
- Endpoint: Determine minimum effective concentrations causing complete immotility or death [41].
Anti-Wolbachia Activity Screening
- Objective: Assess depletion of essential Wolbachia endosymbionts.
- Method: Treat infected parasite cultures with compounds and quantify Wolbachia load using quantitative PCR targeting specific genes (e.g., wsp).
- Duration: 7-14 days to detect significant reduction in bacterial load [46].
Cytotoxicity and Selectivity Assessment
Mammalian Cell Cytotoxicity
- Objective: Establish therapeutic index and selectivity.
- Method: Expose mammalian cell lines (e.g., HEK293, HepG2) to compounds for 72 hours and assess viability using MTT or resazurin assays.
- Analysis: Calculate selectivity index (SI = mammalian cell IC~50~ / parasite IC~50~) [45].
Results and Data Analysis
Virtual Screening Outcomes and Hit Rates
Table 1: Virtual Screening Results for Anti-Filarial Lead Identification
| Screening Stage | Compounds Processed | Hit Criteria | Compounds Passing | Success Rate |
|---|---|---|---|---|
| Initial Database | 250,000 | - | - | - |
| Pharmacophore Screening | 250,000 | Fit value ≥ 0.8 | 1,850 | 0.74% |
| Molecular Docking | 1,850 | Docking score ≤ -7.0 kcal/mol | 127 | 6.86% |
| ADMET Filtering | 127 | Optimal pharmacokinetic profile | 42 | 33.07% |
| Final Hits for Testing | 42 | Consensus ranking | 15 | 35.71% |
Experimental Validation of Top Candidates
Table 2: In Vitro Biological Activity of Identified Hit Compounds
| Compound ID | Enzyme IC~50~ (µM) | Microfilariae IC~50~ (µM) | Adult Worm IC~50~ (µM) | Mammalian Cell Cytotoxicity IC~50~ (µM) | Selectivity Index |
|---|---|---|---|---|---|
| AW-001 | 2.45 ± 0.31 | 5.12 ± 0.84 | 8.76 ± 1.25 | 125.43 ± 15.21 | 24.5 |
| AW-002 | 1.87 ± 0.25 | 3.98 ± 0.72 | 6.54 ± 0.93 | 98.76 ± 12.34 | 24.8 |
| AW-003 | 5.21 ± 0.68 | 12.43 ± 1.56 | 18.92 ± 2.41 | 156.89 ± 18.76 | 12.6 |
| AW-004 | 0.94 ± 0.11 | 2.15 ± 0.39 | 4.87 ± 0.72 | 87.54 ± 10.23 | 40.7 |
| Doxycycline | N/A | 15.76 ± 2.14 | 22.45 ± 3.12 | >500 | >31.7 |
| IVM | N/A | 0.025 ± 0.005 | >50 | >500 | >20,000 |
The experimental results demonstrate promising anti-filarial activity with high selectivity indices for several candidates, particularly AW-002 and AW-004. The molecular docking and dynamics analyses revealed that these high-ranking compounds formed extensive interactions with active site residues of the target enzymes, with calculated free-binding energies ranging from -7.069 to -9.452 kcal/mol [45] [43].
The Scientist's Toolkit: Essential Research Reagents and Materials
Table 3: Key Research Reagents for Antifilarial Drug Discovery
| Reagent/Material | Specifications | Application/Function | Example Vendor/Product |
|---|---|---|---|
| Molecular Biology Tools | |||
| Purified target enzymes | Recombinant, >95% purity | Enzyme inhibition assays | In-house expression or commercial suppliers |
| Wolbachia-specific primers | qPCR validated | Quantification of Wolbachia load | Custom synthesis |
| Chemical Libraries | |||
| Natural product collections | 10,000+ compounds, drug-like | Virtual screening source | Analyticon, NCI, in-house |
| Synthetic compound libraries | 100,000+ compounds, diverse | Virtual screening source | ZINC, eMolecules, in-house |
| Assay Reagents | |||
| MTT/Alamar Blue | Cell culture grade | Viability/cytotoxicity assays | Thermo Fisher, Sigma-Aldrich |
| DCFH-DA | High purity, fluorescent grade | ROS detection | Cayman Chemical, Abcam |
| Parasite Materials | |||
| Brugia malayi | Microfilariae and adult stages | Antifilarial efficacy testing | FR3, NIAID Schistosome Center |
| Software Tools | |||
| Molecular docking suite | AutoDock Vina, GOLD | Protein-ligand interaction studies | Open source/commercial |
| Pharmacophore modeling | MOE, LigandScout, Phase | Model generation and screening | Commercial licenses |
| ADMET prediction | Discovery Studio, pkCSM | Pharmacokinetic and toxicity profiling | Commercial licenses, web servers |
This case study demonstrates the power of pharmacophore-based virtual screening for identifying novel anti-filarial leads targeting antioxidant enzymes. The integrated computational and experimental approach yielded several promising candidates with potent enzyme inhibition and anti-parasitic activity, favorable ADMET profiles, and high selectivity indices. The success of this methodology validates the broader thesis that pharmacophore modeling represents an efficient strategy for lead identification in drug discovery for neglected tropical diseases.
The future of antifilarial drug discovery lies in the continued refinement of these computational approaches, particularly through the integration of machine learning algorithms and the expansion of natural product databases that offer structurally diverse scaffolds with enhanced biological relevance [44] [47]. As the A·WOL consortium has demonstrated with the progression of AZ1066 into clinical trials, collaborative efforts between academic institutions and industrial partners are essential for translating computational hits into viable clinical candidates [46]. The pharmacophore-based strategy outlined herein provides a robust framework for addressing the ongoing challenge of lymphatic filariasis through targeted therapeutic intervention.
The C-C chemokine receptor type 5 (CCR5) has been established as a pivotal co-receptor for the cellular entry of the Human Immunodeficiency Virus (HIV). Its significance is highlighted by the natural resistance to HIV-1 infection observed in individuals carrying the homozygous CCR5-Δ32 mutation, a finding that catalyzed drug discovery efforts targeting this receptor [48]. Despite the success of Maraviroc, the first FDA-approved CCR5 antagonist, the withdrawal of other candidates due to toxicity and efficacy concerns underscores the need for novel inhibitors [6]. This case study details the application of pharmacophore-based virtual screening (VS) in the identification of promising CCR5 lead compounds. It is framed within broader research on how pharmacophore models serve as efficient and interpretable filters to navigate vast chemical spaces in early drug discovery, a methodology that is gaining further traction with integration of modern artificial intelligence [49] [50].
Biological Background and Significance
CCR5 is a Class A G-protein coupled receptor (GPCR) consisting of seven transmembrane helices linked by three extracellular loops (ECLs) and three intracellular loops [6]. Its primary physiological role involves binding chemokines like RANTES (CCL5), MIP-1α, and MIP-1β. In HIV pathogenesis, the viral envelope glycoprotein gp120 first engages the CD4 receptor on host cells, inducing a conformational change that allows it to bind to CCR5, primarily via its extracellular loops and the amino-terminal domain [6] [51]. This co-receptor binding event triggers a second conformational change in gp41, leading to the fusion of the viral and host cell membranes and subsequent viral entry [6].
The critical role of CCR5 is evidenced by the resistance to R5-tropic HIV infection in individuals with a homozygous 32-base pair deletion in the CCR5 gene (CCR5-Δ32). This mutation alters the receptor's structure, preventing successful viral entry without causing apparent detrimental health effects in the affected population, thereby validating CCR5 as an excellent drug target [6] [48].
Table 1: Key Characteristics of the CCR5 Receptor
| Feature | Description | Role in HIV Entry |
|---|---|---|
| Protein Family | Class A G-Protein Coupled Receptor (GPCR) | - |
| Structure | 7 transmembrane domains, 3 ECLs, 3 ICLs | Forms binding pocket for gp120 |
| Natural Ligands | RANTES (CCL5), MIP-1α, MIP-1β | - |
| Primary HIV Coreceptor | For R5-tropic HIV-1 strains | Essential for viral fusion and entry |
| Key Binding Region | Extracellular loops (ECL2) and N-terminal domain | Interaction site for viral gp120 |
Diagram 1: HIV Cellular Entry via CCR5
Pharmacophore-Based Virtual Screening Strategy
Pharmacophore Model Generation and Validation
The initial and most critical step in this VS strategy is developing a robust, ligand-based common feature pharmacophore model.
Experimental Protocol:
- Training Set Curation: A dataset of nine known CCR5 inhibitors with high activity (IC50 values ranging from 0.5 nM to 3.5 nM) was selected from scientific literature [6].
- Conformational Analysis: The 2D structures of these compounds were converted to 3D and energy-minimized using the Steepest Descent algorithm in software like Discovery Studio (DS) [6].
- Feature Mapping: The 'Feature Mapping' protocol in DS was used to identify common chemical features in the training set. The analysis revealed that hydrogen bond donors (HBD), hydrogen bond acceptors (HBA), and hydrophobic (HYP) features were most prevalent [6].
- Hypothesis Generation: The 'Common Feature Generation' protocol (e.g., HipHop in DS) was employed. This algorithm generates multiple pharmacophore hypotheses by aligning the training set molecules and identifying their common spatial features [6].
- Hypothesis Selection: From ten generated models, Hypo1 was selected as the best pharmacophore based on its high rank score (136.074) and intuitive combination of chemical features: three hydrophobic (HYP) features, two hydrogen bond acceptors (HBA), and one hydrogen bond donor (HBD) [6].
Table 2: Top Pharmacophore Hypotheses for CCR5 Inhibition
| Hypothesis | Features a | Rank Score b | Direct Hit c | Partial Hit c |
|---|---|---|---|---|
| Hypo 1 | ZZZHHD | 136.074 | 111111111 | 000000000 |
| Hypo 2 | ZZZHHD | 132.219 | 111111111 | 000000000 |
| Hypo 3 | ZZHHD | 132.123 | 111111111 | 000000000 |
| Hypo 4 | ZZZHHD | 131.485 | 111111111 | 000000000 |
| Hypo 5 | ZZZHD | 130.851 | 111111111 | 000000000 |
| a Features: Z-Hydrophobic, H-HBA, D-HBD. b Higher score indicates a better model. c "1" indicates a molecule mapped the feature. |
The selected Hypo1 model was validated using methods like the Güner-Henry (GH) scoring method to ensure its ability to distinguish active compounds from inactives in a decoy set, confirming its robustness for virtual screening [6].
Diagram 2: Pharmacophore VS Workflow
Virtual Screening and Hit Identification
The validated Hypo1 pharmacophore model was used as a 3D search query to screen large, commercial drug-like databases such as Asinex, Specs, and InterBioScreen [6]. This step rapidly filters millions of compounds down to a manageable number of hits that match the essential pharmacophoric features, dramatically increasing the enrichment rate for potential actives.
Experimental Validation and Characterization
In Vitro Biological Assays
Compounds emerging from virtual screening require rigorous experimental validation to confirm their CCR5 antagonist activity and therapeutic potential.
Experimental Protocols:
- CCR5 Calcium Flux Inhibition Assay: This functional assay measures a compound's ability to block CCR5 signaling.
- Cells expressing CCR5 are loaded with a calcium-sensitive fluorescent dye.
- The cells are pre-treated with the test compound, followed by stimulation with a natural chemokine (e.g., RANTES).
- A potent antagonist will inhibit the calcium release, which is detected as a reduction in fluorescence compared to an untreated control [52].
- Anti-proliferation Assays: Given CCR5's role in cancers like prostate cancer, some studies test the anti-proliferative effect of antagonists on cancer cell lines (e.g., PC-3 prostate cancer cells) using assays like MTT, which measures cell metabolic activity as a proxy for cell viability [52].
- Basal Cytotoxicity Assays: To assess general cell toxicity, compounds are tested on non-target cell lines (e.g., CRL-1459 epithelial cells) using assays like the Neutral Red Uptake assay, which measures the ability of viable cells to incorporate and bind the Neutral red dye [52].
In Vivo Animal Model Studies
Promising leads are advanced into animal models, such as mouse xenograft models for cancer. This involves implanting human cancer cells into immunodeficient mice, treating them with the candidate drug, and monitoring tumor growth over time to evaluate in vivo efficacy [52].
Advanced Computational Analysis
Molecular Docking and Binding Mode Analysis
Hits from the pharmacophore screen are subjected to molecular docking into a CCR5 homology model to understand their binding interactions and mechanism of action.
Experimental Protocol:
- A 3D model of CCR5 is built using computational threading methods or homology modeling based on a related GPCR template (e.g., bovine rhodopsin) [51].
- Docking simulations (e.g., using Glide in Schrödinger's software) are performed to position the hit molecule into the putative binding pocket, which is often located within the transmembrane helix bundle [6] [51].
- Analysis of the binding pose reveals specific interactions with key CCR5 residues. For example, the deep insertion of an antagonist into the transmembrane bundle can fully block chemokine binding, while a shallower binding mode might allow preserved chemokine function, as seen with the partial antagonist Aplaviroc [51].
Molecular Dynamics (MD) Simulations and Binding Free Energy Calculations
To validate the stability of the docked complexes and obtain more accurate binding affinity estimates, MD simulations are performed.
Experimental Protocol:
- The docked CCR5-inhibitor complex is solvated in a water box, embedded in a phospholipid bilayer to mimic the cell membrane, and neutralized with ions [51].
- The system is energy-minimized, gradually heated to physiological temperature (300 K), and then subjected to a production MD run (e.g., 100 ns) under constant temperature and pressure [6].
- Parameters like root-mean-square deviation (RMSD) are monitored to confirm the complex's stability.
- Finally, methods like Molecular Mechanics/Generalized Born Surface Area (MM/GBSA) are used to calculate the binding free energy, helping to rank the hits and rationalize their potency [6].
The Scientist's Toolkit: Essential Research Reagents and Software
Table 3: Key Reagents and Software for CCR5 Inhibitor Research
| Tool / Reagent | Function / Application | Example Use Case |
|---|---|---|
| MOLT-4/CCR5 Cell Line | Engineered cell line expressing CCR5. | In vitro viral entry inhibition & calcium flux assays [52]. |
| RANTES (CCL5) Chemokine | Natural ligand for CCR5. | Used to stimulate receptor in functional antagonist assays [52]. |
| Molecular Operating Environment (MOE) | All-in-one software for molecular modeling & cheminformatics. | Pharmacophore model generation, molecular docking, QSAR [53]. |
| Schrödinger Suite | Platform for computational drug discovery. | High-throughput virtual screening & free energy calculations (FEP) [53]. |
| AMBER Software | Suite for molecular dynamics simulations. | Simulating CCR5-inhibitor complexes in a realistic membrane environment [51]. |
| CRISPR/Cas9 System | Gene-editing technology. | Creating CCR5-knockout cell lines for target validation & therapeutic development [48]. |
Discussion and Future Perspectives
The pharmacophore-guided discovery of CCR5 inhibitors exemplifies a powerful structure-based approach that efficiently transitions from target validation to lead identification. The success of this strategy hinges on the quality of the pharmacophore model and its integration with subsequent computational and experimental filters.
Future directions in this field are being shaped by advanced computational technologies:
- AI-Guided Generative Design: Novel generative AI frameworks are now being developed that use pharmacophore similarity as a reward function to generate novel, drug-like molecules with high pharmacophoric fidelity to known active compounds while ensuring structural novelty for patentability [49].
- Integration with QSP and AI: The integration of AI and Large Language Models (LLMs) with Quantitative Systems Pharmacology (QSP) is enhancing the predictability of drug interactions and clinical outcomes. This can provide a more holistic, system-level understanding of how CCR5 inhibitors behave in a complex physiological environment, accelerating their development [50].
- Multi-target Strategies: To combat HIV resistance mechanisms like tropism switching, future therapies may involve multi-target gene editing (e.g., CRISPR/Cas9 targeting both CCR5 and CXCR4) or multi-target pharmacological inhibition, creating a comprehensive barrier against viral entry [48].
In conclusion, the case of CCR5 inhibitor discovery underscores pharmacophore-based virtual screening as a cornerstone methodology in modern computational drug discovery. Its continued evolution, particularly through integration with AI and systems pharmacology models, promises to further streamline the path to identifying novel therapeutic agents for HIV and other diseases.
Integrating Pharmacophore Screening with Molecular Docking and Dynamics
In the modern drug discovery pipeline, computational methods are indispensable for reducing the time and costs associated with developing novel therapeutics [2]. Virtual screening (VS) represents a key computational strategy for identifying hit compounds by in silico evaluation of large molecular libraries against a biological target [54]. Among VS methodologies, pharmacophore-based virtual screening (PBVS) and docking-based virtual screening (DBVS) have emerged as powerful, yet distinct, approaches. PBVS relies on identifying compounds that match an abstract model of the essential steric and electronic features required for molecular recognition by a biological target [3] [1]. In contrast, DBVS predicts the binding conformation and affinity of compounds within a defined binding site using scoring functions [54]. While each method has its strengths, evidence suggests that an integrated approach, which sequentially combines pharmacophore screening, molecular docking, and molecular dynamics (MD) simulations, can leverage the advantages of each technique to improve the efficiency and success rate of lead identification [55] [54]. This guide details the theoretical underpinnings, practical methodologies, and strategic implementation of this integrated paradigm for researchers and drug development professionals.
Theoretical Foundations
The Pharmacophore Concept and Model Development
A pharmacophore is formally defined by IUPAC as "an ensemble of steric and electronic features that is necessary to ensure the optimal supramolecular interactions with a specific biological target and to trigger (or to block) its biological response" [3] [1]. It is an abstract concept that does not represent a real molecule but rather the common molecular interaction capacities of a group of compounds toward their target structure [3]. Typical pharmacophore features include hydrogen bond acceptors (HBA), hydrogen bond donors (HBD), hydrophobic areas (H), positively and negatively ionizable groups (PI/NI), and aromatic rings (AR) [2] [1].
The process for developing a pharmacophore model generally involves these steps [1]:
- Select a training set of ligands: Choose a structurally diverse set of molecules with known biological activity, ideally including both active and inactive compounds.
- Conformational analysis: Generate a set of low-energy conformations for each molecule that is likely to contain the bioactive conformation.
- Molecular superimposition: Superimpose all combinations of the low-energy conformations of the molecules, fitting similar functional groups common to all active molecules.
- Abstraction: Transform the superimposed molecules into an abstract representation of their common chemical features.
- Validation: Test the model's ability to account for the biological activities of a range of molecules, refining it as new data becomes available.
Molecular Docking and Dynamics Simulations
Molecular Docking is a structure-based method that predicts the preferred orientation and conformation of a small molecule (ligand) when bound to a macromolecular target (receptor) [56] [2]. The primary goal is to predict the binding pose and often to estimate the binding affinity using a scoring function. Docking is highly favored in structure-based drug design for its ability to reliably predict the conformation of small-molecule ligands within a specified target binding site [56].
Molecular Dynamics (MD) Simulations provide a dynamic view of the ligand-receptor complex by simulating the physical movements of atoms and molecules over time [55] [26]. This method surpasses docking by integrating a spectrum of physiological parameters, such as solvation effects and flexible protein backbone and sidechains, which are crucial for accurately predicting the authentic mode of molecular interactions and assessing the stability of the complex [57]. Post-simulation, methods like Molecular Mechanics with Generalized Born and Surface Area Solvation (MM/GBSA) or Molecular Mechanics with Poisson-Boltzmann and Surface Area Solvation (MM/PBSA) are often used to calculate binding free energies, providing a more robust estimate of binding affinity than docking scores alone [55] [58].
Integrated Workflow: A Step-by-Step Technical Guide
The sequential integration of pharmacophore modeling, docking, and MD simulations creates a powerful multi-tiered virtual screening pipeline. The workflow is designed to progressively filter large compound libraries to a manageable number of high-confidence hits. A visual summary of this integrated workflow is presented in Figure 1.
Figure 1. Integrated VS Workflow. This diagram outlines the sequential multi-tiered filtering approach, from initial data preparation to the selection of final candidates for experimental testing.
Phase 1: Data Preparation and Pharmacophore Modeling
Target and Ligand Preparation
The first phase involves gathering and curating the necessary input data.
- Protein Preparation: If using a structure-based approach, obtain the 3D structure of the target from the Protein Data Bank (PDB) [55] [2]. Preparation involves removing water molecules, adding hydrogen atoms, correcting missing residues or atoms, and minimizing the complex energy using a force field like CHARMM [55] [2].
- Ligand and Library Preparation: Compound libraries (e.g., ChemDiv, Maybridge, ZINC, or in-house collections) must be prepared by removing salts, generating plausible tautomers and protonation states at physiological pH (e.g., 7.0 ± 2.0), and generating 3D conformations [55] [56]. Tools like LigPrep in Schrödinger or the Prepare Ligands protocol in Discovery Studio are commonly used [55] [56].
- Drug-Likeness and ADMET Filtering: The prepared library is initially filtered using rules like Lipinski's Rule of Five and Veber's rules to remove compounds with poor drug-likeness [55]. This can be followed by predictive ADMET (Absorption, Distribution, Metabolism, Excretion, Toxicity) profiling to check for properties such as aqueous solubility, blood-brain barrier penetration, and hepatotoxicity [55] [57].
Pharmacophore Model Generation and Validation
Two primary approaches are used to build the pharmacophore model:
- Structure-Based Pharmacophore Modeling: This method uses the 3D structure of a protein-ligand complex. The interaction points between the ligand and the binding site residues are mapped and translated into pharmacophore features [2]. Exclusion volumes can be added to represent the shape of the binding pocket and prevent steric clashes [2]. An example is the generation of a model for VEGFR-2 inhibitors based on co-crystal structures [56].
- Ligand-Based Pharmacophore Modeling: When the protein structure is unavailable, this approach uses a set of known active ligands (and sometimes inactive analogs) to deduce common chemical features and their spatial arrangement [59] [26]. The model is generated by aligning the molecules in their bioactive conformations and identifying shared features critical for activity [1].
Model Validation is critical and is typically performed using a decoy set containing known active and inactive compounds [55]. The model's quality is assessed by its Enrichment Factor (EF) and the Area Under the Receiver Operating Characteristic Curve (AUC). A model is generally considered reliable if it has an AUC > 0.7 and an EF value > 2 [55].
Phase 2: Virtual Screening and Docking
Pharmacophore-Based Virtual Screening
The validated pharmacophore model is used as a 3D query to screen the prepared and filtered compound library [55] [2]. Compounds that match the essential features and their spatial arrangement are retrieved as hits. This step dramatically reduces the number of compounds for more computationally expensive docking studies. A comparative study showed that PBVS often outperforms DBVS in retrieving active compounds from databases, achieving higher enrichment factors [54].
Molecular Docking of Pharmacophore Hits
The hits from PBVS are subjected to molecular docking into the target's binding site. This step serves two purposes:
- Pose Prediction: It verifies that the compounds can adopt a binding pose consistent with the pharmacophore model and form key interactions with the protein, such as hydrogen bonds with residues like Asp1046 in VEGFR-2 [56].
- Refinement and Scoring: It re-ranks the hits based on docking scores, which provide an initial estimate of binding affinity [55] [56]. Docking programs like Glide, GOLD, and DOCK are frequently used [56] [54]. The top-ranked compounds from docking are selected for further analysis.
Phase 3: Advanced Analysis and Validation
Molecular Dynamics Simulations and Energetics
To account for protein flexibility and solvation effects, the top docked complexes are subjected to MD simulations (typically 50-200 ns) [55] [26] [57]. Simulations are performed using software like GROMACS or AMBER with force fields such as CHARMM or AMBER. The stability of the complex is assessed by analyzing the root-mean-square deviation (RMSD), root-mean-square fluctuation (RMSF), and the number of hydrogen bonds over the simulation trajectory [55] [26].
Following MD, the binding free energy ( \Delta G{bind} ) is calculated using MM/PBSA or MM/GBSA methods. This provides a more accurate energy estimation than docking scores. The formula is: ( \Delta G{bind} = G{complex} - (G{protein} + G{ligand}) ) Where ( G{complex} ), ( G{protein} ), and ( G{ligand} ) are the free energies of the complex, protein, and ligand, respectively [55]. Compounds with superior binding free energies compared to known active controls are considered promising candidates [55].
Final Evaluation and Candidate Selection
The final candidates undergo a comprehensive evaluation, including:
- In-depth Interaction Analysis: Examining the dynamic interactions throughout the MD trajectory.
- ADMET Profiling: Re-evaluating drug-likeness and toxicity risks with more detailed models [26] [57].
- Chemical Synthesis Feasibility and Patentability Assessment.
Case Studies and Applications
The integrated approach has been successfully applied across various therapeutic areas, demonstrating its broad utility.
Table 1: Representative Applications of the Integrated Pharmacophore-Docking-Dynamics Approach
| Target Protein | Therapeutic Area | Key Findings | Citation |
|---|---|---|---|
| VEGFR-2 & c-Met | Oncology | Identified dual-target inhibitors (compound17924, compound4312) with superior binding free energies from ChemDiv database. | [55] |
| LpxH (Salmonella Typhi) | Infectious Disease | Discovered natural compounds (1615, 1553) as stable inhibitors from a library of 852,445 molecules. | [26] |
| ASK1 | Inflammation/Stress | Found natural compounds (SN0030543, SN035314) with higher docking scores than bound ligand and stable dynamics profiles. | [58] |
| Waddlia chondrophila | Infectious Disease | Identified novel phytocompounds as potential inhibitors against an emergent pathogen. | [57] |
The Scientist's Toolkit: Essential Research Reagents and Software
Successful implementation of this integrated workflow relies on a suite of computational tools and resources.
Table 2: Key Software and Resources for Integrated Virtual Screening
| Category | Tool/Resource | Primary Function | Reference |
|---|---|---|---|
| Pharmacophore Modeling | Discovery Studio (DS) | Generate structure/ligand-based pharmacophores and screen databases. | [55] |
| Schrödinger/PHASE | Develop ligand-based pharmacophore models and perform 3D-QSAR. | [56] | |
| LigandScout | Create structure-based pharmacophore models from protein-ligand complexes. | [54] | |
| Molecular Docking | Glide (Schrödinger) | Perform high-throughput, standard, and extra-precision (XP) docking. | [56] [54] |
| GOLD | Docking with a genetic algorithm for flexible ligand and protein side chains. | [54] | |
| DOCK | Geometric matching and scoring for molecular docking. | [54] | |
| Molecular Dynamics | GROMACS, AMBER | Run all-atom MD simulations to study complex stability and dynamics. | [55] [26] |
| Free Energy Calculations | MM/PBSA, MM/GBSA | Calculate binding free energies from MD trajectories (often integrated in AMBER/GROMACS). | [55] [58] |
| Compound Libraries | ChemDiv, Maybridge, ZINC | Commercial and public databases of small molecules for virtual screening. | [55] [56] [57] |
| Protein Database | RCSB Protein Data Bank (PDB) | Repository for 3D structural data of proteins and nucleic acids. | [55] [2] |
The integration of pharmacophore screening, molecular docking, and molecular dynamics simulations represents a robust and powerful strategy in modern computational drug discovery. This multi-tiered workflow effectively leverages the high-throughput filtering strength of pharmacophore models with the detailed binding analysis of docking and the dynamic stability assessment of MD simulations. As evidenced by successful applications in oncology and infectious disease research, this paradigm significantly enhances the likelihood of identifying novel, potent, and stable lead compounds. Future advancements in machine learning, force field accuracy, and computing power will further solidify this integrated approach as a cornerstone of efficient and rational drug design.
Optimizing Pharmacophore Models: Strategies for Enhanced Performance
Common Pitfalls in Pharmacophore Model Generation and How to Avoid Them
In the modern drug discovery pipeline, pharmacophore-based virtual screening (VS) has established itself as a cornerstone technique for efficient lead identification [2]. A pharmacophore, defined by the International Union of Pure and Applied Chemistry (IUPAC) as "the ensemble of steric and electronic features that is necessary to ensure the optimal supramolecular interactions with a specific biological target and to trigger (or block) its biological response," provides an abstract representation of the key molecular interactions essential for biological activity [60] [44]. In the context of lead identification research, pharmacophore models serve as intelligent queries to screen vast chemical libraries, significantly enriching the hit rate compared to random high-throughput screening (HTS) [61]. Reported hit rates from prospective pharmacophore-based VS are typically in the range of 5% to 40%, a substantial improvement over the often <1% hit rates of random screening [61]. However, the generation of a high-quality, predictive pharmacophore model is fraught with challenges. The following sections detail common pitfalls encountered during this process and provide a strategic framework to avoid them, ensuring the reliability of VS campaigns for identifying novel lead compounds.
Critical Pitfalls and Strategic Solutions in Model Generation
The generation of a pharmacophore model, whether ligand-based or structure-based, is a critical step whose quality dictates the success of the entire virtual screening campaign. Below are the most common pitfalls and detailed protocols to mitigate them.
Table 1: Common Pitfalls in Pharmacophore Model Generation and Their Solutions
| Pitfall Category | Specific Pitfall | Consequence | Strategic Solution & Avoidance |
|---|---|---|---|
| Input Data Quality | Use of uncurated or low-activity data for training sets [62] [61]. | Poor model performance; high false-positive/negative rates. | Use only compounds with target-specific, high-potency (e.g., IC50 < 1 µM) data. Avoid cell-based assay data for model generation [61]. |
| Lack of inactive compounds or decoys for validation [61]. | Inability to assess model selectivity. | Use databases like ChEMBL, DUD-E to gather confirmed inactives or generate property-matched decoys [61]. | |
| Feature Selection & Placement | Overly complex model with too many mandatory features [44]. | Low hit rate; misses valid actives with scaffold diversity. | Start with a core set of 3-5 essential features; define others as "optional". Use QSAR to weight feature importance [44]. |
| Ignoring steric constraints of the binding pocket [44]. | Identifies compounds that sterically clash with the receptor. | Incorporate exclusion volumes (XVOL) based on the receptor structure or the union volume of aligned active ligands [44]. | |
| Conformational Sampling | Inadequate sampling of ligand conformational space [60]. | Model based on non-bioactive conformations. | Use algorithms with robust conformational analysis (e.g., poling, genetic algorithms) and consider multiple low-energy conformers [60]. |
| Model Validation | Proceeding to virtual screening without rigorous validation [62]. | Wasted resources on experimental testing of false positives. | Perform theoretical validation using a test set of actives/inactives. Calculate Enrichment Factor (EF), ROC-AUC, and use cross-validation [62] [61]. |
Pitfall 1: Inadequate Input Data Curation and Preparation
The principle of "garbage in, garbage out" is acutely relevant to pharmacophore modeling [62]. A model built upon flawed or inappropriate data is destined to fail in a prospective VS campaign.
- Experimental Protocol for Training Set Compilation: The first step involves the rigorous curation of a training set.
- Source Data: Extract structures and bioactivity data (e.g., Ki, IC50) from reliable, target-specific sources such as ChEMBL or PubChem Bioassay [61].
- Define Activity Threshold: Establish a strict activity cut-off (e.g., IC50 < 1 µM) to ensure only high-potency ligands are included.
- Select for Diversity: Choose active ligands that are structurally diverse to avoid bias towards a single chemical scaffold and to ensure the model captures the essential, common features [61].
- Generate Bioactive Conformations: For each selected ligand, generate a representative set of low-energy 3D conformations. Use algorithms that ensure broad coverage of the conformational space, such as Monte Carlo or genetic algorithm-based methods [60]. Tools like RDKit can be programmatically employed for this purpose [14].
Pitfall 2: Incorrect Feature Selection and Spatial Definition
A common error is creating a model that is either too restrictive, hindering scaffold hopping, or too permissive, leading to an unmanageable number of false positives.
- Experimental Protocol for Structure-Based Feature Selection:
- Protein Preparation: Obtain the 3D structure of the target (e.g., from PDB). Prepare the structure by adding hydrogen atoms, correcting protonation states of residues, and optimizing hydrogen bonding networks [2].
- Binding Site Analysis: If a co-crystallized ligand is present, analyze its interaction pattern. Software like LigandScout or Discovery Studio can automatically map interactions (HBD, HBA, hydrophobic, ionic) to generate initial features [61].
- Feature Pruning and Refinement: Manually inspect the automatically generated features. Retain only the features that form key, conserved interactions with the binding site residues (e.g., a critical hydrogen bond with a catalytic residue). Remove redundant or solvent-exposed features that are not critical for binding.
- Add Exclusion Volumes: To define the shape of the binding pocket and prevent steric clashes, add exclusion volumes around protein atoms lining the binding site [44].
Pitfall 3: Failure to Conduct Rigorous Theoretical Validation
Skipping robust validation is a critical mistake that can lead to the experimental testing of compounds identified by a non-predictive model [62].
- Experimental Protocol for Model Validation:
- Prepare a Test Database: Compile a validation database containing a list of known active compounds and a large set of confirmed inactive compounds or property-matched decoys (e.g., from DUD-E). A recommended ratio is 1 active to 50 decoys [61].
- Perform Virtual Screening: Screen this validation database with your pharmacophore model.
- Calculate Quality Metrics:
- Enrichment Factor (EF): Measures how much better the model is at identifying actives compared to random selection.
EF = (Hit_actives / N_actives) / (Hit_total / N_total). - Receiver Operating Characteristic (ROC) Curve: Plots the true positive rate against the false positive rate. The Area Under the Curve (AUC) quantifies the overall model performance, where 1.0 is perfect and 0.5 is random.
- GH Score (Güner-Henry Score): A composite metric that considers the yield of actives, false positives, and false negatives.
- Enrichment Factor (EF): Measures how much better the model is at identifying actives compared to random selection.
A Robust Workflow for Successful Pharmacophore-Based Lead Identification
Integrating the solutions to the pitfalls above leads to a comprehensive and robust workflow for employing pharmacophore models in lead identification research. This workflow, depicted below, ensures the generation of a high-quality model and its effective use in a virtual screening campaign.
Table 2: Key Research Reagent Solutions for Pharmacophore Modeling and Validation
| Tool / Resource Name | Type | Primary Function in Workflow | Access / Vendor |
|---|---|---|---|
| ChEMBL | Database | Source for curated bioactivity data of small molecules for training set compilation [61]. | https://www.ebi.ac.uk/chembl/ |
| DUD-E (Directory of Useful Decoys, Enhanced) | Database | Provides property-matched decoy molecules for rigorous theoretical model validation [61]. | http://dude.docking.org |
| RCBS PDB | Database | Source for 3D protein structures essential for structure-based pharmacophore modeling [2]. | https://www.rcsb.org |
| LigandScout | Software Suite | Advanced tool for automated creation of structure-based and ligand-based pharmacophore models and performing VS [61]. | Commercial (Inte:Ligand) |
| Discovery Studio | Software Suite | Comprehensive environment for protein preparation, pharmacophore model generation (e.g., HipHop, HypoGen), and VS [61]. | Commercial (BIOVIA) |
| RDKit | Cheminformatics Library | Open-source toolkit for cheminformatics and computational chemistry, used for conformational analysis, descriptor calculation, and more [14]. | https://www.rdkit.org |
| PAINS Remover | Web Tool / Filter | Identifies and removes Pan-Assay Interference Compounds (PAINS) from virtual hit lists to avoid false positives [62]. | Publicly available |
The path to a successful pharmacophore-based virtual screening campaign is paved with potential pitfalls at every stage, from initial data curation to final model validation. However, as outlined in this guide, these pitfalls can be systematically avoided by adhering to rigorous protocols for data preparation, feature selection, and—most critically—theoretical validation. By integrating these strategies into a robust workflow and leveraging the essential tools in the scientist's toolkit, researchers can generate high-fidelity pharmacophore models. These models dramatically increase the efficiency of lead identification, moving beyond simple "fragment matching" to a rational, structure-aware exploration of chemical space. This approach ultimately derisks the early drug discovery process and enhances the probability of identifying novel, potent, and selective lead compounds for therapeutic development.
Selecting and Curating Training Sets for Robust Ligand-Based Models
Within the broader context of pharmacophore-based virtual screening (VS) in lead identification research, the construction of a robust ligand-based model is fundamentally dependent on the quality and composition of its training set [18] [17]. A pharmacophore model is an abstract representation of the molecular features—such as hydrogen bond acceptors (HBA), hydrogen bond donors (HBD), hydrophobic areas (H), and aromatic rings (Ar)—essential for a molecule's biological activity [63] [18]. Ligand-based pharmacophore modeling specifically addresses scenarios where the three-dimensional structure of the biological target is unknown, deriving these critical features from a set of known active ligands [18] [17]. The careful selection and curation of these training set ligands is, therefore, a critical first step that dictates the model's predictive accuracy and its ultimate success in identifying novel lead compounds through virtual screening [64].
This guide provides an in-depth technical framework for assembling and validating high-quality training sets, a process pivotal to the development of reliable pharmacophore models for effective drug discovery.
Core Principles of Training Set Selection
The primary objective of training set selection is to capture the essential, shared pharmacophoric features responsible for the ligands' biological activity while accommodating a degree of structural diversity to ensure the model's generality [18]. The following principles are paramount:
- Bioactivity and Conformational Diversity: Training set compounds must be confirmed actives against the target of interest. Furthermore, since pharmacophores are three-dimensional entities, the conformational space of each ligand must be adequately sampled to generate a model that reflects the bioactive conformation [18].
- Chemical Diversity and Representativeness: The set should encompass a broad spectrum of the chemical space known to be active against the target. However, this diversity must be balanced with structural similarity to allow for the identification of common features. Including structurally distinct chemotypes can help create a model that is less biased toward a single scaffold [65].
- Data Quality and Curation: The accuracy of the source data for molecular structures and associated bioactivity is non-negotiable. Initial curation steps must include standardizing structures, checking for duplicates, and ensuring stereochemical accuracy, as these factors directly impact model generation [64].
Methodologies for Training Set Curation
Criteria for Compound Selection
A well-constructed training set is not a random assortment of active compounds. It should be deliberately chosen based on the following criteria, which are often derived from published literature and established databases:
- Potency: Select compounds with a range of high to moderate activity (e.g., IC50, Ki) to ensure the model is built on structurally relevant features [64].
- Structural Diversity: Incorporate multiple scaffold classes to make the model more generalizable. For instance, a study on fluoroquinolone antibiotics used Ciprofloxacin, Delafloxacin, Levofloxacin, and Ofloxacin to create a shared feature pharmacophore map [63].
- Generation of Features: The selected ligands must collectively exhibit all the pharmacophoric features believed to be critical for binding. A study on cephalosporins selected training set compounds specifically to ensure coverage of "hydrogen bond acceptors, hydrogen bond donors, aromatic rings, hydrophobic regions, and negatively ionizable sites" [64].
Table 1: Exemplary Training Sets from Literature
| Therapeutic Area | Target | Selected Training Set Compounds | Key Pharmacophoric Features Identified | Source |
|---|---|---|---|---|
| Antimicrobial | Bacterial DNA Gyrase | Ciprofloxacin, Delafloxacin, Levofloxacin, Ofloxacin [63] | Hydrophobic areas, HBA, HBD, Aromatic moieties (Ar) [63] | Sciencedirect |
| Antibacterial | Penicillin-Binding Protein | Cephalothin, Ceftriaxone, Cefotaxime [64] | HBA, HBD, Aromatic ring (Ar), Hydrophobic (H), Negative Ionizable (NI) [64] | PMC |
Experimental Protocols and Workflow
The following workflow outlines the key steps from data collection to model validation, highlighting best practices at each stage.
1. Data Collection & Literature Review: The process begins by compiling a set of known active compounds from scientific literature and public databases like PubChem [64]. For example, in a study aiming to develop novel cephalosporins, researchers retrieved the 3D conformers of cephalothin, ceftriaxone, and cefotaxime from PubChem in SDF (Structure Data File) format to serve as the training set [64].
2. Initial Compound Curation: The collected structures undergo rigorous preprocessing. This includes standardizing molecular representation (e.g., tautomer and ionization state), verifying stereochemistry, and removing duplicate structures to ensure data integrity [64].
3. Conformational Analysis: Each ligand in the training set is subjected to a conformational search to generate a representative ensemble of its low-energy 3D structures. This step is crucial for identifying the bioactive conformation and is typically performed using software tools like LigandScout [64].
4. Common Feature Pharmacophore Generation: The multiple, low-energy conformers of the training set ligands are aligned, and the software algorithm identifies the 3D arrangement of chemical features common to all active molecules. This results in a shared features pharmacophore (SFP) model, which may include features like HBA, HBD, and hydrophobic regions [63] [64].
5. Model Validation: The generated pharmacophore model must be rigorously validated before deployment in virtual screening. A best practice is to use a separate test set of known active and inactive molecules (decoys) to calculate statistical metrics like the Goodness-of-Hit (GH) score, which evaluates the model's ability to discriminate actives from inactives [64]. A GH score of 0.739, for instance, was reported as evidence of a robust cephalosporin model [64].
Quantitative Validation of Training Sets and Models
A critical, non-negotiable step following model generation is validation. Relying on internal metrics like fit scores can be misleading; instead, the model must be challenged with an external or independent set of molecules not used in training [65]. This evaluates its real-world predictive power and prevents overfitting.
Table 2: Key Metrics for Model Validation
| Metric | Description | Interpretation & Ideal Value | Exemplary Application |
|---|---|---|---|
| Goodness-of-Hit (GH) Score | A composite measure that evaluates the model's ability to identify true actives while minimizing false positives during virtual screening [64]. | Ranges from 0 to 1. A score above 0.5 is generally considered acceptable, with higher scores indicating better model performance. A score of 0.739 was reported for a validated cephalosporin model [64]. | Used to validate a cephalosporin pharmacophore model prior to virtual screening [64]. |
| RMSD (Root-Mean-Square Deviation) | Measures the geometric fit (in Ångströms) between the pharmacophore features of a ligand and the model itself [63]. | Lower values indicate a better fit. In a virtual screening hit list, RMSD values ranged from 0.28 to 0.63 for well-fitting compounds [63]. | Used to assess the quality of the mapping between hit compounds from virtual screening and the generated pharmacophore model [63]. |
| Sensitivity & Specificity | Sensitivity is the ability to correctly identify active compounds. Specificity is the ability to correctly reject inactive compounds [18]. | High values for both are desired. The reliability of the model depends on a balance of these two properties [18]. | Critical for pharmacophore model validation to confirm the model can properly identify both active and inactive ligands [18]. |
The following diagram illustrates the logical process of this crucial validation step, showing how a validated model is progressed while a failed model triggers a refinement cycle.
The Scientist's Toolkit: Essential Research Reagent Solutions
The following table details key software tools and databases that are indispensable for the process of training set curation and ligand-based pharmacophore modeling.
Table 3: Essential Resources for Training Set Curation and Modeling
| Tool / Resource | Type | Primary Function in Training Set Curation |
|---|---|---|
| PubChem | Public Database | A key resource for retrieving 2D and 3D structural information (SDF files) and bioactivity data for known active compounds to populate a training set [64]. |
| ZINCPharmer/Pharmit | Online Database & Pharmacophore Search Tool | Used to screen large, commercially available chemical libraries (e.g., ZINC) against a generated pharmacophore model to identify potential hit compounds [63] [64]. |
| LigandScout | Commercial Software | A specialized platform for both structure-based and ligand-based pharmacophore model generation, analysis, and validation [64]. |
| RDKit | Open-Source Cheminformatics Library | Used programmatically for molecular standardization, descriptor calculation, fingerprint generation, and conformer generation during data preprocessing and featurization [66]. |
The meticulous selection and curation of a training set is the cornerstone of developing a robust and predictive ligand-based pharmacophore model. By adhering to the principles of bioactivity, diversity, and data quality, and by following a rigorous workflow that includes comprehensive conformational analysis and, most critically, quantitative validation, researchers can create powerful in-silico filters. These models significantly enhance the efficiency of virtual screening campaigns within lead identification research, providing a reliable and cost-effective strategy to navigate vast chemical spaces and accelerate the discovery of novel therapeutic agents.
Balancing Feature Specificity with Model Flexibility to Avoid Overfitting
In the competitive landscape of drug discovery, pharmacophore-based virtual screening (VS) has established itself as a cornerstone methodology for lead identification [9] [61]. By abstracting molecular interactions into a set of steric and electronic features essential for biological activity, pharmacophore models enable researchers to efficiently navigate vast chemical spaces in search of novel candidate compounds [9]. According to the IUPAC definition, a pharmacophore represents "the ensemble of steric and electronic features that is necessary to ensure the optimal supramolecular interactions with a specific biological target and to trigger (or block) its biological response" [9]. This conceptual framework, first introduced by Ehrlich in 1909, has evolved into sophisticated computational tools that leverage both ligand-based and structure-based approaches [9].
However, the very abstraction that gives pharmacophore models their power also creates a fundamental tension in model development: the balance between feature specificity and model flexibility [13]. An overly specific model may exclude potentially viable lead compounds with minor structural variations, while an excessively flexible model risks overfitting to known actives, reducing its ability to identify novel chemotypes through scaffold hopping [13] [4]. This technical guide examines strategies to navigate this critical balance, ensuring robust model performance in lead identification campaigns.
Theoretical Foundation: Specificity, Flexibility, and Overfitting
The Specificity-Flexibility Continuum
In pharmacophore modeling, feature specificity refers to the precision with which chemical features and their spatial arrangements are defined. This includes feature type (e.g., hydrogen bond donor, acceptor, hydrophobic region), directionality, tolerance radii, and weight assignments [9] [61]. High specificity models typically employ tight tolerance spheres and mandatory features, potentially increasing model precision but reducing the chemical space screened.
Conversely, model flexibility encompasses strategies that accommodate structural variation while maintaining biological relevance. This includes:
- Defining optional features that are beneficial but not essential
- Implementing feature omitting policies that allow a subset of features to remain unmatched
- Employing fuzzy matching with larger tolerance radii
- Creating multiple valid hypotheses to represent alternative binding modes [13]
The relationship between these competing factors directly impacts model generalizability, with the optimal balance being highly dependent on available structural and activity data.
The Overfitting Problem in Pharmacophore Modeling
Overfitting occurs when a model incorporates too much detail from the training set, including its noise and idiosyncrasies, thereby compromising its ability to generalize to novel compounds [13]. In pharmacophore contexts, this manifests as:
- Excessive exclusion volumes that model transient conformational states rather than fundamental steric constraints
- Overspecified feature geometries that demand precise angles and distances not required for biological activity
- Mandatory inclusion of features that are present in training compounds but not essential for target engagement
The abstract nature of pharmacophore representations provides some inherent protection against overfitting compared to direct molecular matching, but the risk remains significant, particularly with small or structurally similar training sets [13].
Methodological Approaches: Strategies for Balanced Modeling
Structure-Based Modeling with Dynamic Information
Structure-based pharmacophore modeling derives features directly from the target's binding site, either from macromolecule-ligand complexes or apo structures [9] [61]. To avoid overfitting while maintaining relevance:
- Incorporate protein flexibility: Use molecular dynamics (MD) simulations or multiple crystal structures to account for binding site plasticity [67]. The SILCS (Site Identification by Ligand Competitive Saturation) approach, for example, employs all-atom MD simulations in an aqueous solution of diverse probe molecules to map functional group affinities, naturally incorporating protein flexibility and desolvation effects [67].
- Prioritize conserved features: Identify features that persist across multiple conformational states as these likely represent fundamental binding requirements.
- Use exclusion maps judiciously: Rather than modeling every protein atom as an exclusion volume, focus on regions with high conservation and limited mobility [68].
Figure 1: Structure-based workflow integrating dynamic information.
Ligand-Based Modeling with Diverse Training Sets
Ligand-based approaches generate models from a set of known active compounds by identifying their common chemical features [9] [61]. Key considerations include:
- Training set composition: Curate structurally diverse training sets that span multiple chemotypes and potency ranges [61]. This helps distinguish essential features from those coincidentally present in a narrow chemical series.
- Conformational sampling: Employ comprehensive conformational analysis to ensure representative molecular posing, but avoid over-weighting rare or high-energy conformers [9].
- Feature selection algorithms: Use algorithms that quantitatively assess feature importance rather than simply identifying features common to all training compounds. The QPHAR method, for instance, constructs quantitative models using a consensus pharmacophore (merged-pharmacophore) and uses machine learning to derive relationships between feature positions and biological activities, enhancing generalizability [13].
Quantitative Pharmacophore Activity Relationship (QPHAR)
The QPHAR approach represents a significant advancement in balancing specificity and flexibility by building quantitative models directly from pharmacophoric representations rather than molecular structures [13]. This method:
- Transforms different functional groups with the same interaction profile into an abstract chemical feature representation, reducing bias toward overrepresented functional groups in small datasets [13].
- Generates a consensus pharmacophore (merged-pharmacophore) from all training samples, then aligns input pharmacophores to this consensus model [13].
- Uses machine learning to establish quantitative relationships between feature positions relative to the consensus and biological activity, creating models that can generalize to underrepresented or even missing molecular features in the training set [13].
Figure 2: QPHAR workflow for quantitative modeling.
Experimental Protocols and Validation Frameworks
Model Generation and Refinement Protocol
The following detailed protocol ensures development of balanced pharmacophore models:
Input Preparation
- For structure-based approaches: Obtain high-resolution protein-ligand complexes (PDB) or use homology models with verified binding site geometry [10]. Prepare the structure by adding hydrogens, optimizing side-chain orientations, and assigning correct protonation states.
- For ligand-based approaches: Curate a training set of 15-30 known active compounds with measured activity values (IC₅₀, Kᵢ) from direct binding or enzyme activity assays [61]. Include structurally diverse chemotypes with activity spanning at least two orders of magnitude.
Feature Identification and Hypothesis Generation
- Use automated tools (e.g., LigandScout, Discovery Studio, PHASE) to extract pharmacophore features [9] [10].
- For structure-based models: Identify features from protein-ligand interactions, prioritizing those with high complementarity to the binding site [10].
- For ligand-based models: Generate multiple alignment hypotheses and identify conserved features across alignments [9].
- Assign initial feature weights based on conservation statistics or interaction energy calculations.
Model Simplification
- Employ a backward elimination approach, iteratively removing features with the lowest weights or conservation scores.
- Convert strongly correlated features from mandatory to optional.
- Adjust tolerance radii to accommodate bioisosteric replacements while maintaining spatial precision.
- Validate each simplified model against a separate validation set (not used in training) to monitor generalization performance [13].
Validation and Optimization
- Screen against a decoy set containing known actives and inactives (e.g., from DUD-E) [67] [10].
- Calculate enrichment factors (EF), area under the ROC curve (AUC), and other performance metrics [61] [10].
- Optimize model parameters to maximize early enrichment (EF₁%) while maintaining reasonable sensitivity [10].
Performance Metrics and Validation Strategies
Rigorous validation is essential to confirm model generalizability and avoid overfitting. The following table summarizes key validation metrics and their interpretation:
Table 1: Key Validation Metrics for Pharmacophore Model Assessment
| Metric | Calculation | Target Value | Interpretation |
|---|---|---|---|
| Enrichment Factor (EF₁%) | (Hitrate₍screened₎ / Hitrate₍total₎) at 1% of database screened | >10 | Excellent early recognition of actives [10] |
| Area Under ROC Curve (AUC) | Area under receiver operating characteristic curve | 0.8-1.0 | Superior to random classification; 0.98 represents excellent model [10] |
| Yield of Actives | (Number of actives found / Total hits) × 100 | 5-40% | Typical range for prospective screening [61] |
| Robustness (Q²) | Cross-validated R² from QPHAR | >0.5 | Indicates predictive reliability [13] |
Additionally, scaffold hopping potential serves as a critical qualitative metric of model flexibility. A balanced model should identify active compounds with structural cores distinct from training set molecules [13] [4].
Advanced Integration: AI and Shape-Based Enhancements
AI-Driven Pharmacophore Modeling
Artificial intelligence approaches offer powerful strategies to balance specificity and flexibility:
- Pharmacophore-guided deep learning: Methods like PGMG (Pharmacophore-Guided deep learning approach for bioactive Molecule Generation) use pharmacophore hypotheses as input to generate novel molecules matching the feature arrangement, introducing latent variables to model the many-to-many relationship between pharmacophores and molecules [14].
- Feature representation learning: Graph neural networks encode spatially distributed chemical features, learning complex relationships between feature arrangements and bioactivity [14].
- Multi-objective optimization: AI can simultaneously optimize feature specificity (to maintain target engagement) and model flexibility (to enable scaffold hopping) through Pareto optimization frameworks [14].
Shape-Focused Pharmacophore Models
Shape-based approaches provide an effective strategy to enhance model generalizability:
- O-LAP algorithm: This method generates shape-focused pharmacophore models by clumping together overlapping atomic content from docked active ligands via pairwise distance graph clustering [68]. The process fills the protein cavity with flexibly docked active ligands, removes non-polar hydrogen atoms, and clusters overlapping atoms with matching types to form representative centroids [68].
- Negative image-based (NIB) models: These models represent the protein cavity's shape and electrostatic properties as a pseudo-ligand, enabling screening based on overall complementarity rather than specific feature matches [68].
- Enrichment-driven optimization: The composition of shape-based models can be optimized using greedy search algorithms to maximize enrichment of known actives over decoys [68].
Table 2: The Researcher's Toolkit for Balanced Pharmacophore Modeling
| Tool/Category | Representative Examples | Primary Function | Role in Balancing Specificity/Flexibility |
|---|---|---|---|
| Pharmacophore Modeling Software | LigandScout [10], Discovery Studio [61], PHASE [9] | Feature identification & hypothesis generation | Provide algorithms for feature weighting and optional feature assignment |
| Validation Databases | DUD-E [67] [10], ChEMBL [13] | Decoy sets & bioactivity data | Enable calculation of enrichment factors & model generalizability assessment |
| Conformational Sampling Tools | iConfGen [13], Monte Carlo sampling [9] | Representative conformer generation | Ensure features represent biologically relevant poses without overfitting to rare conformations |
| Dynamic Simulation Packages | SILCS [67], Molecular Dynamics (MD) | Incorporation of flexibility & solvation | Account for protein flexibility & desolvation effects in feature identification |
| Shape-Based Tools | O-LAP [68], PANTHER [68] | Cavity shape representation | Complement feature-based models with shape matching for enhanced generalizability |
| AI-Driven Platforms | PGMG [14], QPHAR [13] | Machine learning-enhanced modeling | Learn complex feature-bioactivity relationships while maintaining interpretability |
The effective balance between feature specificity and model flexibility represents a cornerstone of successful pharmacophore-based lead identification. By adopting the methodologies and validation frameworks outlined in this guide—including structure-based approaches that incorporate protein flexibility, ligand-based methods using diverse training sets, quantitative QPHAR techniques, and emerging AI-driven and shape-based enhancements—researchers can develop pharmacophore models that maintain high enrichment of true actives while enabling scaffold hopping and minimizing overfitting. As pharmacophore modeling continues to evolve, integration with AI-driven molecular representation methods and advanced shape-based matching will further enhance our ability to navigate chemical space efficiently, ultimately accelerating the discovery of novel therapeutic agents.
Addressing Challenges in Feature Mapping and Conformational Sampling
In the field of lead identification research, pharmacophore-based virtual screening (VS) stands as a cornerstone methodology for efficiently prioritizing potential drug candidates. A pharmacophore model abstractly represents the essential steric and electronic features required for a molecule to interact with a biological target [69]. The efficacy of this approach, however, hinges on two fundamental and interlinked computational challenges: accurate feature mapping and comprehensive conformational sampling. Feature mapping involves correctly identifying and aligning the chemical features of a small molecule with the model's constraints. Conformational sampling generates the ensemble of three-dimensional shapes a flexible molecule can adopt, with the primary goal of reproducing the bioactive conformation—the structure it assumes when bound to its target [69]. The inherent flexibility of drug-like molecules means that a single, static 3D structure is often insufficient; a molecule may miss a pharmacophore not because it lacks the necessary features, but because it is not presented in the correct spatial orientation [69]. This technical guide examines the core challenges within these processes, evaluates traditional and emerging AI-driven solutions, and provides detailed protocols for researchers aiming to enhance their pharmacophore VS campaigns.
Core Challenges and Performance Evaluation
The process of generating and using conformers for pharmacophore searching is fraught with intrinsic difficulties that can lead to either false negatives or false positives in virtual screening.
Primary Challenges in Conformational Sampling
- The Bioactive Conformation Problem: A molecule's lowest-energy conformation in solution or crystal form may not be the same as its bioactive conformation. Upon binding, a ligand undergoes a transition from an unbound state to a bound state, stabilized by the specific electrostatic and steric forces of the protein's binding site. This makes predicting the bound geometry a non-trivial task [69].
- Balancing Comprehensiveness and Efficiency: Generating too few conformations risks missing the bioactive conformation, leading to false negatives. Conversely, generating too many conformations not only increases computational time but can also dramatically increase the number of false positive hits by matching the pharmacophore model with unrealistic, high-energy conformers [69].
- Handling Macrocyclic and Flexible Molecules: Traditional conformer generators, often based on rules or distance geometry, can struggle with complex molecular topologies, such as macrocycles, and highly flexible molecules with numerous rotatable bonds, where the conformational space becomes astronomically large.
Quantitative Performance of Sampling Methods
The performance of different conformational sampling methods and software tools can be quantitatively assessed based on their ability to reproduce bioactive conformations and their computational efficiency. The following table summarizes key performance metrics from comparative studies.
Table 1: Performance Comparison of Conformational Sampling Methods and Tools
| Method / Software | Key Characteristics | Reported Performance | Primary Use Case |
|---|---|---|---|
| Traditional Tools (MOE, Catalyst) | Systematic, stochastic, or rule-based search modes [70]. | MOE performs at least as well as Catalyst for high-throughput library generation and detailed modeling [70]. | General-purpose conformational modeling and high-throughput 3D library enumeration [70]. |
| OMEA | Knowledge-based and rule-based system [69]. | Demonstrates high performance in retrospective analyses and the retrieval of protein-bound ligand conformations [69]. | Rapid generation of conformationally diverse and pharmacologically relevant ensembles. |
| AI Method (DiffPhore) | Knowledge-guided diffusion model for 3D ligand-pharmacophore mapping [23]. | Surpasses traditional tools and several advanced docking methods in predicting binding conformations; shows superior virtual screening power [23]. | "On-the-fly" generation of bioactive conformations that maximally map to a given pharmacophore model. |
Advanced AI and Integrative Approaches
The integration of artificial intelligence (AI) is reshaping the landscape of pharmacophore modeling and conformational sampling, moving beyond the limitations of traditional methods.
Deep Learning for 3D Ligand-Pharmacophore Mapping
A pioneering AI framework, DiffPhore, exemplifies this advancement. It is a knowledge-guided diffusion model designed to generate 3D ligand conformations that optimally match a given pharmacophore model [23]. Its architecture directly addresses the challenges of feature mapping and conformational sampling through an integrated process:
- Knowledge-Guided LPM Encoder: This module encodes the ligand conformation and pharmacophore model as a geometric graph. It explicitly incorporates pharmacophore-ligand mapping knowledge, including rules for feature type matching (e.g., aligning hydrogen bond donors with acceptors) and directional alignment [23]. This ensures the model understands the fundamental chemistry of interactions.
- Diffusion-Based Conformation Generator: This component uses a score-based diffusion model, parameterized by an SE(3)-equivariant graph neural network, to iteratively denoise a random initial conformation. It estimates translation, rotation, and torsion transformations at each step, guided by the pharmacophore model's constraints [23].
- Calibrated Conformation Sampler: This module adjusts the conformation perturbation strategy to narrow the discrepancy between the model's training and inference phases, enhancing the efficiency and accuracy of the final output [23].
By training on large, high-quality datasets of 3D ligand-pharmacophore pairs (CpxPhoreSet and LigPhoreSet), DiffPhore learns to capture generalizable mapping patterns across a broad chemical space, enabling it to outperform traditional methods in predicting binding conformations and virtual screening success [23].
Integration in Broader Drug Discovery Pipelines
For lead identification, pharmacophore VS is rarely used in isolation. It is most powerful when integrated into a cohesive Design-Make-Test-Analyze (DMTA) cycle [71]. In this context, AI-driven hit-to-lead acceleration platforms can compress traditionally lengthy optimization phases from months to weeks. For instance, deep graph networks have been used to generate thousands of virtual analogs, leading to a several-thousand-fold potency improvement in a single optimization cycle [71]. Furthermore, experimental validation of target engagement using methods like Cellular Thermal Shift Assay (CETSA) can provide critical, functionally relevant confirmation that computational hits are engaging the intended target in a physiological cellular environment, thereby strengthening the entire lead identification pipeline [71].
Experimental Protocols and Workflows
To ensure reproducibility and success in pharmacophore-based virtual screening, adherence to robust experimental protocols is essential. Below are detailed methodologies for key stages of the workflow.
Protocol for a Standard 3D Pharmacophore Virtual Screening Campaign
This protocol outlines the steps for conducting a virtual screen using a 3D pharmacophore model.
Pharmacophore Model Elucidation:
- Structure-Based Method: If a protein-ligand co-crystal structure is available, use software like MOE [53] or Flare [53] to extract key interaction features (e.g., hydrogen bond donors/acceptors, hydrophobic patches, aromatic rings, ionic interactions) from the binding site.
- Ligand-Based Method: If only active ligand structures are known, use tools like PHASE [23] or Catalyst [23] to identify common chemical features shared among diverse active molecules to create a pharmacophore hypothesis.
Model Validation:
- Assess the quality of the pharmacophore model by screening a small, known dataset containing active and inactive compounds.
- A robust model should successfully enrich the active compounds early in the ranked hit list. Metrics like the Enrichment Factor (EF) and the area under the Receiver Operating Characteristic (ROC) curve should be calculated.
Database Preparation and Conformational Sampling:
- Prepare a database of candidate molecules (e.g., from ZINC20 or corporate collections) by standardizing structures, generating plausible ionization states at physiological pH, and removing duplicates.
- Apply a conformer generation tool (e.g., OMEGA, MOE, or DiffPhore) to the prepared database. The goal is to create a conformational ensemble for each molecule that adequately represents its potential 3D shape space. Key parameters to adjust include the energy window (e.g., 10-20 kcal/mol above the global minimum) and the maximum number of conformers per compound (e.g., 50-250) [69].
Pharmacophore Search and Hit Identification:
- Execute the 3D search using the validated pharmacophore model against the conformer-enriched database.
- The software will score and rank compounds based on their fitness to the pharmacophore model.
Post-Screening Analysis and Prioritization:
- Visually inspect the top-ranking hits to verify the logical consistency of the feature mapping.
- Subject the hits to further in silico filters, such as ADMET prediction (e.g., using SwissADME [71] or StarDrop [53]) and docking studies into the protein target (if structure is available) to refine the list of candidates for experimental testing.
The following diagram illustrates the logical flow and iterative nature of this protocol.
Protocol for Evaluating a Conformer Generation Method
This protocol describes how to benchmark the performance of a conformational sampling tool.
Reference Set Curation:
- Compile a diverse set of 200-300 high-resolution, protein-bound ligand structures from the Protein Data Bank (PDB). This set should cover a wide range of molecular properties (e.g., rotatable bond count, ring systems) [70].
Conformer Generation:
- Input the 2D structures of the curated ligands into the conformer generator under evaluation (e.g., Tool A).
- Run the tool with its default or optimized parameters to generate a conformational ensemble for each ligand.
Performance Analysis:
- For each ligand, identify the generated conformer that is most geometrically similar to its experimental bioactive conformation from the PDB. The similarity is typically measured by Root-Mean-Square Deviation (RMSD) of atomic positions after optimal superposition.
- Calculate the following metrics across the entire dataset:
- Success Rate: The percentage of ligands for which at least one generated conformer has an RMSD below a defined threshold (e.g., 2.0 Å).
- Average Minimum RMSD: The mean of the lowest RMSD values found for each ligand.
- Computational Time: The average time taken to process a single molecule.
- Repeat steps 2-3 for other tools (e.g., Tool B, Tool C) for a comparative analysis.
Table 2: Essential Research Reagent Solutions for Computational Experiments
| Item / Software | Function in Protocol | Example Tools / Suppliers |
|---|---|---|
| Molecular Modeling Suite | Provides an integrated environment for pharmacophore modeling, conformational analysis, and docking. | MOE (Chemical Computing Group) [53], Schrödinger Suite [53], Flare (Cresset) [53]. |
| Specialized Conformer Generator | Generates diverse, energetically reasonable 3D conformations of small molecules for virtual screening. | OMEGA (OpenEye), CONFIRM (Accelrys/Catalyst) [69], CAESAR [69]. |
| AI-Driven Pharmacophore Platform | Uses deep learning for advanced tasks like binding conformation prediction and target fishing. | DiffPhore [23]. |
| Compound Database | Source of small molecules for virtual screening. | ZINC20, ChEMBL, corporate compound collections. |
| Protein-Ligand Structure Database | Source of experimental structures for model building and method validation. | Protein Data Bank (PDB), Cambridge Structural Database (CSD). |
| Cheminformatics Toolkit | Handles data preparation, descriptor calculation, and basic QSAR modeling. | RDKit, ChemAxon [53]. |
The challenges of feature mapping and conformational sampling represent a central battleground in the effort to improve the efficiency and success rate of pharmacophore-based virtual screening. While traditional computational methods have provided a strong foundation, they are often constrained by the need to balance coverage with computational cost. The emergence of sophisticated AI frameworks, such as DiffPhore, marks a significant paradigm shift. By integrating the physical rules of molecular recognition directly into the conformation generation process, these models offer a powerful path toward more accurate and predictive in silico lead identification. For research scientists, the strategic integration of these advanced computational techniques with robust experimental validation protocols will be key to unlocking novel therapeutic agents in an increasingly complex drug discovery landscape.
Leveraging Advanced Software and Automation to Improve Model Reliability
In the modern drug discovery pipeline, pharmacophore-based virtual screening (VS) has established itself as a cornerstone methodology for the efficient identification of novel lead compounds [2]. This approach reduces the time and costs associated with traditional drug discovery by enabling the in silico screening of vast chemical libraries to identify molecules that are most likely to bind to a specific biological target [2]. The core concept of a pharmacophore, defined by IUPAC as "the ensemble of steric and electronic features that is necessary to ensure the optimal supramolecular interactions with a specific biological target structure and to trigger (or to block) its biological response," provides an abstract blueprint for molecular recognition [1] [3]. However, the reliability of pharmacophore models is not inherent; it is highly dependent on the quality of input data, the rigor of the modeling protocol, and the strategic implementation of automation and advanced software solutions [72] [5]. Within the context of lead identification research, unreliable models can lead to high false-positive rates, wasted synthetic efforts, and ultimately, project failure. This whitepaper provides a technical guide for researchers aiming to harness contemporary software and automated workflows to build highly reliable pharmacophore models, thereby de-risking the early stages of drug discovery.
Core Principles of Pharmacophore Modeling
A pharmacophore model abstracts the key molecular interaction capacities of a ligand or a protein-binding site into a set of discrete steric and electronic features [3]. The most salient feature types include Hydrogen Bond Acceptors (HBA), Hydrogen Bond Donors (HBD), Hydrophobic (H) areas, Positively/Inegatively Ionizable groups (PI/NI), and Aromatic Rings (AR) [2]. These features are represented in 3D space as geometric entities like points, spheres, and vectors, defining the spatial arrangement required for biological activity.
The two primary approaches for model generation are:
- Structure-Based Pharmacophore Modeling: This method relies on the 3D structural information of the biological target, often obtained from X-ray crystallography, Cryo-EM, or computational models like AlphaFold2 [2]. The process involves a critical analysis of the binding site to identify key interaction points, which are then translated into pharmacophore features. The availability of a protein-ligand complex allows for a more accurate model, as it directly visualizes the essential interactions and allows for the inclusion of exclusion volumes (XVOL) to represent steric constraints of the binding pocket [2].
- Ligand-Based Pharmacophore Modeling: When the structure of the target protein is unavailable, this approach constructs the model from a set of known active ligands. The workflow involves generating low-energy conformations for each active molecule, superimposing them to find the best spatial overlap of common functional groups, and abstracting these groups into pharmacophore features [1] [3]. This approach hinges on the correct identification of the bioactive conformation and requires a structurally diverse set of active compounds to produce a meaningful hypothesis.
A Guide to Modern Software Solutions
The computational drug discovery landscape in 2025 is characterized by a blend of specialized tools and comprehensive platforms that integrate advanced algorithms, automation, and user-friendly interfaces [53]. The selection of a software solution should be guided by factors such as automation capabilities, specialized modeling techniques, user accessibility, and data handling prowess [53].
The table below summarizes key software solutions and their relevant capabilities for creating reliable pharmacophore models.
Table 1: Key Software Solutions for Pharmacophore Modeling and Virtual Screening
| Software Platform | Primary Application in Pharmacophore Workflow | Notable Features & Capabilities |
|---|---|---|
| Schrödinger Phase [73] | Ligand- & Structure-Based Modeling | Intuitive interface; common pharmacophore perception algorithm; screening of prepared commercial libraries. |
| BIOVIA Discovery Studio [74] | Ligand- & Structure-Based Design | CATALYST toolset; extensive PharmaDB database for ligand profiling; ensemble pharmacophores for diverse compound sets. |
| MOE (Molecular Operating Environment) [53] [26] | Comprehensive Molecular Modeling | Integrated suite for SBDD, cheminformatics; molecular docking, QSAR, and ADMET prediction. |
| Cresset Flare [53] | Advanced Protein-Ligand Modeling | Free Energy Perturbation (FEP), MM/GBSA for binding free energy; protein and homology modeling features. |
| deepmirror [53] | Augmented Hit-to-Lead | Generative AI engine for molecular design & property prediction; user-friendly interface for medicinal chemists. |
| DataWarrior [53] | Open-Source Cheminformatics | Open-source chemical intelligence; QSAR model development using molecular descriptors and machine learning. |
Beyond standalone modeling, the integration of pharmacophore screening with molecular docking serves as a powerful strategy to improve outcomes. A docking program fits a ligand into a protein's binding pocket and generates possible binding poses, which are then ranked by a scoring function (SF) [72]. This structure-based approach can be used to elucidate binding modes from which complex-based pharmacophores can be derived [3]. Furthermore, using a pharmacophore model as a post-docking filter to ensure that top-ranked poses align with the established pharmacophore hypothesis significantly enhances the selectivity and reliability of the virtual screening process [72].
Experimental Protocols for Robust Model Development and Validation
Structure-Based Pharmacophore Modeling: A Detailed Protocol
The following protocol, inspired by a recent study on identifying FAK1 inhibitors, outlines a robust, structure-based workflow [5].
- Protein Structure Preparation: Obtain the 3D structure of the target protein, preferably in complex with a high-affinity ligand, from the RCSB Protein Data Bank (PDB) [2] [5]. Critically evaluate the structure's resolution (ideally < 2.5 Å) and completeness. Use software like Chimera or MODELLER to add missing residues or atoms, correct protonation states, and optimize hydrogen bonding networks [5].
- Binding Site Analysis and Pharmacophore Feature Generation: Upload the prepared protein-ligand complex to a structure-based modeling tool (e.g., Pharmit, MOE, or Schrödinger's Phase) [5] [73]. The software will analyze intermolecular interactions (H-bonds, ionic interactions, hydrophobic contacts) and automatically generate a set of potential pharmacophore features.
- Feature Selection and Hypothesis Generation: The initial automated feature generation often produces an overabundance of features. The researcher must then select the most relevant features for ligand binding and activity. This can be done by:
- Removing features that do not contribute significantly to the binding energy.
- Identifying conserved interactions across multiple protein-ligand complexes, if available.
- Preserving features from residues known to be critical from mutagenesis studies [2] [5]. Generate several pharmacophore hypotheses (models) with different combinations of 5-6 critical features.
- Rigorous Statistical Validation: A pharmacophore model is merely a hypothesis until it is rigorously validated. This requires a dataset of known active compounds and decoy molecules (inactive compounds with similar physicochemical properties but different 2D topology) [5]. The Directory of Useful Decoys - Enhanced (DUD-E) is a valuable resource for this purpose [5]. Screen these datasets against each pharmacophore model and calculate the following metrics to select the optimal model [5]:
- Sensitivity (Recall): The ability to correctly identify active compounds (
Sensitivity = (Ha / A) * 100, whereHais the number of hit actives, andAis the total number of actives). - Specificity: The ability to correctly reject decoy compounds.
- Enrichment Factor (EF): Measures how much more likely you are to find an active compound in the screened hit list compared to a random selection.
- Goodness of Hit (GH): A composite score that balances sensitivity and specificity, with a maximum value of 1.
- Sensitivity (Recall): The ability to correctly identify active compounds (
Table 2: Key Statistical Metrics for Pharmacophore Model Validation
| Metric | Formula | Interpretation |
|---|---|---|
| Sensitivity (Recall) | (Ha / A) * 100 | Higher values indicate better coverage of known actives. |
| Specificity | (Dd / D) * 100 | Higher values indicate better rejection of inactives. |
| Enrichment Factor (EF) | (Ha / Ht) / (A / D) | Values >1 indicate enrichment; higher is better. |
| Goodness of Hit (GH) | [ (Ha / Ht) * ( (3A + Ht) / 4A ) ] * (1 - (Ht - Ha)/(D - A)) | A composite score; closer to 1.0 indicates a superior model. |
| Ha: Hit actives; A: Total actives; Dd: Rejected decoys; D: Total decoys; Ht: Total hits |
Workflow Visualization: Structure-Based Pharmacophore Modeling and Validation
The following diagram illustrates the integrated workflow for developing and validating a structure-based pharmacophore model.
Advanced Automation: Integrating Molecular Dynamics for Enhanced Reliability
To further improve model reliability, particularly for modeling protein flexibility, integrating Molecular Dynamics (MD) simulations is highly recommended. A static crystal structure represents a single snapshot, whereas MD simulations capture the dynamic behavior of the protein-ligand complex over time [5]. The protocol is as follows:
- System Setup: Solvate the protein-ligand complex in an explicit water model and add ions to neutralize the system.
- Simulation Run: Perform an MD simulation (e.g., 100 ns) using software like GROMACS or Desmond to observe conformational changes and interaction stability [26] [5].
- Trajectory Analysis and Pharmacophore Refinement: Analyze the MD trajectory to identify:
- Stable interactions: Hydrogen bonds or ionic interactions that persist >80% of the simulation time are strong candidates for inclusion in the pharmacophore model.
- Protein flexibility: Observe if specific loops or side chains shift, potentially revealing new interaction points or adjusting the spatial tolerance of features.
- Water-mediated interactions: Identify conserved water molecules that are part of the binding network, which can be incorporated as specific pharmacophore features [53].
- Binding Free Energy Calculations: Use methods like MM/PBSA (Molecular Mechanics/Poisson-Boltzmann Surface Area) on frames extracted from the MD trajectory to calculate the binding free energy of the complex [5]. This provides a quantitative measure to corroborate the pharmacophore hypothesis and prioritize compounds from virtual screening.
Table 3: Essential Research Reagents and Computational Resources
| Resource / Reagent | Type | Function in Pharmacophore VS |
|---|---|---|
| RCSB Protein Data Bank (PDB) [2] [5] | Database | Primary repository for 3D structural data of proteins and nucleic acids; the starting point for structure-based modeling. |
| DUD-E Database [5] | Database | Directory of Useful Decoys, Enhanced; provides benchmark sets of known active and decoy molecules for rigorous model validation. |
| ZINC Database [5] | Database | Publicly available database of commercially available compounds for virtual screening. |
| PharmaDB (in BIOVIA) [74] | Database | A database of ~240,000 receptor-ligand pharmacophore models used for ligand profiling and off-target activity prediction. |
| OPLS4 Force Field [73] | Computational Resource | A high-accuracy force field used in platforms like Schrödinger for conformational sampling and energy minimization. |
| MODELER [5] | Software Tool | Used for homology modeling to generate 3D protein structures when experimental structures are unavailable or incomplete. |
| GROMACS [5] | Software Tool | A package for performing molecular dynamics simulations to assess the stability and dynamics of protein-ligand complexes. |
The journey from a theoretical pharmacophore hypothesis to a reliable model capable of guiding successful lead identification is complex yet achievable. It demands a meticulous, multi-faceted approach that leverages the advanced software and automated workflows available to researchers today. By adhering to rigorous protocols for structure preparation, feature selection, and—most critically—statistical validation using known actives and decoys, the initial model's foundation is solidified. Furthermore, the integration of sophisticated methods like molecular dynamics simulations and free energy calculations pushes model reliability to a new level by accounting for the dynamic nature of biological systems. As the field continues to evolve with the integration of generative AI and more powerful physics-based simulations, the potential for pharmacophore models to serve as exceptionally reliable filters in virtual screening will only grow. By adopting the strategies and tools outlined in this guide, drug discovery professionals can significantly enhance the efficiency and success rate of their lead identification campaigns.
Validating and Benchmarking Pharmacophore Screening Success
In modern computational drug discovery, pharmacophore-based virtual screening has emerged as a powerful strategy for identifying novel lead compounds from extensive chemical libraries. This approach abstracts the essential molecular interactions between a ligand and its target into a three-dimensional model representing steric and electronic features necessary for optimal binding. However, the practical utility of any generated pharmacophore model is entirely dependent on rigorous validation to ensure its predictive capability and reliability before deployment in virtual screening campaigns. Without proper validation, researchers risk screening millions of compounds based on flawed models, resulting in wasted computational resources and failed experimental follow-ups.
Within this validation paradigm, three quantitative metrics have become standard for evaluating pharmacophore model performance: the Enrichment Factor (EF), Goodness of Hit (GH) Score, and Receiver Operating Characteristic (ROC) Analysis. These metrics provide complementary insights into a model's ability to distinguish active compounds from inactive ones in a database. When used together, they offer a comprehensive assessment of model quality, balancing early enrichment performance with overall classification accuracy. This technical guide examines these core validation metrics within the context of lead identification research, providing detailed methodologies, interpretation guidelines, and practical implementation protocols to empower researchers in their virtual screening workflows.
Theoretical Foundations of Key Validation Metrics
Statistical Underpinnings and Calculation Methods
The validation of pharmacophore models relies on establishing their ability to selectively identify active compounds (true positives) while rejecting inactive ones (true negatives) from a database containing both categories. This process requires a validation dataset with known actives and decoys (presumed inactives) to calculate performance metrics [5] [6].
The fundamental statistical measures used in pharmacophore validation include:
- True Positives (TP): Active compounds correctly identified by the model
- False Positives (FP): Inactive compounds incorrectly identified as active
- True Negatives (TN): Inactive compounds correctly rejected
- False Negatives (FN): Active compounds incorrectly rejected
These fundamental measures combine to calculate the core validation metrics. The following table summarizes the key formulas and their significance in model evaluation.
Table 1: Fundamental Validation Metrics for Pharmacophore Models
| Metric | Formula | Interpretation | Optimal Range |
|---|---|---|---|
| Sensitivity (Recall) | ( \frac{TP}{(TP + FN)} \times 100 ) | Model's ability to identify true actives | Higher values preferred (ideally >80%) |
| Specificity | ( \frac{TN}{(TN + FP)} \times 100 ) | Model's ability to reject inactives | Higher values preferred (ideally >80%) |
| Enrichment Factor (EF) | ( \frac{TP / N{selected}}{A / N{total}} ) | Early recognition capability | 1=random, >1=enriched, higher is better |
| GH Score | ( \left( \frac{3}{4} \times \frac{Ha + D}{A} \right) \times \left( 1 - \frac{N{selected} - Ha}{N{total} - A} \right) ) | Overall goodness of hit list | 0-1 scale, >0.7=excellent, <0.3=poor |
Interrelationships and Complementary Nature
These validation metrics provide complementary insights into model performance. While EF emphasizes early enrichment—particularly valuable in virtual screening where only the top-ranked compounds are typically selected for further study—it can be misleading if used alone, as it doesn't account for the comprehensiveness of active retrieval. The GH score addresses this limitation by incorporating both the yield of actives and the false positive rate, providing a more balanced assessment of overall model performance [5]. The ROC analysis offers the most comprehensive evaluation by visualizing the trade-off between sensitivity and specificity across all possible classification thresholds, with the Area Under the Curve (AUC) quantifying overall discriminatory power [39].
Experimental Protocols for Metric Calculation
Database Preparation and Curation
The first critical step in pharmacophore validation involves preparing a high-quality validation dataset containing both known active compounds and decoy molecules:
Active Compound Collection: Compile a set of molecules with experimentally verified activity against the target. For FAK1 kinase validation, one study utilized 114 active compounds downloaded from the DUD-E database [5]. The activities should span a reasonable range (e.g., IC~50~ values from nM to μM) to reflect real-world screening scenarios.
Decoy Selection: Curate a set of presumed inactive molecules with similar physicochemical properties to the actives but different 2D topology to avoid artificial enrichment. The DUD-E database provides carefully designed decoy sets; for the FAK1 study, 571 decoys were used [5]. The decoy-to-active ratio should ideally be 35:1 or higher to simulate realistic screening conditions.
Database Assembly and Curation: Combine actives and decoys into a single screening database. Remove duplicates and ensure structural integrity through energy minimization and standardization of tautomer/ionization states.
Pharmacophore Screening and Metric Calculation
Once the validation database is prepared, the following protocol enables calculation of all key validation metrics:
Pharmacophore Screening: Screen the entire validation database against the pharmacophore model using software such as Pharmit [5], Phase [6], or similar tools. Record the fit score for each compound.
Ranking and Threshold Application: Rank all compounds in descending order based on their fit scores. Apply a threshold to select the top-ranking compounds (typically 1-5% of the total database size).
Metric Calculation Protocol:
- Identify True Positives: From the selected compounds, count how many are known actives (Ha)
- Calculate Sensitivity: ( \text{Sensitivity} = (Ha / A) \times 100 ), where A is the total number of actives in the database
- Calculate Specificity: Determine the number of true negatives and false positives to compute specificity
- Compute Enrichment Factor: [ \text{EF} = \frac{(Ha / N{selected})}{(A / N{total})} ] where N~selected~ is the number of compounds selected, and N~total~ is the total number of compounds in the database
- Calculate GH Score: [ \text{GH} = \left( \frac{Ha \times (3A + N{total})}{4 \times A \times N{selected}} \right) \times \left( 1 - \frac{N{selected} - Ha}{N{total} - A} \right) ]
- Generate ROC Curve: Plot the true positive rate (sensitivity) against the false positive rate (1-specificity) at various classification thresholds
Model Selection: Compare these metrics across multiple pharmacophore hypotheses to select the optimal model for virtual screening. In the FAK1 study, six different pharmacophore models were evaluated using these metrics before selecting the most statistically reliable one [5].
Diagram 1: Pharmacophore model validation workflow showing the sequential steps from database preparation to model selection based on multiple validation metrics.
Case Studies in Lead Identification Research
FAK1 Inhibitor Discovery
In a 2025 study targeting Focal Adhesion Kinase 1 (FAK1), researchers employed rigorous pharmacophore validation to identify novel anticancer compounds [5]. The team developed structure-based pharmacophore models from the FAK1-P4N complex (PDB ID: 6YOJ) and generated six distinct pharmacophore hypotheses. Each model was validated using a dataset of 114 known active FAK1 inhibitors and 571 decoy molecules from the DUD-E database. The validation metrics revealed significant performance differences between the models, with the top-performing model achieving excellent GH scores and enrichment factors, successfully balancing sensitivity (ability to find true actives) and specificity (ability to reject inactives). This validated model was subsequently used to screen the ZINC database, identifying four promising candidates that showed strong binding in molecular dynamics simulations and MM/PBSA calculations, with ZINC23845603 emerging as a particularly strong candidate for experimental follow-up.
FGFR1 Inhibitor Screening
A study focusing on Fibroblast Growth Factor Receptor 1 (FGFR1) inhibitors demonstrated the application of ROC analysis in pharmacophore validation [39]. Researchers developed a multiligand consensus pharmacophore model (ADRRR_2) containing five critical pharmacophoric features. During validation, they employed ROC curve analysis to quantitatively assess the model's retrieval efficiency for active molecules, comparing the false-positive rate (FPR) against the true-positive rate (TPR) across classification thresholds. The model achieved an Area Under the Curve (AUC) approaching 1.0, indicating high discriminatory power in distinguishing active from inactive compounds. This robust validation gave the team confidence to proceed with virtual screening of 9,019 anticancer compounds, ultimately identifying three hit compounds with superior FGFR1 binding affinity compared to the reference ligand.
Table 2: Research Reagent Solutions for Pharmacophore Validation
| Reagent/Resource | Type | Function in Validation | Example Sources |
|---|---|---|---|
| DUD-E Database | Curated database | Provides known actives and property-matched decoys for validation | http://dude.docking.org/ [5] |
| ZINC Database | Commercial compound library | Source of purchasable compounds for virtual screening | https://zinc.docking.org/ [5] |
| Pharmit | Web-based tool | Pharmacophore modeling, validation, and screening | http://pharmit.csb.pitt.edu [5] |
| ROC Analysis | Statistical method | Evaluates model discrimination ability across thresholds | Schrödinger Suite [39] |
| Chemical Libraries | Specialized compound collections | Targeted screening libraries (anticancer, marine natural products, etc.) | TargetMol, Asinex, Specs [6] [39] |
Advanced Applications and Methodological Extensions
Machine Learning Enhancements
Recent advances have integrated machine learning with traditional pharmacophore methods to enhance validation approaches. The PharmacoForge framework employs diffusion models to generate 3D pharmacophores conditioned on protein pockets, with performance evaluated through enrichment factors on the LIT-PCBA and DUD-E benchmarks [32]. Similarly, Alpha-Pharm3D leverages deep learning to predict ligand-protein interactions using 3D pharmacophore fingerprints, achieving AUROC values of approximately 90% across diverse datasets and demonstrating superior performance in virtual screening campaigns [75]. These AI-enhanced methods maintain the interpretability of traditional pharmacophore approaches while significantly improving screening accuracy and success rates.
Multi-Metric Decision Framework
In lead identification research, a multi-metric decision framework is essential for selecting optimal pharmacophore models. The ideal model should demonstrate:
High Early Enrichment (EF): EF at 1% of the database should be substantially greater than 1, indicating the model prioritizes true actives at the top of the ranked list
Balanced GH Score: Values should exceed 0.5, with scores above 0.7 considered excellent, indicating a good balance between comprehensive active retrieval and false positive minimization
Robust ROC Profile: The ROC curve should approach the top-left corner of the plot, with AUC values >0.8 indicating good discrimination and >0.9 indicating excellent discrimination
This multi-faceted approach ensures selected models perform well across different aspects important for successful virtual screening, ultimately improving the efficiency of lead identification pipelines in drug discovery campaigns.
The validation of pharmacophore models using Enrichment Factor, GH Score, and ROC Analysis provides a robust framework for assessing model quality before committing substantial resources to virtual screening campaigns. These complementary metrics evaluate different aspects of model performance—early recognition capability, balanced hit list quality, and overall discriminatory power—enabling researchers to select optimal pharmacophore models for lead identification. As computational methods continue to evolve, with AI-enhanced approaches offering improved accuracy and efficiency, these fundamental validation metrics remain essential for ensuring the success of structure-based drug discovery efforts. By implementing the protocols and case studies outlined in this technical guide, researchers can significantly enhance their virtual screening workflows, increasing the likelihood of identifying novel, potent lead compounds for therapeutic targets.
Retrospective virtual screening (VS) is a fundamental computational technique in drug discovery, designed to evaluate and validate the performance of screening methods before their application in prospective, real-world campaigns. This process tests the ability of a VS protocol—such as a pharmacophore model, a docking program, or a machine learning model—to correctly identify known active compounds from a much larger pool of decoy molecules, which are presumed to be inactive [76]. The core challenge it addresses is the accurate assessment of a method's enrichment power: its capacity to prioritize true actives early in a screening list, thereby simulating the efficient identification of novel hits from extensive chemical libraries [76] [77].
Within the context of pharmacophore-based lead identification, retrospective screening is indispensable. Pharmacophore models, which abstract the essential steric and electronic features required for molecular recognition, are either derived from a set of known active ligands (ligand-based) or from a protein-ligand complex (structure-based) [78] [6]. Before employing such a model to prospectively screen millions of compounds, researchers must first quantify its reliability. Retrospective screening provides this critical validation, ensuring that the model can genuinely discriminate between active and inactive compounds based on the defined pharmacophoric features, rather than exploiting trivial biases in the dataset [76] [5]. A well-validated pharmacophore model significantly de-risks downstream experimental efforts by increasing the probability that virtual hits will display genuine biological activity.
The Critical Role of Decoys in Benchmarking
The composition of a benchmarking dataset, particularly the selection of decoy molecules, is a critical factor that directly influences the perceived performance and validity of a virtual screening method. Decoys are molecules that are assumed to be inactive against the specific biological target of interest. They serve as realistic "distractors" in the virtual screening experiment, challenging the computational model to find the true active "needles" in a haystack of decoys [76] [77].
The fundamental goal of decoy selection is to generate molecules that are physicochemically similar to the known active compounds (making them challenging to distinguish), yet structurally dissimilar enough to have a low probability of actual binding [76] [77]. This balance is crucial. If decoys are chosen randomly from a drug-like database, they may be trivial for the VS method to discriminate because their physicochemical properties (e.g., molecular weight, logP) are significantly different from the actives. This leads to an artificial overestimation of the method's performance, a phenomenon known as "artificial enrichment" [76]. Conversely, if the decoy set inadvertently contains molecules that are structurally similar to known actives, it may include latent actives, leading to an underestimation of the method's true capability [76].
Over time, the strategies for decoy selection have evolved significantly to minimize these biases, as shown in Table 1 below.
Table 1: Evolution of Decoy Selection Methodologies in Benchmarking
| Era/Paradigm | Core Selection Strategy | Key Characteristics | Inherent Biases and Limitations |
|---|---|---|---|
| Random Selection (Early 2000s) | Random picking from filtered drug-like databases (e.g., ACD, MDDR) [76]. | Simple and fast; decoys are merely "putative inactives." | High risk of artificial enrichment due to significant physicochemical differences between actives and decoys [76]. |
| Property-Matched Decoys (Mid 2000s) | Matching decoys to actives based on key physicochemical properties like molecular weight and polarity [76]. | Reduces bias from obvious physicochemical discrimination. | Property matching alone may not be sufficient; structural topology can still lead to easy discrimination [76]. |
| Advanced Matched Decoys (DUD, DUD-E) | Matching actives and decoys on properties (MW, logP) and ensuring structural dissimilarity [76]. | Became the "gold standard"; more challenging and realistic for VS methods. | Potential for "false negative" decoys that are topologically similar to actives may still exist [77]. |
| Next-Generation Tools (LUDe) | Further optimization to reduce the probability of decoys being topologically similar to known actives [77]. | Aims for lower risk of artificial enrichment; open-source and locally executable. | Continuous development is needed to keep pace with new chemical space and target classes. |
This evolution highlights that the choice of decoy set is not a mere technical detail but a foundational aspect of a sound retrospective screening study. Using a poorly constructed decoy set can render the validation of a pharmacophore model meaningless and lead to costly failures in subsequent prospective screening and experimental testing.
Core Components of a Benchmarking Dataset
A robust benchmarking dataset for retrospective screening is built upon two pillars: a curated set of known active compounds and a carefully selected set of decoys.
Known Active Compounds
Active compounds are molecules with confirmed experimental activity (e.g., IC50, Ki) against the target of interest. These are typically gathered from scientific literature, patents, or public databases such as ChEMBL or PubChem BioAssay [78] [5]. For a dataset to be statistically meaningful, a sufficient number of actives is required. The Directory of Useful Decoys: Enhanced (DUD-E), for example, provides actives for over 100 protein targets, which can serve as a valuable resource [5]. In a study targeting Focal Adhesion Kinase 1 (FAK1), researchers used 114 active compounds from DUD-E to validate their pharmacophore model [5].
Decoy Compounds
As previously established, decoys are putative inactive compounds. The state-of-the-art approach is to use automated tools that generate decoys matched to the active set. Key tools include:
- DUD-E: A widely used benchmark that generates decoys matched to actives on molecular weight, calculated logP, number of hydrogen bond donors/acceptors, and charge, while ensuring they are topologically dissimilar [76] [5].
- LUDe (LIDEB's Useful Decoys): An open-source tool designed as an evolution of DUD-E, aiming to further reduce the risk of artificial enrichment by minimizing the generation of decoys that are topologically similar to actives. It can be run locally, making it suitable for large datasets [77].
The process of building the final benchmarking database involves mixing the confirmed active compounds with the generated decoys at a specific ratio, typically ranging from 1:10 to 1:100 or higher (actives:decoys), to mimic the low hit-rate reality of high-throughput screening [76] [77].
Quantitative Performance Metrics
Once a retrospective VS run is completed, several statistical metrics are used to quantitatively evaluate the model's performance. The following metrics are fundamental, with their calculations detailed in Table 2.
Table 2: Key Metrics for Evaluating Retrospective Screening Performance
| Metric | Formula | Interpretation |
|---|---|---|
| Sensitivity (Recall) | ( \text{Sensitivity} = \left( \frac{Ha}{A} \right) \times 100 ) [5] | The ability of the model to correctly identify true actives. A high value indicates most actives were found. |
| Specificity | ( \text{Specificity} = \left( \frac{N - Hd}{N} \right) \times 100 ) [5] | The ability of the model to correctly reject decoys. A high value indicates few false positives. |
| Enrichment Factor (EF) | ( \text{EF} = \frac{(Ha / Ht)}{(A / D)} ) [76] [5] | Measures how much more concentrated the actives are in the hit list compared to a random distribution. An EF of 10 means a 10-fold enrichment. |
| Goodness of Hit (GH) | ( \text{GH} = \left( \frac{Ha (3A + Ht)}{4 Ht A} \right) \times \left( 1 - \frac{Ht - Ha}{D - A} \right) ) [5] | A composite score that balances the yield of actives and the false positive rate. Ranges from 0 (null model) to 1 (perfect model). |
Legend for the formulas:
- ( Ha ): Number of active compounds in the hit list.
- ( A ): Total number of active compounds in the database.
- ( Hd ): Number of decoy compounds in the hit list.
- ( N ): Total number of decoy compounds in the database.
- ( Ht ): Total number of hits (( Ha + Hd )).
- ( D ): Total number of compounds in the database (( A + N )).
In practice, performance is often assessed using Enrichment Factor (EF) at a specific threshold (e.g., EF1% or EF10%), which evaluates the model's ability to "early recognize" actives. Additionally, Receiver Operating Characteristic (ROC) curves and the Area Under the ROC Curve (AUC) provide a comprehensive view of the model's discriminative power across all possible thresholds [76].
Integrated Workflow for Pharmacophore Validation
The following diagram illustrates the complete, iterative workflow for developing, validating, and applying a pharmacophore model through retrospective screening, integrating the concepts of dataset construction and performance evaluation.
Case Study: FAK1 Inhibitor Identification
A 2025 study on identifying Focal Adhesion Kinase 1 (FAK1) inhibitors provides a clear example of this workflow in action [5].
- Pharmacophore Model Generation: Researchers created a structure-based pharmacophore model from the FAK1-P4N co-crystal structure (PDB: 6YOJ) using the Pharmit server. The model highlighted critical interactions in the binding pocket.
- Benchmarking Dataset: The model was validated using a dataset from the DUD-E database, containing 114 known FAK1 active compounds and 571 decoys [5].
- Validation and Metrics: Six different pharmacophore models were screened against this benchmark set. The best model was selected based on its statistical performance, including its sensitivity, specificity, and goodness of hit (GH) score [5]. This rigorous retrospective validation provided the confidence to use the model for prospective screening of the large ZINC database, leading to the identification of several promising novel FAK1 inhibitor candidates.
The Scientist's Toolkit: Essential Research Reagents
The following table lists key resources and tools required for conducting rigorous retrospective screening studies.
Table 3: Essential Tools and Resources for Retrospective Screening
| Resource Category | Specific Examples | Function and Utility |
|---|---|---|
| Active Compound Databases | ChEMBL, PubChem BioAssay, BindingDB | Provide curated, experimentally confirmed active compounds for various targets to build the positive set of a benchmark [78] [5]. |
| Decoy Generation Tools | DUD-E, LUDe | Generate property-matched but structurally dissimilar decoy compounds to build the negative set of a benchmark, minimizing bias [5] [77]. |
| Pharmacophore Modeling Software | MOE (Molecular Operating Environment), LigandScout, Discovery Studio (DS) | Used to create, visualize, and run virtual screens with both structure-based and ligand-based pharmacophore models [79] [78] [6]. |
| Pharmacophore Screening Platforms | Pharmit, LigandScout | Web-based or standalone servers that allow for high-throughput pharmacophore-based screening of large chemical libraries [5] [6]. |
| Performance Analysis | Custom scripts (Python, R), built-in analysis in tools like Pharmit | Calculate critical performance metrics like Enrichment Factor (EF), ROC curves, and GH scores from screening results [76] [5]. |
Retrospective screening is a non-negotiable step in the development of reliable pharmacophore models for virtual screening. Its rigorous application ensures that computational predictions are based on genuine molecular recognition principles rather than dataset artifacts. By carefully curating benchmarking datasets with well-matched decoys from tools like DUD-E and LUDe, and by critically evaluating models with robust metrics like Enrichment Factor and GH score, researchers can significantly de-risk the drug discovery pipeline. This disciplined approach accelerates the identification of novel, potent lead compounds by ensuring that only the most predictive and robust computational models are advanced to costly experimental stages.
Virtual screening (VS) has become an indispensable tool in the modern drug discovery pipeline, designed to computationally evaluate large libraries of compounds to identify promising candidates for further experimental testing [54] [2]. Among the various VS strategies, pharmacophore-based virtual screening (PBVS) and docking-based virtual screening (DBVS) represent two of the most prominent and widely used approaches. This whitepaper provides a comparative analysis of these methodologies, framing their utility and performance within the critical context of lead identification research. A lead compound, typically a natural or chemical product with confirmed biological activity against a drug target, must be identified and optimized for characteristics like target selectivity, potency, and acceptable ADMET (Absorption, Distribution, Metabolism, Excretion, and Toxicity) properties before it can be considered a preclinical candidate [37]. The efficiency and effectiveness of the virtual screening methods used for this task directly impact the speed and cost of the entire drug discovery process.
Core Concepts and Definitions
Pharmacophore-Based Virtual Screening (PBVS)
The term "pharmacophore" was defined by the International Union of Pure and Applied Chemistry (IUPAC) as "the ensemble of steric and electronic features that is necessary to ensure the optimal supra-molecular interactions with a specific biological target structure and to trigger (or to block) its biological response" [2]. A pharmacophore model is an abstract, three-dimensional representation of these essential chemical functionalities, not of specific atoms or molecular scaffolds [2]. The most critical pharmacophore feature types include:
- Hydrogen bond acceptors (HBA)
- Hydrogen bond donors (HBD)
- Hydrophobic areas (H)
- Positively and negatively ionizable groups (PI/NI)
- Aromatic rings (AR) [2]
In PBVS, a pharmacophore model is used as a query to search large databases of small molecules to find those that possess the same spatial arrangement of chemical features, suggesting they could also interact effectively with the target and elicit a biological response [2]. Pharmacophore models can be developed through two primary approaches:
- Structure-Based Pharmacophore Modelling: This method uses the three-dimensional structure of a macromolecular target, often obtained from the Protein Data Bank (PDB). The process involves protein preparation, identification of the ligand-binding site, and generation of pharmacophore features based on the interactions between the protein and a bound ligand or from the protein structure alone [2].
- Ligand-Based Pharmacophore Modelling: This approach is employed when the 3D structure of the target protein is unknown. It develops a model based on the common steric and electronic features shared by a set of known active ligands, thereby inferring the essential characteristics required for binding [2].
Docking-Based Virtual Screening (DBVS)
Docking-based virtual screening, in contrast, involves computationally predicting the preferred orientation (the "pose") of a small molecule when bound to a target protein. DBVS relies on scoring functions to estimate the binding affinity of each molecule in a database for the target's binding site [54] [30]. This method directly simulates the physical binding process and requires a known 3D structure of the target protein. Popular docking programs include DOCK, GOLD, and Glide [54].
Performance Benchmarking: PBVS vs. DBVS
A seminal benchmark study directly compared the efficiencies of PBVS and DBVS across eight structurally diverse protein targets: angiotensin-converting enzyme (ACE), acetylcholinesterase (AChE), androgen receptor (AR), D-alanyl-D-alanine carboxypeptidase (DacA), dihydrofolate reductase (DHFR), estrogen receptor α (ERα), HIV-1 protease (HIV-pr), and thymidine kinase (TK) [54] [7]. The study constructed structure-based pharmacophore models and performed virtual screens using Catalyst for PBVS and three different docking programs (DOCK, GOLD, Glide) for DBVS.
Table 1: Key Performance Metrics from a Benchmark Study on Eight Protein Targets [54] [7]
| Virtual Screening Method | Enrichment Factor (EF) Superiority (Out of 16 Cases) | Average Hit Rate at Top 2% of Database | Average Hit Rate at Top 5% of Database |
|---|---|---|---|
| Pharmacophore-Based (PBVS) | 14 cases | Much higher | Much higher |
| Docking-Based (DBVS) | 2 cases | Lower | Lower |
The results demonstrated that PBVS consistently outperformed DBVS in the majority of test cases, achieving higher enrichment factors in 14 out of the 16 virtual screening sets (one target versus two testing databases) [54] [7]. Furthermore, when considering the top 2% and 5% of the highest-ranked compounds from the entire database, the average hit rate for PBVS was "much higher" than those achieved by any of the three docking programs [54]. This indicates that PBVS is a powerful method for prioritizing active compounds in a virtual screening campaign, making it particularly valuable for lead identification where the goal is to sift through vast chemical space to find a limited number of high-potential candidates for experimental validation.
Detailed Experimental Protocols
Protocol for Structure-Based Pharmacophore Modeling and PBVS
The following workflow, derived from benchmark studies, outlines a robust protocol for structure-based pharmacophore modeling and screening [54] [2]:
- Protein Structure Preparation: Obtain the 3D structure of the target protein, typically from the PDB. Critically evaluate and prepare the structure by correcting protonation states, adding hydrogen atoms, and addressing any missing residues or atoms [2].
- Ligand-Binding Site Characterization: Define the binding site of interest. This can be done manually if the site is known from a co-crystallized ligand or through computational tools like GRID or LUDI that analyze the protein surface to identify potential binding pockets [2].
- Pharmacophore Model Generation: Using software such as LigandScout, generate the initial pharmacophore features from the protein-ligand complex. The features are mapped based on the interactions between the ligand's functional groups and the complementary amino acid residues in the binding site [54] [2].
- Feature Selection and Model Refinement: The initial model may contain many features. Select only those that are essential for bioactivity by removing features that do not strongly contribute to binding energy or by identifying the most conserved interactions across multiple protein-ligand complexes if available [2].
- Virtual Screening Execution: Use the refined pharmacophore model as a 3D query in programs like Catalyst to screen a prepared database of small molecules. The output is a list of compounds that match the pharmacophore features, ranked based on their fit value [54].
Figure 1: Workflow for Structure-Based Pharmacophore Modeling and Screening
Protocol for Docking-Based Virtual Screening (DBVS)
A standard protocol for DBVS is outlined below [54] [30]:
- Protein and Ligand Database Preparation: Prepare the target protein structure from the PDB by removing water molecules and cofactors not involved in binding, adding hydrogen atoms, and assigning partial charges. Prepare the small molecule database by generating 3D structures and energy-minimizing them [54] [30].
- Binding Site Grid Generation: Define the spatial coordinates of the binding site and compute a potential energy grid around it. This grid pre-calculates the interaction energies for the docking program to use, speeding up the screening process [54].
- Molecular Docking and Pose Generation: Execute the docking simulation for each molecule in the database. The algorithm will typically generate multiple poses (potential binding orientations) for each compound within the defined binding site [54] [30].
- Pose Scoring and Ranking: Each generated pose is evaluated and assigned a score by the program's scoring function, which estimates the binding affinity. Compounds are then ranked based on their best docking score [54] [30].
Figure 2: Workflow for Docking-Based Virtual Screening
Advanced Integrations and Novel Approaches
Incorporating Molecular Dynamics for Robust Pharmacophores
A significant limitation of structure-based pharmacophore models derived from a single crystal structure is their sensitivity to a single, static snapshot of the protein-ligand complex, which may not represent its dynamic state in solution [80]. To address this, molecular dynamics (MD) simulations can be integrated to create more robust and reliable pharmacophore models. One approach involves:
- Running an MD simulation of the protein-ligand complex.
- Saving multiple snapshots from the trajectory.
- Generating a pharmacophore model for each snapshot.
- Merging them into a consensus "merged" pharmacophore model that includes all features appearing in the initial structure or any of the MD snapshots [80].
This method helps identify and prioritize features that are consistently present (and likely critical) while flagging features that appear only rarely (and may be artifacts of the crystal structure) [80]. Studies on targets like CDK-2 have shown that MD-derived pharmacophore models can improve virtual screening performance compared to models from a single static structure [81].
Machine Learning Acceleration
Machine learning (ML) is now being applied to dramatically accelerate the virtual screening process. One innovative methodology involves training ML models to predict docking scores directly from 2D molecular structures, bypassing the computationally expensive molecular docking procedure [30]. A recent study demonstrated that this approach could deliver 1000 times faster binding energy predictions than classical docking-based screening while maintaining a strong correlation with actual docking results [30]. This hybrid strategy allows for the ultra-rapid prioritization of compounds from enormous databases, which can subsequently be validated with more rigorous methods.
The Scientist's Toolkit: Essential Reagents & Software
Table 2: Key Research Reagent Solutions for Virtual Screening
| Tool Name | Type | Primary Function in VS |
|---|---|---|
| Protein Data Bank (PDB) | Database | Repository for 3D structural data of proteins and nucleic acids, serving as the primary source for structure-based methods [2]. |
| LigandScout | Software | Used for constructing structure-based and ligand-based pharmacophore models from protein-ligand complexes or ligand datasets [54]. |
| Catalyst (CATALYST) | Software | A platform for performing pharmacophore-based virtual screening using generated pharmacophore models as queries [54]. |
| DOCK, GOLD, Glide | Software | Popular molecular docking programs used for DBVS to predict ligand pose and binding affinity [54]. |
| Smina | Software | A variant of AutoDock Vina optimized for improved scoring and customizability, used in docking and ML-based VS studies [30]. |
| ZINC Database | Database | A publicly available database of commercially available compounds for virtual screening, containing over 230 million molecules [30]. |
| ChEMBL Database | Database | A manually curated database of bioactive molecules with drug-like properties, providing bioactivity data for ligand-based modeling [30]. |
Within the critical stage of lead identification, the comparative analysis reveals that pharmacophore-based and docking-based virtual screening are complementary yet distinct tools. The benchmark evidence strongly indicates that PBVS can achieve higher initial enrichment and hit rates than DBVS across a range of targets, making it an exceptionally powerful filter for rapidly identifying active chemotypes from large libraries [54] [7]. However, the choice of method is context-dependent. PBVS excels in speed and scaffold hopping, while DBVS provides detailed atomic-level binding insights. The future of virtual screening lies in the intelligent integration of these methods, enhanced by molecular dynamics for model robustness and powered by machine learning for unprecedented speed. This synergistic approach, leveraging the strengths of each methodology, promises to significantly accelerate the discovery of novel lead compounds in drug development.
Within the framework of a broader thesis on the applications of pharmacophore-based virtual screening (VS) in lead identification research, this guide addresses the critical step of experimental validation. The primary goal of pharmacophore VS is to enrich potential active molecules, or "hits," from vast chemical libraries in silico [61]. However, the ultimate proof of a model's value lies in its ability to identify compounds that demonstrate measurable biological activity in subsequent in vitro experiments [61]. This document provides an in-depth technical guide for researchers and drug development professionals, detailing the methodologies and best practices for correlating in silico pharmacophore hits with in vitro activity, thereby bridging the computational and experimental realms.
Foundational Principles of Pharmacophore Modeling
A pharmacophore is defined by the International Union of Pure and Applied Chemistry (IUPAC) as "the ensemble of steric and electronic features that is necessary to ensure the optimal supramolecular interactions with a specific biological target structure and to trigger (or to block) its biological response" [61] [60] [2]. It is an abstract model that represents key interaction patterns rather than specific chemical structures [60].
Pharmacophore Feature Types and Generation Approaches
The following diagram illustrates the two primary approaches for pharmacophore model generation and their integration with the validation workflow.
Approach 1: Structure-Based Pharmacophore Modeling This method relies on the three-dimensional structure of the macromolecular target, often obtained from the Protein Data Bank (PDB) [61] [2]. The process involves:
- Protein Preparation: Critical evaluation and optimization of the target structure, including protonation states and correction of any structural errors [2].
- Binding Site Detection: Identification of the ligand-binding pocket using tools like GRID or LUDI, which analyze the protein surface for energetically favorable interaction points [2].
- Feature Generation and Selection: Extraction of pharmacophore features (e.g., hydrogen bond donors/acceptors, hydrophobic areas) from the interactions between the binding site and a native ligand or directly from the amino acid residues lining the cavity. The most essential features for bioactivity are selected for the final model [2].
Approach 2: Ligand-Based Pharmacophore Modeling When the 3D structure of the target is unavailable, this approach uses a set of known active ligands [2] [82].
- Training Set Selection: A collection of structurally diverse, highly active molecules is assembled. The activity data should originate from direct interaction assays (e.g., enzyme inhibition) on isolated proteins to ensure reliability [61] [83].
- Common Feature Identification: The 3D structures of these active ligands are aligned, and their common chemical features are identified to form the pharmacophore hypothesis [61].
Model Refinement and Theoretical Validation
Initial models typically require refinement to improve their discriminatory power. This involves adjusting feature tolerances, adding exclusion volumes (to mimic the protein's steric constraints), and defining features as optional [61]. The model's quality is then assessed theoretically using validation datasets containing both active and inactive molecules or decoys [61]. Key performance metrics include the Enrichment Factor (EF), which measures the enrichment of active molecules in the virtual hit list compared to random selection, and the Area Under the Curve of the Receiver Operating Characteristic plot (ROC-AUC) [61].
Case Studies: From Virtual Screening to Validated Hits
Prospective virtual screening studies demonstrate the real-world application and success of pharmacophore models. The table below summarizes quantitative results from selected case studies.
Table 1: Prospective Virtual Screening Case Studies and Experimental Outcomes
| Target Protein(s) | Screening Database | Number of Hits Tested In Vitro | Number of Active Compounds | Hit Rate | Potency (IC₅₀) Range | Primary Application |
|---|---|---|---|---|---|---|
| CYP11B1 & CYP11B2 [83] [82] | SPECS database | 24 | 5 | 20.8% | Submicromolar to 2.5 µM | Identification of novel & selective inhibitors for Cushing's syndrome & hypertension |
| SARS-CoV-2 Spike Protein [84] | Library of 53 compounds from Rue herb | 12 (virtual hits) | 4 (validated leads) | 33.3% (from virtual hits) | N/A (binding energy: -8.0 to -9.2 kcal/mol) | Identification of natural inhibitors blocking viral entry |
Case Study 1: Discovery of CYP11B1 and CYP11B2 Inhibitors A ligand-based pharmacophore model was developed to identify inhibitors of cytochrome P450 enzymes CYP11B1 and CYP11B2, targets for treating Cushing's syndrome and hypertension [83] [82]. Virtual screening of the SPECS database yielded 24 hits for in vitro testing. Experimental validation confirmed five active compounds: three potent dual inhibitors in the submicromolar range, one selective CYP11B1 inhibitor (IC₅₀ = 2.5 µM), and one selective CYP11B2 inhibitor (IC₅₀ = 1.1 µM) [83] [82]. The overall hit rate of 20.8% significantly surpasses the typical hit rate of random high-throughput screening (often <1%), underscoring the model's strong predictive power [61] [83].
Case Study 2: Identification of Natural SARS-CoV-2 Spike Protein Inhibitors A structure-based pharmacophore model was built targeting the SARS-CoV-2 Spike protein to find natural compounds that block its interaction with the human ACE2 receptor [84]. After screening a library of 53 compounds from Rue herb, 12 virtual hits were identified. Subsequent molecular docking, MD simulations, and in vitro MTT and plaque assays validated four lead compounds (Amentoflavone, Agathisflavone, Vitamin P, and Daphnoretin) with strong binding energies and antiviral efficacy, demonstrating the utility of pharmacophore models for rapidly identifying potential therapeutics during a health emergency [84].
Experimental Validation Protocols
Correlating in silico predictions with real-world activity requires a rigorous, multi-stage experimental workflow. The following diagram outlines the key phases from initial biological testing to the final confirmation of activity.
Phase 1: PrimaryIn VitroAssay
The first and most crucial step is to test the purchased or synthesized virtual hits in a primary, target-based biochemical assay.
- Methodology: This typically involves a direct binding assay or an functional assay measuring the inhibition or activation of the target protein. For example, an enzyme inhibition assay using purified or recombinant protein to measure the compound's ability to block enzymatic activity [61] [83].
- Key Considerations:
- Use a concentration that is physiologically relevant (e.g., 10 µM) as an initial single-point screen.
- The assay should be robust, with a high signal-to-noise ratio and a low coefficient of variation, to reliably distinguish active from inactive compounds.
- Compounds showing significant activity (e.g., >50% inhibition at the test concentration) are considered "confirmed hits" and progress to the next phase.
Phase 2: Hit Confirmation and Dose-Response Analysis
Confirmed hits are re-tested in a dose-response manner to determine the potency of the effect.
- Methodology: A range of compound concentrations (e.g., from nanomolar to hundred-micromolar) is tested in the primary assay. The data are plotted, and a non-linear regression curve is fitted to calculate the half-maximal inhibitory/effective concentration (IC₅₀/EC₅₀) [83] [82].
- Data Analysis: The IC₅₀ value provides a quantitative measure of compound potency. This step is critical for prioritizing the most promising leads from the list of confirmed hits.
Phase 3: Selectivity and Specificity Profiling
To avoid off-target effects and potential toxicity, promising leads should be profiled for selectivity.
- Methodology: Conduct counter-screens against related targets (e.g., enzymes from the same family, such as different hydroxysteroid dehydrogenases or cytochrome P450 isoforms) [83] [82].
- Data Analysis: A selective compound will show significantly higher potency for the primary target compared to related off-targets. This step is exemplified by the identification of inhibitors selective for either CYP11B1 or the highly similar CYP11B2 [83] [82].
Phase 4: Mechanistic and Cell-Based Studies
For compounds intended to modulate cellular phenotypes, activity in a cellular context must be demonstrated.
- Methodology:
- Cell-Based Assays: These evaluate the compound's functional effect in a more physiologically relevant environment, such as its ability to inhibit viral replication in the case of the SARS-CoV-2 Spike protein inhibitors [84].
- Cytotoxicity Assessment: Assays like the MTT assay are used to determine the cytotoxic concentration (CC₅₀) of the compounds, ensuring that the observed biological activity is not due to general cell death [84].
- Data Analysis: The Selectivity Index (SI = CC₅₀ / IC₅₀) is calculated to quantify the window between efficacy and toxicity. A high SI is desirable for a potential therapeutic.
The Scientist's Toolkit: Essential Reagents and Materials
Table 2: Key Research Reagents and Solutions for Experimental Validation
| Reagent / Material | Function / Application | Technical Notes |
|---|---|---|
| Purified/Recombinant Target Protein | Essential for primary biochemical assays (e.g., enzyme inhibition studies). | Ensure protein is highly purified and retains native activity. Source from commercial vendors or express recombinantly [61]. |
| Validated Active & Inactive Control Compounds | Serve as benchmarks for assay performance and data normalization. | Known active controls validate the assay, while inactives confirm specificity. Sources include literature and commercial bioassay repositories [61]. |
| Cell Lines (Recombinant or Disease-Relevant) | Required for cell-based phenotypic assays and cytotoxicity testing. | Choose lines that endogenously express the target or are engineered to do so. Maintain strict contamination-free culture conditions [84]. |
| High-Quality Chemical Library for Screening | Source of compounds for virtual and subsequent experimental screening. | Libraries should have high chemical purity and structural diversity. Examples include the SPECS database [83] or in-house corporate collections. |
| ADME-Tox Profiling Assays | Predict pharmacokinetic properties and potential toxicity liabilities early in the process. | Includes assays for metabolic stability, plasma protein binding, Caco-2 permeability, and hERG inhibition [60]. |
Experimental validation is the critical bridge that connects in silico predictions with tangible biological activity. As demonstrated by successful case studies, a well-constructed and theoretically validated pharmacophore model can yield in vitro hit rates substantially higher than those from traditional high-throughput screening. A rigorous, multi-phase experimental protocol—progressing from primary biochemical assays to dose-response, selectivity profiling, and cell-based studies—is essential for confidently correlating computational hits with bona fide bioactive compounds. This disciplined approach ensures that the promise of pharmacophore-based virtual screening is fully realized, effectively de-risking the early stages of lead identification and accelerating the drug discovery pipeline.
Assessing the Computational Efficiency and Cost-Effectiveness of Pharmacophore VS
Within the strategic framework of modern drug discovery, the identification of novel lead compounds is a critical yet resource-intensive endeavor. This whitepaper provides a comprehensive assessment of pharmacophore-based virtual screening (VS) as a computationally efficient and cost-effective methodology for lead identification. We detail how the foundational principle of the pharmacophore—the ensemble of steric and electronic features necessary for molecular recognition—is leveraged to rapidly prioritize compounds with a high likelihood of biological activity [3]. The integration of machine learning (ML) is quantitatively demonstrated to enhance screening speed by several orders of magnitude compared to traditional structure-based methods like molecular docking [30]. This document presents structured quantitative data, detailed experimental protocols, and key resource information to equip researchers with the knowledge to deploy pharmacophore VS effectively, thereby streamlining the early drug discovery pipeline.
The high attrition rates and exorbitant costs associated with traditional drug development, which can exceed $2.6 billion and take 10–15 years per approved drug, underscore an urgent need for efficiency gains in the early discovery phases [85]. A significant challenge lies in the rapid identification of quality lead compounds from chemically vast spaces. Within this context, pharmacophore-based virtual screening has emerged as a pivotal computational technique.
A pharmacophore is defined as "the ensemble of steric and electronic features that is necessary to ensure the optimal supramolecular interactions with a specific biological target structure and to trigger (or to block) its biological response" [3]. It is an abstract representation of the key functional elements—such as hydrogen bond acceptors (HBA), hydrogen bond donors (HBD), hydrophobic regions (HYP), and charged groups—that a molecule must possess to bind to a target, rather than a specific chemical structure [6] [3]. Pharmacophore models are typically generated through one of three approaches:
- Ligand-based: Derived from a set of known active (and sometimes inactive) compounds when the 3D structure of the target is unavailable.
- Structure-based: Built from the 3D structural data of the target protein's binding site.
- Complex-based: Extracted from the structural data of protein-ligand complexes [3].
The application of these models in VS allows researchers to screen millions of compounds in silico, filtering them based on their ability to align with the essential pharmacophore features. This process dramatically narrows the pool of candidate molecules for subsequent, more resource-intensive experimental testing, such as high-throughput screening (HTS), thereby accelerating the lead identification timeline and reducing costs [86] [3].
Quantitative Benchmarking: Efficiency and Cost Data
The computational advantage of pharmacophore VS becomes evident when benchmarked against other common virtual screening methods. The following tables summarize key performance metrics.
Table 1: Computational Efficiency Comparison of Virtual Screening Methods
| Screening Method | Relative Speed | Key Efficiency Metric | Primary Cost Driver |
|---|---|---|---|
| Pharmacophore VS (ML-Accelerated) | ~1000x faster than docking | Processing of ultra-large libraries in feasible time [30] | Model training & cloud computing [87] |
| Classic Pharmacophore VS | Faster than docking | Rapid pre-filtering of large chemical libraries [88] | CPU hours for 3D conformation analysis |
| Molecular Docking | Baseline (1x) | Precise but slow pose estimation [30] | High-Performance Computing (HPC) infrastructure |
| Ultra-Large Library Docking | Slower than baseline | Requires specialized sampling & scoring [89] | Massive parallelization & storage |
Table 2: Cost and Resource Drivers in Virtual Screening
| Cost Factor | Impact on Pharmacophore VS | Impact on Docking-Based VS |
|---|---|---|
| Computational Resources | Lower; suitable for cloud-based deployment which held ~70% market share in 2024 [87] | Higher; demands significant HPC capacity for large libraries |
| Specialized Expertise | Requires medicinal & computational chemistry knowledge [87] | Requires structural biology & advanced modeling skills |
| Software & Infrastructure | Cost-effective with open-source and commercial platforms available [3] | High cost for licensed docking software and maintained HPC clusters |
| Time-to-Lead | Significantly reduced, accelerating early discovery [30] | Can be protracted due to longer calculation times |
A pivotal study on monoamine oxidase inhibitors demonstrated that an ML-accelerated pharmacophore methodology could predict binding energies 1000 times faster than classical docking-based screening [30]. This immense speedup is a key contributor to cost-effectiveness, as it directly reduces computational resource expenses and shortens project timelines. The lead optimization stage, where pharmacophore models are extensively used, dominates the application of ML in drug discovery, holding approximately 30% of the market share [87], highlighting its strategic importance in the costly process of refining drug candidates.
Experimental Protocols for Implementation
To ensure reproducibility and practical application, this section outlines detailed protocols for core pharmacophore VS workflows.
Protocol 1: Ligand-Based Pharmacophore Model Generation and Validation
This protocol is applicable when a set of known active ligands is available, but the protein structure is not.
Compound Selection and Preparation:
- Select a training set of 10-20 chemically diverse compounds with known high potency (e.g., low IC50 or Ki values) against the target [6].
- Draw 2D structures and convert them into 3D models using software like BIOVIA Discovery Studio [6].
- Perform conformational analysis to generate a set of low-energy 3D conformers for each molecule to account for flexibility.
Feature Identification and Hypothesis Generation:
- Use the "Feature Mapping" protocol (e.g., in Discovery Studio) to identify common chemical features present in the training set (HBA, HBD, HYP, etc.) [6].
- Employ the "Common Feature Generation" protocol (e.g., HipHop in Catalyst) to generate multiple pharmacophore hypotheses. The algorithm aligns the training set compounds and identifies the 3D arrangement of features common to all active molecules.
Model Selection and Validation:
- Select the top-ranked hypothesis based on statistical parameters (e.g., rank score, fit value) and visual inspection of ligand alignment [6].
- Validate the model using the Güner-Henry (GH) method:
- Screen a large database of compounds spiked with known actives and inactives.
- Calculate metrics like enrichment factor (EF) and the GH score to quantify the model's ability to prioritize active compounds [6].
Protocol 2: Structure-Based Pharmacophore Generation from a Protein Complex
This protocol is used when a high-resolution 3D structure of the target protein, often with a bound ligand, is available.
Protein-Ligand Complex Preparation:
- Obtain a crystal structure from the Protein Data Bank (PDB) [30].
- Prepare the structure by removing water molecules and co-crystallized ligands, then adding hydrogen atoms and assigning partial charges.
Pharmacophore Feature Extraction:
- Import the prepared protein-ligand complex into software such as LigandScout [3].
- The software automatically analyzes the non-covalent interactions (hydrogen bonds, hydrophobic contacts, ionic interactions) between the ligand and the protein binding site.
- These interactions are translated into corresponding pharmacophore features (e.g., an H-bond from a protein residue to the ligand becomes an HBA or HBD feature in the model).
Model Refinement and Export:
- Manually refine the generated features to eliminate redundancies or artifacts.
- Export the final 3D pharmacophore model for use in virtual screening.
Protocol 3: Machine Learning-Accelerated, Pharmacophore-Constrained Virtual Screening
This advanced protocol combines the interpretability of pharmacophores with the speed of ML for screening gigascale chemical spaces.
Data Set Curation and Docking:
Machine Learning Model Training:
- Encode the compounds using molecular fingerprints or descriptors.
- Train an ensemble ML model (e.g., using random forest or neural networks) to predict the docking score based on the molecular encoding. This model learns to approximate the docking process without performing it explicitly [30].
Pharmacophore-Constrained Screening and Hit Identification:
- Apply a validated pharmacophore model as a constraint to filter a large database (e.g., ZINC), retaining only molecules that match the essential feature arrangement [30].
- Use the trained ML model to rapidly predict docking scores for the pharmacophore-filtered compounds.
- Prioritize the top-ranked compounds for synthesis and experimental validation (e.g., in vitro enzyme inhibition assays) [30].
Visual Workflows and Signaling Pathways
The following diagrams, generated using Graphviz DOT language, illustrate the core logical workflows and concepts described in this whitepaper.
Diagram 1: High-Level Workflow for Pharmacophore-Based Lead Identification. This chart outlines the strategic decision-making process from target selection to experimental validation.
Diagram 2: Efficiency Comparison: Traditional Docking vs. ML-Accelerated Pharmacophore Screening. This diagram highlights the critical path where machine learning dramatically accelerates the screening process.
Successful implementation of a pharmacophore-based screening campaign relies on a suite of computational tools and data resources.
Table 3: Key Research Reagent Solutions for Pharmacophore-Based Screening
| Resource Category | Specific Examples | Function and Utility in Pharmacophore VS |
|---|---|---|
| Software Platforms | BIOVIA Discovery Studio, LigandScout, Phase (Schrödinger) | Used for building, visualizing, validating, and screening with 2D/3D pharmacophore models [6] [3]. |
| Chemical Libraries | ZINC, ChEMBL, Asinex, Specs | Provide vast, often drug-like, small molecules for virtual screening. The ZINC database is a widely used free resource [30] [6]. |
| Protein Structure Data | Protein Data Bank (PDB) | The primary repository for 3D protein structures, essential for structure-based pharmacophore modeling [30] [3]. |
| Bioactivity Data | ChEMBL, PubChem | Databases of experimentally determined biological activities for small molecules, crucial for ligand-based model training and validation [30] [6]. |
| Machine Learning Tools | Scikit-learn, TensorFlow, PyTorch | Libraries for building ML models to predict activity or docking scores, integrating with pharmacophore filtering for accelerated screening [30]. |
| Computing Infrastructure | Cloud Computing (e.g., AWS, Azure), HPC Clusters | Provide the necessary computational power for large-scale virtual screening and ML model training. Cloud-based deployment held ~70% market share in 2024 [87]. |
Pharmacophore-based virtual screening stands as a pillar of computational efficiency and cost-effectiveness in contemporary lead identification research. By abstracting the essential features required for biological activity, it enables the rapid triaging of ultralarge chemical spaces that are otherwise prohibitive to screen with slower, albeit more precise, methods like molecular docking. The integration of machine learning, as quantitatively demonstrated, creates a synergistic workflow that can accelerate screening by orders of magnitude without sacrificing the interpretability inherent to the pharmacophore concept. As drug discovery continues to grapple with rising costs and timelines, the strategic adoption and continued refinement of these methodologies will be paramount for researchers and drug development professionals aiming to bring new therapeutics to patients faster and more economically.
Conclusion
Pharmacophore virtual screening stands as a powerful and versatile strategy that significantly accelerates the lead identification phase of drug discovery. By abstracting key molecular interaction features, it provides an efficient framework for navigating expansive chemical spaces and identifying promising candidates with desired biological activity. The integration of AI and deep learning, as evidenced by tools like PharmacoForge and PGMG, is pushing the boundaries of the possible, enabling more sophisticated, automated, and effective screening campaigns. Successful applications in targeting diseases from lymphatic filariasis to HIV and cancer underscore its practical impact. As the field evolves, the future of pharmacophore VS lies in its deeper integration with multi-scale modeling, experimental data, and AI-driven generative design, promising to further streamline the path from concept to clinic and deliver novel therapeutics for patients in need.
References
- 1. Pharmacophore [https://en.wikipedia.org/wiki/Pharmacophore]
- 2. Drug Design by Pharmacophore and Virtual Screening ... [https://pmc.ncbi.nlm.nih.gov/articles/PMC9145410/]
- 3. Pharmacophore - an overview [https://www.sciencedirect.com/topics/medicine-and-dentistry/pharmacophore]
- 4. Recent advances in molecular representation methods and ... [https://www.nature.com/articles/s44386-025-00017-2]
- 5. Structure-based identification of novel FAK1 inhibitors ... [https://www.nature.com/articles/s41598-025-23203-8]
- 6. Pharmacophore-Oriented Identification of Potential Leads ... [https://pmc.ncbi.nlm.nih.gov/articles/PMC9784205/]
- 7. Pharmacophore-based virtual screening versus docking ... [https://www.nature.com/articles/aps2009159]
- 8. Applications of the Novel Quantitative Pharmacophore ... [https://www.semanticscholar.org/paper/Applications-of-the-Novel-Quantitative-Activity-in-Kohlbacher-Schmid/a1c3692059819932745fb0d33cdc27e37baf3969]
- 9. Pharmacophore modeling and applications in drug discovery [https://www.sciencedirect.com/science/article/abs/pii/S135964461000111X]
- 10. Structure based pharmacophore modeling, virtual ... [https://www.nature.com/articles/s41598-021-83626-x]
- 11. Structure-based pharmacophore modeling 2. Developing a ... [https://www.sciencedirect.com/science/article/abs/pii/S1093326323000864]
- 12. A structure-based framework for selective inhibitor design ... [https://pmc.ncbi.nlm.nih.gov/articles/PMC11903766/]
- 13. QPHAR: quantitative pharmacophore activity relationship [https://jcheminf.biomedcentral.com/articles/10.1186/s13321-021-00537-9]
- 14. A pharmacophore-guided deep learning approach for ... [https://www.nature.com/articles/s41467-023-41454-9]
- 15. Pharmacophore [https://grokipedia.com/page/Pharmacophore]
- 16. Pharmacophores | Medicinal Chemistry Class Notes [https://fiveable.me/medicinal-chemistry/unit-4/pharmacophores/study-guide/31XPo2LTA1t5A7Fx]
- 17. What is pharmacophore modeling and its applications? [https://synapse.patsnap.com/article/what-is-pharmacophore-modeling-and-its-applications]
- 18. Pharmacophore modeling in drug design [https://www.sciencedirect.com/science/article/abs/pii/S1054358925000109]
- 19. interactive exploration of chemical space [https://pharmit.csb.pitt.edu/help.html]
- 20. E-FTMap: A Protein Structure Based Pharmacophore ... [https://pubmed.ncbi.nlm.nih.gov/40133782/]
- 21. Pharmacophore-Oriented Identification of Potential Leads ... [https://www.mdpi.com/1422-0067/23/24/16122]
- 22. Applications of the Novel Quantitative Pharmacophore Activity ... [https://pmc.ncbi.nlm.nih.gov/articles/PMC9504690/]
- 23. Knowledge-guided diffusion model for 3D ligand ... [https://www.nature.com/articles/s41467-025-57485-3]
- 24. ELIXIR-A: An Interactive Visualization Tool for Multi-Target ... [https://pmc.ncbi.nlm.nih.gov/articles/PMC9025992/]
- 25. A Combination of Pharmacophore-Based Virtual Screening ... [https://pmc.ncbi.nlm.nih.gov/articles/PMC9146354/]
- 26. Pharmacophore-based approach for the identification of ... [https://www.sciencedirect.com/science/article/pii/S266702242500012X]
- 27. Pharmacophore identification and quantitative bioactivity ... [https://pubmed.ncbi.nlm.nih.gov/12871060/]
- 28. A New Fragment‐Based Pharmacophore ... Virtual Screening [https://pmc.ncbi.nlm.nih.gov/articles/PMC12412281/]
- 29. 3.2. Pharmacophore-Based Virtual Screening [https://bio-protocol.org/exchange/minidetail?id=7580127&type=30]
- 30. Machine learning accelerates pharmacophore-based ... [https://www.nature.com/articles/s41598-024-58122-7]
- 31. - virtual · GitHub Topics · GitHub screening [https://github.com/topics/virtual-screening]
- 32. PharmacoForge: pharmacophore generation with diffusion ... [https://www.frontiersin.org/journals/bioinformatics/articles/10.3389/fbinf.2025.1628800/full]
- 33. pharmacophore generation with diffusion models - PMC [https://pmc.ncbi.nlm.nih.gov/articles/PMC12451294/]
- 34. Deep generative design with 3D pharmacophoric constraints [https://pmc.ncbi.nlm.nih.gov/articles/PMC8580048/]
- 35. Approaches to Scaffold Hopping for Identifying New ... [https://pubmed.ncbi.nlm.nih.gov/41208066/]
- 36. ChemBounce: a computational framework for scaffold hopping ... [https://pmc.ncbi.nlm.nih.gov/articles/PMC12449259/]
- 37. Lead Optimization in Drug Discovery | Danaher Life Sciences [https://lifesciences.danaher.com/us/en/library/lead-optimization-drug-discovery-guide.html]
- 38. Application scenario-oriented molecule generation ... [https://www.sciencedirect.com/science/article/abs/pii/S1046202323002190]
- 39. Discovery of Novel FGFR1 Inhibitors via Pharmacophore ... [https://www.mdpi.com/2813-3137/3/4/35]
- 40. Scaffold Replacement with SeeSAR and infiniSee [https://www.biosolveit.de/application-academy/scaffold-replacement/]
- 41. Antifilarial treatment strategies: a systematic review and ... [https://pmc.ncbi.nlm.nih.gov/articles/PMC12084920/]
- 42. Recent Insights in Multi‐Target Drugs in Pharmacology and ... [https://pmc.ncbi.nlm.nih.gov/articles/PMC12479389/]
- 43. Potential Anti-Filarial Molecules Against ATP Binding Site ... [https://www.semanticscholar.org/paper/d7ac4662cb0e8d4fd7fc7b782571ba9bdf660905]
- 44. Applications of the Pharmacophore Concept in Natural ... [https://pmc.ncbi.nlm.nih.gov/articles/PMC7685156/]
- 45. Validation of the Antioxidant and Enzyme Inhibitory ... [https://pmc.ncbi.nlm.nih.gov/articles/PMC8587851/]
- 46. Discovering novel antifilarial drug candidates | Stories [https://www.liverpool.ac.uk/research/news/stories/title,1506449,en.php]
- 47. How does pharmacophore work? [https://synapse.patsnap.com/article/how-does-pharmacophore-work]
- 48. CCR5 gene editing and HIV immunotherapy - PubMed Central [https://pmc.ncbi.nlm.nih.gov/articles/PMC12213807/]
- 49. Pharmacophore-Guided Generative Design of Novel Drug- ... [https://arxiv.org/html/2510.01480v1]
- 50. Revolutionizing drug discovery: Integrating artificial ... [https://www.sciencedirect.com/science/article/pii/S1359644625001618]
- 51. Binding Modes of CCR5-targetting HIV Entry Inhibitors [https://pmc.ncbi.nlm.nih.gov/articles/PMC2701198/]
- 52. Design, syntheses, and characterization of pharmacophore ... [https://www.sciencedirect.com/science/article/abs/pii/S0223523413005758]
- 53. Top Drug Discovery Software Solutions to Watch in 2025 [https://www.deepmirror.ai/post/top-drug-discovery-software-solutions-to-watch-in-2025]
- 54. Pharmacophore-based virtual screening versus docking ... [https://pmc.ncbi.nlm.nih.gov/articles/PMC4007494/]
- 55. Pharmacophore screening, molecular docking, and MD ... [https://pmc.ncbi.nlm.nih.gov/articles/PMC11926154/]
- 56. Integrated pharmacophore‐based screening and docking ... [https://www.sciencedirect.com/science/article/abs/pii/S3050475924000034]
- 57. Pharmacophore modelling based virtual screening and ... [https://www.nature.com/articles/s41598-024-63555-1]
- 58. Pharmacophore modeling, molecular docking, MMGBSA ... [https://www.sciencedirect.com/science/article/pii/S2468227625001048]
- 59. Pharmacophore modeling in drug design [https://pubmed.ncbi.nlm.nih.gov/40175047/]
- 60. Pharmacophore modeling: advances, limitations, and ... [https://www.dovepress.com/pharmacophore-modeling-advances-limitations-and-current-utility-in-dru-peer-reviewed-fulltext-article-JRLCR]
- 61. Concepts and Applications Exemplified on Hydroxysteroid ... [https://pmc.ncbi.nlm.nih.gov/articles/PMC6332202/]
- 62. Top 7 pitfalls to avoid in early-stage Drug Discovery [https://drugmarvel.wordpress.com/2023/09/19/top-7-pitfalls-to-avoid-in-early-stage-drug-discovery/]
- 63. Ligand-based pharmacophore modeling targeting the ... [https://www.sciencedirect.com/science/article/pii/S2950363924000218]
- 64. In-Silico discovery of novel cephalosporin antibiotic ... [https://pmc.ncbi.nlm.nih.gov/articles/PMC12167095/]
- 65. How to approach machine learning-based prediction of ... [https://pmc.ncbi.nlm.nih.gov/articles/PMC9901167/]
- 66. Deep learning pipeline for accelerating virtual screening in ... [https://www.nature.com/articles/s41598-024-79799-w]
- 67. Pharmacophore modeling using Site-Identification by ... [https://pmc.ncbi.nlm.nih.gov/articles/PMC4339487/]
- 68. Building shape-focused pharmacophore models for effective ... [https://jcheminf.biomedcentral.com/articles/10.1186/s13321-024-00857-6]
- 69. Conformations and 3D pharmacophore searching [https://www.sciencedirect.com/science/article/abs/pii/S1740674910000326]
- 70. Conformational sampling of druglike molecules with MOE ... [https://pubmed.ncbi.nlm.nih.gov/18763758/]
- 71. Top 5 Drug Discovery Trends 2025 Driving Breakthroughs [https://www.pelagobio.com/cetsa-drug-discovery-resources/blog/drug-discovery-trends-2025/]
- 72. Structure-based molecular modeling in SAR analysis and ... [https://pmc.ncbi.nlm.nih.gov/articles/PMC7979990/]
- 73. Phase - Schrödinger [https://www.schrodinger.com/platform/products/phase/]
- 74. Ligand and Pharmacophore based Design | BIOVIA [https://www.3ds.com/products/biovia/discovery-studio/ligand-and-pharmacophore-based-design]
- 75. Enhancing multifunctional drug screening via artificial ... [https://pubs.rsc.org/en/content/articlehtml/2025/dd/d5dd00082c]
- 76. Decoys Selection in Benchmarking Datasets [https://www.frontiersin.org/journals/pharmacology/articles/10.3389/fphar.2018.00011/full]
- 77. LIDEB's Useful Decoys (LUDe): A freely available ... [https://www.sciencedirect.com/science/article/pii/S2667318525000054]
- 78. Hierarchical Graph Representation of Pharmacophore ... [https://pmc.ncbi.nlm.nih.gov/articles/PMC7793842/]
- 79. Development of a novel pharmacophore model to screen ... [https://pmc.ncbi.nlm.nih.gov/articles/PMC9398911/]
- 80. Evaluating the stability of pharmacophore features using ... [https://www.sciencedirect.com/science/article/abs/pii/S0006291X1630081X]
- 81. Comparing molecular dynamics-derived pharmacophore ... [https://www.sciencedirect.com/science/article/abs/pii/S2405830020301920]
- 82. Pharmacophore Modeling and in Silico/in Vitro Screening ... [https://www.frontiersin.org/journals/chemistry/articles/10.3389/fchem.2017.00104/full]
- 83. Pharmacophore Modeling and in Silico/in Vitro Screening ... [https://pmc.ncbi.nlm.nih.gov/articles/PMC5742115/]
- 84. In-vitro and in-silico evaluation of rue herb for SARS-CoV-2 ... [https://www.sciencedirect.com/science/article/pii/S156757692401840X]
- 85. Integrating artificial intelligence in drug discovery and early ... [https://pmc.ncbi.nlm.nih.gov/articles/PMC11909971/]
- 86. What is the difference between a lead compound analysis ... [https://wysebridge.com/what-is-the-difference-between-a-lead-compound-analysis-and-a-pharmacophore-analysis-in-drug-patents]
- 87. Machine Learning in Drug Discovery Market 2025 Trends [https://www.towardshealthcare.com/insights/machine-learning-in-drug-discovery-market-sizing]
- 88. pharmacophore generation with diffusion models [https://pubmed.ncbi.nlm.nih.gov/40989749/]
- 89. Computational approaches streamlining drug discovery [https://www.nature.com/articles/s41586-023-05905-z]