One-Step vs. Two-Step RT-qPCR: Choosing the Optimal Protocol for Cancer Biomarker Analysis
This article provides a comprehensive guide for researchers and drug development professionals on selecting between one-step and two-step RT-qPCR protocols for cancer biomarker applications.
One-Step vs. Two-Step RT-qPCR: Choosing the Optimal Protocol for Cancer Biomarker Analysis
Abstract
This article provides a comprehensive guide for researchers and drug development professionals on selecting between one-step and two-step RT-qPCR protocols for cancer biomarker applications. It covers foundational principles, practical methodological workflows, and optimization strategies, supported by recent clinical validation studies. The content explores how the choice of protocol impacts sensitivity, throughput, and flexibility in detecting diverse transcriptional biomarkers, including mRNA, lncRNA, and miRNA, from various sample types such as FFPE tissues and liquid biopsies. The goal is to empower scientists with the knowledge to implement robust, reproducible RT-qPCR assays that enhance the accuracy of cancer diagnosis and prognosis.
RT-qPCR Fundamentals and Transcriptional Biomarkers in Cancer
Reverse Transcription Quantitative PCR (RT-qPCR) is a cornerstone technique in molecular biology, particularly in the advancing field of cancer biomarker research. This method allows for the sensitive detection and quantification of RNA transcripts, enabling researchers to investigate gene expression profiles associated with different cancer subtypes, treatment responses, and disease progression. The first critical consideration in any RT-qPCR experiment is the choice between a one-step or a two-step protocol. This document outlines the core principles, detailed methodologies, and practical applications of both approaches within the context of cancer research, providing a structured guide for scientists and drug development professionals.
Core Principles and Comparative Analysis
In RT-qPCR, RNA is first reverse-transcribed into complementary DNA (cDNA), which is then amplified and quantified using the polymerase chain reaction. The fundamental difference between the one-step and two-step methods lies in the execution of these two processes.
- One-step RT-qPCR: The reverse transcription and the PCR amplification are performed sequentially in a single, sealed reaction tube using a single enzyme mix [1] [2]. This method typically relies on gene-specific primers for the reverse transcription step.
- Two-step RT-qPCR: The reverse transcription and PCR amplification are performed as two separate, discrete reactions in different tubes [1] [3]. The first step generates a stable cDNA archive from the total RNA sample, and an aliquot of this cDNA is then used as a template for multiple, subsequent qPCR reactions.
The choice between these methods has profound implications for workflow, data quality, and application suitability, especially in a cancer research setting where sample material is often precious, and targets are multiple.
Table 1: Comparative analysis of one-step vs. two-step RT-qPCR
| Parameter | One-Step RT-qPCR | Two-Step RT-qPCR |
|---|---|---|
| Workflow & Throughput | Simple, fast, and amenable to high-throughput automation [1] | More time-consuming and less amenable to high-throughput workflows [1] |
| Handling & Risk | Reduced pipetting steps, minimizing hands-on time and risk of contamination [1] [3] | Increased number of pipetting steps, raising the risk of contamination and pipetting errors [1] |
| Flexibility & Optimization | Limited; reaction conditions are a compromise for both RT and PCR, preventing independent optimization [1] [3] | High; allows for separate optimization of the RT and qPCR steps for maximum sensitivity and efficiency [1] |
| cDNA Archive | No cDNA archive is created; all cDNA is consumed in the subsequent PCR [1] | A stable cDNA bank is generated, which can be stored and used for analyzing multiple targets over time [1] [3] |
| Priming Strategy | Typically uses gene-specific primers [2] [3] | Can use oligo(dT), random hexamers, gene-specific primers, or a mixture for broader cDNA representation [3] |
| Sample Requirement | Requires more RNA for multiple gene targets, as each reaction consumes a separate RNA aliquot [3] | Ideal for limited samples; a single RT reaction provides cDNA for many qPCR assays [2] [3] |
| Best Suited For | High-throughput screening of a few known targets (e.g., diagnostic viral detection) [1] [2] | Research applications analyzing many targets from a single sample (e.g., cancer biomarker panels) [1] [3] |
Detailed Experimental Protocols
Protocol for One-Step RT-qPCR
This protocol is designed for the rapid quantification of specific RNA targets, such as in the validation of a known cancer biomarker.
Materials:
- One-Step RT-qPCR commercial kit (e.g., Power SYBR Green RNA-to-CT 1-Step Kit)
- RNA template (50–500 ng total RNA per reaction)
- Gene-specific forward and reverse primers
- Nuclease-free water
- Optical reaction tubes or plates
Procedure:
- Reaction Setup: On ice, prepare a master mix for all reactions containing the one-step reaction buffer, reverse transcriptase, DNA polymerase, dNTPs, and nuclease-free water. Add gene-specific primers to the master mix.
- Aliquot and Add Template: Aliquot the master mix into the reaction tubes. Then, add the RNA template to each tube. Include no-template controls (NTC) by replacing RNA with nuclease-free water.
- Thermal Cycling: Place the reactions in a real-time PCR instrument and run the following program:
- Data Analysis: Determine the Cycle Threshold (Ct) values using the instrument's software. Relative quantification can be performed using the 2^(-ΔΔCt) method [5].
Protocol for Two-Step RT-qPCR
This protocol is ideal for comprehensive gene expression profiling, such as subtyping breast cancers based on a panel of biomarkers (e.g., ESR, PGR, HER2, Ki67) [6].
Materials:
- Reverse Transcription kit (e.g., containing reverse transcriptase, buffer, dNTPs, RNase inhibitor)
- qPCR master mix (e.g., SYBR Green or TaqMan)
- Primers (for cDNA synthesis: oligo(dT), random hexamers, or a mix; for qPCR: gene-specific)
- RNA template
- Nuclease-free water
Procedure: Step 1: cDNA Synthesis
- Primer Annealing: In a nuclease-free tube, combine 1 μg to 1 pg of total RNA [4] with primers (e.g., 500 ng of random hexamers [7]) and nuclease-free water. Heat the mixture to 70°C for 3 minutes to denature secondary structures, then immediately place on ice.
- Reverse Transcription: Add a master mix containing reaction buffer, dNTPs, DTT, RNase inhibitor, and reverse transcriptase (e.g., 200 U of Superscript II [7]). The typical reaction volume is 20–30 μL.
- Incubation: Incubate the reaction as follows:
- Storage: The synthesized cDNA can be stored at -20°C for future use.
Step 2: Quantitative PCR
- Reaction Setup: Prepare a qPCR master mix containing the qPCR buffer, DNA polymerase, dNTPs, MgCl₂, and gene-specific primers. For probe-based detection, include the appropriate fluorescent probe.
- Aliquot and Add Template: Aliquot the master mix into the reaction plates. Add a diluted aliquot (e.g., 2–5 μL) of the cDNA from Step 1 as the template.
- Thermal Cycling: Run the reactions in a real-time PCR instrument using a program such as:
- Data Analysis: Calculate the Ct values. For relative quantification, use the 2^(-ΔΔCt) method, ensuring that the amplification efficiencies of the target and reference genes are close to 100% [5].
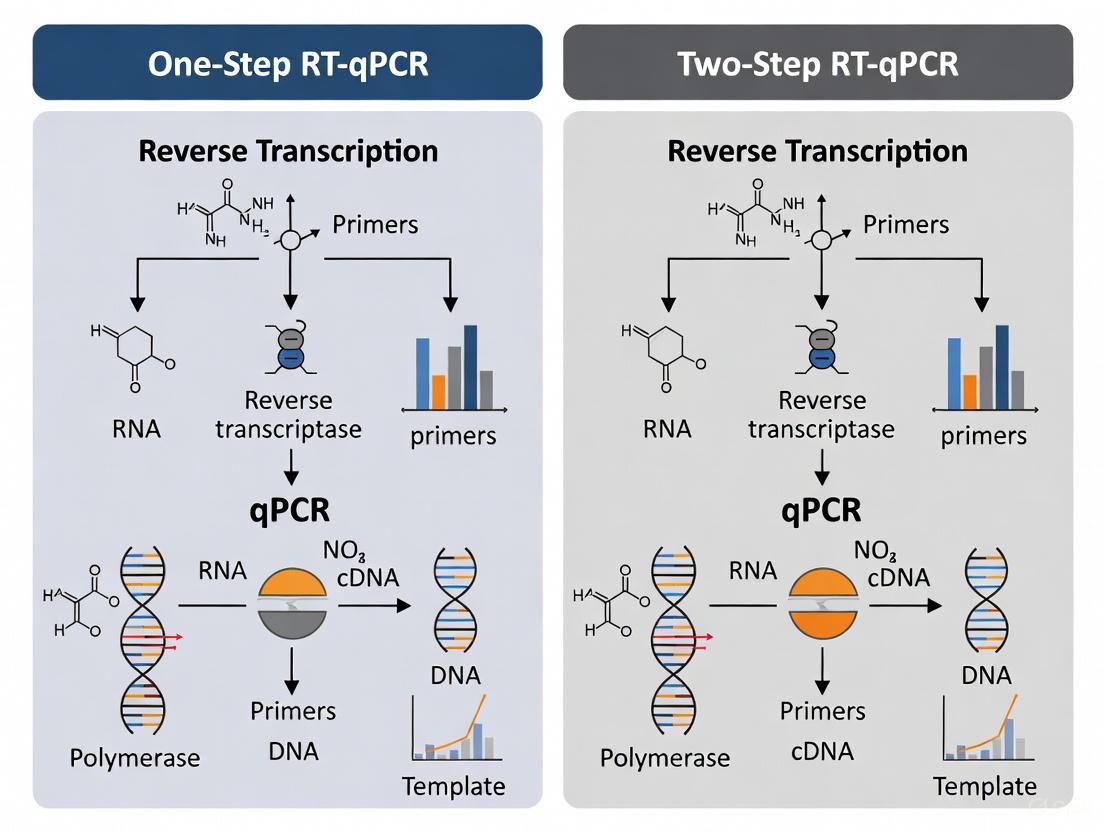
Workflow Visualization
The following diagrams illustrate the logical flow and component differences between the one-step and two-step RT-qPCR methods.
The Scientist's Toolkit: Research Reagent Solutions
The reliability of RT-qPCR data, especially in a complex field like cancer research, depends heavily on the quality of reagents used. The following table details essential materials and their functions.
Table 2: Key research reagents and materials for RT-qPCR in cancer biomarker studies
| Reagent / Material | Function / Explanation |
|---|---|
| Thermostable Reverse Transcriptase | Engineered enzymes (e.g., SuperScript IV, ThermoScript) that function at elevated temperatures. This enhances efficiency by melting RNA secondary structures and improves specificity, leading to higher cDNA yields and better representation of the transcriptome [8] [2]. |
| One-Step RT-qPCR Kit | A specialized commercial kit containing optimized blends of reverse transcriptase and thermostable DNA polymerase in a single buffer. These are ideal for high-throughput, reproducible assays of a limited number of targets and minimize hands-on time [1] [4]. |
| cDNA Synthesis Primers | Oligo(dT) Primers: Bind to the poly-A tail of mRNA, enriching for mRNA. Random Hexamers: Prime RNA at multiple sites throughout the transcriptome, useful for degraded RNA (e.g., from FFPE samples) or non-polyadenylated RNA. Gene-Specific Primers: Provide the highest sensitivity for a single target but preclude multiple assays from one RT reaction [3]. |
| qPCR Master Mix | A pre-mixed solution containing hot-start DNA polymerase, dNTPs, MgCl₂, and buffer. SYBR Green mixes intercalate with any double-stranded DNA, while TaqMan probe-based mixes offer superior specificity through a fluorescently labeled, target-specific probe, which is crucial for multiplex assays [6] [9]. |
| Sequence-Specific Primers & Probes | Oligonucleotides designed for high specificity and efficiency (~100%). For cancer biomarker panels (e.g., HER2, ESR1), primers and dual-labeled hydrolysis probes are designed to uniquely identify each transcript, often across exon-exon junctions to avoid genomic DNA amplification [6] [5]. |
| Stable Reference Genes | Genes with constant expression across experimental conditions (e.g., RPL13A, GAPDH) used for data normalization. Validation of reference gene stability is critical for accurate relative quantification in cancer tissues, as traditional "housekeeping" genes can vary [6] [5]. |
Application Notes and Protocols for Cancer Biomarker Research
Transcriptional biomarkers, including messenger RNA (mRNA), long non-coding RNA (lncRNA), and microRNA (miRNA), are indispensable tools in modern oncology. They provide critical insights into the presence, behavior, and therapeutic vulnerabilities of cancer, enabling advances in early detection, prognosis, and personalized treatment strategies [10]. The accurate quantification of these RNA species often relies on reverse transcription quantitative polymerase chain reaction (RT-qPCR). The choice between one-step and two-step RT-qPCR protocols is a critical methodological decision that impacts the efficiency, sensitivity, and applicability of biomarker research, particularly within the complex and often degraded RNA samples derived from clinical cancer specimens [11] [12].
Landscape and Clinical Utility of Transcriptional Biomarkers
Table 1: Characteristics and Cancer Applications of Transcriptional Biomarkers
| Biomarker Class | Key Characteristics | Example Cancer Functions | Representative Biomarkers & Clinical Associations |
|---|---|---|---|
| mRNA | - Protein-coding transcripts- Variable length and stability- Expression reflects direct cellular phenotype | - Oncogene activation- Tumor suppressor inactivation- Treatment target identification | - PD-L1: Predictive for immunotherapy response in NSCLC and melanoma [10].- HER2: Prognostic and predictive in breast cancer [10]. |
| lncRNA | - >200 nucleotides, non-coding- Regulate gene expression via multiple mechanisms- Can act as miRNA "sponges" (ceRNA network) | - Chromatin remodeling- Transcriptional and post-transcriptional regulation- Key roles in neurogenerative pathways | - MIAT: Identified in a ceRNA network potentially affecting cell cycle regulation [13]. |
| miRNA | - ~22 nucleotides, non-coding- High stability in tissues and circulation (e.g., plasma)- Post-transcriptional regulators of mRNA | - Modulate oncogenic pathways (e.g., PI3K-Akt, Wnt) [14]- Predictive of therapy response | - miR-16-5p, miR-93-5p, miR-126-3p: High baseline plasma levels predictive of better response and survival in advanced biliary tract cancer patients on chemoimmunotherapy [15].- miR-21: High tissue expression independently predicts worse overall survival in HCC [16]. |
Core Protocol: One-Step vs. Two-Step RT-qPCR for Biomarker Assays
The decision between one-step and two-step RT-qPCR is fundamental to experimental design in biomarker validation. The following workflow and table summarize the key considerations.
Table 2: Comparative Guide to One-Step vs. Two-Step RT-qPCR
| Parameter | One-Step RT-qPCR | Two-Step RT-qPCR |
|---|---|---|
| Workflow & Throughput | Combined RT and PCR in a single tube. Ideal for high-throughput processing of many samples [11] [12]. | Separate, optimized reactions for RT and PCR. Less amenable to high-throughput [11] [12]. |
| Priming Strategy | Uses sequence-specific primers only [11]. | Flexible: oligo(dT), random hexamers, or gene-specific primers [11]. |
| Sensitivity & Efficiency | Potentially lower sensitivity as conditions are a compromise for both reactions [12]. | Higher sensitivity; reactions can be independently optimized [12]. |
| cDNA Utility | All cDNA is consumed in the subsequent PCR; no cDNA bank is created [12]. | A stable cDNA pool is generated and can be used for multiple assays or stored long-term [11] [12]. |
| Key Advantages | - Simplified workflow, faster- Reduced pipetting errors & contamination risk- Highly reproducible [11] [12] | - Flexible priming & optimization- cDNA can be used for multiple targets- Generally more sensitive [11] [12] |
| Key Disadvantages | - Impossible to optimize reactions separately- Less sensitive- Limited targets per sample [11] [12] | - More time-consuming- Greater risk of contamination due to handling- Requires more optimization [11] [12] |
Detailed Experimental Protocol: Validating a Circulating miRNA Signature for Therapy Response
This protocol outlines the steps for identifying and validating a circulating miRNA biomarker signature predictive of response to chemoimmunotherapy, as demonstrated in advanced biliary tract cancer [15].
4.1 Sample Collection and Preparation
- Patient Cohort: Recruit patients according to a defined clinical trial protocol (e.g., patients with advanced biliary tract cancer receiving first-line nivolumab, gemcitabine, and S-1) [15].
- Sample Type: Collect peripheral blood plasma samples prospectively at baseline (pre-treatment) and at a defined timepoint after treatment initiation (e.g., 6 weeks) [15].
- RNA Isolation: Extract total RNA from plasma using Trizol reagent or a specialized commercial kit for cell-free RNA. Ensure methods are optimized for low-concentration targets [13].
4.2 miRNA Profiling and Sequencing
- Library Preparation: Construct miRNA sequencing libraries from the isolated total RNA. For a focused approach, a pre-defined panel of miRNAs (e.g., 167 miRNAs) can be used [15].
- Sequencing: Perform sequencing on a high-throughput platform (e.g., 50-bp single-end reads). Quantify expression levels using transcripts per million (TPM) for normalization [13].
- Differential Expression Analysis: Identify significantly differentially expressed miRNAs between responder (Complete Response/Partial Response) and non-responder (Stable Disease/Progressive Disease) groups using statistical packages (e.g., DEGseq R package). Apply a false discovery rate (FDR)-corrected p-value threshold (e.g., < 0.01) and a log2 fold change cutoff (e.g., > 1) [15] [13].
4.3 Machine Learning-Based Classifier Development
- Feature Selection: Select top candidate miRNAs (e.g., hsa-miR-16-5p, hsa-miR-93-5p, hsa-miR-126-3p) that are detectable in >80% of samples and show significant differential expression [15].
- Model Training & Validation: Develop an miRNA-based classifier using a machine learning approach (e.g., 10-fold cross-validation) on the initial cohort (training set). Validate the classifier's sensitivity, specificity, and accuracy using an independent patient cohort (testing set) [15].
4.4 Association with Clinical Outcomes
- Survival Analysis: Correlate the expression levels of the identified miRNA signature with patient progression-free survival (PFS) and overall survival (OS) using Kaplan-Meier curves and Cox proportional hazards models to calculate hazard ratios (HR) [15].
- Functional Enrichment Analysis: Use databases like STRING-DB and visualization tools like Cytoscape to perform functional enrichment analysis. This identifies hub genes (e.g., TP53, AKT1, MTOR) and pathways through which the miRNAs may exert their effects, linking the signature to biology [15].
The Scientist's Toolkit: Essential Reagent Solutions
Table 3: Key Reagents for Transcriptional Biomarker Research
| Reagent / Solution | Function & Application in Protocol |
|---|---|
| Trizol Reagent | A monophasic solution of phenol and guanidine isothiocyanate used for the simultaneous isolation of RNA (including miRNA), DNA, and proteins from various sample types, including cells and tissues [13]. |
| Reverse Transcriptase | Enzyme that synthesizes complementary DNA (cDNA) from an RNA template. Critical for both one-step and two-step RT-qPCR protocols [11]. |
| Sequence-Specific Primers | Short, designed oligonucleotides that bind to a specific RNA transcript. Used in one-step RT-qPCR and the PCR step of two-step RT-qPCR for target amplification [11]. |
| Oligo(dT) Primers | Short sequences of deoxythymidine nucleotides that bind to the poly-A tail of mRNAs. Used in the RT step of two-step protocols to prime coding transcripts [11]. |
| Random Hexamers | Short oligonucleotides of random sequence that bind non-specifically to RNA. Used in the RT step of two-step protocols to prime all RNA, including non-coding RNAs like miRNA and lncRNA [11]. |
| Hot-Start DNA Polymerase | A modified enzyme inactive at room temperature, preventing non-specific amplification during reaction setup. Used in the PCR step to enhance specificity and yield [11]. |
Pathway Diagram: miRNA-Mediated Regulation of Cancer Pathways
The following diagram illustrates how a validated miRNA signature can interact with key cancer-associated pathways to influence tumor biology and treatment response, as suggested by functional enrichment analyses [14] [15].
Quality Control and Adherence to MIQE 2.0 Guidelines
The rigorous validation of RT-qPCR assays is paramount for generating reliable and reproducible data, especially in a clinical research context. Adherence to the MIQE (Minimum Information for Publication of Quantitative Real-Time PCR Experiments) 2.0 guidelines is strongly recommended [17] [18]. Key considerations include:
- Sample Quality: Properly document sample handling, processing, and storage. Assess RNA integrity and quantity using appropriate methods [17].
- Assay Validation: Validate the specificity and efficiency of all qPCR assays. Efficiency should be measured, not assumed [17].
- Appropriate Normalization: Use stable, validated reference genes for data normalization. The choice of reference genes must be justified for the specific sample type and experimental condition [17].
- Transparent Reporting: Provide comprehensive methodological details to ensure experimental transparency and reproducibility [17] [18].
The evolution of molecular diagnostics has positioned nucleic acid biomarkers as powerful tools in cancer research and drug development. These biomarkers, including DNA, messenger RNA (mRNA), and non-coding RNAs (such as miRNA, circRNA, and lncRNA), offer distinct advantages over traditional protein biomarkers, primarily due to their inherent detectability at extremely low concentrations and the availability of powerful amplification techniques like PCR [19] [20].
The transition from protein-based detection methods, which have a long history dating back to the Wassermann test for syphilis in 1906, to nucleic acid-based techniques represents a significant paradigm shift [19]. This application note details these advantages, providing a focused comparison and detailed protocols to guide researchers in selecting the optimal methods for cancer biomarker analysis, specifically through the lens of one-step and two-step RT-qPCR.
Comparative Advantages of Nucleic Acid Biomarkers
Enhanced Analytical Sensitivity and Specificity
The core advantage of nucleic acid biomarkers lies in their potential for exceptional sensitivity. Techniques like digital PCR (dPCR) can achieve single-molecule sensitivity, enabling the detection of rare mutant sequences in a background of wild-type DNA, such as circulating tumor DNA (ctDNA) with a variant allele frequency (VAF) as low as 0.1%, a feat difficult to match with standard protein immunoassays [19]. This sensitivity is crucial for early cancer detection via liquid biopsy, where biomarker concentration is minimal.
Specificity is ensured by the predictable base-pairing of nucleic acids, which allows for the precise design of primers and probes to uniquely identify a target sequence. Protein detection, reliant on antibody-antigen interactions, can sometimes be hampered by cross-reactivity or the limited availability of high-quality, specific antibodies [21].
Powerful Signal and Target Amplification
A fundamental differentiator is the ability to directly amplify the nucleic acid target itself. Methods like PCR can generate millions of copies of a target sequence from a single molecule, dramatically boosting the signal [19]. Protein biomarkers, in contrast, lack a direct equivalent to PCR. While signal amplification strategies exist (e.g., digital ELISA), they cannot amplify the target molecule, ultimately limiting their sensitivity [19].
Table 1: Amplification Techniques for Nucleic Acid vs. Protein Biomarkers
| Feature | Nucleic Acid Biomarkers | Protein Biomarkers |
|---|---|---|
| Target Amplification | Yes (e.g., PCR, NGS) | Not possible |
| Signal Amplification | Yes (e.g., branched DNA assays) | Yes (e.g., ELISA, Simoa) |
| Exemplary Techniques | Digital PCR, Next-generation Sequencing | Enzyme-Linked Immunosorbent Assay (ELISA) |
| Achievable Sensitivity | Single-molecule detection (e.g., 0.1% VAF with dPCR) | <1 fM (with advanced digital ELISA) |
Cost-Efficiency and Comprehensive Profiling
RNA biomarkers can be detected at extremely low concentrations, and their analysis via techniques like next-generation sequencing offers a cost-effective way to measure genome-wide RNA expression levels [20]. This is often more economical than protein detection, which requires a specialized antibody for each target. Furthermore, the advent of massive parallel sequencing allows researchers to discover and profile a vast array of nucleic acid biomarkers—including novel non-coding RNAs and methylation patterns—from a single experiment, providing a comprehensive view of the transcriptome that is more challenging and expensive to achieve at the proteome level [20].
Core Experimental Protocol: One-Step vs. Two-Step RT-qPCR
Reverse Transcription-quantitative PCR (RT-qPCR) is the gold standard for quantifying RNA biomarkers. The critical methodological choice is between one-step and two-step protocols, a decision that impacts sensitivity, flexibility, and throughput.
Workflow and Decision Framework
The diagram below illustrates the key steps and differences between the two main RT-qPCR approaches.
Detailed Methodologies
One-Step RT-qPCR Protocol
This protocol is ideal for high-throughput applications targeting a limited number of genes [22] [11].
- Reaction Setup: In a single tube, combine:
- RNA template: 1-100 ng total RNA.
- One-Step RT-qPCR master mix: Contains reverse transcriptase, DNA polymerase, dNTPs, and reaction buffer.
- Gene-specific primers: Both forward and reverse primers for the target RNA.
- Detection chemistry: e.g., SYBR Green dye or TaqMan probes.
- Thermal Cycling: Place the tube in a real-time PCR instrument and run a unified program:
- Reverse Transcription: 50°C for 10-30 minutes.
- Enzyme Inactivation/Initial Denaturation: 95°C for 2 minutes.
- Amplification (40-50 cycles):
- Denature: 95°C for 15 seconds.
- Anneal/Extend: 60°C for 1 minute (with fluorescence acquisition).
- Data Analysis: Quantify the initial RNA amount based on the qPCR amplification curve (Cq value) using absolute or relative quantification methods.
Two-Step RT-qPCR Protocol
This protocol offers greater flexibility and is preferred for analyzing multiple targets from a single RNA sample [22] [23].
- Step 1: cDNA Synthesis
- Reaction Setup: In one tube, mix:
- RNA template: 1 µg - 1 pg total RNA.
- Reverse Transcriptase: (e.g., M-MLV or AMV).
- dNTPs.
- Primers: A choice of oligo(dT) (for mRNA), random hexamers (for total RNA, including non-coding RNAs), or gene-specific primers.
- Incubation: Typically 42°C-50°C for 30-60 minutes, followed by enzyme inactivation at 70°C-85°C. The synthesized cDNA can be stored for future use.
- Reaction Setup: In one tube, mix:
- Step 2: qPCR Amplification
- Reaction Setup: In a separate tube, combine:
- cDNA: A dilution (e.g., 1:10) of the product from Step 1.
- qPCR master mix: Contains DNA polymerase, dNTPs, and optimized buffer.
- Gene-specific primers and detection chemistry (SYBR Green or TaqMan probes).
- Thermal Cycling: Standard qPCR program (without the RT step):
- Initial Denaturation: 95°C for 3 minutes.
- Amplification (40-50 cycles): 95°C for 15 sec, 60°C for 1 minute (with fluorescence acquisition).
- Reaction Setup: In a separate tube, combine:
Table 2: Comparative Analysis of One-Step vs. Two-Step RT-qPCR
| Parameter | One-Step RT-qPCR | Two-Step RT-qPCR |
|---|---|---|
| Workflow & Throughput | Simple, fast, fewer pipetting steps. Ideal for high-throughput analysis of many samples with few targets [11] [23]. | More complex, time-consuming, multiple pipetting steps. Less amenable to high-throughput [11]. |
| Sensitivity & Efficiency | Potentially lower sensitivity as conditions are a compromise for both RT and PCR [11]. | Higher sensitivity; each step (RT and PCR) can be individually optimized for maximum efficiency [23]. |
| Flexibility & cDNA Usage | No cDNA stock generated; all cDNA is consumed in the single reaction [22]. | Stable cDNA pool is generated and can be stored for long periods, allowing analysis of multiple targets from the same sample [11] [23]. |
| Priming Strategy | Restricted to gene-specific primers only [22]. | Flexible: oligo(dT), random hexamers, or gene-specific primers can be used [11]. |
| Risk of Contamination | Lower risk, as the sample remains in a single, closed tube [22]. | Higher risk due to additional tube handling and pipetting steps [11]. |
The Scientist's Toolkit: Essential Research Reagents
Successful implementation of RNA biomarker detection relies on key reagents and materials.
Table 3: Essential Research Reagents for RT-qPCR
| Reagent/Material | Function | Application Notes |
|---|---|---|
| Reverse Transcriptase | Synthesizes complementary DNA (cDNA) from an RNA template. | Enzymes like M-MLV and AMV are commonly used. Critical for first-strand synthesis [22]. |
| Thermostable DNA Polymerase | Amplifies the cDNA target during PCR. | Often part of a master mix. Fidelity and processivity are key for accurate quantification. |
| Primers | Sequence-specific oligonucleotides that define the target to be amplified. | Gene-specific for one-step; Oligo(dT), Random Hexamers, or Gene-specific for two-step RT-qPCR [11]. |
| Fluorescent Detection Chemistry | Generates a quantifiable signal proportional to the amount of amplified DNA. | SYBR Green (binds dsDNA, cost-effective) or TaqMan Probes (sequence-specific, higher multiplexing potential) [22]. |
| RNase Inhibitors | Protects the integrity of the RNA template from degradation. | Essential for obtaining reliable and reproducible results, especially when working with low-abundance targets. |
| Magnetic Beads / Spin Columns | For solid-phase extraction and purification of RNA from complex biological samples. | Ensures high-quality RNA free of inhibitors that could compromise the RT-qPCR reaction. |
Nucleic acid biomarkers provide researchers and drug developers with a powerful and versatile platform for cancer research, offering superior sensitivity, the unique capability of target amplification, and cost-effective profiling. The choice between one-step and two-step RT-qPCR is central to exploiting these advantages. One-step RT-qPCR offers a streamlined, closed-tube workflow best suited for high-throughput studies focusing on a limited set of targets. In contrast, two-step RT-qPCR provides unmatched flexibility, sensitivity, and the ability to create a renewable cDNA resource, making it the preferred method for biomarker discovery and validation studies where analyzing multiple targets from precious sample material is paramount. Understanding these distinctions allows for the strategic design of robust and informative experiments in precision oncology.
The accurate analysis of cancer biomarkers is fundamentally dependent on the choice of sample type and the corresponding molecular methodology. Each sample type—Formalin-Fixed Paraffin-Embedded (FFPE) tissues, liquid biopsies, and stool samples—presents unique advantages, challenges, and appropriate protocol adaptations. Within this context, the decision between one-step and two-step reverse transcription quantitative PCR (RT-qPCR) methodologies becomes particularly significant, as the compatibility of each approach varies considerably across different sample matrices. FFPE tissues, while offering vast archival resources, contain fragmented and cross-linked RNA that demands specific protocol adjustments [24] [25]. Liquid biopsies, including blood samples analyzed for circulating tumor cells (CTCs) and circulating tumor DNA (ctDNA), provide a minimally invasive means for dynamic monitoring but require extremely sensitive detection methods to identify rare biomarkers [26] [27]. Stool samples, an emerging substrate for gastrointestinal cancers, contain eukaryotic RNA that holds promise for non-invasive detection but exists in a challenging environment dominated by microbial transcripts and inhibitors [28] [29]. This application note delineates detailed, optimized protocols for each sample type, framed within the critical methodological choice of one-step versus two-step RT-qPCR, to guide researchers in generating reliable and reproducible gene expression data for cancer biomarker research.
Sample Type Characteristics and Workflow Selection
The selection of an appropriate sample type is guided by research objectives, requiring a balance between clinical feasibility and analytical performance. The table below summarizes the core characteristics, applications, and methodological considerations for FFPE, liquid biopsy, and stool samples.
Table 1: Comparative Analysis of Sample Types for Cancer Biomarker Research
| Sample Type | Core Characteristics | Primary Applications | Key Methodological Challenges |
|---|---|---|---|
| FFPE Tissues | - Archival, stable samples- Fragmented, cross-linked RNA- Rich in clinical follow-up data [24] [25] | - Prognostic biomarker validation- Retrospective studies- Diagnostic sub-classification [24] | - RNA fragmentation and chemical modifications impair primer annealing [25]- Requires robust RNA extraction and sensitive detection |
| Liquid Biopsies | - Minimally invasive collection- Enables dynamic monitoring- Contains CTCs, ctDNA, exosomes [26] [27] | - Early cancer screening- Monitoring treatment response- Tracking minimal residual disease (MRD) [26] [27] | - Extremely low abundance of targets (e.g., 1-100 CTCs/mL blood) [27]- Requires high-sensitivity enrichment and detection platforms |
| Stool Samples | - Non-invasive collection- Direct contact with colonic epithelium- Rich in microbes and inhibitors [28] | - Detection of colorectal cancer (CRC)- Detection of adenomatous polyps [28] | - Low abundance of human mRNA relative to bacterial RNA [28]- Requires user-friendly extraction and highly specific detection |
The following workflow illustrates the strategic decision process for selecting and analyzing these sample types, with integrated points for the one-step vs. two-step RT-qPCR decision.
Diagram 1: Sample type selection and analytical workflow.
Detailed Protocols by Sample Type
Protocol 1: Optimized RNA Extraction and qPCR from FFPE Tissues
FFPE tissues are a cornerstone of cancer research due to their wide availability and linked clinical data. However, the formalin fixation process fragments RNA and introduces chemical modifications, necessitating a robust workflow from RNA isolation to cDNA synthesis and amplification [25].
Step 1: RNA Isolation and Quality Control
- Use specialized kits designed for FFPE material (e.g., from Qiagen or Epicentre) that incorporate extended proteinase K digestion and heat steps to reverse cross-links [25].
- Assess RNA purity by spectrophotometry (OD 260/280, with acceptable values ranging from 1.52 to 2.16) [24]. Note that RNA Integrity Number (RIN) is often low for FFPE RNA; therefore, focus on purity and amplifiability.
Step 2: cDNA Synthesis – Key Considerations for One-Step vs. Two-Step
- For Maximum Sensitivity with Two-Step RT-qPCR: Use a high-volume cDNA synthesis reaction (e.g., 100 µL) starting with 1000 ng of RNA. This approach has been shown to yield lower Ct values and lower variation within replicates compared to low-volume protocols [24]. Employ a mix of random hexamers and oligo-dT primers for whole-transcriptome conversion, or use gene-specific priming for superior sensitivity when targeting a predefined gene set [25].
- Gene-Specific Reverse Transcription: For a 48-plex gene-specific cDNA synthesis, add qPCR primers to the reverse transcription reaction at 100 nM concentration. This method can improve qPCR sensitivity by a factor of 4.0 compared to whole-transcriptome reverse transcription, enabling earlier detection by an average of 2.0 PCR cycles [25].
Step 3: qPCR Amplification
- Two-Step with Preamplification: For the most sensitive detection from FFPE material, include a targeted cDNA preamplification step using a pool of gene-specific primers. This can improve sensitivity by an average of 172-fold (7.43 PCR cycles) while maintaining gene expression ratios [25].
- Design qPCR amplicons to be short (<100 bp) to accommodate fragmented RNA [25].
- Chemistry Selection: Both Taqman probes and SYBR Green can be used effectively, with studies showing good correlation between the two chemistries [24].
Liquid Biopsies: Capturing the Dynamic Picture
Protocol 2: Targeting Circulating Tumor Cells (CTCs) and Cell-Free DNA (cfDNA)
Liquid biopsy focuses on analyzing tumor-derived components in the blood, primarily CTCs and ctDNA. Its non-invasive nature allows for repeated sampling to monitor disease progression and treatment response [26] [27].
Step 1: Sample Collection and Plasma Separation
- Collect blood into EDTA or specialized cell-stabilization tubes.
- Process samples within a few hours to prevent degradation and lysis of background blood cells.
- Centrifuge to separate plasma (for ctDNA/exosome analysis) from the cellular fraction (for CTC analysis).
Step 2: Biomarker Enrichment and Isolation
- CTC Enrichment: Due to their extreme rarity (~1-10 CTCs per mL of blood among millions of leukocytes), enrichment is critical [26].
- Immunomagnetic Methods: The CellSearch system, FDA-cleared for prognostic use in certain cancers, uses anti-EpCAM antibodies to positively select CTCs [26] [27]. A key limitation is the potential for missing EpCAM-negative CTCs that have undergone epithelial-mesenchymal transition (EMT).
- Size-Based Methods: Technologies like ISET (Isolation by Size of Epithelial Tumor Cells) use microfilters to separate larger CTCs from smaller blood cells, independent of surface marker expression [27].
- ctDNA Extraction: Use circulating nucleic acid extraction kits to isolate cfDNA from plasma. ctDNA typically constitutes only 0.1% - 1.0% of total cfDNA, requiring highly sensitive downstream detection [26].
- CTC Enrichment: Due to their extreme rarity (~1-10 CTCs per mL of blood among millions of leukocytes), enrichment is critical [26].
Step 3: Molecular Analysis and RT-qPCR Strategy
- For CTC mRNA Analysis (Two-Step RT-qPCR is Standard):
- Lyse enriched CTCs and extract total RNA.
- Perform cDNA synthesis using a two-step kit. This allows for the use of random hexamers/oligo-dT to create a stable cDNA archive from a limited cell population, which can then be used to analyze multiple genes [30] [11].
- Utilize preamplification (e.g., 10-14 cycles) of the cDNA to enable analysis of multiple transcripts from a minute starting amount.
- For ctDNA Analysis (DNA-based qPCR):
- For CTC mRNA Analysis (Two-Step RT-qPCR is Standard):
Stool Samples: A Frontier for Non-Invasive GI Cancer Detection
Protocol 3: Eukaryotic RNA Extraction and Detection from Stool
Stool contains shed colorectal epithelial cells, and their RNA expression profile can serve as a biomarker for detecting colorectal cancer (CRC) and precancerous adenomas [28].
Step 1: Sample Collection and Preservation
- Collect stool samples prior to bowel preparation for colonoscopy.
- Immediately preserve a representative aliquot in a commercial stabilizer like RNAlater to prevent RNA degradation. Store at -80°C [28].
Step 2: Optimal RNA Extraction
- A comparative study identified the Stool Total RNA Purification Kit (Norgen) as providing high RNA purity and consistent mRNA detection, making it well-suited for large-scale studies [28].
- Standardize input (e.g., 200 µL of stool/RNAlater slurry) and include rigorous bead-beating homogenization steps.
- Perform an on-column DNase treatment to remove contaminating genomic DNA.
Step 3: One-Step RT-qPCR for Streamlined Detection
- For streamlined workflow and to minimize sample handling, the Superscript III one-step RT-PCR kit (Invitrogen) has been successfully used for direct amplification from stool RNA [28].
- The one-step format is ideal for this application when the target gene panel is predefined and limited (e.g., immune genes like IL8, IL1B, PTGS2), reducing contamination risk during high-throughput screening [28] [30].
- This protocol has demonstrated the ability to distinguish CRC and adenomatous polyp samples from controls based on elevated transcript levels of specific immune genes [28].
The Core Methodological Decision: One-Step vs. Two-Step RT-qPCR
The choice between one-step and two-step RT-qPCR is a critical determinant of success in biomarker analysis. This decision must be aligned with the sample type, RNA quality, and research goals.
Table 2: Strategic Comparison of One-Step and Two-Step RT-qPCR
| Parameter | One-Step RT-qPCR | Two-Step RT-qPCR |
|---|---|---|
| Workflow | Combined RT and PCR in a single tube and buffer [30] [11] | Separate, optimized reactions for RT and PCR [30] [11] |
| Priming Strategy | Gene-specific primers only [30] [11] | Flexible: Oligo(dT), random hexamers, gene-specific, or a combination [30] [11] |
| Hands-on Time & Throughput | Minimal setup; ideal for high-throughput analysis of few targets [30] [11] | More hands-on time; better for analyzing multiple targets from few samples [30] [11] |
| Sensitivity & Efficiency | Can be less sensitive due to compromised buffer conditions [4] [11] | Potentially higher sensitivity and efficiency; reactions can be independently optimized [4] |
| Sample Archive | cDNA product cannot be saved; requires fresh RNA for new targets [30] | Stable cDNA pool is generated and can be stored for future analysis of other targets [30] [11] |
| Risk of Contamination | Low (closed-tube reaction) [30] [11] | Higher (multiple open-tube steps) [30] [11] |
| Ideal Use Case | - High-throughput diagnostic screening of a fixed gene panel- Stool sample RNA (good quality, predefined targets) [28] [30] | - FFPE samples (requires flexibility and preamplification)- CTC analysis (limited RNA, multiple targets)- Research discovery with scarce samples [24] [25] [30] |
The following diagram synthesizes the strategic decision-making process for selecting between one-step and two-step RT-qPCR across the different sample types.
Diagram 2: Decision tree for one-step vs. two-step RT-qPCR.
The Scientist's Toolkit: Essential Reagents and Kits
Selecting the right reagents is paramount for success. The following table catalogues key solutions referenced in the protocols above.
Table 3: Research Reagent Solutions for Cancer Biomarker Analysis
| Reagent / Kit Name | Function / Application | Specific Utility |
|---|---|---|
| Stool Total RNA Purification Kit (Norgen) | RNA extraction from stool | Provided high RNA purity and consistent mRNA detection in stool, optimal for downstream RT-qPCR [28]. |
| Superscript III One-Step RT-PCR Kit (Invitrogen) | One-Step RT-PCR | Identified as a well-suited candidate for sensitive mRNA detection in stool samples [28]. |
| CellSearch System | CTC Enrichment and Enumeration | FDA-cleared system using immunomagnetic EpCAM-based capture for prognostic CTC counting in various cancers [26] [27]. |
| Power SYBR Green RNA-to-CT Kits (Applied Biosystems) | One-Step & Two-Step RT-qPCR | Used in comparative studies; the 2-Step kit performed more reliably in a two-step protocol than a one-step protocol [4]. |
| LunaScript RT SuperMix Kit (NEB) | cDNA Synthesis for Two-Step RT-qPCR | Recommended for first-strand cDNA synthesis in two-step workflows, offering robust performance [30]. |
| Luna Universal One-Step RT-qPCR Kit (NEB) | One-Step RT-qPCR | A modern solution for fast, closed-tube, high-throughput one-step reactions [30]. |
The robust analysis of cancer biomarkers across FFPE, liquid biopsy, and stool samples is an integrative process that hinges on matching the sample's unique biology with a finely tuned molecular protocol. There is no universally superior choice between one-step and two-step RT-qPCR; the decision is contextual. One-step RT-qPCR offers a streamlined, low-contamination workflow ideal for high-throughput applications with predefined targets and more intact RNA, such as in stool screening. Conversely, two-step RT-qPCR provides unmatched flexibility, sensitivity, and the ability to create a valuable cDNA archive, making it the preferred method for analyzing challenging samples like FFPE tissues and rare CTCs, or when exploring multiple gene targets. By applying the optimized protocols and strategic framework outlined in this document, researchers can effectively navigate these critical choices to generate high-quality, reliable data that advances cancer research and drug development.
Protocol Selection and Workflow Implementation for Biomarker Detection
Within the field of cancer biomarker research, the selection of an appropriate reverse transcription quantitative PCR (RT-qPCR) methodology is pivotal for generating reliable, actionable data. This application note focuses on the integrated workflow of one-step RT-qPCR, a technique where reverse transcription and PCR amplification are performed in a single, uninterrupted reaction in a closed tube [31]. This method is particularly suited for high-throughput and repetitive target analysis, offering a distinct set of advantages and limitations compared to the two-step approach [3] [32].
Framed within the broader thesis of one-step versus two-step RT-qPCR, this document provides a detailed protocol, key applications in cancer research, and data analysis guidelines to empower researchers and drug development professionals in leveraging this efficient workflow.
Advantages and Limitations in Cancer Research
The one-step RT-qPCR protocol is characterized by a streamlined process that integrates cDNA synthesis and amplification. The diagram below illustrates this integrated workflow and its primary advantages.
This integrated workflow offers several key benefits for specific research scenarios, but it is not without its constraints. The table below provides a balanced comparison of its core attributes against its limitations, which are critical to consider during experimental planning.
Table 1: Advantages and Limitations of One-Step RT-qPCR in Biomarker Research
| Advantages | Limitations |
|---|---|
| Simple and rapid workflow; reduced hands-on time [31] [32] | Inability to optimize RT and qPCR steps independently, potentially leading to lower yields or efficiency [31] [32] |
| Minimized risk of contamination due to single-tube, closed-system protocol [31] [3] | No cDNA archive generated; all cDNA is consumed in the qPCR step, preventing future analysis of other targets [31] [32] |
| Ideal for high-throughput/automated systems [31] [32] | Not cost-effective for analyzing many targets from the same sample [31] |
| Efficient for processing many samples with a limited number of target genes [31] | Higher susceptibility to PCR inhibitors present in the RNA sample, as the RT step is more sensitive to contaminants [3] |
| Reduced pipetting errors [31] | Requires gene-specific primers for the reverse transcription step, limiting flexibility [3] |
Application in Cancer Biomarker Analysis
One-step RT-qPCR has proven to be a powerful tool in oncology research, particularly in scenarios demanding high throughput and reproducibility. Its application is especially valuable in virus-associated cancer studies and cancer subtyping using defined biomarker panels.
Key Research Applications
Viral Load Quantification and Oncogene Expression: The high sensitivity of one-step RT-qPCR makes it ideal for detecting and quantifying viral RNA, a crucial task in studying virus-associated cancers. For instance, it has been used to sensitively detect Zika viral RNA levels in multiple tissues of infected mice, revealing higher viral loads in testis associated with infertility [31]. This principle is directly transferable to human viral oncogenesis research, such as studying Epstein-Barr virus (EBV) or human papillomavirus (HPV).
Molecular Subtyping of Cancers with Multiplexed Assays: The technique is well-suited for diagnostic panels that require simultaneous measurement of a limited number of well-characterized biomarkers. A prominent example is the molecular subtyping of breast cancer. Research has demonstrated the successful use of multiplex RT-qPCR to assess the expression profiles of HER2, ESR (ER), PGR (PR), and Ki67 genes across 61 breast cancer samples, providing a precise method for classification that rivals traditional immunohistochemistry (IHC) [6]. This objective, quantitative approach reduces the subjectivity inherent in IHC scoring [6] [33].
Angiogenesis and Metastasis Potential Assessment: Beyond standard receptor status, one-step RT-qPCR can be applied to evaluate the expression of genes involved in tumor progression. The same breast cancer study explored genes involved in angiogenesis (HIF1A, ANG, VEGFR), shedding light on the metastatic potential of tumors [6]. Elevated levels of Hif1A and VEGFR were identified as potential biomarkers for assessing metastatic status [6].
Integrated One-Step RT-qPCR Workflow
The following diagram and protocol detail the end-to-end process for performing a one-step RT-qPCR experiment, from sample preparation to data analysis, with a focus on reliability and reproducibility.
Detailed Experimental Protocol
Sample Preparation and RNA Extraction
- Sample Types: The protocol can be applied to fresh frozen tissue, cell lines, or Formalin-Fixed Paraffin-Embedded (FFPE) tissue blocks [6] [33].
- RNA Extraction: Use commercial kits designed for your sample type. For FFPE samples, kits like the Quick-DNA/RNA FFPE Kit are recommended to overcome RNA fragmentation and cross-linking [6].
- Quality Control: Assess RNA concentration and purity using a spectrophotometer (e.g., NanoDrop). Acceptable 260/280 ratios are typically between 1.8 and 2.1 [6].
Reaction Setup and Plate Preparation
- Kit Selection: Commercial one-step kits, such as the One Step PrimeScript RT-PCR Kit (for probe-based detection) or the One-Step TB Green PrimeScript RT-PCR Kit II (for dye-based detection), provide pre-mixed components for convenience [31].
- Master Mix Preparation: Thaw all reagents on ice. Prepare a master mix in a sterile, nuclease-free tube to minimize pipetting variance and cross-contamination. The table in the "Research Reagent Solutions" section below details the core components.
- Plate Setup: Aliquot the master mix into the reaction plate. Add the template RNA, typically 10-100 ng per reaction for high-quality RNA. Include no-template controls (NTCs) by replacing RNA with nuclease-free water to check for contamination. Each sample and target should be run in technical replicates (at least duplicates) to ensure data reliability.
Thermal Cycling Protocol
Load the plate into a real-time PCR instrument and run a program based on the following steps, which may be adjusted according to the specific kit used and the assay design [31] [6]:
Reverse Transcription:
- 50°C for 10 minutes [6]. This step synthesizes cDNA using gene-specific primers.
Initial Denaturation:
- 95°C for 2 minutes [6]. This activates the hot-start DNA polymerase and denatures the cDNA and secondary structures.
Amplification (40-45 Cycles):
Research Reagent Solutions
A successful one-step RT-qPCR experiment relies on a set of core components, typically available in commercial kits. The following table lists these essential reagents and their functions.
Table 2: Essential Reagents for One-Step RT-qPCR
| Reagent / Component | Function / Description |
|---|---|
| One-Step RT-qPCR Kit | A commercial master mix containing optimized blends of reverse transcriptase and hot-start DNA polymerase (e.g., PrimeScript RTase and Takara Ex Taq HS) [31]. |
| Gene-Specific Primers | Oligonucleotides designed to target the cDNA sequence of interest. In one-step protocols, these are used for both the reverse transcription and PCR steps [3]. |
| Probes or Intercalating Dye | Probe-based (e.g., FAM/TAMRA): Offers high specificity [31]. Dye-based (e.g., TB Green): A cost-effective DNA intercalating dye for monitoring amplification [31]. |
| RNA Template | High-quality, intact RNA is critical. Integrity can be checked via gel electrophoresis or bioanalyzer. |
| Nuclease-Free Water | The diluent for reactions, ensuring no RNase or DNase activity that would degrade the reaction components. |
Data Analysis and Interpretation
Accurate data analysis is the final, critical step. The Quantification Cycle (Cq) is the primary data point generated, but its correct interpretation is paramount.
Key Considerations for Reliable Cq Analysis
- Cq is a Relative Measure: The observed Cq value is not only dependent on the initial target concentration but also on the PCR efficiency and the level of the quantification threshold [34]. Therefore, Cq values from different runs, machines, or laboratories cannot be directly compared.
- PCR Efficiency is Crucial: Interpreting Cq values while assuming a 100% efficient PCR can lead to gross inaccuracies in calculated gene expression ratios [34]. It is essential to account for the actual amplification efficiency of each assay.
- The ΔΔCq Method: For relative quantification, the ΔΔCq method is commonly used to calculate fold changes in gene expression [6]. This method uses the formula 2^(-ΔΔCq) to determine the fold change of a target gene in a test sample relative to a control sample, after normalization to one or more reference genes [6].
The data analysis pipeline, from raw Cq to biological interpretation, involves several validation and normalization steps, as summarized below.
Critical Validation Steps
- Amplification Efficiency: Calculate the efficiency (E) of your qPCR assay using a standard curve dilution series. The formula
E = -1 + 10^(-1/slope)is typically used, with ideal efficiency between 90-110% [6]. - Reference Gene Selection: Choose stable, validated reference genes (e.g., RPL13A, GAPDH) for normalization. Their expression should not vary under your experimental conditions [6].
In the field of cancer biomarker research, where sample quantities are often severely limited and the need to analyze multiple genetic targets is paramount, selecting the appropriate molecular detection method is crucial for experimental success. Quantitative reverse transcription polymerase chain reaction (RT-qPCR) serves as a cornerstone technology for gene expression analysis, yet researchers must choose between one-step and two-step methodological approaches. While one-step RT-qPCR offers procedural simplicity by combining reverse transcription and PCR amplification in a single tube [35] [11], this method presents significant limitations for comprehensive biomarker studies where the same precious sample must be analyzed for multiple targets.
Two-step RT-qPCR addresses these challenges by physically separating the reverse transcription and PCR amplification processes into distinct reactions [35] [11]. This strategic separation creates a stable cDNA archive that can be utilized for numerous downstream applications, making it particularly valuable for cancer research involving rare patient samples, biobank specimens, or longitudinal studies where material preservation is essential [3] [36]. The enhanced flexibility of two-step RT-qPCR enables researchers to maximize the informational yield from each limited clinical sample, thereby accelerating biomarker discovery and validation workflows without compromising experimental rigor or reproducibility.
Key Advantages of the Two-Step Approach for Multi-Target Analysis
Experimental Design Flexibility
The two-step method fundamentally differs from one-step approaches by decoupling cDNA synthesis from subsequent PCR amplification, creating opportunities for experimental optimization that are simply not possible with combined protocols [35] [11]. This separation enables independent optimization of each reaction component, allowing researchers to fine-tune buffer conditions, enzyme concentrations, and thermal cycling parameters specifically for reverse transcription or PCR amplification [36]. Such optimization capabilities are particularly valuable when working with challenging RNA samples derived from formalin-fixed paraffin-embedded (FFPE) tissues, which are common in cancer biomarker research but often yield partially degraded or chemically modified RNA [33].
The two-step workflow generates a permanent cDNA archive that can be stored long-term at -20°C, dramatically enhancing experimental flexibility compared to the one-step approach [36]. This archive functionality enables researchers to return to the same cDNA pool months or years later to analyze newly discovered biomarkers without requiring additional original RNA material, a critical advantage when working with irreplaceable clinical samples [3]. Furthermore, the same cDNA synthesis reaction can serve as template for numerous parallel PCR amplifications, ensuring perfect comparability across multiple gene targets since all amplifications originate from an identical cDNA source [35] [11].
Superior Performance with Complex Samples
Two-step RT-qPCR demonstrates particular advantages when analyzing samples with inherent challenges, including low RNA quality, limited starting material, or requirements for high sensitivity detection. When RNA quality is compromised – a common scenario with clinical specimens – the two-step method allows for specialized reverse transcription conditions that can improve cDNA yield from degraded templates [35]. The independent reaction setup also enables concentration and purification of cDNA prior to PCR amplification, potentially enhancing detection sensitivity for low-abundance transcripts that serve as critical biomarkers in early cancer detection [35] [4].
Research has demonstrated that two-step protocols can achieve superior efficiency, sensitivity, and linearity compared to one-step methods. A comparative study evaluating RT-qPCR performance found that two-step reactions achieved efficiency of 100±1.5% and 99.7±0.95% on different PCR platforms, outperforming one-step approaches in these critical parameters [4]. This enhanced performance profile makes two-step RT-qPCR particularly suitable for absolute quantification applications requiring maximum accuracy, such as establishing diagnostic cut-off values for cancer biomarker panels [37] [33].
Comparative Analysis: One-Step vs. Two-Step RT-qPCR
Table 1: Methodological comparison between one-step and two-step RT-qPCR
| Parameter | One-Step RT-qPCR | Two-Step RT-qPCR |
|---|---|---|
| Workflow | Combined RT and PCR in single tube | Separate RT and PCR reactions |
| Priming Options | Gene-specific primers only [35] [11] | Oligo(dT), random hexamers, gene-specific primers, or combinations [35] [38] |
| Hands-on Time | Minimal | Extended |
| Sample Throughput | Ideal for high-throughput analysis of few targets [35] | Suitable for low-to-medium throughput analysis of multiple targets |
| cDNA Archive | Not possible; must use original RNA for repeat analyses [35] [3] | Stable cDNA bank can be stored and reused [35] [36] |
| Optimization Flexibility | Limited; compromised conditions for both reactions [11] | Extensive; independent optimization of RT and PCR [11] [36] |
| Risk of Contamination | Lower due to closed-tube format [35] | Higher due to additional handling steps [35] [11] |
| Sensitivity | Potentially compromised by suboptimal combined conditions [4] [11] | Potentially higher due to optimized separate conditions [4] |
| Ideal Application | Repetitive analysis of limited targets where sample is abundant [35] [3] | Multiple target analysis from precious or limited samples [35] [36] |
Table 2: Performance characteristics of two-step RT-qPCR based on experimental data
| Performance Metric | Two-Step RT-qPCR Performance | Significance for Biomarker Research |
|---|---|---|
| Amplification Efficiency | 100±1.5% and 99.7±0.95% on different platforms [4] | Essential for accurate relative quantification of gene expression |
| Sensitivity (CT for lowest standard) | 33.2±0.5 and 32.5±0.7 [4] | Enables detection of low-abundance transcripts |
| Linearity (R² value) | 0.997±0.001 and 0.993±0.006 [4] | Critical for reliable standard curves across dilution series |
| Template Stability | cDNA stable at -20°C for long-term storage [36] | Allows creation of sample archives for future studies |
| Multi-Target Capacity | Dozens of genes from single cDNA synthesis [35] [3] | Maximizes information from precious clinical samples |
Detailed Experimental Protocol for Two-Step RT-qPCR
Step 1: cDNA Synthesis Reaction
RNA Quality Assessment and Pretreatment
Prior to reverse transcription, assess RNA quality using appropriate methods such as spectrophotometry (A260/A280 ratio ~1.8-2.0) and microfluidic analysis (RIN >7 for high-quality samples) [5]. For samples potentially contaminated with genomic DNA, treat with DNase I following manufacturer's protocols [38]. Use 10 pg to 1 μg total RNA per 20 μL reverse transcription reaction, with higher inputs (100 ng to 1 μg) generally providing more robust results for low-abundance targets [4].
Reverse Transcription Reaction Setup
Prepare the following reaction mixture on ice:
- RNA template: 10 pg - 1 μg total RNA in nuclease-free water
- Primers: 25-50 ng random hexamers OR 0.5 μg oligo(dT)15-18 OR 10-50 pmol gene-specific primers [38]
- dNTP mix: 0.5-1 mM each dNTP
- Reaction buffer: 1X specific to reverse transcriptase
- Reverse transcriptase: 10-200 U (concentration dependent on enzyme)
- RNase inhibitor: 20-40 U (optional but recommended)
- Nuclease-free water: to final volume
Table 3: Primer selection guide for cDNA synthesis
| Primer Type | Mechanism | Advantages | Disadvantages | Ideal Applications |
|---|---|---|---|---|
| Random Hexamers | Binds at multiple positions along RNA transcripts | Amplifies all RNA species; good for transcripts with secondary structure; high cDNA yield [38] | cDNA made from all RNAs can dilute mRNA signal; produces truncated cDNA fragments [38] | Degraded RNA samples; analyzing multiple targets from single reaction |
| Oligo(dT) | Binds to poly(A) tail of mRNA | Generates full-length cDNA from polyadenylated mRNA; more specific to mRNA population [38] | Only amplifies genes with poly(A) tails; biased toward 3' end; inefficient with degraded RNA [38] | High-quality RNA; focusing on protein-coding genes |
| Gene-Specific | Binds to specific mRNA sequence | Specific cDNA pool; increased sensitivity for particular targets [38] | Synthesis limited to one gene of interest; not suitable for multiple targets [38] | Analyzing one or few specific targets |
Thermal Cycling Conditions for cDNA Synthesis
- Primer annealing: 25°C for 5-10 minutes (for random hexamers)
- cDNA elongation: 42-55°C for 30-60 minutes
- Enzyme inactivation: 70-85°C for 5-15 minutes
- Hold: 4°C (short-term) or -20°C (long-term storage)
The resulting cDNA can be used immediately in qPCR reactions or stored at -20°C for extended periods [36]. For qPCR, typically 1-5 μL of a 1:5 to 1:20 dilution of the cDNA synthesis reaction is used per 20-25 μL PCR reaction.
Step 2: Quantitative PCR Amplification
Reaction Setup
Prepare qPCR reactions in accordance with MIQE guidelines to ensure reproducibility [37]:
- cDNA template: 1-5 μL of diluted cDNA (optimize for each target)
- Forward and reverse primers: 100-500 nM each (optimize concentration)
- qPCR master mix: 1X final concentration
- SYBR Green dye or hydrolysis probes: according to manufacturer's instructions
- Nuclease-free water: to final volume
Primer Design Considerations
For cancer biomarker applications, primer design requires particular attention to ensure specificity and efficiency:
- Amplicon length: 85-125 bp for optimal amplification efficiency [5]
- Exon spanning: Design primers to span exon-exon junctions where possible, with one primer potentially crossing the actual exon-intron boundary to prevent amplification of genomic DNA [38]
- Sequence specificity: Conduct rigorous BLAST analysis to ensure primers do not amplify non-target sequences, particularly important for gene families with high homology [5]
- Single-nucleotide polymorphisms: Consider SNP locations when studying human samples to avoid primer binding sites containing common polymorphisms [5]
Thermal Cycling Conditions
- Initial denaturation: 95°C for 2-10 minutes
- Amplification (35-45 cycles):
- Denaturation: 95°C for 10-15 seconds
- Annealing: 55-65°C for 15-30 seconds (optimize temperature based on primer Tm)
- Extension: 72°C for 20-30 seconds (if two-step amplification not used)
- Melt curve analysis (for SYBR Green applications): 65°C to 95°C, increment 0.5°C
Essential Controls and Validation
Include the following controls in every two-step RT-qPCR experiment:
- No-template control (NTC): Contains all components except template cDNA to detect reagent contamination
- No-reverse transcription control (-RT): Contains RNA without reverse transcriptase to detect genomic DNA contamination [38]
- Positive control: Known expressed target to validate reaction efficiency
- Reference genes: Multiple validated reference genes for normalization [5] [37]
Research Reagent Solutions
Table 4: Essential reagents for two-step RT-qPCR workflow
| Reagent Category | Specific Examples | Function & Importance |
|---|---|---|
| Reverse Transcriptases | Moloney murine leukemia virus (MMLV) RT, Avian myeloblastosis virus (AMV) RT [38] | Converts RNA to complementary DNA; enzyme choice affects yield, temperature tolerance, and fidelity |
| qPCR Master Mixes | SYBR Green master mixes, probe-based master mixes [35] | Provides optimized buffer, nucleotides, polymerase, and detection chemistry for quantitative PCR |
| Primers | Random hexamers, oligo(dT) primers, sequence-specific primers [35] [38] | Initiates cDNA synthesis; primer choice determines sequence representation and potential applications |
| RNA Stabilization Reagents | RNAlater, TRIzol [4] [33] | Preserves RNA integrity from sample collection through nucleic acid extraction |
| Quality Assessment Tools | Bioanalyzer, spectrophotometer, fluorometer [5] | Evaluates RNA quality, quantity, and purity to ensure only high-quality samples proceed to cDNA synthesis |
| DNase Treatment Kits | RNase-free DNase sets [38] | Removes contaminating genomic DNA that could lead to false positive amplification |
Application in Cancer Biomarker Research: A Case Study
The practical advantages of two-step RT-qPCR are exemplified in breast cancer biomarker research, where comprehensive molecular profiling from limited tissue samples is essential for diagnosis and treatment selection. A 2021 study directly compared established immunohistochemistry (IHC) methods with two-step RT-qPCR for detecting established breast cancer biomarkers (ER, PR, HER2, and Ki67) [33]. The researchers utilized the two-step approach to analyze 116 breast cancer cases with varying levels of diagnostic difficulty, demonstrating that the molecular method provided reliable quantification of all four critical biomarkers from a single cDNA synthesis reaction [33].
This study highlighted several key advantages of the two-step methodology in a clinical research context. The approach enabled multiple analyses from precious samples, as the same cDNA archive was used to quantify all four biomarkers plus reference genes. The method demonstrated superior objectivity compared to IHC, particularly for Ki67 assessment where visual counting variability presents significant challenges in clinical practice. Additionally, the two-step protocol facilitated retrospective analysis of archived samples, as the stable cDNA products could be re-tested when new questions emerged [33]. This case study illustrates how two-step RT-qPCR provides the flexibility, multi-target capability, and analytical consistency required for robust cancer biomarker validation in both research and potential diagnostic applications.
The two-step RT-qPCR workflow represents a methodologically superior approach for cancer biomarker research requiring multi-target analysis from precious or limited samples. By separating reverse transcription and PCR amplification into distinct optimized reactions, this method generates stable cDNA archives that support comprehensive gene expression profiling from a single RNA isolation [35] [36]. The flexibility in priming strategies, independent reaction optimization capabilities, and demonstrated performance advantages make two-step RT-qPCR particularly valuable for translational cancer research [4] [33].
As molecular diagnostics increasingly rely on multi-parameter biomarker signatures rather than single analytes, the capacity to analyze dozens of targets from minimal sample material becomes increasingly critical [37]. The two-step RT-qPCR protocol detailed in this application note provides researchers with a robust framework for maximizing the informational yield from valuable clinical specimens, thereby accelerating the development and validation of novel cancer biomarkers while preserving irreplaceable samples for future research applications.
In the realm of cancer biomarker research, reverse transcription quantitative polymerase chain reaction (RT-qPCR) has become an indispensable technique for profiling gene expression, validating oncogenic signatures, and monitoring therapeutic responses. The accuracy and reliability of this method are fundamentally influenced by the initial reverse transcription (RT) step, where the choice of priming strategy directly impacts cDNA synthesis efficiency, target representation, and subsequent quantitative analysis [39] [38]. Within the overarching framework of one-step versus two-step RT-qPCR methodologies, primer selection emerges as a critical experimental variable requiring strategic consideration.
Two primary RT-qPCR approaches exist: one-step and two-step protocols. One-step RT-qPCR combines reverse transcription and PCR amplification in a single tube and buffer, exclusively using sequence-specific primers [11] [38]. This streamlined workflow reduces hands-on time and contamination risk, making it amenable to high-throughput applications. In contrast, two-step RT-qPCR physically separates the RT reaction from the PCR amplification, performing them in separate tubes with individually optimized conditions [11]. This flexible approach permits the use of oligo(dT) primers, random hexamers, gene-specific primers, or a combination thereof to generate a stable cDNA pool that can be archived for analyzing multiple targets from a single RNA sample [40]. The strategic selection of an appropriate priming method is therefore not merely a technical detail, but a foundational decision that governs experimental design, data quality, and biological interpretation in cancer research.
Characteristics of Priming Strategies
The three principal priming strategies—gene-specific, oligo(dT), and random hexamers—each possess distinct mechanisms, advantages, and limitations. Their performance characteristics are particularly relevant in cancer studies, where RNA integrity may be compromised in clinical samples, and target abundance can vary dramatically from highly expressed oncogenes to scarce regulatory non-coding RNAs.
Table 1: Comparison of Priming Methods for Reverse Transcription
| Primer Type | Structure & Mechanism | Advantages | Disadvantages | Ideal Applications in Cancer Research |
|---|---|---|---|---|
| Gene-Specific Primers (GSP) | Custom-designed primers (18-25 nt) that anneal to a specific mRNA sequence of interest [39]. | - Maximizes sensitivity and specificity for targeted genes.- Essential for one-step RT-qPCR.- Ideal for detecting low-abundance transcripts (e.g., some transcription factors) [11] [38]. | - Synthesis limited to one pre-defined gene per reaction.- Requires prior knowledge of target sequence.- Not suitable for creating a universal cDNA archive [11]. | - Validating specific cancer biomarkers from a predefined gene set.- High-throughput screening of a few targets across many samples.- Quantifying splice variants when designed to junction sites. |
| Oligo(dT) Primers | Stretch of 12-18 thymine (T) residues that anneal to the 3' poly(A) tail of most eukaryotic mRNAs [39] [38]. | - Generates cDNA that is primarily representative of mRNA.- Produces full-length or near full-length cDNA transcripts.- Efficient when RNA is limited [38]. | - Biased towards the 3' end of transcripts.- Cannot reverse transcribe non-poly(A) RNAs (e.g., some non-coding RNAs).- Performance depends on RNA integrity; degraded samples yield biased 3' representation [38]. | - Gene expression profiling where 3' bias is acceptable.- Analyzing samples with high RNA integrity (e.g., cell lines).- Amplifying long mRNAs when full-length cDNA is desired. |
| Random Hexamers | Short, random sequences (6-9 nucleotides) that anneal at multiple points along all RNA transcripts [39] [38]. | - Anneals to all RNA species (rRNA, tRNA, mRNA, non-coding RNA).- Can prime degraded RNA samples effectively.- Generates cDNA along the entire transcript length, reducing 3' bias [38]. | - cDNA pool is diluted by non-mRNA sequences (rRNA, etc.).- May produce truncated cDNA fragments.- Lower specificity compared to GSP [38]. | - Working with partially degraded RNA (e.g., FFPE tissues).- Analyzing non-poly(A) targets.- Whole-transcriptome studies from a single cDNA pool. |
The following diagram illustrates the fundamental binding mechanisms of these three primer types to an mRNA template, highlighting their different initiation points for cDNA synthesis.
Diagram 1: Primer binding mechanisms for cDNA synthesis. GSP initiates synthesis from a specific internal site, Oligo(dT) from the 3' end, and Random Hexamers from multiple sites along the RNA transcript.
Strategic Primer Selection in One-Step vs. Two-Step RT-qPCR
The choice between one-step and two-step RT-qPCR protocols is often dictated by the research objectives, sample availability, and throughput requirements. This decision is intrinsically linked to the available priming strategies, creating distinct workflows with specific implications for cancer biomarker discovery and validation.
One-Step RT-qPCR: Streamlined for Targeted Quantification
In one-step RT-qPCR, the entire reaction from cDNA synthesis to PCR amplification occurs in a single tube with a unified buffer system. This method is inherently dependent on gene-specific primers for both reverse transcription and amplification [11] [40]. The closed-tube nature of this workflow minimizes pipetting steps, reduces cross-contamination risk, and enhances reproducibility, making it particularly suitable for high-throughput applications such as screening a large number of clinical samples for a predefined set of cancer biomarkers [11] [40].
A significant technical advantage of using gene-specific primers in one-step reactions is the potential for increased sensitivity for certain low-abundance targets. One study comparing one-step and two-step methodologies observed a 5-cycle lower detection threshold (indicating higher sensitivity) for the low-expression gene PolR2A when using the one-step approach [41]. However, a key limitation is that the reaction conditions represent a compromise between the optimal temperatures and buffer compositions for both reverse transcriptase and DNA polymerase enzymes, which can sometimes result in reduced efficiency compared to independently optimized two-step reactions [11].
Two-Step RT-qPCR: Flexible for Biomarker Discovery
The two-step method decouples cDNA synthesis from PCR amplification, offering unparalleled flexibility in priming strategies. Researchers can use oligo(dT) primers, random hexamers, gene-specific primers, or even mixtures (e.g., random hexamers and oligo(dT)) during the first-strand cDNA synthesis [40] [38]. This generates a comprehensive cDNA archive that can be stored and used for multiple subsequent qPCR assays, allowing for the analysis of numerous genes from a single, often precious, RNA sample [11].
This flexibility is crucial in exploratory cancer research. For instance, when working with formalin-fixed, paraffin-embedded (FFPE) tumor samples, which frequently contain degraded RNA, random hexamers are often the priming method of choice because they can bind throughout the fragmented transcript and generate cDNA more effectively than oligo(dT) primers [38]. Furthermore, separating the two steps allows for individual optimization of each reaction condition and the use of different reverse transcriptase enzymes, which can be selected for specific properties like higher thermal stability to overcome RNA secondary structures—a common challenge with certain transcript targets [40].
Table 2: Method Selection Guide: One-Step vs. Two-Step RT-qPCR
| Parameter | One-Step RT-qPCR | Two-Step RT-qPCR |
|---|---|---|
| Priming Strategy | Gene-specific primers only [11] [38]. | Oligo(dT), random hexamers, gene-specific primers, or a mixture [40]. |
| Workflow & Throughput | Faster, closed-tube; ideal for high-throughput analysis of a few targets [11] [40]. | More hands-on time; ideal for analyzing multiple targets from few samples [40]. |
| Sample Requirements | Requires fresh RNA aliquots to analyze new targets [40]. | A single cDNA synthesis reaction provides a stable template archive for future analyses of different targets [11]. |
| Optimization Potential | Compromised conditions for both RT and PCR; less sensitive for some targets [11]. | Independent optimization of RT and PCR steps; generally higher sensitivity and flexibility [11]. |
| Risk of Contamination | Lower risk due to minimal sample handling [11]. | Higher risk due to additional open-tube steps and pipetting [11]. |
| Ideal Scenario in Cancer Research | Rapid diagnostic screening of known biomarker panels (e.g., oncogene expression signatures). | Biomarker discovery, validating multiple candidate genes, or working with scarce patient-derived samples. |
The following workflow diagram contrasts the two main RT-qPCR methods and highlights the pivotal role of primer selection in each.
Diagram 2: Workflow comparison of one-step and two-step RT-qPCR. Primer selection is a key differentiator, with one-step restricted to gene-specific primers, while two-step offers multiple options.
Experimental Protocols for Primer Evaluation
Protocol: Validating Primer Specificity and Efficiency
Accurate quantification, especially for subtle expression changes in cancer pathways, depends on using highly specific and efficient primers.
Primer Design:
- Location: Design primers to span an exon-exon junction to prevent amplification of contaminating genomic DNA. The preferable amplicon size is 70-200 base pairs for optimal amplification efficiency [39] [42].
- Specifications: Aim for primers 18-25 nucleotides in length with a GC content of 40-60%. The melting temperatures (Tm) of the forward and reverse primers should be within 2°C of each other, ideally around 60-64°C [39] [42].
- Validation: Use tools like NCBI BLAST to ensure primer specificity. Analyze potential secondary structures (hairpins, dimers) with tools like OligoAnalyzer, ensuring the ΔG value is weaker (more positive) than -9.0 kcal/mol [42].
cDNA Synthesis (Two-Step Method):
- Use 10 ng to 1 µg of total RNA in a 20 µL reaction.
- For a comprehensive cDNA pool, use a mixture of random hexamers and oligo(dT) primers (e.g., 50 ng of each per reaction) [41].
- Include a control without reverse transcriptase (-RT control) for each sample to detect genomic DNA contamination.
Generating a Standard Curve:
Protocol: Assessing Reference Gene Stability in Cancer Models
A critical, often overlooked, application of priming strategy is the validation of reference genes (housekeeping genes) for normalization in cancer models. Their expression must be stable under experimental conditions, which cannot be assumed.
Treatment and RNA Extraction:
cDNA Synthesis with Universal Priming:
- Convert RNA to cDNA using random hexamers and/or oligo(dT) primers. This universal priming ensures the cDNA pool represents all potential reference genes equally, allowing for a fair comparison of their stability [43].
qPCR and Stability Analysis:
- Design primers for a panel of candidate reference genes (e.g., GAPDH, ACTB, B2M, YWHAZ, TUBA1A, RPS18, etc.) [43] [45].
- Amplify each candidate gene from the same cDNA pool.
- Analyze the data using specialized algorithms (e.g., geNorm, NormFinder) to determine the most stably expressed genes. Critical Finding: Studies have shown that common reference genes like ACTB and ribosomal protein genes (RPS23, RPS18, RPL13A) can be highly unstable in certain cancer models, such as mTOR-inhibited cells, leading to significant data distortion if used for normalization [43] [44]. Instead, genes like B2M and YWHAZ were identified as more stable in these specific conditions.
Table 3: Research Reagent Solutions for RT-qPCR
| Reagent / Resource | Function / Description | Example Products / Tools |
|---|---|---|
| Reverse Transcriptase | Enzyme that synthesizes cDNA from an RNA template. Select for high thermal stability and optimized RNase H activity for better yield and specificity in qPCR [39] [38]. | SuperScript III, LunaScript RT SuperMix Kit [40] [41]. |
| One-Step RT-qPCR Kits | Integrated systems containing both reverse transcriptase and hot-start DNA polymerase in a single master mix for streamlined, one-step workflows. | Luna Universal One-Step RT-qPCR Kit [40]. |
| qPCR Master Mixes | Optimized buffered solutions containing DNA polymerase, dNTPs, Mg²⁺, and fluorescent dye or probe for the quantitative PCR step. | Luna Universal qPCR Master Mix, Platinum Quantitative PCR Supermix [40] [41]. |
| Primer Design Tools | Online software for designing and analyzing oligonucleotides, checking for specificity, secondary structures, and calculating Tm. | IDT OligoAnalyzer, NCBI BLAST, Primer3PLUS [39] [42]. |
| RNase Inhibitors | Proteins added to reactions to protect RNA templates from degradation by RNases during sample preparation and cDNA synthesis. | Recombinant RNase Inhibitor [39]. |
The strategic selection of priming methods—gene-specific, oligo(dT), or random hexamers—is a cornerstone of robust and reliable RT-qPCR experiments in cancer research. This choice is profoundly influenced by the decision to employ a one-step or two-step protocol, each offering distinct trade-offs between throughput, flexibility, and sensitivity. Gene-specific primers are the sole option for the streamlined, one-step workflow, ideal for targeted, high-throughput biomarker validation. In contrast, the two-step method, with its versatile priming options, is the engine of discovery, enabling researchers to build a reusable cDNA archive from precious clinical samples and interrogate a multitude of targets. By aligning priming strategies with experimental objectives and sample characteristics, as outlined in these application notes and protocols, researchers can ensure the generation of precise, reproducible gene expression data that accelerates our understanding of cancer biology and therapeutic development.
The accurate assessment of Human Epidermal Growth Factor Receptor 2 (HER2) status is a critical determinant in treatment planning for breast cancer patients, guiding the use of HER2-targeted therapies such as trastuzumab [46]. Current diagnostic standards rely on immunohistochemistry (IHC) for protein expression analysis and fluorescence in situ hybridization (FISH) for gene amplification detection [46] [47]. While well-established, these methods present significant limitations including semi-quantitative output, subjective interpretation, high costs, and requirements for specialized equipment and expertise [46] [47] [33].
Molecular techniques based on reverse transcription quantitative polymerase chain reaction (RT-qPCR) have emerged as promising alternatives, offering quantitative, objective, and potentially more standardized approaches for HER2 assessment [47] [48]. This case study examines the clinical application of a one-step RT-qPCR methodology for HER2 quantification in formalin-fixed paraffin-embedded (FFPE) breast cancer samples, positioning this approach within the broader context of one-step versus two-step RT-qPCR methodologies for cancer biomarker research.
Methodologies & Experimental Protocols
One-Step RT-qPCR Protocol for HER2 Quantification
The following protocol outlines the optimized procedure for one-step RT-qPCR-based HER2 quantification from FFPE breast cancer tissue samples, as validated in recent clinical studies [46] [49]:
Sample Preparation and RNA Extraction:
- Obtain two 10-μm thick sections from FFPE tissue blocks and transfer to a 1.5 mL microcentrifuge tube
- Deparaffinize by adding 1 mL of 100% xylene, vortexing, and heating at 50°C for 5 minutes
- Centrifuge at 20,000 × g for 2 minutes at room temperature and discard xylene supernatant
- Wash pellet twice with 1 mL of 100% ethanol, centrifuging between washes
- Air-dry pellet for 25 minutes to remove residual ethanol
- Extract total RNA using PureLink FFPE RNA Isolation Kit or equivalent
- Determine RNA concentration and purity using spectrophotometry (A260/A280 ratio of 1.8-2.0 acceptable)
One-Step RT-qPCR Reaction Setup:
- Utilize commercial one-step RT-qPCR kits such as BrightGen HER2 RT-qDx
- Prepare 20 μL reactions containing:
- 10 μL of 2× reaction mix
- 1 μL of reverse transcriptase/Taq enzyme mix
- 2 μL of gene-specific primer-probe mix (HER2 and reference genes)
- 2 μL of RNA template (5-100 ng total RNA)
- 5 μL of nuclease-free water
- Perform amplification using the following thermal cycling conditions:
- Reverse transcription: 50°C for 15-30 minutes
- Initial denaturation: 95°C for 2-10 minutes
- 40-45 cycles of:
- Denaturation: 95°C for 15 seconds
- Annealing/Extension: 60°C for 1 minute
- Normalize HER2 expression using reference genes RPL30, RPL37, or GAPDH
Comparison with Standard Methods
Immunohistochemistry Protocol:
- Perform IHC on FFPE sections using VENTANA anti-HER2/neu (4B5) Rabbit Monoclonal Primary Antibody
- Score according to 2018 ASCO/CAP guidelines:
- 0: No staining or membrane staining in <10% of tumor cells
- 1+: Faint/barely perceptible membrane staining in >10% of tumor cells
- 2+: Weak to moderate complete membrane staining in >10% of tumor cells
- 3+: Strong complete membrane staining in >10% of tumor cells
FISH Analysis Protocol:
- Perform FISH on IHC 2+ (equivocal) cases using HER2 FISH pharmDx kit
- Count HER2 and CEP17 signals in at least 20 tumor cell nuclei
- Calculate HER2/CEP17 ratio and interpret per ASCO/CAP guidelines:
- Positive: Ratio ≥2.0 with average HER2 copy number ≥4.0 signals/cell
- Equivocal: Ratio ≥2.0 with average HER2 copy number <4.0 signals/cell OR Ratio <2.0 with average HER2 copy number ≥6.0 signals/cell
- Negative: Ratio <2.0 with average HER2 copy number <4.0 signals/cell
Results & Performance Data
Diagnostic Performance of RT-qPCR for HER2 Assessment
Table 1: Diagnostic Accuracy of One-Step RT-qPCR for HER2 Quantification in FFPE Breast Cancer Samples
| Study | Sample Size | Sensitivity (%) | Specificity (%) | PPV (%) | NPV (%) | AUC | Concordance with FISH |
|---|---|---|---|---|---|---|---|
| Prospective Validation [46] [49] | 275 | 93.4 | 100 | 100 | 89.4 | 0.955 | 100% |
| BrightGen Assay [47] | 199 | 93.0 | 89.8 | - | - | 0.947 | - |
| MammaTyper Assay [33] | 116 | - | - | - | - | - | High concordance reported |
Quantitative HER2 Expression Data
Table 2: HER2 Expression Levels Across Different Assessment Methods
| Method | Output Type | Dynamic Range | Cut-off Values | Key Advantages |
|---|---|---|---|---|
| One-Step RT-qPCR | Continuous (Ct values, normalized expression) | 5-6 log | 11.954 (ΔΔCt) [46] | Fully quantitative, high throughput, objective |
| IHC | Semi-quantitative (0, 1+, 2+, 3+) | Limited | Binary (positive/negative) | Protein localization, morphology preservation |
| FISH | Semi-quantitative (ratio, copy number) | 2-3 log | HER2/CEP17 ≥2.0 | Gold standard for gene amplification |
| QDB [50] | Continuous (nmol/g) | >3 log | 0.267 nmol/g | Absolute protein quantitation |
| Mass Spectrometry [51] | Continuous (fmol/μg) | 4 log | Peptide-specific | Multiplexing capability, high specificity |
The Scientist's Toolkit: Research Reagent Solutions
Table 3: Essential Reagents and Kits for HER2 Quantification in FFPE Samples
| Reagent/Kits | Function | Specific Examples | Key Features |
|---|---|---|---|
| RNA Extraction Kits | Isolation of high-quality RNA from FFPE samples | PureLink FFPE RNA Isolation Kit, RNeasy FFPE Kit | Effective deparaffinization, RNA stabilization, DNase treatment |
| One-Step RT-qPCR Kits | Combined reverse transcription and amplification | BrightGen HER2 RT-qDx, TaqMan Fast Virus 1-Step Mix | Reduced handling, contamination prevention, optimized for FFPE RNA |
| Reference Genes | Expression normalization | RPL30, RPL37, RPLP0, GAPDH | Stable expression in breast cancer, validated for FFPE samples |
| HER2 Assays | Target-specific detection | Hs00170433_m1 (ERBB2), custom primer-probe mixes | Exon-spanning designs, high specificity, optimized for FFPE-derived RNA |
| IHC Antibodies | Protein-level detection | VENTANA anti-HER2/neu (4B5), HercepTest | Clinically validated, ASCO/CAP compliant |
| FISH Probes | Gene amplification detection | HER2 FISH pharmDx, PathVysion HER2 DNA Probe Kit | Dual-color (HER2/CEP17), standardized scoring criteria |
Technical Comparison: One-Step vs. Two-Step RT-qPCR
Workflow and Practical Considerations
RT-qPCR Methodology Comparison Workflow
Technical Performance Comparison
Table 4: Comparative Analysis of One-Step vs. Two-Step RT-qPCR for HER2 Quantification
| Parameter | One-Step RT-qPCR | Two-Step RT-qPCR |
|---|---|---|
| Handling Time | Reduced (single tube) | Increased (multiple steps) |
| Contamination Risk | Lower (closed system) | Higher (tube transfers) |
| Sample Throughput | Higher | Lower |
| cDNA Archive | Not available | Available for multiple assays |
| Primer Flexibility | Limited to gene-specific | Random hexamers/oligo-dT options |
| Optimization Complexity | Simplified | More complex |
| Reproducibility | High (reduced variability) | Potentially lower |
| Automation Potential | Excellent | Moderate |
| Validation in FFPE Samples | Clinically validated [46] [47] | Less documented |
| RNA Quality Tolerance | More tolerant of degradation | Requires higher quality RNA |
Discussion & Clinical Implications
The implementation of one-step RT-qPCR for HER2 quantification addresses several critical needs in modern breast cancer diagnostics. The method demonstrates exceptional performance characteristics, with recent prospective validation studies reporting sensitivity of 93.4%, specificity of 100%, and area under the curve (AUC) of 0.955 [46] [49]. These metrics suggest that one-step RT-qPCR could serve as a valuable complement or alternative to traditional IHC/FISH approaches, particularly in settings requiring high throughput and quantitative results.
The clinical utility of RT-qPCR extends beyond simple HER2 status classification. Quantitative HER2 expression data may enable better patient stratification and prediction of treatment response. Emerging evidence suggests that quantitative HER2 assessment could identify patients with HER2-low and HER2-ultra-low expression who might benefit from novel antibody-drug conjugates [52]. Furthermore, the ability to multiplex RT-qPCR assays allows simultaneous assessment of additional biomarkers including estrogen receptor (ESR1), progesterone receptor (PGR), and proliferation markers (Ki-67), providing comprehensive molecular subtyping from limited FFPE material [53].
From a technical perspective, the one-step RT-qPCR format offers distinct advantages for clinical implementation. The simplified workflow reduces hands-on time, minimizes contamination risks, and enhances reproducibility—critical factors in clinical laboratory settings. The method's tolerance for partially degraded RNA from FFPE specimens makes it particularly suitable for retrospective studies utilizing archival tissue banks [47] [48].
One-step RT-qPCR represents a robust, quantitative, and clinically validated methodology for HER2 assessment in FFPE breast cancer samples. The technique demonstrates excellent concordance with established standards while providing fully quantitative data that may enable refined patient stratification. As breast cancer diagnostics evolve toward more precise quantification, particularly with the emergence of HER2-low as a therapeutic category, one-step RT-qPCR methodologies offer a promising platform for comprehensive biomarker assessment that balances analytical performance with practical implementation considerations. Future developments should focus on standardized cut-off values, inter-laboratory reproducibility, and integration with other molecular profiling approaches to maximize clinical utility.
Colorectal cancer (CRC) is a significant global health challenge, ranking as the third most commonly diagnosed cancer and the second most common cause of cancer-related deaths worldwide [54]. The adenoma-carcinoma sequence, through which normal epithelium slowly transforms into cancerous tissue over 10-15 years, provides a critical window for early detection and intervention [54]. While colonoscopy remains the gold standard for detection, compliance rates are suboptimal due to its invasive nature, unpleasant preparation requirements, and limited access in some regions [54] [55].
Existing non-invasive alternatives, particularly fecal immunochemical tests (FIT), detect occult blood with high specificity (90-95%) but demonstrate limited sensitivity for advanced adenomas (10-40%) and early-stage CRC (37-70%) [54] [56]. The recent emergence of stool-based mRNA biomarkers represents a promising technological advancement that addresses these limitations by detecting molecular signals directly from exfoliated tumor cells, offering the potential for improved sensitivity while maintaining the convenience of at-home collection [54] [57].
Biomarker Discovery and Validation
Bioinformatic Approaches for Biomarker Identification
The selection of optimal mRNA biomarkers is crucial for developing high-performing stool-based screening tests. Recent research has leveraged publicly available transcriptomic datasets to systematically identify promising candidate genes. One comprehensive analysis utilized RNA-seq data from The Cancer Genome Atlas (TCGA) containing 478 colon cancer tissue samples and 692 normal colon/rectum tissue samples from both TCGA and the Genotype-Tissue Expression (GTEx) database [54].
Genes were ranked using a multi-parameter approach that considered:
- Differential expression across the majority of tumors (FDR < 0.001)
- Magnitude of expression level in tumor tissue (AUC > 0.9)
- Fold-change difference between CRC and healthy tissue (log2-fold change > 2)
This bioinformatic screening identified 158 candidate genes, from which the top 20 were selected for clinical validation [54]. When tested on 114 clinical stool samples (CRC N = 33, AA N = 28, Controls N = 53), 14 of these genes demonstrated significant differential expression in CRC patients compared to controls (FDR < 0.05), with a Pearson correlation coefficient of 0.57 (p = 0.007) between tissue and stool expression levels [54].
Performance of Validated mRNA Biomarkers
Table 1: Clinical Performance of Stool mRNA Biomarkers for CRC Detection
| Parameter | CRC Detection | Advanced Adenoma Detection |
|---|---|---|
| Area Under Curve (AUC) | 0.94 | 0.83 |
| Sensitivity | 75.5% | 55.8% |
| Specificity | 95% | 92.6% |
| Sample Size | 33 CRC, 53 controls | 28 AA, 53 controls |
Source: Adapted from Scientific Reports 15, Article number: 29397 (2025) [54]
Additional studies have validated inflammatory gene markers in stool, including IL1B, IL8, and PTGS2, which show significantly increased levels in CRC samples compared to polyp and control groups [58]. These findings support the potential of immune-related transcripts as complementary biomarkers for CRC detection.
Methodological Framework: One-Step vs. Two-Step RT-qPCR
The detection of mRNA biomarkers in stool presents unique technical challenges due to the complex matrix, abundant microbial RNA, and generally low abundance of human mRNA targets. The choice between one-step and two-step RT-qPCR protocols significantly impacts assay performance, workflow efficiency, and practical implementation.
Technical Comparison of RT-qPCR Approaches
Table 2: Comparison of One-Step vs. Two-Step RT-qPCR for Stool mRNA Detection
| Parameter | One-Step RT-qPCR | Two-Step RT-qPCR |
|---|---|---|
| Workflow | Combined RT and PCR in single tube | Separate RT and PCR reactions |
| Primer Strategy | Gene-specific primers only | Random hexamers, oligo(dT), or gene-specific primers |
| Handling Time | Minimal processing | Multiple pipetting steps |
| Risk of Contamination | Lower | Higher |
| Sample Throughput | Ideal for high-throughput | More suitable for lower throughput |
| cDNA Archive | No stable cDNA bank created | cDNA can be stored for future assays |
| Optimization Flexibility | Compromised conditions | Individual optimization of each step |
| Ideal Application | Limited targets, abundant RNA | Multiple targets, limited RNA |
| Sensitivity | Potentially lower | Generally higher |
Source: Adapted from Takara Bio and IDT technical guides [59] [3]
Workflow Diagram for Stool mRNA Detection
Protocol for Optimal RNA Extraction and Detection
Recent methodological comparisons have identified optimal protocols for stool-based mRNA detection [58]. The recommended approach utilizes:
RNA Extraction Protocol:
- Kit: Stool total RNA purification kit (Norgen Biotech Corp.)
- Sample Input: ~20 mg stool preserved in RNAlater
- Storage: -80°C until processing
- Quality Assessment: Spectrophotometric quantification and integrity verification
Reverse Transcription PCR Protocol:
- Method: One-step RT-PCR using Superscript III kit (Invitrogen)
- Advantage: This combination provided high RNA purity with sensitive and consistent mRNA detection
- Validation: Successfully detected inflammatory markers (IL1B, IL8, PTGS2) in clinical cohorts
This protocol has demonstrated robustness across 68 stool samples from a validation cohort (22 cancer, 24 polyps, 22 controls), supporting its suitability for larger-scale studies [58].
Current Landscape and Commercial Development
FDA-Approved Stool RNA Tests
The field of stool-based mRNA detection reached a significant milestone with the FDA approval of ColoSense, a multi-target stool RNA (mt-sRNA) test developed by Geneoscopy [57]. This test represents the first FDA-approved RNA-based screening test for colorectal cancer.
Test Characteristics:
- Indication: Average-risk individuals aged 45 years and older
- Technology: Detection of colorectal neoplasia-associated RNA markers and occult hemoglobin
- Collection Method: Simplified stool collection without sample scraping
- Performance: 93% sensitivity for CRC, 45% sensitivity for advanced adenomas
- Younger Cohort: 100% sensitivity for CRC in ages 45-49 [57]
Components: The ColoSense test incorporates a multi-analyte approach combining:
- Fecal immunochemical test (FIT) for hemoglobin detection
- RNA biomarkers shed by tumor or precancerous cells
- Patient factor (smoking status) in the composite scoring algorithm [56]
Limitations and Considerations
While RNA-based tests show promise, several limitations warrant consideration:
Analytical Performance: Independent analyses of the ColoSense test indicate that the RNA component alone demonstrated limited diagnostic power (AUROC 0.58-0.62), suggesting most of the test's performance derives from the FIT component [56]. This highlights the need for continued biomarker refinement.
Specificity Concerns: ColoSense specificity of 85.6% is lower than the multi-target stool DNA test Cologuard (91%), potentially increasing false positives and unnecessary colonoscopies [56].
Population Representation: The CRC-PREVENT trial for ColoSense included 34.3% current or former smokers, nearly three times the U.S. adult average, potentially inflating sensitivity estimates in this higher-risk cohort [56].
The Scientist's Toolkit: Essential Research Reagents
Table 3: Key Research Reagents for Stool-Based mRNA Detection
| Reagent/Kit | Manufacturer | Primary Function | Application Notes |
|---|---|---|---|
| Stool Total RNA Purification Kit | Norgen Biotek | RNA extraction from complex stool matrix | Provides high purity RNA; suitable for challenging samples |
| miRNeasy Mini Kit | Qiagen | Alternative RNA extraction method | Comparison option for protocol optimization |
| NucliSENS EasyMAG System | BioMérieux | Automated nucleic acid extraction | Uses generic protocol for stool samples |
| Superscript III One-Step RT-PCR | Invitrogen | Combined reverse transcription and PCR | Optimal for sensitive detection of low-abundance targets |
| TaqMan Probe-Based qPCR | Various | Quantitative detection of specific targets | FAM/BHQ1 labeling; superior to SYBR Green for specificity |
| RNAlater | Thermo Fisher | RNA preservation at collection | Maintains RNA integrity during storage and transport |
Source: Compiled from PMC11551167 and related methodologies [58]
Stool-based mRNA detection represents a significant advancement in non-invasive colorectal cancer screening, leveraging the molecular signatures of exfoliated tumor cells to improve early detection of both cancerous and precancerous lesions. The integration of bioinformatic discovery approaches with rigorous clinical validation has identified promising biomarker panels with compelling performance characteristics.
The methodological choice between one-step and two-step RT-qPCR protocols remains context-dependent, with one-step methods offering workflow advantages for high-throughput applications with limited targets, while two-step approaches provide greater flexibility and optimization potential for comprehensive biomarker panels. As the field evolves, ongoing refinement of RNA extraction protocols, stabilization methods, and detection technologies will further enhance the sensitivity and specificity of these assays.
The recent FDA approval of the first mt-sRNA test marks a transition from research to clinical implementation, though important questions regarding real-world performance, economic impact, and comparative effectiveness remain. Future research directions should focus on expanding biomarker panels, integrating artificial intelligence for pattern recognition, and validating performance across diverse populations to ensure equitable access and effectiveness of this promising screening modality.
Optimizing Assay Performance and Overcoming Common Challenges
Critical MIQE Guidelines for Reproducible and Reliable Results
The Minimum Information for Publication of Quantitative Real-Time PCR Experiments (MIQE) guidelines provide a standardized framework for ensuring the reliability and reproducibility of qPCR experiments [60] [61]. Originally published in 2009 and recently updated as MIQE 2.0, these guidelines have become one of the most widely cited methodological publications in molecular biology, with over 17,000 citations to date [17]. In the critical context of cancer biomarker research—where qPCR is frequently used to identify and validate gene expression patterns associated with diagnosis, prognosis, and treatment response—adherence to MIQE principles is not merely beneficial but essential. The technique's sensitivity makes it invaluable for detecting subtle expression changes in low-abundance transcripts, but this same sensitivity renders it vulnerable to pre-analytical and analytical variables that can compromise data integrity if not properly controlled.
The revised MIQE 2.0 guidelines represent a significant evolution from the original publication, incorporating advances in qPCR technology and extending guidance in key areas such as sample handling, assay design, validation, and data analysis [17]. These updates are particularly relevant for cancer researchers working with challenging sample types like formalin-fixed paraffin-embedded (FFPE) tissues or liquid biopsies, where RNA quality and quantity may be limiting factors. Despite widespread awareness of MIQE, compliance remains problematic, with serious deficiencies persisting in experimental transparency, assay validation, and data reporting [17]. This matters profoundly in cancer research because results derived from qPCR underpin decisions in biomarker development, diagnostics, and therapeutic targeting. When methodological rigor is compromised, the consequences extend beyond publication credibility to potential impacts on clinical translation.
Essential MIQE Checklist Components
Sample Quality and Pre-Analytical Processing
The foundation of any reliable qPCR experiment begins with proper sample acquisition, storage, and nucleic acid quality assessment. For cancer biomarker studies comparing one-step versus two-step RT-qPCR, complete documentation of sample handling is particularly crucial as different sample types (e.g., FFPE, fresh frozen, liquid biopsies) present unique challenges.
Table 1: Essential Sample Quality Information Required by MIQE Guidelines
| Checklist Item | Details Required | Significance in Cancer Biomarker Research |
|---|---|---|
| Sample Collection & Storage | Time to stabilization, storage conditions and duration | Critical for clinical samples; affects RNA integrity |
| Nucleic Acid Quality | RNA integrity number (RIN) or similar metrics | Degraded RNA from FFPE tissues impacts efficiency |
| Nucleic Acid Quantification | Method and instrumentation used | Ensures appropriate template input across samples |
| Reverse Transcription | Priming method (random, oligo-dT, gene-specific), enzyme, reaction conditions | Crucial for one-step vs. two-step protocol comparisons |
| Inhibition Testing | Assessment of PCR inhibitors in sample | Particularly important for liquid biopsy samples |
MIQE 2.0 explicitly emphasizes why the entire qPCR workflow must adapt to emerging applications, providing coherent guidance for sample handling that accounts for the realities of modern biomedical research [17]. The guidelines reinforce that nucleic acid quality and integrity must be properly assessed rather than assumed, as this fundamentally impacts amplification efficiency and thus quantitative accuracy [17]. In cancer biomarker studies, where samples may be precious and limited, the temptation to proceed with suboptimal RNA is strong, but MIQE compliance requires objective quality assessment before proceeding to reverse transcription.
Assay Validation and Experimental Design
Robust assay validation is a cornerstone of MIQE compliance and is especially critical when evaluating cancer biomarkers where small expression differences may carry clinical significance.
Table 2: Essential Assay Validation Components Required by MIQE
| Parameter | Target Value | Calculation Method |
|---|---|---|
| Amplification Efficiency | 90-110% | Standard curve with slope of -3.1 to -3.6 |
| Precision | CV <5% for Cq values | Replicate variability assessment |
| Specificity | Single peak in melt curve (SYBR Green) or no signal in NTC | Verification of single amplicon |
| Dynamic Range | Minimum 5 orders of magnitude | Serial dilution analysis |
| Sensitivity | Limit of detection/quantification defined | Based on dilution series |
The MIQE guidelines stress that assay efficiencies must be measured, not assumed [17]. This is particularly important when comparing one-step and two-step RT-qPCR methodologies for cancer biomarker detection, as efficiency differences between these approaches could lead to erroneous conclusions about biomarker performance. Primer sequences for all assays must be fully disclosed, or in the case of commercial assays like TaqMan, the assay ID and amplicon context sequence must be provided [61]. Thermo Fisher Scientific supports MIQE compliance by providing comprehensive Assay Information Files (AIF) for each TaqMan assay that contain the required context sequence [61].
Experimental Protocols for MIQE-Compliant qPCR
One-Step vs. Two-Step RT-qPCR Workflow for Cancer Biomarkers
The decision between one-step and two-step RT-qPCR protocols represents a critical methodological choice in cancer biomarker research with implications for throughput, sensitivity, and variability. The following workflow diagram illustrates the key decision points and considerations for each approach:
Detailed Protocol: Efficiency Validation for Cancer Biomarker Assays
Regardless of whether one-step or two-step methods are employed, MIQE requires demonstration of amplification efficiency for each assay. This protocol describes how to properly validate assays for cancer biomarker applications:
Standard Curve Preparation: Prepare a serial dilution series spanning at least 5 orders of magnitude (e.g., 1:10 to 1:100,000) using pooled cDNA sample or synthetic template.
qPCR Setup: Run all dilutions in triplicate using the same reaction conditions planned for experimental samples. Include no-template controls (NTC) to detect contamination.
Data Collection: Run amplification protocol with fluorescence capture at appropriate cycle stage.
Efficiency Calculation: Plot Cq values against log template concentration and perform linear regression. Calculate efficiency using the formula: Efficiency = [10(-1/slope) - 1] × 100%.
Acceptance Criteria: assays with efficiency between 90-110% (slope -3.6 to -3.1) and correlation coefficient (R²) >0.985 are generally acceptable.
For cancer biomarker studies specifically, efficiency should be validated in the same matrix as experimental samples (e.g., FFPE-derived cDNA) as inhibitors may impact performance. The algorithm known as "Real-time PCR Miner" provides an objective, noise-resistant method for calculating efficiency and Cq from individual PCR reactions without standard curves, using kinetic analysis of the exponential phase [62].
Data Analysis and Reference Gene Validation
The most common approaches for qPCR data analysis include the 2-ΔΔCT method and efficiency-adjusted models [63]. However, reliance on the 2-ΔΔCT method often overlooks critical factors such as amplification efficiency variability and reference gene stability [64]. ANCOVA (Analysis of Covariance) offers greater statistical power and robustness compared to 2-ΔΔCT according to recent research [64].
For reference gene validation in cancer biomarker studies:
Select Candidate References: Choose 3-5 potential reference genes from different functional pathways.
Assay Stability: Use algorithms such as geNorm, NormFinder, or BestKeeper to determine expression stability across all experimental conditions.
Validate in Context: Confirm reference gene stability is maintained in different tissue types, cancer stages, or treatments included in the study.
The fractional cycle number at threshold (CT) must be set within the exponential phase of the PCR so it reflects initial template differences rather than just a change in reaction kinetics [62]. Proper baseline correction is equally critical, as incorrect baseline settings can significantly alter Cq values and lead to erroneous quantification [63].
The Scientist's Toolkit: Research Reagent Solutions
Table 3: Essential Reagents and Materials for MIQE-Compliant qPCR
| Reagent/Material | Function | MIQE-Compliant Specifications |
|---|---|---|
| Nucleic Acid Quality Assessment | Determine RNA integrity | RNA Integrity Number (RIN) or similar quantitative metric required |
| Reverse Transcriptase | cDNA synthesis | Specific enzyme, priming method, and reaction conditions must be documented |
| qPCR Master Mix | Amplification reaction | Enzyme source, fluorescence chemistry, and buffer composition specified |
| Validated Primers/Probes | Target-specific amplification | Primer sequences, concentrations, validation data; or commercial assay IDs with context sequences |
| Reference Gene Assays | Normalization control | Stability data across experimental conditions, not just historical use |
For commercial assay systems such as TaqMan, MIQE compliance requires providing the assay ID along with amplicon context sequence [61]. Thermo Fisher Scientific supports this requirement by providing a comprehensive Assay Information File (AIF) for each assay that contains the required context sequence [61]. The company's TaqMan Assay Search Tool provides additional annotation information including Entrez Gene ID, gene symbol, RefSeq IDs, amplicon length, and probe location [61].
The MIQE guidelines provide an essential framework for ensuring that qPCR data generated in cancer biomarker research are reliable, reproducible, and clinically relevant. The updated MIQE 2.0 guidelines offer timely, authoritative, and detailed guidance for addressing common deficiencies in qPCR experimental design, execution, and reporting [17]. As the editorial on MIQE 2.0 emphasizes, what is needed now is cultural change—among researchers, reviewers, journal editors, and regulatory agencies [17]. We must stop treating qPCR as a "black box" technology and instead apply the same expectations for transparency, validation, and reproducibility that are demanded of other molecular techniques.
For researchers focused on cancer biomarkers, strict adherence to MIQE is particularly critical when comparing one-step versus two-step RT-qPCR methodologies. The experimental choices made at each stage of the workflow—from sample processing through data analysis—can significantly impact the resulting biomarker performance characteristics. By implementing the detailed protocols and checklists provided in this application note, researchers can ensure their findings reflect true biological differences rather than methodological artifacts. In an era of increasing emphasis on reproducible science and translational research, MIQE compliance is not an optional extra but a fundamental requirement for producing clinically meaningful results that can reliably inform diagnostic and therapeutic development.
Within the framework of investigating one-step versus two-step reverse transcription quantitative PCR (RT-qPCR) for cancer biomarkers research, the initial reverse transcription (RT) step is a critical determinant of data accuracy. The fidelity of this step, which converts RNA into complementary DNA (cDNA), directly impacts the reliable quantification of often rare and valuable transcriptional biomarkers. This application note provides detailed protocols and data-driven recommendations for optimizing two key parameters in RT: enzyme selection and reaction temperature, to ensure maximal sensitivity and reproducibility in downstream qPCR analysis.
Strategic Workflow: One-Step vs. Two-Step RT-qPCR
The fundamental choice between a one-step and a two-step RT-qPCR protocol dictates the degree to which the reverse transcription step can be optimized. The decision tree below outlines the critical branching points in this selection process, particularly from the perspective of a research project focused on cancer biomarker discovery and validation.
The one-step protocol combines the RT and PCR steps in a single tube, reducing hands-on time and contamination risk, which is beneficial for high-throughput screening of a few known biomarkers [65] [11]. Conversely, the two-step method physically separates the reactions, allowing for independent optimization of each step and the creation of a stable cDNA bank that can be used to analyze numerous targets from a single, often precious, patient RNA sample [65] [66]. This makes it exceptionally suited for biomarker panels where the same cDNA can be used to quantify multiple genes.
Comparative Analysis of Reverse Transcriptase Enzymes
The core enzyme driving the RT reaction has a profound impact on the success of cDNA synthesis, especially when dealing with complex or suboptimal RNA templates commonly encountered in clinical cancer research, such as fragments from formalin-fixed, paraffin-embedded (FFPE) tissues.
Key Enzyme Properties
The choice of reverse transcriptase is governed by several biochemical properties detailed in the table below.
Table 1: Properties and Performance of Common Reverse Transcriptases
| Enzyme Class | RNase H Activity | Max Recommended Reaction Temp. | Typical Reaction Time | cDNA Synthesis Length (approx.) | Yield with Suboptimal RNA |
|---|---|---|---|---|---|
| AMV Reverse Transcriptase | High | 42°C | 60 min | ≤ 5 kb | Medium [67] |
| MMLV Reverse Transcriptase | Medium | 37°C | 60 min | ≤ 7 kb | Low [67] |
| Engineered MMLV (e.g., SuperScript IV) | Low | 55°C | 10 min | ≤ 12 kb | High [67] |
Implications for Biomarker Research
- RNase H Activity: This inherent activity degrades the RNA template in an RNA-DNA hybrid. Enzymes with high RNase H activity (like AMV) can compromise cDNA yield and length, particularly for long transcripts [67]. Engineered MMLV variants with reduced RNase H activity are therefore preferred for generating full-length or long cDNA products.
- Reaction Temperature: A higher permissible reaction temperature (e.g., 55°C for engineered enzymes) is critical for denaturing RNA with high secondary structure or GC-rich regions, which are common challenges in molecular biology [67]. This directly enhances the specificity and yield of cDNA synthesis from complex biomarker transcripts.
- Speed and Yield: Modern engineered enzymes not only operate at higher temperatures but also do so with shorter incubation times and provide superior yields from challenging or limited RNA samples, a key advantage when working with patient biopsies [67].
Optimizing Reverse Transcription Temperature
Temperature is a powerful lever for controlling the specificity and efficiency of the RT reaction. Its optimization is closely linked to the choice of enzyme and priming strategy.
The Role of Temperature in Specificity
Using an enzyme's maximum permissible temperature is a key strategy to enhance reaction specificity. Lower temperatures (e.g., 37°C) can facilitate non-specific primer binding and the formation of primer-dimers during the RT step itself [68]. As shown in experimental data, increasing the RT temperature from 37°C to 45°C using a one-step protocol significantly reduced non-specific products, resulting in a cleaner melt curve analysis [68]. The higher temperature helps to ensure that primers bind only to their perfectly complementary sequences.
Interaction with Priming Strategies
The optimal reaction temperature is also determined by the primers used for cDNA synthesis:
- Oligo(dT) Primers: These primers, which anneal to the poly-A tail of mRNA, can be extended to 20 nucleotides or longer to stabilize annealing at higher temperatures, improving the efficiency of cDNA synthesis from the 5' end of transcripts [67].
- Random Hexamers: These primers annece at multiple points along the RNA transcript. While beneficial for fragmented RNA, their short length traditionally required lower RT temperatures. Using a high-temperature capable reverse transcriptase with random hexamers may require adjusting primer concentration or buffer conditions to maintain efficacy.
- Gene-Specific Primers: The design of these primers is critical. They must be designed to bind to an accessible region of the target RNA at the elevated RT temperature to avoid mis-priming [68].
Detailed Experimental Protocols
Protocol A: Two-Step RT-qPCR for Sensitive Detection of Multiple Biomarkers
This protocol is designed for generating a cDNA archive from a patient RNA sample, enabling the future analysis of a panel of cancer biomarkers.
Part 1: Genomic DNA Removal
- Treat RNA Sample: Add 1 µg of total RNA, 1 µL of ezDNase Enzyme (or similar), and nuclease-free water to a final volume of 10 µL [67].
- Incubate: 37°C for 2 minutes [67].
- Optional Inactivation: The enzyme can be inactivated at 55°C for 2 minutes, though this is optional as ezDNase does not degrade single-stranded DNA [67].
Part 2: First-Strand cDNA Synthesis
- Prepare RT Master Mix (per reaction):
- Incubate: 55°C for 10 minutes [67].
- Enzyme Inactivation: 85°C for 5 minutes.
- Storage: The synthesized cDNA can be stored at -20°C or -80°C for long-term use as a bankable resource.
Part 3: Quantitative PCR
- Prepare qPCR Mix (per reaction):
- 10 µL of 2X SYBR Green qPCR Master Mix
- 2 µL of Gene-Specific Primer Mix (e.g., 10 µM each)
- 2 µL of cDNA template (from Part 2; a 1:5 to 1:10 dilution is often optimal)
- 6 µL of Nuclease-free water.
- Run qPCR:
- Initial Denaturation: 95°C for 10 minutes.
- 40 Cycles: 95°C for 15 seconds, 60°C for 1 minute.
- Melt Curve Analysis: 60°C to 95°C, measuring fluorescence every 0.5°C.
Protocol B: One-Step RT-qPCR for High-Throughput Target Screening
This streamlined protocol is ideal for rapidly screening a small number of predefined biomarkers across many samples.
- Prepare Reaction Mix (per reaction):
- 10 µL of 2X One-Step RT-qPCR Reaction Mix (contains buffer, dNTPs, DNA polymerase)
- 1 µL of One-Step Enzyme Mix (contains reverse transcriptase and hot-start Taq polymerase)
- 2 µL of Gene-Specific Primer Mix (e.g., 10 µM each) [11] [66]
- X µL of RNA Template (1-100 ng total RNA)
- Nuclease-free water to a final volume of 20 µL.
- Run Combined Protocol:
- Reverse Transcription: 48°C for 30 minutes [4].
- RT Inactivation / Initial Denaturation: 95°C for 10 minutes.
- qPCR Amplification (40 Cycles): 95°C for 15 seconds, 60°C for 1 minute.
- Melt Curve Analysis: As in Protocol A.
The Scientist's Toolkit: Essential Reagents
Table 2: Key Research Reagent Solutions for Optimized Reverse Transcription
| Reagent / Material | Function & Importance in Optimization |
|---|---|
| Engineered MMLV RT (e.g., SuperScript IV) | High-temperature, RNase H- minus reverse transcriptase for superior cDNA yield and length, especially from difficult RNA [67]. |
| Double-Strand-Specific DNase (e.g., ezDNase) | Rapidly removes genomic DNA contamination without damaging RNA or single-stranded DNA, streamlining the workflow compared to DNase I [67]. |
| Anchored Oligo(dT) Primers | Prevents "slippage" on the poly-A tail, ensuring cDNA synthesis starts immediately upstream of the tail, improving consistency for 3' end assays [67]. |
| Random Hexamer / Oligo(dT) Primer Mix | Provides comprehensive cDNA coverage by capturing both polyadenylated transcripts (via Oligo(dT)) and non-polyA transcripts or regions with secondary structure (via random primers) [68]. |
| SYBR Green I qPCR Master Mix | Fluorescent dye for real-time detection of amplified cDNA in qPCR; requires optimization of primer concentration to minimize primer-dimer formation [69]. |
The rigorous optimization of reverse transcription is non-negotiable for generating reliable and meaningful data in cancer biomarker research. The selection between a one-step and two-step protocol sets the stage for experimental flexibility. Within this framework, the deliberate choice of a modern, engineered reverse transcriptase capable of functioning at high temperatures, coupled with a strategic priming approach, dramatically increases cDNA yield, specificity, and the faithful representation of the original RNA population. By adhering to the detailed protocols and principles outlined in this application note, researchers can significantly enhance the robustness of their RT-qPCR data, thereby strengthening the validation of potential diagnostic and prognostic cancer biomarkers.
The reliability of reverse transcription quantitative PCR (RT-qPCR) in cancer biomarkers research is critically dependent on sample quality. Formalin-fixed paraffin-embedded (FFPE) tissues and other complex biological matrices contain numerous substances that can inhibit enzymatic reactions in molecular assays, potentially leading to false negatives or inaccurate quantification [70]. This challenge is particularly relevant in oncology, where FFPE tissues represent a vast and invaluable resource for biomarker discovery and validation. Efficient management of these inhibitors is therefore a prerequisite for robust gene expression analysis.
The choice between one-step and two-step RT-qPCR protocols further influences how inhibitors must be managed. One-step RT-qPCR combines reverse transcription and amplification in a single tube, offering workflow advantages but less flexibility in optimizing each reaction separately. In contrast, two-step RT-qPCR physically separates these processes, allowing for independent optimization and additional purification steps to remove inhibitors [71]. This application note details standardized protocols for managing inhibitors in challenging samples, framed within the context of cancer biomarker research utilizing both one-step and two-step RT-qPCR approaches.
The Challenge of Inhibitors in Cancer Research Samples
Common Inhibitors in FFPE and Complex Matrices
FFPE tissues and complex sample types present unique challenges for nucleic acid analysis. In FFPE samples, inhibitors can originate from the fixation and embedding process itself, including formalin-induced crosslinks, paraffin residues, and proteins that may co-purify with nucleic acids [72]. Other complex matrices relevant to cancer research, such as cosmetic formulations used in dermal studies or blood components in liquid biopsies, contain substances like lipids, polysaccharides, hemoglobin, immunoglobulin G, urea, and xenobiotics that can interfere with PCR amplification [70].
These substances inhibit PCR through various mechanisms: binding to nucleic acids, interfering with polymerase activity, or chelating magnesium ions essential for enzymatic function. The impact ranges from complete reaction failure to reduced amplification efficiency and inaccurate quantification—particularly problematic when analyzing low-abundance cancer biomarkers [70].
Implications for Cancer Biomarker Detection
The presence of inhibitors assumes greater significance in cancer biomarker research where sample quantity is often limited, and accurate quantification is paramount. False negatives or depressed quantification cycle (Cq) values can directly impact the assessment of biomarker expression levels, potentially affecting diagnostic, prognostic, or treatment decisions [73]. Managing these inhibitors effectively is therefore not merely a technical consideration but a fundamental requirement for generating clinically relevant data.
Experimental Protocols for Inhibitor Management
Protocol 1: DNA Extraction from Complex Matrices Using Automated Systems
This protocol, adapted from a study on pathogen detection in cosmetics, demonstrates an effective approach for inhibitor removal from challenging matrices [70].
Materials and Equipment
- PowerSoil Pro DNA Extraction Kit (Qiagen) or equivalent
- QIAcube Connect automated extractor or equivalent system
- CD1 solution (kit component)
- PowerBead Pro Tubes
- Vortex adapter for 2 mL tubes
- Microcentrifuge
- Laminar flow hood
- Incubator
Procedure
- Sample Preparation: For complex matrices, begin with a 1:100 dilution of the initial sample in appropriate buffer if initial extraction fails.
- Enrichment: Incubate samples at 32.5°C for 20-24 hours. For particularly inhibitory matrices, extend incubation to 36 hours.
- Lysate Preparation:
- Transfer 250 µL of enrichment culture to a clean tube.
- Add 800 µL of CD1 solution.
- Transfer mixture to a PowerBead Pro Tube.
- Vortex on a vortex adapter for 10 minutes at maximum speed.
- Centrifugation: Centrifuge lysates at 15,000 × g for 1 minute.
- Supernatant Collection: Transfer 650 µL of supernatant to rotor adapters, avoiding disturbance of the pellet.
- Automated Extraction: Load adapters onto the QIAcube Connect instrument and execute the manufacturer's protocol.
- Elution: Elute DNA in the recommended volume (typically 50-100 µL) and store at -20°C until analysis.
This method has demonstrated 100% detection efficiency for pathogens in complex cosmetic matrices, outperforming traditional culture methods [70].
Protocol 2: Stepwise Optimization of RT-qPCR Conditions
This protocol provides a systematic approach to optimizing RT-qPCR conditions to overcome residual inhibition effects, based on established methodologies for achieving high-efficiency amplification [5].
Materials and Equipment
- PCR Optimization Kit (e.g., Promega PCR Optimization Kit with Buffers A-H)
- GoTaq Hot Start Polymerase or equivalent
- GoScript Reverse Transcriptase or equivalent
- Recombinant RNasin Ribonuclease Inhibitor
- MgCl₂ solution
- BRYT Green Dye or equivalent DNA-binding fluorescent dye
- CXR passive reference dye (if required by instrument)
- Target-specific primers
- RNA samples (including positive controls)
- Real-time PCR instrument
Optimization Procedure
Primer Design and Validation:
- Design primers based on single-nucleotide polymorphisms (SNPs) present in all homologous sequences.
- Validate specificity using Primer-BLAST or similar tools.
- For miRNA analysis, consider specialized systems like RT-HOS for one-pot multiplex detection [74].
Buffer Screening:
- Prepare 2X master mixes containing polymerase, reverse transcriptase, MgCl₂, and fluorescent dyes.
- Test all eight PCR Buffers (A-H) in separate reactions.
- Use the following reaction composition per 25 µL:
- 1X PCR Buffer
- 0.05U/µL GoTaq Hot Start Polymerase
- 0.2U/µL GoScript Reverse Transcriptase
- 1U/µL Recombinant RNasin Ribonuclease Inhibitor
- 2mM MgCl₂
- 1X BRYT Green Dye
- 30nM CXR (if required)
- 200nM forward and reverse primers
Thermal Cycling:
- Reverse Transcription: 15 min at 37°C
- Enzyme Activation: 10 min at 95°C
- Amplification (40 cycles): 10 sec at 95°C, 1 min at 62°C
- Melt Curve Analysis: Instrument default settings
Data Analysis:
- Assess amplification efficiency (90-110% ideal), R² values (≥0.99), and Cq values.
- Perform melt curve analysis to verify specific product formation.
- Select the buffer providing the best combination of efficiency, sensitivity, and specificity.
This optimization approach has demonstrated success in achieving R² ≥ 0.9999 and efficiency = 100 ± 5% under optimized conditions [5] [75].
Comparative Data Analysis
Performance of PCR Buffers with Challenging Samples
Table 1: Performance Characteristics of Different PCR Buffers with B2M Target Amplified from Human Total RNA
| PCR Buffer | Specificity (NTC Positive/Total) | Product Tm (°C) | Linearity (R²) | Efficiency (%) | Recommended Application |
|---|---|---|---|---|---|
| A | 0/4 | 80.97 | 0.998 | 102 | High efficiency applications |
| B | 0/4 | 80.13 | 0.998 | 94 | Standard applications |
| C | 0/4 | 81.46 | 0.995 | 94 | High specificity needs |
| D | 0/4 | 82.75 | 0.997 | 106 | Challenging templates |
| E | 0/4 | 80.58 | 0.999 | 102 | High precision quantification |
| F | 0/4 | 77.17 | 0.997 | 87 | Not recommended for efficient amplification |
| G | 0/4 | 80.11 | 0.999 | 102 | High sensitivity detection |
| H | 2/4* | 79.49 | 0.997 | 101 | Research use only; shows non-specific amplification |
*Non-specific amplification indicated by broad, low-Tm peak in melting profile [75].
One-step vs. Two-step RT-qPCR: Considerations for Inhibitor Management
Table 2: Comparison of One-step and Two-step RT-qPCR Approaches for Handling Inhibitory Samples
| Parameter | One-step RT-qPCR | Two-step RT-qPCR |
|---|---|---|
| Handling of Inhibitors | Limited options; inhibitors affect both RT and PCR | Additional purification possible between steps |
| Sample Input | Works well with limited sample input [71] | High sensitivity with limited sample input [71] |
| Optimization Flexibility | Unable to optimize RT step separately [71] | Able to optimize RT and qPCR steps separately [71] |
| Workflow | Simple and rapid; reduced contamination risk [71] | More time-consuming; higher contamination risk [71] |
| Throughput | Amenable to high-throughput applications [71] | Less amenable to high-throughput applications [71] |
| cDNA Storage | Does not generate stocks of cDNA [71] | Can generate cDNA stocks for multiple assays [71] |
| Best Applications | High-throughput screening with limited targets | Multiple assays from precious samples; requires extensive optimization |
The Scientist's Toolkit: Essential Research Reagent Solutions
Table 3: Key Reagents and Their Functions in Managing PCR Inhibition
| Reagent Solution | Function | Application Notes |
|---|---|---|
| PowerSoil Pro Kit | DNA extraction with inhibitor removal | Effective for complex matrices; compatible with automation [70] |
| PCR Optimization Kit Buffers | Screen optimal amplification conditions | Buffers A-H provide different salt/additive formulations [75] |
| GoTaq Hot Start Polymerase | Heat-activated DNA polymerase | Reduces non-specific amplification; works with multiple buffers [75] |
| GoScript Reverse Transcriptase | RNA reverse transcription | Compatible with one-step RT-qPCR formulations [75] |
| RNasin Ribonuclease Inhibitor | Protects RNA from degradation | Essential for maintaining RNA integrity during reaction setup [75] |
| BRYT Green Dye | DNA binding fluorescent dye | Alternative to SYBR Green; compatible with various buffer systems [75] |
| MgCl₂ Solution | Cofactor for enzymatic activity | Concentration optimization critical for efficient amplification [75] |
| High-Fidelity DNA Polymerase | Proofreading enzyme for accurate amplification | Alternative to Taq polymerase; useful for sequencing applications [74] |
Workflow Visualization
Inhibitor Management Workflow - This diagram illustrates the comprehensive approach to managing inhibitors in FFPE and complex matrices, from sample extraction through optimized RT-qPCR analysis.
Effective management of inhibitors in FFPE tissues and complex matrices requires an integrated approach combining appropriate extraction methods, systematic reaction optimization, and informed selection of RT-qPCR methodology. The protocols and data presented here provide a framework for researchers to overcome these challenges in cancer biomarker studies. The optimal approach depends on specific research needs: one-step RT-qPCR offers advantages for high-throughput applications with limited targets, while two-step protocols provide greater flexibility for analyzing precious samples or multiple targets. By implementing these standardized protocols, researchers can significantly improve the reliability and reproducibility of gene expression data from challenging but clinically valuable sample types.
Reference Gene Selection and Validation for Accurate Normalization
Reverse transcription quantitative polymerase chain reaction (RT-qPCR) serves as a cornerstone technique in molecular oncology for sensitive and accurate gene expression analysis. A critical, yet often overlooked, factor for obtaining reliable results is the rigorous selection and validation of stable reference genes, which are essential for normalizing sample-to-sample variations. This process is particularly crucial in cancer research, where cellular conditions, such as dormancy induced by therapeutic agents, can dramatically alter the expression of commonly used housekeeping genes [43]. The choice between one-step and two-step RT-qPCR protocols further influences experimental design, flexibility, and the potential for accurate normalization [76] [11]. This application note provides detailed protocols and frameworks for the validation of reference genes, specifically framed within the context of cancer biomarker discovery.
The Critical Importance of Reference Gene Validation in Cancer Research
Using unvalidated reference genes can lead to significant misinterpretation of gene expression data. It has been demonstrated that pharmacological inhibition of the mTOR kinase, an approach to generate dormant cancer cells in vitro, can cause profound changes in the expression of standard housekeeping genes. For instance, in A549, T98G, and PA-1 cancer cell lines treated with the dual mTOR inhibitor AZD8055, the expression of ACTB, RPS23, RPS18, and RPL13A underwent dramatic changes, rendering them categorically inappropriate for normalization [43]. Another study in 3T3-L1 adipocytes highlighted that widely used genes like GAPDH and Actb did not confirm their presumed stability, emphasizing the need for experimental validation in each specific experimental system [77]. The consistent finding across studies is that the most stable reference genes are context-dependent, varying by cell type, tissue, and experimental treatment [78] [79]. Adherence to the MIQE guidelines, which recommend validating at least two stable reference genes, is therefore paramount for data integrity [77].
Experimental Protocol for Reference Gene Evaluation
This section provides a detailed, step-by-step protocol for evaluating candidate reference genes.
Candidate Gene Selection and Primer Design
- Selection of Candidates: Begin by selecting a panel of 8-12 candidate reference genes from various functional classes to minimize the chance of co-regulation. Common candidates include GAPDH, ACTB, B2M, HPRT1, TBP, PPIA, RPLP0, 18S rRNA, and YWHAZ [43] [78] [79].
- Primer Design: Design primers with the following stringent criteria:
- Amplicon Length: 75-200 base pairs.
- Specificity: Use tools like primer-BLAST to ensure specificity, especially in genomes with homologous sequences. Primers should be designed across exon-exon junctions to avoid genomic DNA amplification [5].
- Validation: Each primer pair must be validated for efficiency using a standard curve from a serial dilution of cDNA. The correlation coefficient (R²) should be ≥ 0.99, and the amplification efficiency (E) should be between 90% and 110% [5] [79].
Table 1: Example of Primer Efficiency Validation for Candidate Genes
| Gene Symbol | Official Full Name | Amplicon Size (bp) | Amplification Factor | Efficiency (%) | Citation |
|---|---|---|---|---|---|
| ACTB | β-actin | 101 | 2.01 | 101 | [79] |
| HPRT1 | Hypoxanthine phosphoribosyltransferase 1 | 132 | 2.05 | 104.55 | [78] [79] |
| RPLP0 | Ribosomal protein lateral stalk subunit P0 | 75 | 2.01 | 100.53 | [79] |
| GAPDH | Glyceraldehyde-3-phosphate dehydrogenase | 127 | 1.93 | 93.07 | [79] |
| TBP | TATA-box binding protein | 127 | 1.96 | 96 | [79] |
RNA Extraction and cDNA Synthesis
- RNA Extraction: Extract high-quality total RNA using commercially available kits (e.g., Machery-Nagel, QIAGEN RNeasy). Assess RNA purity spectrophotometrically (A260/A280 ratio >1.8) and integrity via electrophoresis [77] [79].
- cDNA Synthesis: Use a high-capacity cDNA reverse transcription kit. For the two-step protocol, synthesize cDNA using 1 µg of total RNA in a 40 µl reaction with a mixture of random hexamers and oligo(dT) primers to ensure comprehensive representation of mRNA transcripts. The reaction conditions are: 25°C for 10 min, 37°C for 120 min, 85°C for 5 min, and hold at 4°C [79].
qPCR Amplification and Stability Analysis
- qPCR Setup: Perform reactions in triplicate using a SYBR Green-based master mix (e.g., Kapa SYBR Fast) on a real-time PCR instrument. A standard cycling protocol includes an initial denaturation at 95°C for 5 min, followed by 40-45 cycles of 95°C for 20 sec, 55-60°C for 20 sec, and 72°C for 20-30 sec, concluding with a melting curve analysis to verify primer specificity [78] [79].
- Data Analysis: Analyze the resulting quantification cycle (Cq) values using specialized algorithms to determine gene expression stability. The following tools are commonly used in tandem:
- geNorm: Calculates a stability measure (M) for each gene; lower M values indicate greater stability. Also determines the optimal number of reference genes by calculating the pairwise variation (V) between sequential normalization factors [78] [77].
- NormFinder: Evaluates intra- and inter-group variation to identify the most stable gene(s) [78] [77].
- BestKeeper: Relies on raw Cq values and standard deviations to assess stability [78] [77].
- RefFinder: A comprehensive tool that integrates the results from geNorm, NormFinder, BestKeeper, and the comparative ΔCt method to provide an overall ranking [79].
Figure 1: A workflow for the systematic validation of reference genes for RT-qPCR normalization.
One-Step vs. Two-Step RT-qPCR: Application in Cancer Biomarker Studies
The choice between one-step and two-step RT-qPCR protocols has significant implications for workflow, flexibility, and data quality in a research setting, particularly for cancer biomarker studies where sample material may be limited.
Table 2: Comparison of One-Step and Two-Step RT-qPCR Protocols
| Parameter | One-Step RT-qPCR | Two-Step RT-qPCR |
|---|---|---|
| Workflow & Setup | Combined RT and PCR in a single tube and buffer [76] [11]. | Separate, optimized reactions for RT and PCR in different tubes [76] [11]. |
| Priming Strategy | Gene-specific primers only [11]. | Choice of oligo(dT), random hexamers, or gene-specific primers for the RT step [11]. |
| Ideal Application | High-throughput analysis of a few targets from many samples [76] [80]. | Analyzing multiple targets from a single, often precious, RNA sample [11] [80]. |
| Key Advantages | - Faster, simpler workflow- Reduced pipetting steps and contamination risk- Highly reproducible [76] [11]. | - Generates a stable cDNA bank for future analysis- Flexible optimization of each step- Higher sensitivity and efficiency- Ideal for validating multiple reference genes [76] [11] [80]. |
| Key Disadvantages | - Impossible to optimize reactions separately- Less sensitive- Detection of fewer targets per sample [76] [11]. | - More time-consuming- Higher risk of contamination and variation due to handling- Requires more optimization [76] [11]. |
For reference gene validation, the two-step protocol is strongly recommended. It allows the creation of a single, well-characterized cDNA bank from valuable patient-derived or treated cell line samples [79]. This cDNA can then be used to meticulously optimize qPCR conditions for a large panel of candidate reference genes and subsequent target genes of interest across multiple experiments, ensuring maximum accuracy and flexibility [11] [80].
Figure 2: A decision workflow for choosing between one-step and two-step RT-qPCR methods.
A Scientist's Toolkit for Reference Gene Validation
Table 3: Essential Research Reagent Solutions for RT-qPCR Gene Validation
| Item | Function / Application | Examples / Key Characteristics |
|---|---|---|
| RNA Extraction Kit | Isolation of high-integrity, genomic DNA-free total RNA. | Kits from Machery-Nagel, QIAGEN RNeasy Mini; should include DNase I treatment step [77] [79]. |
| Reverse Transcription Kit | Synthesis of first-strand cDNA from RNA templates. | High-capacity cDNA kits (e.g., from Applied Biosystems); should include a mix of random hexamers and oligo(dT) primers [79]. |
| qPCR Master Mix | Fluorescence-based detection and quantification of amplified DNA. | SYBR Green-based master mixes (e.g., Kapa SYBR Fast, Takara Bio kits); should provide high efficiency and specificity [77] [79]. |
| Validated Primer Assays | Sequence-specific amplification of target and reference genes. | Commercially available assays or in-house designed primers with validated efficiency (90-110%) and specificity [5]. |
| Reference Gene Validation Software | Statistical analysis of Cq values to determine expression stability. | geNorm, NormFinder, BestKeeper, and the comprehensive RefFinder platform [77] [79]. |
Accurate normalization is not a mere technical step but the foundation of reliable RT-qPCR data in cancer research. The dramatic rewiring of cellular functions in response to treatments like mTOR inhibition underscores the non-universal nature of housekeeping genes. Therefore, a systematic, context-dependent validation of reference genes, as outlined in this document, is imperative. Integrating this practice with a strategic choice of RT-qPCR protocol—opting for the flexible two-step method for biomarker discovery and validation—will significantly enhance the accuracy, reproducibility, and overall impact of gene expression studies in oncology.
Preventing Contamination and Pipetting Errors in Two-Step Protocols
In the field of cancer biomarker research, the selection of an appropriate Reverse Transcription Quantitative Polymerase Chain Reaction (RT-qPCR) methodology is critical for generating reliable, reproducible data. The two-step RT-qPCR approach, which physically separates the reverse transcription and PCR amplification steps, provides significant advantages for research on low-abundance cancer transcripts and enables the creation of valuable cDNA libraries from precious patient samples [81]. However, this method's multi-tube workflow introduces specific vulnerabilities, including increased risk of contamination during sample transfer and variability introduced through pipetting errors [82] [11]. These technical challenges can compromise data integrity, particularly when quantifying subtle changes in gene expression of critical cancer biomarkers such as HER2, ESR, PGR, and Ki67 [49] [6]. This application note provides detailed strategies to mitigate these risks, ensuring that the superior sensitivity and flexibility of two-step RT-qPCR are fully realized in cancer research applications.
Comparative Workflow Analysis: One-Step vs. Two-Step RT-qPCR
The fundamental difference between one-step and two-step RT-qPCR lies in workflow integration. One-step RT-qPCR combines reverse transcription and PCR amplification in a single, unified reaction tube, whereas two-step RT-qPCR performs these procedures in separate, sequential reactions [11]. This structural distinction dictates their respective advantages, limitations, and optimal applications in a research setting.
Workflow Comparison of One-Step vs. Two-Step RT-qPCR
Key Technical Distinctions and Research Implications
Reaction Integration: In one-step RT-qPCR, both enzymatic reactions occur sequentially in a single tube with a compromised buffer system, whereas two-step protocols use optimized conditions for each reaction separately [11]. This separation allows for superior efficiency and sensitivity, as demonstrated in a study where the two-step method achieved 100±1.5% efficiency compared to lower performance in one-step configurations [4].
Priming Flexibility: One-step reactions are restricted to gene-specific priming during reverse transcription. In contrast, two-step methods offer researchers the choice of random hexamers, oligo-dT primers, or gene-specific primers for cDNA synthesis, enabling more comprehensive analysis of the transcriptome from limited samples [81].
Template Reusability: The two-step approach generates stable cDNA pools that can be stored for future analysis of additional targets, a crucial advantage when working with rare or limited clinical samples such as tumor biopsies [82]. One-step reactions consume the RNA template entirely, requiring fresh sample aliquots for repeated analyses [81].
Quantitative Comparison of Performance Parameters
Table 1: Performance Characteristics of One-Step vs. Two-Step RT-qPCR
| Parameter | One-Step RT-qPCR | Two-Step RT-qPCR | Research Implications |
|---|---|---|---|
| Amplification Efficiency | Potentially compromised due to combined reaction conditions [4] | Higher efficiency (100±1.5%) with optimized separate reactions [4] | Critical for detecting low-abundance cancer biomarkers |
| Handling Time | Minimal hands-on time; streamlined workflow [81] | More time-consuming with additional pipetting steps [82] | Impacts throughput in large-scale screening studies |
| Sample Consumption | Entire RNA sample consumed; no template banking [81] | cDNA can be banked for future analyses of multiple targets [82] | Advantageous for longitudinal studies with limited samples |
| Contamination Risk | Lower risk due to closed-tube format [11] | Higher risk from multiple open-tube steps [11] | Requires stringent anti-contamination protocols |
| Priming Options | Gene-specific primers only [11] | Choice of random hexamers, oligo-dT, or gene-specific [81] | Enables both targeted and global expression profiling |
| Optimal Application | High-throughput screening of limited targets [81] [11] | Analyzing multiple targets from precious samples [81] | Two-step preferred for biobank creation and validation studies |
Critical Risk Points and Prevention Strategies in Two-Step RT-qPCR
The two-step RT-qPCR workflow contains specific vulnerability points where contamination and pipetting errors may occur. Understanding these critical control points enables researchers to implement targeted preventive measures.
Critical Control Points in Two-Step RT-qPCR Workflow
Practical Implementation of Prevention Strategies
Physical Workflow Segregation: Establish physically separated pre-PCR and post-PCR areas with dedicated equipment, reagents, and personal protective equipment. This spatial separation is the most effective strategy for preventing amplicon contamination, which can lead to false-positive results [11].
Barrier Tip Implementation: Use aerosol-resistant filter tips for all liquid handling steps, particularly during cDNA transfer where aerosol formation can contaminate adjacent samples and reagents. This simple measure significantly reduces cross-contamination risk between samples [11].
Pipette Calibration Protocol: Implement a rigorous pipette calibration schedule using gravimetric analysis. For critical dilution steps such as cDNA serial dilutions, employ reverse pipetting techniques to improve volume accuracy and reproducibility [4].
Master Mix Preparation: Always prepare bulk master mixes for reverse transcription and qPCR steps to minimize tube-to-tube variation. This approach reduces pipetting steps and improves inter-assay reproducibility, which is crucial for multi-plate experiments [4].
Comprehensive Experimental Protocol for Contamination-Free Two-Step RT-qPCR
Materials and Reagent Preparation
Table 2: Essential Research Reagent Solutions for Two-Step RT-qPCR
| Reagent/Category | Specific Examples | Function & Application Notes |
|---|---|---|
| Reverse Transcriptase | PrimeScript Reverse Transcriptase [82], Maxima H- [83] | Converts RNA to cDNA; selection impacts efficiency and full-length product yield |
| qPCR Master Mix | SYBR Green master mixes [4], TB Green Premix Ex Taq [82] | Provides detection chemistry, enzymes, and nucleotides for amplification |
| Primer Options | Random hexamers, oligo-dT primers, gene-specific primers [81] | Determines cDNA representation; random hexamers provide whole transcriptome coverage |
| RNA Stabilization | TRIzol [4], RNAlater [84] | Preserves RNA integrity from collection through processing |
| gDNA Removal | gDNA Eraser [82], DNase treatment | Eliminates genomic DNA contamination that causes false positives |
| Quality Control | Agarose gels, Bioanalyzer, spectrophotometry | Verifies RNA integrity and quantitation accuracy pre-reaction |
Step-by-Step Procedural Guidelines
Step 1: RNA Isolation and Quality Control
Begin with high-quality RNA extraction using TRIzol or column-based methods. For formalin-fixed paraffin-embedded (FFPE) tumor samples, employ specialized kits designed for cross-linked RNA [6]. Treat samples with DNase to remove genomic DNA contamination. Quantify RNA using spectrophotometry (A260/A280 ratio of 1.8-2.0 is acceptable) and verify integrity through agarose gel electrophoresis or Bioanalyzer profiling. Use 500 ng of total RNA as input for reverse transcription, consistent with established protocols [4].
Step 2: Reverse Transcription with Contamination Controls
Prepare reverse transcription master mix in a clean, pre-PCR designated area. For a 20 μL reaction: 4 μL 5X reaction buffer, 1 μL RNase inhibitor, 2 μL dNTP mix (10 mM), 2 μL random hexamers/oligo-dT mix (25 μM), 1 μL reverse transcriptase, and nuclease-free water to volume. Include negative controls without reverse transcriptase to monitor genomic DNA contamination. Use barrier tips throughout. Incubate reactions using the following thermal profile: 25°C for 15 minutes (primer annealing), 37°C for 60 minutes (cDNA synthesis), 95°C for 5 minutes (enzyme inactivation) [4].
Step 3: cDNA Transfer and qPCR Setup
Dilute cDNA 1:5 to 1:10 in nuclease-free water. Prepare qPCR master mix in the pre-PCR area containing: 10 μL 2X SYBR Green master mix, 1 μL each of forward and reverse primer (10 μM), and nuclease-free water to volume. Aliquot 19 μL of master mix into qPCR plates, then add 1 μL cDNA template using calibrated electronic pipettes with barrier tips. Include no-template controls (water instead of cDNA) and positive controls (known expressed target) in each run. Seal plates with optical-quality film, ensuring complete sealing to prevent evaporation and contamination.
Step 4: qPCR Amplification and Data Analysis
Perform amplification using the following parameters: initial denaturation at 95°C for 10 minutes, followed by 40 cycles of 95°C for 15 seconds and 60°C for 1 minute [4]. Include a melting curve analysis step post-amplification to verify product specificity. For cancer biomarker studies, use the comparative CT (ΔΔCT) method for relative quantification, normalizing to appropriate reference genes such as RPL13A or RPL37, which have shown stable expression in breast cancer studies [49] [6].
Application in Cancer Biomarker Research: HER2 Case Study
A recent clinical validation study demonstrates the robust application of one-step RT-qPCR for quantifying HER2 gene expression in breast cancer, achieving 93.4% sensitivity and 100% specificity compared to standard IHC/FISH methods [49]. However, for research applications requiring repeated analysis of multiple targets from precious samples, the two-step approach offers distinct advantages. The creation of cDNA libraries enables researchers to bank samples and retrospectively analyze additional biomarkers as new discoveries emerge.
In a comprehensive breast cancer subtyping study, researchers successfully employed a two-step RT-qPCR approach to profile expression of HER2, ESR, PGR, and Ki67 across 61 tumor samples [6]. This multiplexed analysis provided both diagnostic classification and insights into angiogenic potential through simultaneous measurement of HIF1A, ANG, and VEGFR expression. The two-step protocol's flexibility was essential for this extensive biomarker panel validation.
While two-step RT-qPCR presents distinct challenges for contamination control and pipetting accuracy, implementation of the rigorous protocols outlined in this document enables researchers to leverage its full potential for cancer biomarker studies. The ability to bank cDNA samples, analyze multiple targets from limited starting material, and achieve superior amplification efficiency makes two-step RT-qPCR an invaluable tool for comprehensive cancer transcriptome profiling. Through meticulous attention to workflow segregation, pipetting technique, and appropriate control implementation, researchers can generate highly reliable data to advance cancer diagnostics and therapeutic development.
Troubleshooting Low Sensitivity and Efficiency in One-Step Reactions
In the rapidly advancing field of cancer biomarker research, one-step reverse transcription quantitative PCR (RT-qPCR) has emerged as a valuable tool for its streamlined workflow and reduced handling time. This integrated approach, which combines cDNA synthesis and PCR amplification in a single tube, is particularly advantageous for high-throughput screening applications where processing large sample numbers is essential [85] [86]. However, researchers frequently encounter a significant technical hurdle: compromised sensitivity and reaction efficiency compared to two-step methods. This limitation becomes critically important when working with precious clinical samples, such as liquid biopsies, where cancer-derived RNA biomarkers like miRNAs, lncRNAs, and circRNAs are often present in minute quantities [20] [87].
The fundamental challenge stems from the inherent compromise in reaction conditions. In a one-step protocol, a single buffer system must support two enzymatically distinct processes—reverse transcription and PCR amplification—neither of which operates at its individual optimum [38] [11]. This frequently results in reduced cDNA synthesis yield, suboptimal amplification efficiency, and ultimately, diminished detection capability for low-abundance transcripts. For researchers focusing on early cancer detection, where biomarker levels can be extremely low, resolving these sensitivity issues is paramount for generating reliable, reproducible data [88] [89].
Root Causes of Low Sensitivity and Efficiency
Understanding the mechanistic basis for sensitivity limitations is the first step toward effective troubleshooting. The integrated nature of one-step RT-qPCR introduces several potential bottlenecks that collectively impact overall assay performance.
The primary constraint is the non-optimized combined reaction environment. The compromise buffer system and single-temperature incubation conditions can inhibit reverse transcriptase processivity, leading to incomplete cDNA synthesis, especially for longer transcripts or targets with significant secondary structure [38]. Furthermore, the presence of reverse transcription components during the PCR phase can potentially inhibit DNA polymerase activity, reducing amplification efficiency [11]. This is particularly problematic when the target is a non-coding RNA with complex secondary structures or when starting material is limited, as is common with patient-derived samples like saliva, blood, or urine used in liquid biopsy approaches [88] [89].
A second major factor is the restriction to sequence-specific priming only during the reverse transcription step. Unlike two-step protocols that can employ random hexamers or oligo(dT) primers to generate a comprehensive cDNA library, one-step reactions typically use gene-specific primers for both steps [11]. This approach focuses detection on a limited number of targets but can result in inefficient reverse transcription if the primer binding is compromised by RNA secondary structure, ultimately reducing sensitivity [86].
The following diagram illustrates how these factors contribute to the overall challenge in one-step RT-qPCR:
Additional contributing factors include template quality and integrity. RNA degradation, a common issue with clinical samples, disproportionately affects one-step reactions because there is no opportunity for cDNA quality assessment before amplification [86]. Similarly, carryover of inhibitors from the RNA isolation process—such as heparin, denaturants, or salts—can affect both enzymatic steps simultaneously in a one-step format, whereas in a two-step protocol, these can be diluted or removed between reactions [38].
Systematic Optimization Strategies
Reaction Component Optimization
Strategic optimization of reaction components can significantly enhance one-step RT-qPCR performance. The table below outlines key parameters and their optimization strategies:
Table 1: Optimization of Reaction Components for One-Step RT-qPCR
| Component | Challenge | Optimization Strategy | Expected Outcome |
|---|---|---|---|
| Enzyme Blend | Standard polymerases may be inhibited by RT components | Use specialized one-step enzyme mixes with compatible RT and polymerase | Improved amplification efficiency and sensitivity [38] |
| Primer Design | Gene-specific primers alone may give inefficient RT | Redesign primers to span exon-exon junctions; verify specificity with BLAST | Reduced genomic DNA amplification; better specificity [38] [5] |
| Mg²⁺ Concentration | Suboptimal Mg²⁺ affects both RT and PCR efficiency | Titrate Mg²⁺ (typically 1-5 mM) to find optimal concentration | Enhanced enzyme processivity and reaction efficiency [5] |
| Template Quality | Degraded RNA or inhibitors reduce sensitivity | Implement rigorous RNA quality control (RIN >8); use inhibitor removal steps | More consistent results; improved low-copy detection [38] |
| Reaction Additives | Secondary structures limit enzyme access | Incorporate compatible additives (e.g., betaine, DMSO) at optimized concentrations | Improved amplification of structured targets [5] |
For primer design, particular attention should be paid to creating primers that span exon-exon junctions when working with mRNA biomarkers. This design strategy helps prevent amplification of contaminating genomic DNA, a crucial consideration since one-step protocols lack the intermediate purification steps of two-step methods [38]. For small RNA biomarkers like miRNAs, specialized priming approaches such as stem-loop primers may be necessary to address the challenge of short template length [90].
Thermal Cycling Parameter Optimization
The thermal cycling profile represents another critical area for optimization. The reverse transcription step typically requires temperatures between 42°C and 55°C, but higher temperatures within this range can help denature RNA secondary structures, particularly for GC-rich targets [38]. A gradual ramp rate between the reverse transcription and PCR steps (typically 1-2°C/second) can improve enzyme stability and maintain reaction integrity.
The annealing temperature during PCR cycling requires empirical determination through temperature gradient experiments. The optimal temperature is typically 3-5°C below the calculated primer Tm and should yield the lowest Cq value with minimal non-specific amplification [5]. For the detection of cancer biomarkers, where distinguishing closely related family members (e.g., miRNA families) might be necessary, even slight adjustments of 1-2°C can dramatically improve specificity without compromising sensitivity.
Step-by-Step Protocol for Enhanced One-Step RT-qPCR
The following optimized protocol provides a framework for sensitive detection of RNA cancer biomarkers in one-step RT-qPCR, incorporating troubleshooting measures at critical steps:
Pre-Assay Preparation
- RNA Quality Assessment: Verify RNA integrity using an automated electrophoresis system (e.g., Bioanalyzer). Accept only samples with RNA Integrity Number (RIN) ≥8.0 for critical biomarker studies. For liquid biopsy samples where RNA may be fragmented, ensure consistent extraction methods across samples [88].
- Primer Validation: Validate primers using a standard curve with serial dilutions of control RNA. Require amplification efficiency between 90-110% (R² ≥ 0.99) before proceeding with experimental samples [5].
- No-RT Control: Include a no-reverse transcriptase control for each sample to detect genomic DNA contamination. Treat samples with DNase I if contamination is suspected [38].
Reaction Setup
- Prepare a master mix containing:
- 1X one-step RT-qPCR reaction buffer
- Reverse transcriptase/Taq polymerase blend (follow manufacturer's recommendations)
- 3-5 mM Mg²⁺ (optimized for your target)
- 500 μM dNTPs (each)
- 200-400 nM forward and reverse primers (optimized)
- 0.5-1.0 μL RNA template (10-100 ng total RNA)
- Nuclease-free water to 20 μL final volume
- For low-abundance targets (<100 copies), consider adding 0.5M betaine or 2-5% DMSO to improve amplification efficiency of structured templates.
- Mix thoroughly by pipetting, then briefly centrifuge to collect contents at the bottom of the tube.
Thermal Cycling Conditions
- Reverse Transcription:
- 45-50°C for 15-30 minutes (higher temperatures for structured RNA)
- 95°C for 2 minutes (enzyme activation)
- PCR Amplification (45 cycles):
- Denature: 95°C for 15 seconds
- Anneal: Optimized temperature (determined by gradient) for 30 seconds
- Extend: 72°C for 30 seconds (acquire fluorescence signal)
- Melt Curve Analysis:
- 95°C for 15 seconds
- 60°C for 1 minute
- Gradual increase to 95°C at 0.3°C/second (continuous fluorescence acquisition)
This workflow can be visualized as follows:
Table 2: Key Research Reagent Solutions for One-Step RT-qPCR
| Reagent/Resource | Function | Application Notes |
|---|---|---|
| Specialized One-Step Kits | Integrated enzyme mixes for combined RT and PCR | Select kits with optimized buffer systems for your sample type (e.g., liquid biopsies) [86] |
| Stem-Loop Primers | Specialized primers for microRNA detection | Essential for short RNA templates; improve RT efficiency for miRNAs [90] |
| RNA Stabilization Reagents | Preserve RNA integrity during sample collection | Critical for clinical samples; prevent degradation of low-abundance biomarkers [88] |
| Inhibitor Removal Kits | Remove PCR inhibitors from sample prep | Essential for blood, saliva, or stool samples containing endogenous inhibitors [89] |
| Digital PCR Systems | Absolute quantification of low-abundance targets | Validation tool for rare transcript detection; provides high sensitivity [89] |
Advanced Applications in Cancer Biomarker Research
Despite its challenges, optimized one-step RT-qPCR offers significant utility in cancer biomarker research, particularly for validating transcriptomic findings from high-throughput sequencing studies. When dealing with large sample cohorts, the streamlined workflow enables rapid screening of candidate biomarkers identified through RNA sequencing or microarray analyses [20]. The single-tube format also minimizes handling errors and cross-contamination risks, improving reproducibility across multi-center studies—a common scenario in biomarker validation.
Emerging methodologies like SMART-qPCR represent the next evolution of one-step approaches, enabling simultaneous detection of different RNA biotypes (miRNAs, mRNAs, lncRNAs) in a single reaction [90]. This is particularly valuable for analyzing competing endogenous RNA (ceRNA) networks, where correlating the expression of different RNA species can reveal important regulatory interactions in cancer biology. These advanced systems address traditional limitations through optimized reverse transcription strategies that accommodate the different structural features of diverse RNA classes.
For liquid biopsy applications, where sample volume is often limited, the minimal sample consumption of one-step RT-qPCR is a distinct advantage. When optimized according to the principles outlined herein, the method can effectively detect circulating RNA biomarkers in blood, saliva, or urine, supporting the development of non-invasive cancer diagnostics [88] [87]. Research shows that multi-marker panels analyzed through such sensitive methods can achieve diagnostic sensitivities exceeding 90% for cancers like lung cancer when combining salivary and blood biomarkers [88].
Successfully troubleshooting low sensitivity and efficiency in one-step RT-qPCR requires a systematic approach addressing reaction components, thermal cycling parameters, and sample quality. While the fundamental compromise of combined reaction conditions remains, the optimization strategies outlined herein can significantly enhance performance to levels suitable for most cancer biomarker applications. The protocol emphasizes rigorous RNA quality control, empirical determination of optimal conditions, and appropriate controls to ensure reliable detection of low-abundance targets.
For researchers working with precious clinical samples where RNA quantity is limited or when targeting challenging biomarkers with extensive secondary structure, two-step RT-qPCR may still offer advantages in sensitivity and flexibility [86] [11]. However, for high-throughput applications, rapid screening, or when analyzing multiple RNA types simultaneously with emerging technologies, the optimized one-step approach provides an invaluable balance of practicality and performance, advancing the discovery and validation of next-generation cancer biomarkers.
Clinical Validation and Comparative Analysis of RT-qPCR Protocols
The choice between one-step and two-step reverse transcription quantitative polymerase chain reaction (RT-qPCR) is a critical methodological decision in cancer biomarker research. This technique is indispensable for analyzing gene expression patterns of emerging cancer biomarkers, such as circulating tumor DNA (ctDNA), exosomes, and microRNAs (miRNAs), which are crucial for early cancer detection and diagnosis [91]. The decision between these two approaches directly impacts the reliability, efficiency, and scope of research findings. This application note provides a detailed comparative analysis of one-step and two-step RT-qPCR methodologies, focusing on the core parameters of throughput, sensitivity, flexibility, and hands-on time. We present standardized protocols and quantitative data to guide researchers, scientists, and drug development professionals in selecting the optimal approach for their specific cancer biomarker applications, ultimately supporting advancements in precision oncology.
Key Comparative Parameters
The selection between one-step and two-step RT-qPCR involves significant trade-offs across multiple experimental parameters. The table below provides a systematic comparison to guide protocol selection.
Table 1: Comprehensive Comparison of One-Step and Two-Step RT-qPCR
| Parameter | One-Step RT-qPCR | Two-Step RT-qPCR |
|---|---|---|
| Workflow Setup | Combined RT and PCR in a single tube and buffer [11] | Separate, optimized reactions for RT and PCR [11] |
| Priming Strategy | Gene-specific primers only [11] [3] | Choice of oligo(dT), random hexamers, gene-specific primers, or a mix [11] [92] |
| Throughput | High-throughput, ideal for processing many samples [11] [92] | Lower throughput, more suitable for multiple targets from few samples [92] |
| Sensitivity | Can be less sensitive due to compromised reaction conditions [11]; May be more sensitive for specific low-abundance targets with gene-specific priming [41] | Potentially higher sensitivity with optimized conditions for each step [11] |
| Flexibility & cDNA Usage | Limited; cDNA is not saved, requiring fresh RNA for new targets [3] [92] | High; stable cDNA pool can be stored and used for multiple assays over time [11] |
| Hands-on Time | Minimal; fewer pipetting steps [3] | Extended; requires more setup and pipetting [92] |
| Risk of Contamination | Low; closed-tube reaction reduces contamination [92] | Higher; additional open-tube steps increase risk [11] |
| Optimization Potential | Impossible to optimize RT and PCR separately [11] | High; individual modification of RT and PCR steps [3] |
| Ideal Application | Quantifying a few known targets across many samples (e.g., screening) [11] [3] | Profiling multiple targets from a single RNA sample (e.g., biomarker panels) [11] [92] |
Experimental Protocols
One-Step RT-qPCR Protocol for High-Throughput Cancer Biomarker Screening
This protocol is designed for the quantification of specific, pre-validated cancer biomarker transcripts, such as microRNAs or mRNA from fusion genes, across a large number of samples [90] [93].
Materials & Reagents:
- One-Step RT-qPCR Kit (e.g., Luna Universal One-Step RT-qPCR Kit)
- RNA samples (50-100 ng total RNA per reaction)
- Gene-specific primer pairs and probes
- Nuclease-free water
- Real-time PCR instrument
Procedure:
- Reaction Setup: Thaw all reagents on ice and prepare a master mix in a nuclease-free tube. For a single 20 µL reaction:
- 10 µL of 2X One-Step Reaction Mix
- 1 µL of One-Step Enzyme Mix
- 1 µL of gene-specific forward primer (10 µM)
- 1 µL of gene-specific reverse primer (10 µM)
- 0.5 µL of probe (10 µM), if using probe-based chemistry
- X µL of RNA template (adjust volume based on concentration)
- Nuclease-free water to 20 µL
- Plate Loading: Aliquot 20 µL of the master mix into each well of a PCR plate. Include no-template controls (NTC) by replacing RNA with nuclease-free water.
- Thermal Cycling: Seal the plate and centrifuge briefly. Run on a real-time PCR instrument with the following cycling conditions:
- Reverse Transcription: 55°C for 10-20 minutes [41]
- Initial Denaturation: 95°C for 3 minutes
- Amplification (45 cycles): 95°C for 15 seconds → 60°C for 45 seconds (with fluorescence acquisition)
- Data Analysis: Determine Cycle Threshold (Ct) values. Use a standard curve for absolute quantification or the comparative Ct method for relative quantification.
Two-Step RT-qPCR Protocol for Multiplexed Cancer Biomarker Profiling
This protocol is ideal for studies where the same cDNA sample will be used to analyze a panel of multiple cancer biomarkers, allowing for greater flexibility and optimization [11] [92].
Materials & Reagents:
- cDNA Synthesis Kit (e.g., LunaScript RT SuperMix Kit)
- qPCR Master Mix (e.g., Luna Universal qPCR Master Mix)
- RNA samples (up to 1 µg for cDNA synthesis)
- Primers (oligo(dT), random hexamers, or a mix)
- Nuclease-free water
- Thermal cycler and real-time PCR instrument
Procedure: Step 1: cDNA Synthesis
- Reaction Setup: In a nuclease-free tube, assemble the following components on ice:
- 1 µg of total RNA
- 4 µL of 5X LunaScript RT SuperMix
- Nuclease-free water to 20 µL
- Incubation: Place the tube in a thermal cycler and run the following program:
- Annealing: 25°C for 2 minutes (if using random hexamers)
- Reverse Transcription: 55°C for 20 minutes
- Enzyme Inactivation: 85°C for 5 minutes
- Hold: 4°C
- cDNA Storage: The synthesized cDNA can be diluted as needed and is stable for long-term storage at -20°C or -80°C [11].
Step 2: Quantitative PCR
- Reaction Setup: Prepare a master mix for the qPCR. For a single 20 µL reaction:
- 10 µL of 2X qPCR Master Mix
- 0.5-1 µL each of forward and reverse primer (10 µM)
- X µL of cDNA template (typically 1-2 µL of a 1:10 dilution)
- Nuclease-free water to 20 µL
- Plate Loading: Aliquot the master mix into the PCR plate. Include no-template controls and a negative RT control (cDNA synthesis reaction without reverse transcriptase).
- Thermal Cycling: Seal the plate, centrifuge, and run on the real-time PCR instrument:
- Initial Denaturation: 95°C for 3 minutes
- Amplification (40-45 cycles): 95°C for 15 seconds → 60°C for 45 seconds (with fluorescence acquisition)
- Data Analysis: Analyze Ct values. Normalize gene expression to appropriate endogenous controls.
Workflow Visualization
The following diagram illustrates the key procedural differences and decision points in the two RT-qPCR workflows.
The Scientist's Toolkit: Research Reagent Solutions
Selecting the appropriate reagents is fundamental to successful RT-qPCR experiments. The following table outlines key solutions and their specific functions in the context of cancer biomarker research.
Table 2: Essential Reagents for RT-qPCR in Cancer Biomarker Research
| Reagent Solution | Function & Application Note |
|---|---|
| One-Step RT-qPCR Kits | Integrated systems containing reverse transcriptase and DNA polymerase in a optimized buffer for combined reactions. Ideal for high-throughput screening of specific fusion genes or viral oncogenes [92]. |
| cDNA Synthesis Kits | Used in the first step of two-step protocols. Often include a blend of random hexamers and oligo(dT) primers to ensure comprehensive cDNA representation of all RNA species, crucial for profiling complex biomarker panels [92]. |
| Hot-Start DNA Polymerase | Engineered polymerase that is inactive at room temperature, preventing non-specific amplification and primer-dimer formation. This enhances assay specificity and sensitivity for detecting low-abundance cancer transcripts [41]. |
| Gene-Specific Primers | Primers designed to anneal to a specific cDNA target. Essential for one-step RT-PCR and for validating specific biomarkers, such as point mutations or gene fusions (e.g., EML4-ALK) in two-step assays [11] [93]. |
| Universal Priming Oligos | Random hexamers (bind throughout RNA transcriptome) and oligo(dT) primers (bind to poly-A tail of mRNA). Used in two-step RT to create a universal cDNA library for analyzing multiple targets from a single sample [11] [3]. |
| SYBR Green or TaqMan Probes | Detection chemistries. SYBR Green binds to double-stranded DNA, while TaqMan probes provide higher specificity through a target-specific, fluorescently labeled probe. TaqMan is preferred for distinguishing between homologous biomarker sequences [93] [84]. |
The comparative analysis of one-step and two-step RT-qPCR reveals a clear trade-off between workflow efficiency and experimental flexibility. The one-step method offers superior throughput, reduced hands-on time, and a lower risk of contamination, making it the protocol of choice for targeted, high-throughput applications such as diagnostic screening of a predefined cancer biomarker. Conversely, the two-step method provides unmatched flexibility, the ability to create a renewable cDNA archive, and superior optimization potential, making it ideal for exploratory research where multiple targets from a single precious sample need to be profiled. The choice is not a matter of which technique is universally superior, but which is most appropriate for the specific experimental goals and constraints in cancer biomarker research. Researchers must weigh parameters such as the number of samples, the number of targets, RNA quantity and quality, and the need for future re-analysis when designing their RT-qPCR strategy.
In the field of cancer biomarker research, the reliability of a diagnostic test is paramount. Clinical validation metrics—Sensitivity, Specificity, Positive Predictive Value (PPV), Negative Predictive Value (NPV), and the Area Under the Curve (AUC)—provide a rigorous framework for evaluating a test's performance. These metrics quantitatively assess an assay's ability to correctly identify diseased and non-diseased individuals, forming the foundation for determining clinical utility [94] [95]. For researchers employing techniques like one-step and two-step reverse transcription quantitative PCR (RT-qPCR) to discover and validate novel cancer biomarkers, a deep understanding of these metrics is essential for translating laboratory findings into clinically applicable tools.
This guide details the experimental protocols and analytical procedures necessary to accurately determine these critical validation metrics within the context of cancer biomarker research, with a specific focus on RT-qPCR workflows.
Core Definitions and Clinical Interpretation
Fundamental Metrics of Diagnostic Accuracy
Table 1: Fundamental Diagnostic Accuracy Metrics
| Metric | Definition | Clinical Interpretation | Formula |
|---|---|---|---|
| Sensitivity | The proportion of individuals with the disease (cancer) who test positive [96] [97]. | A highly sensitive test is good at ruling out disease if the result is negative (SNOUT) [96]. | Sensitivity = a / (a + c) |
| Specificity | The proportion of individuals without the disease who test negative [96] [97]. | A highly specific test is good at ruling in disease if the result is positive (SPIN) [96]. | Specificity = d / (b + d) |
| Positive Predictive Value (PPV) | The probability that an individual with a positive test result actually has the disease [96] [97]. | The clinical relevance of a positive test; highly dependent on disease prevalence [96]. | PPV = a / (a + b) |
| Negative Predictive Value (NPV) | The probability that an individual with a negative test result truly does not have the disease [96] [97]. | The clinical relevance of a negative test; highly dependent on disease prevalence [96]. | NPV = d / (c + d) |
Formulas are based on a 2x2 contingency table where: a = True Positives, b = False Positives, c = False Negatives, d = True Negatives [98].
It is critical to recognize that while Sensitivity and Specificity are considered intrinsic test characteristics, PPV and NPV are highly dependent on the prevalence of the disease in the population being tested [96]. For a rare cancer, even a test with high specificity can yield a low PPV because the number of false positives may be large relative to the true positives.
The Area Under the Receiver Operating Characteristic Curve (AUC)
The Receiver Operating Characteristic (ROC) curve is a graphical plot that illustrates the diagnostic ability of a binary classifier system, such as a biomarker test, as its discrimination threshold is varied [98]. It is created by plotting the True Positive Rate (Sensitivity) against the False Positive Rate (1 - Specificity) at various threshold settings [98].
The Area Under the Curve (AUC) is a single scalar value that summarizes the overall ability of the test to discriminate between diseased and non-diseased states across all possible thresholds [98] [97].
Table 2: Interpretation of AUC Values for Diagnostic Tests
| AUC Value | Interpretation | Clinical Usability |
|---|---|---|
| 0.9 - 1.0 | Excellent discrimination | High clinical utility |
| 0.8 - 0.9 | Considerable/good discrimination | Clinically useful |
| 0.7 - 0.8 | Fair discrimination | Limited clinical utility |
| 0.6 - 0.7 | Poor discrimination | Limited clinical utility |
| 0.5 - 0.6 | Fail (no better than chance) | No clinical utility [98] |
The AUC value represents the probability that a randomly selected diseased subject will be ranked as more likely to be diseased than a randomly selected non-diseased subject [98]. A perfect test has an AUC of 1.0, while a useless test (equivalent to a coin flip) has an AUC of 0.5. In practice, AUC values above 0.80 are generally considered clinically useful, while values below this threshold, even if statistically significant, indicate very limited clinical usability [98].
Diagram 1: The ROC curve is constructed by plotting a test's sensitivity and 1-specificity at every possible threshold. The AUC summarizes the overall performance across all thresholds.
Experimental Protocol for Metric Validation in RT-qPCR
Sample Acquisition and Cohort Definition
Objective: To establish a well-characterized cohort of patient samples for validating a cancer biomarker assayed via RT-qPCR.
Workflow:
Diagram 2: Workflow for establishing a patient cohort and sample collection protocol. Standardization at each step is critical for minimizing bias.
- Define Context of Use (COU): Clearly state the intended clinical application of the biomarker (e.g., "early detection of pancreatic cancer in high-risk populations" or "prognostication of recurrence in stage II colon cancer") [94]. The COU dictates the study design and performance requirements.
- Cohort Selection: Recruit participants based on pre-defined inclusion and exclusion criteria.
- Cases: Patients with a confirmed diagnosis of the target cancer, established by the gold standard diagnostic method (e.g., histopathology) [95].
- Controls: Individuals without the target cancer. This group should ideally include healthy individuals and those with conditions that are common differential diagnoses to assess specificity against confounding diseases [94].
- Sample Size Calculation: Perform an a priori statistical power analysis to determine the required number of participants. For diagnostic accuracy studies, the sample size is often driven by the desired precision (confidence interval width) for estimating sensitivity and specificity [97].
- Ethical Considerations: Obtain informed consent from all participants. Collect and store samples in an anonymized or coded manner according to ethical guidelines and institutional review board (IRB) protocols.
RNA Extraction and RT-qPCR Analysis
Objective: To generate high-quality, reproducible gene expression data from patient samples for downstream statistical analysis.
Workflow:
Diagram 3: Workflow for RT-qPCR analysis, highlighting the critical choice between one-step and two-step methodologies, each with distinct advantages and limitations for biomarker validation [99] [11] [4].
Protocol Steps:
RNA Extraction:
- Extract total RNA from patient samples (e.g., plasma, tissue) using a validated method (e.g., silica-membrane columns, phenol-chloroform).
- Treat samples with DNase I to remove genomic DNA contamination [4].
- Quantify RNA concentration and assess purity (A260/A280 ratio ~2.0) and integrity (e.g., RIN >7.0 using Bioanalyzer).
Reverse Transcription (for Two-Step Protocol):
- Synthesize cDNA from a fixed amount of input RNA (e.g., 500 ng).
- Use a reverse transcription primer mix that may include oligo-dT, random hexamers, and/or gene-specific primers. A combination of oligo-dT and random hexamers is often used for comprehensive coverage [11].
- Include a no-reverse transcriptase control (-RT control) for each sample to detect genomic DNA contamination.
Quantitative PCR:
- One-Step RT-qPCR: Combine RNA template, primers, probe (if using TaqMan chemistry), and a master mix containing both reverse transcriptase and DNA polymerase in a single tube [99] [11].
- Two-Step RT-qPCR: Use a portion of the synthesized cDNA from step 2 as template in a standard qPCR reaction with primers, probe, and DNA polymerase master mix [99] [11].
- Assay Design: Ensure primers and probes are specific and efficient. Amplicons should span exon-exon junctions to prevent amplification of genomic DNA [4].
- Controls: Include a no-template control (NTC) to detect reagent contamination. Run samples and controls in technical replicates (at least triplicate).
Data Pre-processing:
- Record Cycle Threshold (Ct) values.
- Normalize target gene Ct values to one or more stable reference genes (e.g., GAPDH, ACTB) using the ∆Ct method:
∆Ct = Ct(target) - Ct(reference).
Data Analysis and Metric Calculation
Objective: To calculate clinical validation metrics from the normalized RT-qPCR data.
Workflow:
Establish a Classification Threshold:
- If a pre-defined clinical cutoff exists, use it.
- If not, use the data from your cohort to find an optimal cutoff. The Youden Index (J) is a common method, calculated as
J = Sensitivity + Specificity - 1[98]. The threshold that maximizes J is considered optimal for balancing sensitivity and specificity.
Construct a 2x2 Contingency Table:
- Classify each patient's result as True Positive (TP), False Positive (FP), False Negative (FN), or True Negative (TN) based on the chosen threshold and the gold standard diagnosis.
Table 3: Example 2x2 Contingency Table for a Hypothetical miRNA Biomarker for Colorectal Cancer
Gold Standard: Colorectal Cancer Gold Standard: Healthy Control Biomarker Test Positive 85 (TP) 15 (FP) 100 Biomarker Test Negative 15 (FN) 135 (TN) 150 100 150 250 Calculate Core Metrics:
- Sensitivity = TP / (TP + FN) = 85 / 100 = 85%
- Specificity = TN / (TN + FP) = 135 / 150 = 90%
- PPV = TP / (TP + FP) = 85 / 100 = 85%
- NPV = TN / (TN + FN) = 135 / 150 = 90% (Note: In this example, the disease prevalence in the study cohort is 40% (100/250), which influences PPV/NPV)
Generate ROC Curve and Calculate AUC:
- Using statistical software (e.g., R, SPSS, GraphPad Prism), command the software to generate an ROC curve by plotting sensitivity vs. 1-specificity at every observed data point from your normalized RT-qPCR results (e.g., ∆Ct values).
- Calculate the AUC, typically using the non-parametric trapezoidal rule.
- Report the 95% Confidence Interval for the AUC to indicate the precision of the estimate [98].
The Scientist's Toolkit: Essential Reagents and Materials
Table 4: Key Research Reagent Solutions for RT-qPCR Biomarker Validation
| Item | Function/Description | Example Considerations |
|---|---|---|
| RNA Stabilization Tubes | Stabilizes RNA in blood samples immediately upon draw, preventing degradation and pre-analytical variation. | PAXgene Blood RNA Tubes; Cell-free RNA BCT tubes |
| Nucleic Acid Extraction Kits | Isolate high-purity RNA from complex biological samples (plasma, tissue). | Column-based or magnetic bead-based kits (e.g., from Qiagen, Thermo Fisher). Must be validated for yield and purity. |
| RT-qPCR Master Mixes | Provides optimized buffers, enzymes, and dNTPs for reverse transcription and PCR amplification. | One-Step kits (Integrase, Quantabio); Two-Step kits (High-Capacity cDNA Reverse Transcription, TaqMan Fast Advanced). |
| Primers & Probes | Sequence-specific oligonucleotides for amplification and detection of target and reference genes. | Designed per MIQE guidelines; validated for efficiency (90-110%) and specificity (single peak in melt curve). |
| Quantified RNA Standards | Synthetic RNA transcripts of known concentration used to generate standard curves for absolute quantification and assay validation. | Essential for determining the Linear Dynamic Range and Limit of Detection (LoD) [100]. |
| Automated Nucleic Acid Quantifier | Accurately measures RNA concentration and assesses purity. | Fluorometric methods (e.g., Qubit) are preferred over spectrophotometry (NanoDrop) for accuracy with low-concentration samples. |
The rigorous application of clinical validation metrics is non-negotiable for advancing robust cancer biomarkers from research curiosities to tools with genuine clinical potential. For scientists using RT-qPCR, the choice between one-step and two-step protocols represents a critical trade-off between workflow efficiency and analytical flexibility/sensitivity, a decision that must be aligned with the biomarker's intended context of use. By adhering to standardized experimental protocols for sample processing, RT-qPCR analysis, and statistical evaluation—as outlined in this application note—researchers can generate reliable, reproducible estimates of sensitivity, specificity, PPV, NPV, and AUC. This disciplined approach is fundamental to building the evidentiary basis required for the successful translation of promising biomarkers into clinical practice, ultimately impacting cancer diagnosis, prognosis, and patient management.
Human Epidermal Growth Factor Receptor 2 (HER2) is a transmembrane tyrosine kinase receptor encoded by the ERBB2 gene located on chromosome 17q21. HER2 protein overexpression and/or gene amplification occurs in approximately 15-20% of invasive breast cancers and is a well-established predictive biomarker for HER2-targeted therapies [101]. Accurate determination of HER2 status is therefore essential for clinical decision-making, as it identifies patients who may benefit from targeted agents like trastuzumab, pertuzumab, and antibody-drug conjugates such as trastuzumab deruxtecan [102]. The evolution of HER2-directed therapies, including recent expansions to include tumors historically classified as "HER2-low," has further underscored the need for precise and reliable testing methodologies [102].
The American Society of Clinical Oncology (ASCO) and College of American Pathologists (CAP) have established and periodically updated guidelines for HER2 testing to ensure accuracy and reproducibility across laboratories [101]. This application note examines the concordance between established HER2 testing methods—focusing on immunohistochemistry (IHC) and fluorescence in situ hybridization (FISH)—and explores the emerging role of molecular approaches, particularly within the context of one-step versus two-step RT-qPCR methodologies for cancer biomarker research.
Established HER2 Testing Methods: Principles and Applications
Immunohistochemistry (IHC)
IHC is a semi-quantitative method that detects HER2 protein overexpression on the cell membrane using specific antibodies and visual detection systems [103]. The assay is widely used as an initial screening tool due to its relatively low cost, rapid turnaround time, and preservation of tissue morphology [103] [104].
Scoring Interpretation: HER2 IHC results are categorized using a semi-quantitative scoring system (0, 1+, 2+, 3+) based on membrane staining intensity, completeness, and percentage of positive tumor cells [101]:
- IHC 0/IHC 1+: Considered HER2-negative
- IHC 2+: Considered equivocal, requiring reflex testing by in situ hybridization
- IHC 3+: Considered HER2-positive
In Situ Hybridization (ISH) Methods
ISH techniques detect HER2 gene amplification at the DNA level and are considered the gold standard for definitive HER2 status determination [103].
Fluorescence ISH (FISH): Utilizes fluorescently labeled DNA probes to target the HER2 gene and chromosome 17 centromere (CEP17). HER2 amplification is determined by calculating the HER2/CEP17 ratio and assessing the average HER2 gene copy number [103] [101]. FISH provides quantitative results but requires specialized fluorescence microscopy and suffers from signal fading over time [105].
Chromogenic ISH (CISH) and Silver ISH (SISH): Bright-field alternatives to FISH that use enzymatic reactions to generate permanent, chromogenic signals visible by conventional microscopy [101] [106]. These methods show excellent concordance (>95%) with FISH while allowing better histological correlation [106].
Concordance Data Between IHC and FISH
Multiple studies have evaluated the concordance between IHC and FISH for HER2 status determination. The relationship between these methods is complex, with varying levels of agreement reported across different patient populations and sample types.
Comparative Performance Data
Table 1: Summary of IHC and FISH Concordance Studies in Breast Cancer
| Study Characteristics | IHC Results | FISH Results | Concordance Metrics | Key Findings |
|---|---|---|---|---|
| 44 FFPE breast cancer samples [103] | 3+ (positive): 6.8% (3/44)2+ (equivocal): 81.8% (36/44)0/1+ (negative): 11.4% (5/44) | Positive: 47.7% (21/44)Negative: 52.3% (23/44) | Significant difference (p=0.019) | IHC not reliable as standalone test, especially for 2+ cases requiring FISH confirmation |
| 260 breast tumors from 24 centers [106] | IHC vs FISH on surgical specimens | IHC vs FISH on surgical specimens | κ: 0.92-0.97Discordance: 2-4%Sensitivity: 95-99%Specificity: 97-98% | Excellent concordance between IHC and FISH when performed according to guidelines |
| 153 BC patients, multi-method comparison [107] | IHC compared to FISH | FISH as reference standard | Overall agreement with qRT-PCR: 90.8% (κ=0.81) | Disagreement mostly restricted to equivocal cases; qRT-PCR correlated better with HER2 protein levels |
The data demonstrate that while IHC and FISH show excellent concordance in most cases, significant discrepancies can occur, particularly in IHC 2+ (equivocal) cases. A study of 44 breast cancer samples revealed that while 81.8% of cases were classified as IHC 2+, FISH testing reclassified these cases into definitive positive (47.7%) or negative (52.3%) categories, with a statistically significant difference between IHC and FISH results (p=0.019) [103]. This highlights the limitations of IHC as a standalone test and underscores the necessity of reflex FISH testing for equivocal cases.
Methodological Limitations and Evolving Standards
Both IHC and FISH have technical limitations that can impact result interpretation:
IHC Limitations:
- Semi-quantitative nature with subjective interpretation
- Inter-observer variability in scoring
- Sensitivity to pre-analytical factors (fixation time, tissue processing)
- Inability to distinguish between gene amplification and other overexpression mechanisms [103] [104]
FISH Limitations:
- Higher cost and longer turnaround time
- Requirement for specialized equipment and expertise
- Signal quantification challenges with amplification clusters
- Background noise and signal overlap in conventional systems [103] [105]
Recent technological advances aim to address these limitations. Super-resolution fluorescence microscopy (HM-1000) significantly improves FISH signal visualization and quantification accuracy compared to conventional fluorescence microscopy [105]. One study demonstrated that super-resolution imaging increased the median countable HER2 signals per nucleus from 4.0 to 7.5 in HER2-positive samples and from 2.1 to 2.8 in HER2-negative samples, potentially enabling more precise HER2 classification, including "HER2-low" cases [105].
PCR-Based Methodologies for HER2 Determination
PCR-based methods offer an alternative approach for HER2 status determination, with potential advantages in throughput, quantification, and objectivity.
One-Step vs. Two-Step RT-qPCR: Technical Considerations
Table 2: Comparison of One-Step and Two-Step RT-qPCR Approaches
| Parameter | One-Step RT-qPCR | Two-Step RT-qPCR |
|---|---|---|
| Reaction Setup | Combined reverse transcription and PCR in single tube | Separate reactions for RT and PCR steps |
| Priming Strategy | Gene-specific primers only | Choice of oligo(dT), random hexamers, or gene-specific primers |
| Advantages | - Reduced experimental variation- Fewer pipetting steps, lower contamination risk- Faster, highly reproducible- Suitable for high-throughput applications | - Stable cDNA pool for multiple assays- Optimized conditions for each reaction- Flexible priming options- Ability to analyze multiple targets from same cDNA |
| Disadvantages | - Compromised conditions for both reactions- Potentially less sensitive and efficient- Limited to few targets per RNA sample | - Multiple handling steps increase contamination risk- More time-consuming- Requires more optimization |
| Ideal Applications | High-throughput analysis of a few genes | Analysis of multiple genes from single RNA sample |
The choice between one-step and two-step approaches depends on research objectives. One-step RT-qPCR is ideal for high-throughput applications targeting a limited number of genes, while two-step RT-qPCR provides greater flexibility for analyzing multiple targets from the same cDNA pool [11].
Concordance of PCR Methods with Traditional HER2 Assays
Molecular approaches for HER2 assessment include DNA-based quantitative PCR (qPCR) for gene copy number analysis and RNA-based quantitative reverse transcription PCR (qRT-PCR) for gene expression quantification.
DNA-based qPCR shows strong concordance with FISH. One study of 153 breast cancer patients reported 94.1% overall agreement between FISH and Q-PCR (κ=0.87), with 86.1% sensitivity and 99.0% specificity using FISH as the reference standard [107].
RNA-based qRT-PCR demonstrated 90.8% overall agreement with FISH (κ=0.81) in the same cohort [107]. Notably, discordances between FISH and qRT-PCR were mostly restricted to equivocal cases, and HER2 protein analysis suggested that qRT-PCR may correlate better with actual HER2 protein levels than FISH, particularly in cases where FISH provides inconclusive results [107].
A more recent study utilizing a dual molecular approach (assessing both HER2 copy number and gene expression) reported complete concordance with IHC for strongly positive (3+) samples, while identifying discrepancies in some IHC-positive cases that were FISH-negative [108]. This suggests molecular methods may potentially identify additional patients who could benefit from anti-HER2 therapies.
Experimental Protocols
Detailed FISH Protocol for HER2 Testing
Sample Preparation:
- Use 3-5μm sections from formalin-fixed, paraffin-embedded (FFPE) tissue blocks
- Deparaffinize slides in xylene (3×10 min) and dehydrate in graded ethanol series
- Perform heat-induced epitope retrieval in pre-warmed buffer (pH 9) at 121°C for 20 minutes in an autoclave
- Digest with pepsin (0.5-1 mg/mL) at 37°C for 20 minutes to expose target DNA [105]
Hybridization:
- Apply dual-color HER2/CEP17 FISH probe (e.g., Cytocell LPS 001 or equivalent)
- Denature at 75°C for 5 minutes followed by hybridization at 37°C overnight
- Wash stringently with 0.4× SSC (pH 7.0) at 72°C for 2 minutes
- Counterstain with DAPI (0.125 μg/mL) and mount with antifade medium [105]
Signal Quantification:
- Count HER2 (orange) and CEP17 (green) signals in at least 20 non-overlapping interphase nuclei
- Calculate HER2/CEP17 ratio and average HER2 signals per nucleus
- Interpret according to ASCO/CAP 2018 guidelines [101]:
- Positive: HER2/CEP17 ratio ≥2.0 with average HER2 copy number ≥4.0
- Equivocal: Certain patterns requiring additional analysis
- Negative: HER2/CEP17 ratio <2.0 with average HER2 copy number <4.0
Quality Considerations:
- Include positive and negative controls with each run
- Ensure >70% tumor cellularity; perform microdissection if lower
- For super-resolution imaging, capture 5000 frames per field at 30ms exposure using appropriate lasers (488nm for HER2, 561nm for CEP17) [105]
RNA Extraction and qRT-PCR Protocol for HER2 Expression
RNA Extraction from FFPE Tissues:
- Cut 5-8μm sections from FFPE blocks; assess tumor cellularity on H&E-stained slide
- Deparaffinize with xylene and wash with ethanol
- Digest with proteinase K (≥800 units/mL) for 16 hours at 56°C
- Extract RNA using Paradise Reagent System or equivalent with DNase I treatment
- Quantitate RNA using fluorometric methods (e.g., Qubit RNA HS Assay) [107]
Two-Step RT-qPCR Analysis:
- cDNA Synthesis:
- Use 50-200ng total RNA with random hexamers and reverse transcriptase
- Incubate at 25°C for 10 min, 37°C for 120 min, 85°C for 5 min
- Store cDNA at -20°C or proceed directly to PCR
- Quantitative PCR:
- Perform preamplification of HER2 and reference gene (e.g., RPLP0) using 14 cycles with TaqMan PreAmp Master Mix
- Set up qPCR reactions in duplicate with gene-specific primers and probes
- Use thermal cycling conditions: 50°C for 2 min, 95°C for 10 min, followed by 40 cycles of 95°C for 15 sec and 60°C for 1 min
- Calculate ΔCt values (HER2 Ct - reference gene Ct) for expression quantification [107] [108]
One-Step RT-qPCR Alternative:
- Combine reverse transcription and amplification in single reaction
- Use gene-specific primers and optimized master mix supporting both RT and PCR
- Apply same thermal cycling conditions as two-step approach
- Include no-template and no-RT controls to exclude contamination and genomic DNA amplification [11]
Visualizing HER2 Testing Workflows and Method Relationships
Figure 1: HER2 Testing Clinical Decision Pathway. This workflow illustrates the standard diagnostic algorithm for HER2 status determination, incorporating both traditional IHC/FISH approaches and emerging PCR-based methodologies.
The Scientist's Toolkit: Essential Research Reagents
Table 3: Key Research Reagents for HER2 Status Determination
| Reagent/Category | Specific Examples | Function/Application |
|---|---|---|
| IHC Primary Antibodies | Rabbit Anti-human c-erbB2 Monoclonal Antibody (Dako A0485)VENTANA anti-HER2/neu (4B5) | Specific detection of HER2 protein expression in formalin-fixed tissues |
| FISH Probes | PathVysion HER2 DNA Probe Kit (Abbott Molecular)Cytocell HER2 Amplification (LPS 001) | Dual-color probes for simultaneous detection of HER2 gene and CEP17 reference |
| Nucleic Acid Extraction Kits | QIAamp DNA FFPE Tissue Kit (Qiagen)Paradise Reagent System (Arcturus) | Isolation of high-quality DNA and RNA from challenging FFPE specimens |
| Reverse Transcription Kits | High Capacity cDNA Archive Kit (Applied Biosystems) | Conversion of RNA to cDNA for subsequent gene expression analysis |
| qPCR/qRT-PCR Reagents | TaqMan PreAmp Master MixSYBR Green-based master mixes | Sensitive detection and quantification of HER2 DNA copy number and mRNA expression |
| Reference Genes/Probes | APP (Amyloid beta A4 precursor protein)RPLP0 (ribosomal protein lateral stalk subunit P0) | Reference targets for normalization in DNA and RNA analyses, respectively |
The concordance between IHC and FISH for HER2 status determination remains high when tests are performed according to established guidelines, though significant discrepancies occur particularly in IHC equivocal (2+) cases. PCR-based methodologies, including both one-step and two-step RT-qPCR approaches, offer complementary and potentially more objective means of assessing HER2 status at both the DNA and RNA levels. The optimal approach depends on specific research requirements: one-step RT-qPCR for high-throughput analysis of limited targets, and two-step RT-qPCR for flexible, multi-target profiling from single RNA samples. As HER2-targeted therapies expand to include tumors with lower expression levels, integration of multiple methodological approaches will be essential for comprehensive biomarker assessment and optimal patient stratification.
The establishment of robust clinical cut-off values represents a critical juncture in the translation of molecular biomarkers into diagnostic tools, particularly in the field of cancer research. Reverse transcription-quantitative polymerase chain reaction (RT-qPCR) has emerged as a powerful technique for RNA quantification due to its practical and quantitative nature, sensitivity, and specificity [109]. This application note examines the process of defining these decisive thresholds within the context of cancer biomarker research, with specific focus on the methodological considerations of one-step versus two-step RT-qPCR approaches. The technical reliability of these cut-off values directly impacts diagnostic accuracy, therapeutic decisions, and ultimately, patient outcomes in oncology.
One-Step vs. Two-Step RT-qPCR: A Technical Comparison for Biomarker Assays
The decision between one-step and two-step RT-qPCR protocols has significant implications for workflow efficiency, experimental flexibility, and data quality in clinical cut-off determination. Each method possesses distinct characteristics that must be aligned with specific research objectives.
Table 1: Comparative Analysis of One-Step and Two-Step RT-qPCR Methods
| Parameter | One-Step RT-qPCR | Two-Step RT-qPCR |
|---|---|---|
| Workflow | Reverse transcription and PCR amplification occur in a single tube [110] | Reverse transcription and PCR amplification are performed as separate reactions [110] |
| Primers for cDNA synthesis | Gene-specific primers only [110] | Oligo(dT) primers, random hexamers, gene-specific primers, or a mixture [110] |
| Key Advantages | - Quick setup and limited handling- Reduced pipetting errors and cross-contamination risk- Ideal for high-throughput screening of a few targets [110] | - Flexibility in primer choice and reaction optimization- cDNA archive can be used for multiple PCR reactions- Ability to control cDNA input amount for different targets [110] |
| Key Considerations | - Cannot easily adjust template concentration for new targets- Reaction conditions are a compromise for both steps- Higher risk of primer-dimer formation [110] | - More hands-on time and total machine time required- Increased pipetting steps raise potential for errors- Generally consumes more reagents [110] |
| Ideal Application in Biomarker Research | Validating a limited number of predefined biomarkers in large sample sets [110] | Exploratory studies screening multiple potential biomarkers from limited RNA samples [110] |
For establishing clinical cut-offs, the one-step method offers advantages in consistency for validated assays, while the two-step method provides the flexibility needed during the assay development and optimization phase. The MIQE 2.0 guidelines provide an essential framework for ensuring methodological rigor and reproducibility in these applications, which is fundamental for generating reliable data for cut-off determination [111].
Experimental Protocol: Establishing a Clinical Cut-off Value for a Cancer Biomarker
This protocol outlines a detailed procedure for establishing a clinical cut-off value for a cancer biomarker, using HER2 mRNA quantification in breast cancer as a model system, based on a prospective validation study [46].
Sample Preparation and RNA Extraction
- Sample Collection: Collect 275 formalin-fixed paraffin-embedded (FFPE) tumor tissue samples from breast cancer patients, with informed consent and institutional ethics committee approval [46].
- Deparaffinization and RNA Extraction: Use a dedicated FFPE RNA isolation kit (e.g., PureLink FFPE RNA Isolation Kit) to remove paraffin and extract total RNA [46].
- RNA Quality and Quantification: Assess the concentration and quality of the extracted RNA using a spectrophotometer (e.g., NanoDrop ND-2000). Store RNA eluates at -80°C until use [46].
One-Step RT-qPCR for Biomarker Quantification
- Reaction Setup: Perform one-step RT-qPCR reactions using a commercial master mix. The reaction should contain the extracted RNA, gene-specific primers, and probes for the target biomarker (e.g., HER2) and selected reference genes (e.g., RPL30 and RPL37) [46].
- Thermocycling Conditions:
- Reverse Transcription: 50°C for 15-30 minutes.
- Initial Denaturation: 95°C for 2 minutes.
- Amplification (40-45 cycles): Denature at 95°C for 15 seconds, then anneal/extend at 60°C for 1 minute, with fluorescence acquisition.
- Data Collection: Record the cycle threshold (Ct) value for each replicate.
Data Normalization and Analysis
- Normalization: Normalize the Ct values of the target gene (HER2) against the geometric mean of the Ct values from the validated reference genes (RPL30 and RPL37) to calculate the ∆Ct [46].
- Relative Quantification: Use the ∆∆Ct method to calculate relative expression levels if a calibrator sample is used.
Determination of Clinical Cut-off Value
- Reference Standard Correlation: Compare the normalized RT-qPCR results (∆Ct or relative quantity) with the outcomes from standard diagnostic methods (e.g., IHC and FISH) performed on the same samples [46].
- ROC Curve Analysis: Perform Receiver Operating Characteristic (ROC) curve analysis. Plot the sensitivity against 1-specificity for all possible cut-off values of the normalized RT-qPCR data [46].
- Cut-off Selection: Identify the optimal cut-off value that corresponds to the combination of the highest sensitivity and specificity on the ROC curve. In the HER2 study, a ∆Ct value of 11.954 was established as the cut-off, yielding 93.4% sensitivity and 100% specificity [46].
- Performance Validation: Calculate positive predictive value (PPV), negative predictive value (NPV), and the overall area under the curve (AUC) to determine the diagnostic accuracy of the test. The HER2 assay achieved a PPV of 100%, an NPV of 89.4%, and an AUC of 0.955 [46].
Data Presentation and Analysis
The following table summarizes the quantitative results and performance metrics from a prospective study that established a clinical cut-off for HER2 expression in breast cancer using a one-step RT-qPCR assay [46].
Table 2: Performance Metrics of a One-Step RT-qPCR HER2 Assay vs. IHC/FISH
| Metric | Value | Interpretation |
|---|---|---|
| Clinical Cut-off (∆Ct) | 11.954 | Threshold for classifying HER2 status [46] |
| Sensitivity | 93.4% | Proportion of true positives correctly identified [46] |
| Specificity | 100% | Proportion of true negatives correctly identified [46] |
| Positive Predictive Value (PPV) | 100% | Probability that a positive test result is a true positive [46] |
| Negative Predictive Value (NPV) | 89.4% | Probability that a negative test result is a true negative [46] |
| Area Under Curve (AUC) | 0.955 | Excellent diagnostic accuracy (1.0 is perfect) [46] |
| Concordance with FISH | 100% | Perfect agreement with the gold standard method [46] |
| Kappa Coefficient (vs. IHC) | 0.863 | Very strong agreement with IHC [46] |
The high AUC value of 0.955 indicates outstanding diagnostic accuracy, meaning the test has a high ability to discriminate between HER2-positive and HER2-negative breast cancer cases [46]. The Kappa coefficient of 0.863 shows a very strong concordance with IHC, surpassing simple percent agreement by accounting for chance [46].
The Scientist's Toolkit: Essential Reagents and Materials
Table 3: Key Research Reagent Solutions for RT-qPCR-based Cut-off Analysis
| Item | Function/Benefit |
|---|---|
| FFPE RNA Isolation Kit | Specialized system for extracting intact RNA from challenging formalin-fixed, paraffin-embedded tissue samples, a common source in clinical archives [46]. |
| One-Step RT-qPCR Master Mix | Optimized buffer containing reverse transcriptase and thermostable DNA polymerase for combined reverse transcription and PCR amplification in a single tube, streamlining the workflow [110]. |
| Gene-Specific Primers & Probes | Hydrolysis (TaqMan) probes and primers designed for high specificity and efficiency to accurately quantify the target biomarker (e.g., HER2) and reference genes [46]. |
| Validated Reference Genes | Endogenous control genes (e.g., RPL30, RPL37) with stable expression across the sample set for reliable normalization of RNA input and quality variations [46]. |
| Quantified Control RNA | RNA of known concentration and integrity for constructing standard curves to assess PCR efficiency, a critical requirement of the MIQE guidelines [111]. |
| Nucleic Acid Quantitation System | Instrument (e.g., fluorometer) for accurate quantification of RNA and DNA, superior to absorbance-based methods for assessing sample quality and input [46]. |
Establishing a clinical cut-off value is a multifaceted process that hinges on robust experimental design, meticulous execution, and rigorous statistical analysis. The choice between one-step and two-step RT-qPCR must be deliberate, aligning with the research stage and application needs. Adherence to the MIQE 2.0 guidelines is paramount for generating reliable, reproducible data that can confidently inform clinical decision-making [111]. The protocol and data presented herein provide a framework for developing and validating RT-qPCR-based assays that can accurately stratify patients, ultimately guiding targeted cancer therapies and improving therapeutic outcomes.
In the field of cancer biomarker research, reverse transcription quantitative polymerase chain reaction (RT-qPCR) is a cornerstone technique for quantifying gene expression. However, a comprehensive understanding of complex biological systems often requires a multi-faceted approach. Integrating RT-qPCR with complementary techniques like flow cytometry and imaging provides a more powerful, multi-dimensional analytical framework. This integrated strategy synergizes molecular data with phenotypic, functional, and spatial information, offering unprecedented insights into cancer biology, tumor heterogeneity, and therapeutic response [112] [113]. This Application Note provides detailed protocols and data analysis frameworks for the effective combination of these methods, contextualized within the broader comparison of one-step and two-step RT-qPCR workflows.
Core Technique Comparison: One-Step vs. Two-Step RT-qPCR
The choice between one-step and two-step RT-qPCR is fundamental to experimental design and impacts the ease of downstream integration with other techniques. The table below summarizes the key characteristics of each method.
Table 1: Comparative Analysis of One-Step and Two-Step RT-qPCR
| Feature | One-Step RT-qPCR | Two-Step RT-qPCR |
|---|---|---|
| Workflow | Reverse transcription and PCR amplification occur in a single tube [2]. | RT and PCR are performed in separate, sequential steps [114]. |
| Priming Strategy | Typically uses gene-specific primers for the RT step [2]. | Uses oligo-dT, random hexamers, or a combination to generate a cDNA library [114] [2]. |
| Speed & Throughput | Faster; fewer pipetting steps; more amenable to high-throughput screening [2]. | More time-consuming; requires more hands-on time [114] [2]. |
| Flexibility | Less flexible; cDNA cannot be stored for multiple assays [2]. | Highly flexible; cDNA bank can be stored and used to analyze multiple targets [114] [2]. |
| Sensitivity | Excellent sensitivity, ideal for low-abundance targets [2]. | High sensitivity, can be advantageous with limited sample input [114]. |
| Optimal Use Case | High-throughput, rapid detection of a few targets (e.g., viral RNA detection, diagnostic screening) [2]. | Analysis of multiple gene targets from a single sample; banked cDNA for future use; limited starting material [114] [2]. |
| Compatibility with Integration | Excellent for focused, high-throughput correlative studies. | Superior for exploratory studies analyzing many targets from a precious sample characterized by other methods. |
The following decision diagram aids in selecting the appropriate RT-qPCR method based on experimental goals.
Integrated Experimental Design & Workflow
A representative integrated experiment characterizing macrophage polarization (M0, M1, M2) demonstrates the synergistic application of RT-qPCR, flow cytometry, and imaging [112]. The workflow below outlines the key parallel and sequential steps.
Detailed Protocols for Key Experiments
Protocol A: Two-Step RT-qPCR for Cytokine Profiling
This protocol is adapted from macrophage polarization studies [112] and is ideal for analyzing multiple cytokine targets from the same sample.
Key Reagents:
- PrimeScript RT Reagent Kit (Perfect Real Time) [114]
- qPCR Master Mix: e.g., TB Green Premix Ex Taq [114]
- Primers: Validate primer efficiencies (95–101%) for accurate 2^–ΔΔCq analysis [112].
Procedure:
- RNA Extraction: Lyse cells using a triazole-based method. Extract total RNA using a column-based kit (e.g., RNeasy Plus Mini Kit). Quantify RNA using a Nanodrop [112].
- Genomic DNA Elimination (Optional but Recommended): Use a reagent like gDNA Eraser (included in kits such as PrimeScript RT Reagent Kit with gDNA Eraser) to prevent genomic DNA amplification [114].
- Reverse Transcription (cDNA Synthesis):
- Quantitative PCR:
- Prepare a 10 µL reaction mix containing 2 µL cDNA, 200 nM forward and reverse primers, and 5 µL qPCR Master Mix [112].
- Use the following cycling conditions on a real-time thermal cycler:
- Initial Denaturation: 95°C for 3 min.
- 40 Cycles: 95°C for 5 s, 61°C for 30 s.
- Melting Curve Analysis: 65°C to 95°C [112].
- Data Analysis: Normalize target Cq values to a reference gene (e.g., 18S rRNA). Calculate fold-change differences using the 2^–ΔΔCq method [112].
Protocol B: Flow Cytometry for Surface Marker Validation
This protocol validates protein-level expression of phenotype-specific surface markers.
Key Reagents:
- Antibodies: Anti-human CD86-FITC, CD64-PerCP-Cy5.5, CD11b-FITC, CD206-PE [112].
- Staining Buffer: PBS with 1-2% FBS.
- Accutase or similar for cell detachment.
Procedure:
- Cell Harvesting: Detach adherent macrophages using accutase. Centrifuge at 200×g for 5 min and wash with PBS [112].
- Antibody Staining:
- Resuspend cell pellet (~1.25 x 10^6 cells) in 100 µL staining buffer.
- Add 5 µL of each fluorochrome-conjugated antibody. Include unstained and single-stained controls for compensation.
- Incubate for 30 min in the dark at room temperature [112].
- Washing and Acquisition:
- Wash cells twice with PBS to remove unbound antibody.
- Resuspend fixed cells in 200 µL PBS.
- Acquire data on a flow cytometer (e.g., BD FACSCanto II) using FACSDiva software. Analyze data using FlowJo or similar software [112].
Protocol C: Fluorescence Imaging for Cellular Phenotyping
This protocol uses the environmentally sensitive dye Di-4-ANEPPDHQ to detect changes in membrane order, serving as a functional correlate to polarization.
Key Reagents:
- Di-4-ANEPPDHQ: Membrane order sensing dye.
- DAPI: Nuclear counterstain.
- Formaldehyde (4%): For fixation.
- Ammonium Chloride: To reduce autofluorescence.
Procedure:
- Cell Seeding: Seed differentiated macrophages in 12-well plates (~0.3 x 10^6 cells/well) [112].
- Staining:
- Stain cells with Di-4-ANEPPDHQ (2:1000 dilution in serum-free media) for 1 hour at 37°C [112].
- Fixation:
- Fix cells with 0.5 mL of 4% formaldehyde for 20 min at room temperature in the dark.
- Wash with PBS.
- Add 0.5 mL ammonium chloride for 10 min to quench autofluorescence [112].
- Nuclear Counterstain:
- Add 0.5 mL of DAPI (1:1500 in PBS) for 15 min. Wash with PBS [112].
- Image Acquisition and Analysis:
- Acquire images using a fluorescence microscope with appropriate filter sets.
- Analyze the fluorescence emission shift: M1 macrophages show a depolarized membrane (red shift), while M2 macrophages show a hyperpolarized membrane (blue shift) [112].
Data Integration and Analysis
The power of this integrated approach lies in correlating data from all three platforms to build a coherent biological narrative.
Table 2: Multi-Technique Data Correlation in Macrophage Polarization
| Macrophage Phenotype | RT-qPCR (Cytokine Expression) | Flow Cytometry (Surface Marker) | Fluorescence Imaging (Membrane Order) |
|---|---|---|---|
| M0 (Resting) | Baseline levels of pro-inflammatory cytokines [112]. | Baseline expression of general markers (e.g., CD68) [112]. | Intermediate membrane state. |
| M1 (Pro-inflammatory) | Significantly elevated IL-1β (p < 0.0001) and IL-6 (p < 0.0001) [112]. | High expression of CD64 and CD86 [112]. | Depolarized membrane (Red shift) [112]. |
| M2 (Anti-inflammatory) | Significantly elevated IL-10 (p = 0.0030) [112]. | High expression of CD206 [112]. | Hyperpolarized membrane (Blue shift) [112]. |
Statistical analysis (e.g., t-tests, ANOVA) confirming high sensitivity and specificity for each method strengthens the validity of the integrated conclusions [112]. This multi-parameter validation is crucial for robust biomarker identification in cancer research.
The Scientist's Toolkit: Research Reagent Solutions
Table 3: Essential Reagents for Integrated RT-qPCR, Flow Cytometry, and Imaging Workflows
| Item | Function / Application | Example Product / Citation |
|---|---|---|
| Two-Step RT-qPCR Kits | High-flexibility cDNA synthesis for multi-target analysis. | PrimeScript RT Reagent Kits (Perfect Real Time) [114]. |
| One-Step RT-qPCR Master Mix | All-in-one mix for fast, high-throughput, single-target assays. | PrimeTime One-Step RT-qPCR Master Mix [115]. |
| Flow Cytometry Antibodies | Detection of specific cell surface proteins for phenotyping. | Anti-CD86-FITC, CD64-PerCP-Cy5.5, CD206-PE [112]. |
| Membrane Order Dye | Fluorescent probe for detecting changes in membrane lipid order via imaging. | Di-4-ANEPPDHQ [112]. |
| RNA Extraction Kit | Purification of high-quality RNA for reliable RT-qPCR results. | RNeasy Plus Mini Kit [112]. |
| Cell Dissociation Reagent | Non-enzymatic detachment of adherent cells for flow cytometry. | Accutase [112]. |
The strategic integration of RT-qPCR with flow cytometry and imaging creates a powerful framework for validating cancer biomarkers across molecular, protein, and cellular levels. The choice between one-step and two-step RT-qPCR is critical and should be guided by the experimental goals: one-step for speed and simplicity in targeted assays, and two-step for flexibility and comprehensive multi-target analysis. The protocols and frameworks provided here offer researchers a detailed roadmap to implement this multi-technique approach, thereby enhancing the depth, reliability, and translational potential of their findings in cancer research and drug development.
The validation of cancer biomarkers presents a formidable challenge, requiring the analysis of numerous gene targets across large patient cohorts to achieve statistical significance. Reverse Transcription Quantitative PCR (RT-qPCR) is a cornerstone technique for this validation due to its quantitative nature, sensitivity, and specificity [39]. However, traditional RT-qPCR methods are often limited by throughput, cost, and sample volume requirements. The choice between one-step and two-step RT-qPCR protocols is particularly consequential in this context, influencing experimental design, flexibility, and scalability [11] [116]. Recent advancements are overcoming these limitations through the integration of automated liquid handling, reaction miniaturization, and specialized instrumentation. This document details the application of these high-throughput systems, framing them within the strategic comparison of one-step and two-step RT-qPCR for cancer biomarker research, and provides a detailed protocol for implementation.
Technical Comparison: One-Step vs. Two-Step RT-qPCR in a High-Throughput Context
The decision between one-step and two-step RT-qPCR is fundamental to planning a high-throughput screening campaign. Each method offers distinct advantages and trade-offs concerning workflow simplicity, flexibility, and suitability for automation.
Table 1: Comparison of One-Step and Two-Step RT-qPCR for High-Throughput Applications
| Feature | One-Step RT-qPCR | Two-Step RT-qPCR |
|---|---|---|
| Workflow & Throughput | Combined reverse transcription and PCR in a single tube. Simplified, closed-tube workflow minimizes pipetting steps and hands-on time [11]. | Separate RT and PCR reactions. More complex workflow with additional open-tube steps increases hands-on time and contamination risk [11] [116]. |
| Priming Strategy | Requires gene-specific primers [11] [116]. | Flexible; can use oligo(dT), random hexamers, gene-specific primers, or a combination [11] [116]. |
| Ideal Use Case | Ideal for screening a few specific biomarkers across a very large number of samples (e.g., validating a small biomarker signature) [11]. | Ideal for screening many different gene targets from a limited number of precious RNA samples (e.g., discovering new biomarkers from patient biopsies) [11]. |
| Key Advantages | - Minimal sample handling- Reduced contamination risk- Fast and highly reproducible- Amenable to high-throughput automation [11] [116]. | - Generates a stable, reusable cDNA pool- Enables analysis of multiple targets from a single cDNA synthesis- Separate optimization of RT and PCR steps [11] [116]. |
| Key Disadvantages | - Cannot optimize reactions separately- Potentially less sensitive- Requires fresh RNA to analyze new targets [11] [116]. | - More pipetting steps and longer hands-on time- Greater variation and contamination risk- Less amenable to high-throughput workflows [11] [116]. |
High-Throughput Automated RT-qPCR Systems
Automation and miniaturization are key to achieving high-throughput RT-qPCR. These systems drastically reduce reagent volumes, decrease hands-on time, and improve reproducibility.
High-throughput systems often combine nanoliter-scale liquid handlers with specialized qPCR instrumentation. For example, the SmartChip ND Real-Time PCR System accommodates 5,184 reactions in a single run, allowing for 768 samples to be tested against up to 384 targets each with a turnaround time of about three hours and less than 30 minutes of hands-on time [117]. Similarly, other platforms like the BioMark HD system can be paired with automated liquid handlers (e.g., Mosquito HV) to fully automate the gene expression workflow from setup to analysis [118]. A critical advancement in these systems is the elimination of the pre-amplification step, which was previously a source of bias and variability, through the use of nanoliter-scale reactions that increase sensitivity without pre-amplification [117].
Protocol: Automated High-Throughput Two-Step RT-qPCR for Biomarker Screening
This protocol is designed for screening a panel of cancer biomarkers from limited patient RNA samples, leveraging the flexibility of the two-step method.
A. First-Strand cDNA Synthesis (Reverse Transcription)
Sample and Primer Preparation:
- Use RNA extracted from patient samples (e.g., PBMCs, tumor biopsies). Include appropriate controls (e.g., no-template controls, positive controls).
- For comprehensive biomarker screening, use a mixture of random hexamers and oligo(dT) primers to ensure representation of both polyadenylated and non-polyadenylated transcripts [39].
Master Mix Assembly:
- Prepare a master mix on ice as specified in the table below. Scale volumes according to the number of reactions.
- Table 2: Reverse Transcription Reaction Setup
Component Final Concentration/Amount Function RNA Template 10 pg - 1 µg (in RNase-free H2O) Template for cDNA synthesis Random Hexamers/Oligo(dT) Mix 50 µM combined Primes cDNA synthesis from various RNAs [39] dNTP Mix 500 µM each Building blocks for cDNA [39] Reverse Transcriptase (e.g., SuperScript IV) 100-200 U Enzyme that synthesizes cDNA [119] RNase Inhibitor 1 U/µL Protects RNA templates from degradation [39] MgCl2 5-6 mM Essential cofactor for reverse transcriptase [39] Reaction Buffer (5X) 1X Provides optimal pH and salt conditions RNase-free H2O To final volume -
Thermal Cycling:
- Denature RNA: 65°C for 5-10 minutes [39].
- Prime Annealing: 25°C for 10 minutes.
- cDNA Synthesis: 37-50°C for 30-60 minutes (use higher temperatures for high-GC content targets) [39].
- Enzyme Inactivation: 70-85°C for 5-10 minutes [39].
- Hold at 4°C. The synthesized cDNA can be stored at -20°C or used immediately.
B. Automated Nanoliter-Scale qPCR Setup
Reaction Miniaturization:
- Prepare a qPCR master mix. Studies have shown that miniaturization to 1.5x of the standard nanoliter volume is feasible without loss of data quality, while further reduction to 2.5x or 5x leads to suboptimal or failed amplification [118].
- Table 3: Quantitative PCR Master Mix (per reaction)
Component Final Concentration Function cDNA Diluted 1:4 to 1:10 from RT reaction PCR template SYBR Green Master Mix (2X) 1X Contains DNA polymerase, dNTPs, buffer, and fluorescent dye [119] Forward Primer 500 nM Binds to the antisense strand of the target Reverse Primer 500 nM Binds to the sense strand of the target [119] Nuclease-free H2O To final volume -
Automated Dispensing:
Thermal Cycling and Data Acquisition:
- Seal the chip or plate and place it in the high-throughput real-time PCR instrument.
- Run the following standard cycling protocol:
- Initial Denaturation: 95°C for 2-10 minutes.
- 40-45 Cycles of:
- Denaturation: 95°C for 15 seconds.
- Annealing/Extension: 60°C for 1 minute (optimize based on primer Tm).
- Perform a melt curve analysis to confirm amplification specificity.
Diagram 1: High-throughput RT-qPCR workflow.
The Scientist's Toolkit: Essential Reagents and Materials
Successful high-throughput screening relies on carefully selected, high-quality reagents and tools.
Table 4: Research Reagent Solutions for High-Throughput RT-qPCR
| Item | Function | High-Throughput Consideration |
|---|---|---|
| High-Efficiency Reverse Transcriptase | Converts RNA to cDNA. Enzymes like SuperScript IV offer high thermal stability and robust cDNA yield, crucial for sensitive detection [119]. | Essential for generating high-quality cDNA from limited sample input, maximizing the information obtainable from precious samples. |
| SYBR Green qPCR Master Mix | Contains hot-start DNA polymerase, dNTPs, buffer, and fluorescent dye for target amplification and detection [119]. | Optimized master mixes ensure robust performance in nanoliter-scale reactions. Dye-based chemistry is cost-effective for large-scale screening. |
| Validated qPCR Primers | Sequence-specific primers for amplifying target biomarkers and reference genes. | Primers must be designed to span exon-exon junctions and tested for high efficiency (90-110%) [39]. Pre-validated primer sets (e.g., from PrimerBank) save time [119]. |
| Automated Liquid Handler | Instrument for dispensing nanoliter volumes of reagents and samples (e.g., SmartChip ND system, Mosquito HV) [118] [117]. | The core of automation, enabling miniaturization, superior reproducibility, and massive parallelization while drastically reducing hands-on time. |
| High-Throughput qPCR Instrument | Real-time PCR system capable of cycling and detecting fluorescence in 384-well plates or specialized high-density chips (e.g., QuantStudio 5, BioMark HD, SmartChip ND) [119] [118]. | Allows for the simultaneous processing of thousands of reactions, generating the large datasets required for biomarker validation. |
Performance and Validation Data
Rigorous validation is required to ensure that a high-throughput RT-qPCR assay meets the standards for robustness and reliability needed in cancer research.
Table 5: Performance Metrics of a High-Throughput RT-qPCR Assay
| Performance Metric | Result/Description | Implication for Cancer Biomarker Research |
|---|---|---|
| Cost Reduction | Up to 90% reduction in reagent costs achieved through miniaturization and optimization of reagent concentrations [119]. | Makes large-scale screening studies financially feasible, allowing for the analysis of hundreds of samples against comprehensive biomarker panels. |
| Assay Robustness (Z' Factor) | Z' factor > 0.5, indicating an "excellent" assay suitable for high-throughput screening [119]. | Ensures the assay can reliably distinguish between true positive and negative results in a high-throughput format, which is critical for biomarker discovery and validation. |
| Analytical Sensitivity | Single-cell sensitivity demonstrated [119]. | Enables detection of rare cell populations or low-abundance transcripts, such as those from circulating tumor cells, which are crucial for liquid biopsy applications. |
| Diagnostic Sensitivity | Capable of detecting a response equivalent to 1 in 10,000 cells with >90% accuracy [119]. | Provides the sensitivity needed to identify weak but biologically significant biomarker signals in complex biological samples like blood or tumor biopsies. |
| Miniaturization Limit | Robust amplification at 1.5x miniaturization; 2.5x is suboptimal; 5x fails [118]. | Provides a clear guideline for reagent volume reduction to maximize cost savings while maintaining data integrity. |
| Correlation with Protein Assays | Strong correlation between IFN-γ mRNA levels measured by RT-qPCR and protein levels measured by ELIspot [119]. | For certain classes of biomarkers like cytokines, mRNA quantification can be a reliable surrogate for protein production, streamlining the validation pipeline. |
The integration of automated platforms and high-throughput systems is revolutionizing the application of RT-qPCR in cancer biomarker research. The choice between one-step and two-step methodologies is no longer merely a technical preference but a strategic decision dictated by the specific screening goal. For projects focused on a defined set of biomarkers across vast sample banks, the one-step method offers an unbeatable combination of speed and reproducibility. Conversely, for discovery-phase research where the goal is to screen many potential biomarkers from limited and precious samples, the two-step method provides the necessary flexibility and target multiplexing. The ongoing development of automated, miniaturized, and cost-reduced systems, as detailed in this application note, is democratizing access to high-throughput molecular screening, thereby accelerating the pace of cancer biomarker validation and therapeutic development.
Conclusion
The choice between one-step and two-step RT-qPCR is not a matter of superiority but of strategic alignment with specific research or diagnostic objectives. One-step protocols offer streamlined, closed-tube workflows ideal for high-throughput, repetitive analysis of a limited number of targets, making them suitable for validated diagnostic tests. In contrast, two-step protocols provide unparalleled flexibility for analyzing multiple targets from scarce samples and creating valuable cDNA archives for future research. Recent clinical validations, such as in HER2-positive breast cancer, underscore the high accuracy, sensitivity, and reproducibility of RT-qPCR, positioning it as a powerful tool for quantitative cancer biomarker analysis. Future directions will likely involve greater integration with automated platforms, expanded use of liquid biopsy samples, and the continued discovery of novel non-coding RNA biomarkers, further solidifying RT-qPCR's role in personalized oncology and molecular diagnostics.
References
- 1. One-step vs. two-step RT-qPCR—tips for choosing the right ... [https://www.takarabio.com/about/bioview-blog/tips-and-troubleshooting/one-step-vs-two-step-rt-qpcr?srsltid=AfmBOoqB3_MPT3jzMaOSDR-gqxc8Z2__yuzhqSSJHc9JtiLpsa7SyQVO]
- 2. Transcriptase. Choosing The Best RT- Reverse Method qPCR [https://bitesizebio.com/33640/rt-qpcr-reverse-transcription-methods/]
- 3. Starting with RNA—One-step or two-step RT-qPCR? [https://eu.idtdna.com/page/support-and-education/decoded-plus/one-step-two-step/]
- 4. Two-Step Versus One-Step RNA-to-CT™ 2-Step and One- ... [https://pmc.ncbi.nlm.nih.gov/articles/PMC2700466/]
- 5. An optimized protocol for stepwise optimization of real-time ... [https://www.nature.com/articles/s41438-021-00616-w]
- 6. Advanced breast cancer diagnosis: Multiplex RT-qPCR for ... [https://pmc.ncbi.nlm.nih.gov/articles/PMC10776909/]
- 7. Optimisation of the RT-PCR detection of immunomagnetically ... [https://bmccancer.biomedcentral.com/articles/10.1186/1471-2407-2-14]
- 8. Applications | Thermo Fisher Scientific - SG Reverse Transcription [https://www.thermofisher.com/sg/en/home/life-science/cloning/cloning-learning-center/invitrogen-school-of-molecular-biology/rt-education/reverse-transcription-applications.html]
- 9. RealTimeDesign qPCR Assay Design Software [https://oligos.biosearchtech.com/tools/realtimedesign-software]
- 10. Cancer Biomarkers: Reflection on Recent Progress, Emerging ... [https://pmc.ncbi.nlm.nih.gov/articles/PMC12468363/]
- 11. One-Step vs Two-Step RT-PCR [https://www.thermofisher.com/us/en/home/brands/thermo-scientific/molecular-biology/molecular-biology-learning-center/molecular-biology-resource-library/spotlight-articles/onestep-vs-twostep-rtpcr.html]
- 12. One-step vs. two-step RT-qPCR—tips for choosing the right ... [https://www.takarabio.com/about/bioview-blog/tips-and-troubleshooting/one-step-vs-two-step-rt-qpcr?srsltid=AfmBOop-jIkAdl_xGAGUTUSTmNoxmiRATDtRFr-0_gHmwcXNp7GUZgOr]
- 13. Comprehensive analysis of LncRNA-miRNA-mRNA ... [https://www.nature.com/articles/s41598-025-20187-3]
- 14. Comparative analysis of miRNA-mRNA interaction prediction ... [https://pmc.ncbi.nlm.nih.gov/articles/PMC12061445/]
- 15. a post-hoc analysis of the phase II T1219 study - Nature [https://www.nature.com/articles/s41698-025-01099-x]
- 16. Independent prognostic significance of tissue and ... [https://pmc.ncbi.nlm.nih.gov/articles/PMC11890906/]
- 17. MIQE 2.0 and the Urgent Need to Rethink qPCR Standards [https://pmc.ncbi.nlm.nih.gov/articles/PMC12154065/]
- 18. Consensus guidelines for the validation of qRT-PCR ... [https://www.sciencedirect.com/science/article/pii/S2329050122000018]
- 19. Analytical techniques for nucleic acid and protein detection ... [https://pmc.ncbi.nlm.nih.gov/articles/PMC12130535/]
- 20. Integrating AI and RNA biomarkers in cancer [https://pmc.ncbi.nlm.nih.gov/articles/PMC12512311/]
- 21. Passive and active biosensing with nucleic acid–protein ... [https://pubs.rsc.org/en/content/articlehtml/2025/nh/d5nh00406c?page=search]
- 22. From RNA to results: the essential guide to RT-PCR [https://www.integra-biosciences.com/united-states/en/blog/article/rna-results-essential-guide-rt-pcr]
- 23. One-step vs. two-step RT-qPCR—tips for choosing the right ... [https://www.takarabio.com/about/bioview-blog/tips-and-troubleshooting/one-step-vs-two-step-rt-qpcr?srsltid=AfmBOoqvNK073q8P5iLLcuP1UYolUakJxnB9PJyADCGWWm0bHh032BMi]
- 24. Protocol for qRT-PCR analysis from formalin fixed paraffin ... [https://pmc.ncbi.nlm.nih.gov/articles/PMC5347772/]
- 25. Straightforward and sensitive RT-qPCR based gene ... [https://www.nature.com/articles/srep21418]
- 26. Liquid biopsy in cancer: current status, challenges and ... [https://www.nature.com/articles/s41392-024-02021-w]
- 27. Liquid biopsies in cancer - PMC [https://pmc.ncbi.nlm.nih.gov/articles/PMC11923355/]
- 28. Selection of optimal extraction and RT-PCR protocols for ... [https://www.nature.com/articles/s41598-024-78680-0]
- 29. Quantitative real-time PCR analysis of bacterial biomarkers ... [https://pmc.ncbi.nlm.nih.gov/articles/PMC9586115/]
- 30. Choice Of One Step RT-qPCR Or Two Step RT-qPCR [https://www.neb.com/en-us/applications/dna-amplification-pcr-and-qpcr/choice-of-one-step-rt-qpcr-or-two-step-rt-qpcr?srsltid=AfmBOopm7e3FcLKaGAq6CqPn9pd8FhlxyIoYhBuB6Dsq4H2Ag1Ep5fuq]
- 31. One-step RT-qPCR kits [https://www.takarabio.com/learning-centers/real-time-pcr/overview/one-step-rt-qpcr-kits?srsltid=AfmBOoq0FevFoUjM3Mq-FKarLq-1LOGWnwWsivDdPx2DtTjGSdZjQuAc]
- 32. One-step vs. two-step RT-qPCR—tips for choosing the right ... [https://www.takarabio.com/about/bioview-blog/tips-and-troubleshooting/one-step-vs-two-step-rt-qpcr?srsltid=AfmBOoq08cVRmGfhW_9tz6A0nUbyK-npq2KbdqCCMCXpUgHpDj86RmUO]
- 33. Comparison between routine methods and RT-qPCR [https://journals.plos.org/plosone/article?id=10.1371/journal.pone.0255580]
- 34. Use and Misuse of Cq in qPCR Data Analysis and Reporting [https://pmc.ncbi.nlm.nih.gov/articles/PMC8229287/]
- 35. Choice Of One Step RT-qPCR Or Two Step RT-qPCR [https://www.neb.com/en-us/applications/dna-amplification-pcr-and-qpcr/choice-of-one-step-rt-qpcr-or-two-step-rt-qpcr?srsltid=AfmBOor_CmALykdBcGTmvYdmvvnXw2ctVnzftKPf6TYysguV3ieCxgK-]
- 36. Tips & Tricks: Choosing 1-step or 2-step RT-qPCR [https://pcrbio.com/resources/tips-tricks-choosing-1-step-or-2-step-rt-qpcr/]
- 37. Obtaining Reliable RT-qPCR Results in Molecular ... [https://pmc.ncbi.nlm.nih.gov/articles/PMC8953338/]
- 38. Basic Principles of RT-qPCR [https://www.thermofisher.com/us/en/home/brands/thermo-scientific/molecular-biology/molecular-biology-learning-center/molecular-biology-resource-library/spotlight-articles/basic-principles-rt-qpcr.html]
- 39. Brief guide to RT-qPCR - PMC [https://pmc.ncbi.nlm.nih.gov/articles/PMC11612376/]
- 40. Choice Of One Step RT-qPCR Or Two Step RT-qPCR [https://www.neb.com/en-us/applications/dna-amplification-pcr-and-qpcr/choice-of-one-step-rt-qpcr-or-two-step-rt-qpcr?srsltid=AfmBOopyze0Yv4fJ9XRFPV3-2wqY27jWX-3lCTk66QgCDK3wz9b6EWRv]
- 41. Analysis of One-Step and Two-Step Real-Time RT-PCR ... [https://pmc.ncbi.nlm.nih.gov/articles/PMC2291734/]
- 42. Rules and Tips for PCR & qPCR Primer Design | IDT [https://www.idtdna.com/page/support-and-education/decoded-plus/how-to-design-primers-and-probes-for-pcr-and-qpcr/]
- 43. Selection and validation of reference genes for RT-qPCR ... [https://www.nature.com/articles/s41598-025-02951-7]
- 44. Selection and validation of reference genes for RT-qPCR ... [https://pubmed.ncbi.nlm.nih.gov/40450038/]
- 45. Selecting Optimal Housekeeping Genes for RT-qPCR in ... [https://www.mdpi.com/1422-0067/26/17/8610]
- 46. Prospective Validation of a One-Step RT-qPCR-based Test ... [https://pmc.ncbi.nlm.nih.gov/articles/PMC11996119/]
- 47. Quantitative RT-PCR assay of HER2 mRNA expression in ... [https://pmc.ncbi.nlm.nih.gov/articles/PMC4230085/]
- 48. Her2 assessment using quantitative reverse transcriptase ... [https://translational-medicine.biomedcentral.com/articles/10.1186/s12967-017-1195-7]
- 49. Prospective Validation of a One-Step RT-qPCR-based Test ... [https://pubmed.ncbi.nlm.nih.gov/39611912/]
- 50. Developing a routine lab test for absolute quantification of ... [https://www.nature.com/articles/s41598-020-69471-4]
- 51. Quantification of HER2 by Targeted Mass Spectrometry in ... [https://pmc.ncbi.nlm.nih.gov/articles/PMC4597152/]
- 52. Quantification of HER2-low and ultra-low expression in ... [https://www.sciencedirect.com/science/article/pii/S2153353925000999]
- 53. Advanced breast cancer diagnosis: Multiplex RT-qPCR for ... [https://www.sciencedirect.com/science/article/pii/S2405580823001966]
- 54. Bioinformatic screen with clinical validation for the ... [https://www.nature.com/articles/s41598-025-13074-4]
- 55. Detection of Early-Stage Colorectal Cancer Using Cell ... [https://pmc.ncbi.nlm.nih.gov/articles/PMC12314518/]
- 56. NCHR Comments on Coverage of Colorectal Cancer Non- ... [https://www.center4research.org/comment-cms-coverage-colorectal-cancer-screening/]
- 57. Geneoscopy's New FDA-Approved Stool Collection ... [https://www.geneoscopy.com/geneoscopys-new-fda-approved-stool-collection-method-simplifies-at-home-colorectal-cancer-screening/]
- 58. Selection of optimal extraction and RT-PCR protocols for ... [https://pmc.ncbi.nlm.nih.gov/articles/PMC11551167/]
- 59. One-step vs. two-step RT-qPCR—tips for choosing the right ... [https://www.takarabio.com/about/bioview-blog/tips-and-troubleshooting/one-step-vs-two-step-rt-qpcr?srsltid=AfmBOopHFGKBtbD3-903SFqwJfnxcXyoamWyc1u1-kGg1mA2TwfFQXT3]
- 60. The MIQE guidelines: minimum information for publication ... [https://pubmed.ncbi.nlm.nih.gov/19246619/]
- 61. MIQE Guidelines | Thermo Fisher Scientific - US [https://www.thermofisher.com/us/en/home/life-science/pcr/real-time-pcr/real-time-pcr-assays/why-choose-taqman-assays/publish-real-time-pcr-results.html]
- 62. Comprehensive Algorithm for Quantitative Real-Time ... [https://pmc.ncbi.nlm.nih.gov/articles/PMC2716216/]
- 63. PCR/qPCR Data Analysis [https://www.sigmaaldrich.com/US/en/technical-documents/technical-article/genomics/qpcr/data-analysis?srsltid=AfmBOoqX3HVr0fTMgnCitblK5QWwf349aRE1XQ5nXCh9Up7MHKB_F3l_]
- 64. Analyzing qPCR data: Better practices to facilitate rigor and ... [https://www.sciencedirect.com/science/article/pii/S2405580825004431]
- 65. One-step vs. two-step RT-qPCR—tips for choosing the right ... [https://www.takarabio.com/about/bioview-blog/tips-and-troubleshooting/one-step-vs-two-step-rt-qpcr?srsltid=AfmBOorKb04dg5cqioC7AooLyKT3fIsC1FGtJ71lrywCSMwXtdhGJRdN]
- 66. Starting with RNA—One-step or two-step RT - qPCR ? | IDT [https://sg.idtdna.com/page/support-and-education/decoded-plus/one-step-two-step/]
- 67. Setup | Thermo Fisher Scientific - RU Reverse Transcription Reaction [https://www.thermofisher.com/ru/ru/home/life-science/cloning/cloning-learning-center/invitrogen-school-of-molecular-biology/rt-education/reverse-transcription-setup.html]
- 68. Reverse Transcription [https://www.sigmaaldrich.cn/CN/en/technical-documents/technical-article/genomics/gene-expression-and-silencing/reverse-transcription]
- 69. Assay PCR and Validation Optimization [https://www.sigmaaldrich.com/IT/it/technical-documents/technical-article/genomics/pcr/assay-optimization-and-validation]
- 70. Development of real-time PCR methods for quality control ... [https://pmc.ncbi.nlm.nih.gov/articles/PMC12058689/]
- 71. One-step vs. two-step RT-qPCR—tips for choosing the right ... [https://www.takarabio.com/about/bioview-blog/tips-and-troubleshooting/one-step-vs-two-step-rt-qpcr?srsltid=AfmBOoqdJiDk8Kxi86K9-_tbZcpt7sGoc9GkvcxuQMie5nn4HN74Iq9Y]
- 72. ESR1 testing on FFPE samples from metastatic lesions in HR + /HER2- breast cancer after progression on CDK4/6 inhibitor therapy | Breast Cancer Research | Full Text [https://breast-cancer-research.biomedcentral.com/articles/10.1186/s13058-025-02020-x]
- 73. Advancements in “Cancer Biomarkers” for 2025–2026 [https://www.mdpi.com/journal/cancers/special_issues/1004C09I3G]
- 74. A Novel High-Fidelity DNA Polymerase-driven or Taq ... [https://www.sciencedirect.com/science/article/abs/pii/S0925400525013358]
- 75. How to Optimize RT-qPCR using the PCR Optimization Kit [https://www.promega.com/resources/pubhub/2017/rt-qpcr-using-the-pcr-optimization-kit/]
- 76. One-step vs. two-step RT-qPCR—tips for choosing the right ... [https://www.takarabio.com/about/bioview-blog/tips-and-troubleshooting/one-step-vs-two-step-rt-qpcr?srsltid=AfmBOopM7Wl1m375mg4D2nok42Tg0D2ooZZKcEN_rwo8I0C0MMCUYlnJ]
- 77. Comparative Evaluation of Computational Methods for ... [https://www.mdpi.com/2227-9059/13/8/2036]
- 78. Validation of reference genes for the normalization of RT ... [https://pmc.ncbi.nlm.nih.gov/articles/PMC5431254/]
- 79. Reference gene evaluation for normalization of gene ... [https://pmc.ncbi.nlm.nih.gov/articles/PMC11413728/]
- 80. One-step vs. two-step RT-PCR: Which should you choose? [https://visikol.com/blog/2021/12/13/one-step-vs-two-step-rt-pcr/]
- 81. Choice Of One Step RT-qPCR Or Two Step RT-qPCR [https://www.neb.com/en-us/applications/dna-amplification-pcr-and-qpcr/choice-of-one-step-rt-qpcr-or-two-step-rt-qpcr?srsltid=AfmBOorQ2fySmQJEdsdjAks1DbKQbkhUZ-r25VyAd3RYIVKlbkJPcWSw]
- 82. Two-step RT-qPCR kits [https://www.takarabio.com/learning-centers/real-time-pcr/overview/two-step-rt-qpcr-kits?srsltid=AfmBOootVoDGCEd24gpoJGf-k3NR_I_kbuGfL_ip1o33RmnI0s38gZNV]
- 83. Tutorial: Guidelines for Single-Cell RT-qPCR - PMC [https://pmc.ncbi.nlm.nih.gov/articles/PMC8534298/]
- 84. Highly sensitive and multiplexed one-step RT-qPCR for ... [https://www.nature.com/articles/s41598-021-85728-y]
- 85. Choosing between 1 - step or 2 - step - RT qPCR [https://www.linkedin.com/pulse/choosing-between-1-step-2-step-rt-qpcr-pcr-biosystems-ltd-5skge]
- 86. One-step vs. two-step RT-qPCR—tips for choosing the right ... [https://www.takarabio.com/about/bioview-blog/tips-and-troubleshooting/one-step-vs-two-step-rt-qpcr?srsltid=AfmBOoqxgi5KFtjIIlO6nUvBNzQ7yvABbnW-3rLByBN1PKnuARsJ85NJ]
- 87. Emerging biomarkers for early cancer detection and diagnosis [https://eurjmedres.biomedcentral.com/articles/10.1186/s40001-025-03003-6]
- 88. Salivary genetic biomarkers of lung cancer: a systematic ... [https://pmc.ncbi.nlm.nih.gov/articles/PMC12495827/]
- 89. a roadmap for DNA methylation biomarkers in liquid biopsies [https://www.nature.com/articles/s41388-025-03624-5]
- 90. SMART-qPCR: An Ultrasensitive One-Pot Direct RT ... [https://www.sciencedirect.com/science/article/abs/pii/S0925400525014571]
- 91. Emerging biomarkers for early cancer detection and diagnosis [https://pmc.ncbi.nlm.nih.gov/articles/PMC12359849/]
- 92. Choice Of One Step RT-qPCR Or Two Step RT-qPCR [https://www.neb.com/en-us/applications/dna-amplification-pcr-and-qpcr/choice-of-one-step-rt-qpcr-or-two-step-rt-qpcr?srsltid=AfmBOoq4pNPXL6uzXUlDB_g2ZyX95XPt9bJyvVojUQzxBus54EqX3I84]
- 93. A Highly Sensitive XNA-Based RT-qPCR Assay for the ... [https://pmc.ncbi.nlm.nih.gov/articles/PMC10930897/]
- 94. Consensus guidelines for the validation of qRT-PCR ... [https://pmc.ncbi.nlm.nih.gov/articles/PMC8792405/]
- 95. Cancer biomarkers - PMC [https://pmc.ncbi.nlm.nih.gov/articles/PMC5528374/]
- 96. Statistics | Sensitivity, Specificity, PPV and NPV [https://geekymedics.com/sensitivity-specificity-ppv-and-npv/]
- 97. Diagnostic Accuracy and Prediction [https://www.openanesthesia.org/keywords/diagnostic-accuracy-and-prediction/]
- 98. A guide to interpreting the area under the curve value - PMC [https://pmc.ncbi.nlm.nih.gov/articles/PMC10664195/]
- 99. One-step vs. two-step RT-qPCR—tips for choosing the right ... [https://www.takarabio.com/about/bioview-blog/tips-and-troubleshooting/one-step-vs-two-step-rt-qpcr?srsltid=AfmBOorp-WPWtji-zWBHti64k7Vy08-CqeTLca9wE8jsysi1H7sqUbHG]
- 100. Quantitative PCR validation for research scientists: Part 1 of 2 [https://virologyresearchservices.com/2023/01/13/quantitative-pcr-validation-part-1-of-2/]
- 101. HER2 status in breast cancer: changes in guidelines and ... [https://pmc.ncbi.nlm.nih.gov/articles/PMC6986968/]
- 102. HER2 Testing in Breast Cancer - 2023 Guideline Update [https://www.cap.org/protocols-and-guidelines/cap-guidelines/current-cap-guidelines/recommendations-for-human-epidermal-growth-factor-2-testing-in-breast-cancer]
- 103. Comparison of Immunohistochemical Methods (IHC) and ... [https://pmc.ncbi.nlm.nih.gov/articles/PMC9985809/]
- 104. Article Current Perspectives on HER2 Testing: A Review of ... [https://www.sciencedirect.com/science/article/pii/S0893395222050736]
- 105. Clinical application of the HM-1000 image processing for ... [https://diagnosticpathology.biomedcentral.com/articles/10.1186/s13000-024-01455-8]
- 106. Accuracy of HER2 status determination on breast core- ... [https://www.nature.com/articles/modpathol2011201]
- 107. Her2 assessment using quantitative reverse transcriptase ... [https://pmc.ncbi.nlm.nih.gov/articles/PMC5412048/]
- 108. Molecular Biological Determination of HER2 Status Using ... [https://www.mdpi.com/1422-0067/26/5/2148]
- 109. MiniResource Brief guide to RT-qPCR [https://www.sciencedirect.com/science/article/pii/S1016847824001663]
- 110. Starting with RNA— One - step or two - step - RT ? | IDT qPCR [https://www.idtdna.com/page/support-and-education/decoded-plus/one-step-two-step/]
- 111. MIQE 2.0 and the Urgent Need to Rethink qPCR Standards [https://www.mdpi.com/1422-0067/26/11/4975]
- 112. Comparative analysis of RT-qPCR, flow cytometry, and Di ... [https://pmc.ncbi.nlm.nih.gov/articles/PMC12418842/]
- 113. Integrating Raman spectroscopy and RT-qPCR for ... [https://www.sciencedirect.com/science/article/abs/pii/S0731708525001852]
- 114. Two-step RT-qPCR kits [https://www.takarabio.com/learning-centers/real-time-pcr/overview/two-step-rt-qpcr-kits?srsltid=AfmBOooFmr1zGSWRWHML_jEdhWcp65sXs2swRle77lXKrxEe72MMwVeY]
- 115. PrimeTime One - Step - RT Master Mix | IDT qPCR [https://www.idtdna.com/pages/products/qpcr-and-pcr/gene-expression/primetime-one-step-rt-qpcr-master-mix]
- 116. Choice Of One Step RT-qPCR Or Two Step RT-qPCR [https://www.neb.com/en-us/applications/dna-amplification-pcr-and-qpcr/choice-of-one-step-rt-qpcr-or-two-step-rt-qpcr?srsltid=AfmBOorFEhuibec2krVU0eyZgW1_h2QKUPudH_FcdibwTt8fHi0OcPGF]
- 117. Takara Bio launches high-throughput, cost-effective qPCR ... [https://www.takarabio.com/about/in-the-news/takara-bio-launches-high-throughput-cost-effective-qpcr-system-to-advance-clinical-research?srsltid=AfmBOoodJeC3np5WMdEh5fCflmQhidsQZJqnR_14YxqfUjpIExFQiDAs]
- 118. Automation and miniaturization of high-throughput qPCR ... [https://www.sciencedirect.com/science/article/pii/S2472630324001237]
- 119. A high-throughput screening RT-qPCR assay for ... [https://pmc.ncbi.nlm.nih.gov/articles/PMC9469018/]