Molecular Descriptors in Cancer QSAR: From Fundamentals to Clinical Applications in Drug Discovery
This comprehensive review elucidates the critical role of molecular descriptors in Quantitative Structure-Activity Relationship (QSAR) studies for anticancer drug development.
Molecular Descriptors in Cancer QSAR: From Fundamentals to Clinical Applications in Drug Discovery
Abstract
This comprehensive review elucidates the critical role of molecular descriptors in Quantitative Structure-Activity Relationship (QSAR) studies for anticancer drug development. It explores the fundamental taxonomy of descriptors—including constitutional, topological, electronic, and geometric properties—and their calculation methods. The article details advanced QSAR methodologies integrating machine learning and hybrid descriptors for various cancers, addressing key challenges like applicability domain limitations and model overfitting. Through validation protocols and comparative analysis of descriptor performance across case studies, we demonstrate how optimized QSAR workflows accelerate the discovery of novel therapeutics for breast, colon, lung, and other cancers while reducing reliance on animal testing.
The Essential Language of Molecules: Understanding Molecular Descriptor Fundamentals
In the relentless pursuit of effective cancer therapeutics, quantitative structure-activity relationship (QSAR) studies have emerged as a powerful computational strategy for rational drug design. At the heart of every QSAR model lies the molecular descriptor—a numerical representation that encodes key chemical information from a molecule's symbolic structure. These descriptors serve as the fundamental numerical fingerprints that allow scientists to translate chemical intuition into mathematical models capable of predicting biological activity. In cancer research, where the goal is often to discover or optimize compounds with specific antitumor properties, molecular descriptors provide the critical link between molecular structure and pharmacological effect, enabling researchers to sift through vast chemical spaces in silico before committing resources to laboratory synthesis and biological testing [1].
The transformation of molecules into numbers is not merely a convenience but a necessity for applying statistical and machine learning methods to drug discovery. By reducing complex three-dimensional molecular structures to quantitative values, descriptors facilitate the establishment of reliable correlations between chemical features and biological endpoints, such as cytotoxic potency, receptor binding affinity, or metabolic stability. This quantitative approach has become indispensable in oncology, where molecular descriptors help guide the design of novel antitumor agents against challenging targets, including recent efforts in colorectal cancer and KRAS-driven lung cancers [2] [3].
Defining and Classifying Molecular Descriptors
Fundamental Concept
A molecular descriptor is formally defined as "the final result of a logic and mathematical procedure which transforms chemical information encoded within a symbolic representation of a molecule into a useful number or the result of some standardized experiment" [4]. This definition encompasses both experimental measurements, such as log P (lipophilicity), molar refractivity, and dipole moment, as well as theoretical descriptors derived strictly from molecular structure [4]. The predictive power of any QSAR model hinges on the careful selection of descriptors that capture structural features relevant to the biological activity under investigation.
Essential Criteria for Effective Descriptors
For molecular descriptors to be practically useful in QSAR studies, they should meet several key criteria. A robust descriptor must be invariant to molecular manipulations that don't alter intrinsic structure, such as atom numbering, rotation, or translation in space. The algorithm for its calculation should be unambiguous and well-defined [4]. Beyond these foundational requirements, an ideal descriptor should have a clear structural interpretation, correlate with at least one experimental property, provide non-redundant information, and demonstrate minimal degeneracy (where different structures yield the same value) [4]. The ability to discriminate between isomers and applicability to diverse molecular classes are particularly valuable in cancer drug discovery, where subtle structural changes can dramatically alter biological activity [1].
Hierarchical Classification of Descriptors
Molecular descriptors are typically categorized according to the level of structural representation they encode, forming a hierarchy from simple atomic inventories to complex three-dimensional representations [4] [5].
Table 1: Classification of Molecular Descriptors by Dimensionality
| Descriptor Type | Structural Information Encoded | Examples |
|---|---|---|
| 0D Descriptors | Atom types, molecular weight, bond types | Molecular weight, atom counts, element types |
| 1D Descriptors | Presence/absence of functional groups, counts of specific features | Hydrogen bond donors/acceptors, ring counts, functional group counts |
| 2D Descriptors | Topological connections between atoms | Molecular connectivity indices, graph invariants, topological polar surface area |
| 3D Descriptors | Three-dimensional geometry, stereochemistry | Steric parameters, surface area/volume descriptors, 3D-MoRSE descriptors, WHIM descriptors |
| 4D Descriptors | Molecular interaction fields | GRID descriptors, CoMFA fields |
This hierarchical classification reflects increasing levels of structural complexity, with higher-dimensional descriptors generally providing more detailed—but computationally more expensive—representations of molecular structure. In cancer QSAR studies, the choice of descriptor type involves a trade-off between computational efficiency, interpretability, and informational completeness [4] [5].
Molecular Descriptors in Cancer QSAR Studies
Historical Context and Key Applications
The application of QSAR and molecular descriptors in cancer research spans decades, with early work focusing on classical approaches such as Hansch analysis and Free-Wilson analysis to relate structural features to antitumor activity [1]. These methods established the fundamental principle that a drug's distribution and interaction with biological targets are determined by properties such as lipophilicity, charge distribution, and electronic characteristics—all quantifiable through appropriate molecular descriptors [1]. For example, studies on 9-anilinoacridine antitumor agents successfully correlated structural features with both experimental antitumor activity and toxicity, demonstrating the potential of descriptors to guide the optimization of therapeutic windows in anticancer agents [1].
Advanced Descriptors in Contemporary Oncology Research
Recent advances have expanded the descriptor toolkit beyond traditional parameters to include sophisticated quantum-chemical and shape-based descriptors. In a 2025 study on anti-colorectal cancer compounds, researchers developed a high-dimensional framework using three-dimensional electron density features computed via density functional theory (DFT) [2]. These electron cloud descriptors were encoded into multi-scale representations including radial distribution functions, spherical harmonic expansions, and persistent homology, capturing molecular electronic and spatial complexity beyond conventional descriptors [2]. This approach yielded significant predictive improvements, with AUC values increasing from 0.88 with standard descriptors to 0.96 with the electron density features when using Light Gradient Boosting Machine (LightGBM) models [2].
Similarly, in KRAS inhibitor development for lung cancer therapy, QSAR models incorporating topological, constitutional, geometrical, and electronic descriptors successfully predicted inhibitory potency (pIC₅₀) [3]. The genetic algorithm-optimized model identified eight optimal molecular descriptors that provided both predictive power and interpretability, enabling virtual screening of de novo designed compounds [3]. This integrative approach demonstrates how carefully selected descriptors can accelerate the discovery of targeted therapies for historically "undruggable" oncoproteins like KRAS [3].
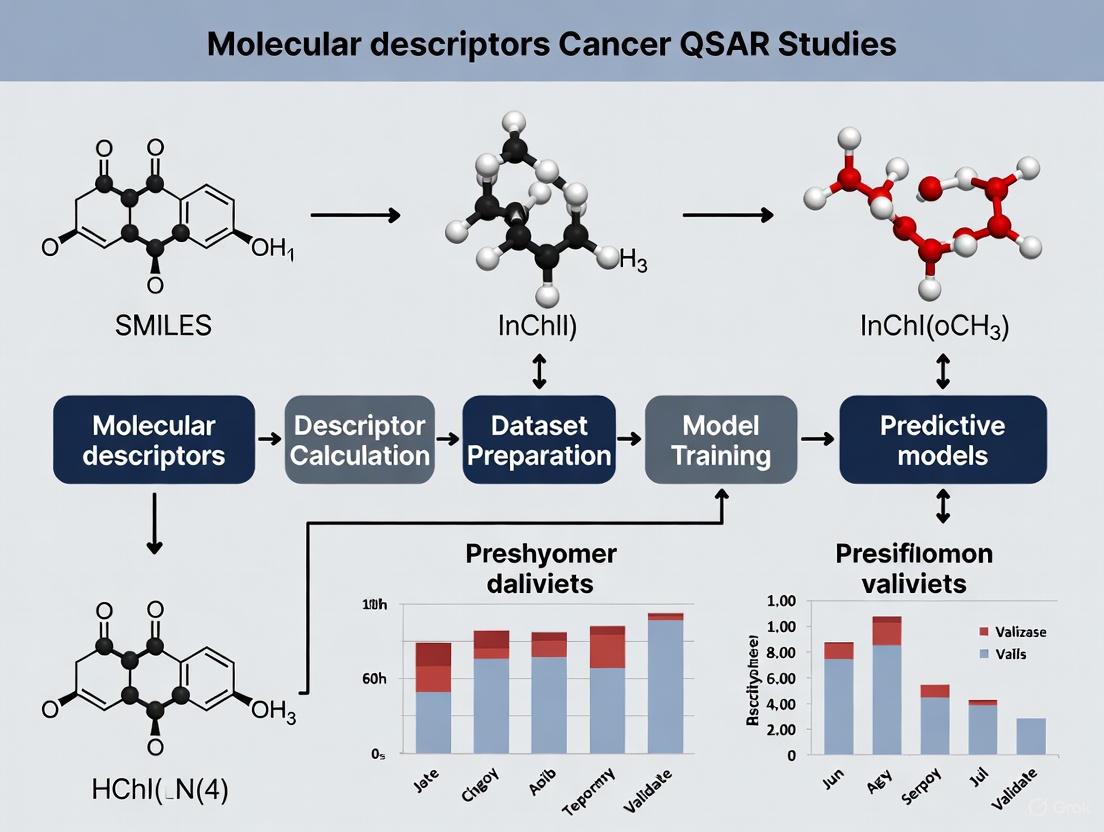
Diagram 1: QSAR Workflow in Cancer Drug Discovery. This workflow illustrates how molecular descriptors of varying complexity are calculated from chemical compounds and integrated into QSAR models for predicting biological activity in cancer research.
Practical Implementation: Calculating and Applying Descriptors
Software Tools for Descriptor Calculation
Numerous software packages exist for calculating molecular descriptors, ranging from commercial suites to open-source libraries. The selection of an appropriate tool depends on factors such as the types of descriptors needed, programming environment, budget, and specific application requirements.
Table 2: Software Tools for Molecular Descriptor Calculation
| Software | Descriptor Types | Interface | License | Key Features |
|---|---|---|---|---|
| alvaDesc | 0D, Fingerprints, 3D | Python, CLI, GUI, KNIME | Proprietary | Comprehensive descriptor set, updated through 2025, multiplatform support |
| Dragon | 0D, Fingerprints, 3D | CLI, GUI, KNIME | Proprietary | Historically industry-standard, now discontinued |
| Mordred | 0D, 3D | Python, CLI | Open Source | Based on RDKit, community-maintained |
| PaDEL-Descriptor | 0D, Fingerprints, 3D | Python, CLI, GUI, KNIME | Free | Based on CDK, discontinued since 2014 |
| RDKit | 0D, Fingerprints, 3D | Python, KNIME | Open Source | Active development, cheminformatics platform |
| scikit-fingerprints | 0D, Fingerprints, 3D | Python | Open Source | Integrates with scikit-learn, updated through 2025 |
For cancer QSAR studies specifically, tools like alvaDesc and RDKit offer particularly robust solutions, providing both traditional descriptors and specialized parameters relevant to drug discovery [4]. The choice of software often influences the descriptor selection strategy, with some packages offering curated descriptor sets optimized for specific biological endpoints.
Experimental Protocol: QSAR Modeling with Molecular Descriptors
The application of molecular descriptors in cancer QSAR research follows a systematic workflow, as demonstrated in recent studies on KRAS inhibitors for lung cancer [3]:
Dataset Compilation: A curated set of 62 KRAS inhibitors with experimentally measured IC₅₀ values was retrieved from the ChEMBL database (CHEMBL4354832). IC₅₀ values were converted to pIC₅₀ using the standard transformation: pIC₅₀ = -log₁₀(IC₅₀ × 10⁻⁹) to create a more suitable scale for regression modeling [3].
Descriptor Calculation and Preprocessing: Molecular descriptors were calculated using the ChemoPy package in Python, generating topological, constitutional, geometrical, and electronic features. The resulting descriptor matrix was filtered to remove non-numeric descriptors, columns with missing values, and zero-variance descriptors. Highly correlated descriptors (Pearson's |r| > 0.95) were removed to reduce multicollinearity [3].
Feature Selection and Model Training: A Genetic Algorithm (GA) was employed to identify an optimal descriptor subset maximizing adjusted R-squared while penalizing model complexity. The fitness function was defined as: Fitness = R²adj - (k/n), where k is the number of selected descriptors and n is the number of training samples. Multiple machine learning algorithms were benchmarked, including Partial Least Squares (PLS), Random Forest (RF), and Genetic Algorithm-optimized Multiple Linear Regression (GA-MLR) [3].
Model Validation and Interpretation: Model performance was evaluated using R², RMSE, and MAE on a held-out test set. The best-performing PLS model achieved R² = 0.851 and RMSE = 0.292. Feature interpretability was enhanced through SHAP analysis and permutation-based importance measures [3].
Virtual Screening and De Novo Design: The validated QSAR model was used to screen virtually designed compounds within the model's applicability domain, identifying promising candidates like compound C9 with predicted pIC₅₀ of 8.11 for further investigation [3].
Table 3: Essential Research Reagents and Computational Tools for Cancer QSAR
| Resource Category | Specific Tools/Reagents | Function in QSAR Workflow |
|---|---|---|
| Descriptor Calculation | alvaDesc, RDKit, Mordred, ChemoPy | Generate numerical representations from molecular structures |
| Data Sources | ChEMBL, PubChem | Provide curated biological activity data for model training |
| Machine Learning Frameworks | scikit-learn, XGBoost, Random Forest | Build predictive models linking descriptors to biological activity |
| Model Interpretation | SHAP, permutation importance | Explain model predictions and identify critical structural features |
| Chemical Design | DataWarrior, de novo evolution algorithms | Generate novel molecular structures based on QSAR predictions |
| Applicability Domain Assessment | Mahalanobis Distance, leverage | Define the chemical space where models make reliable predictions |
Emerging Trends and Advanced Descriptor Types
The evolution of molecular descriptors continues to advance cancer QSAR research, with several promising trends emerging. The integration of quantum chemical descriptors derived from density functional theory (DFT) calculations represents a significant frontier, providing detailed electronic structure information that surpasses traditional empirical descriptors [2] [6]. As demonstrated in anti-colorectal cancer studies, 3D electron cloud descriptors capture electronic and spatial complexity through radial distribution functions, spherical harmonic expansions, and persistent homology, leading to substantial improvements in predictive accuracy [2].
Another important development is the strategic combination of descriptor types to leverage their complementary strengths. Recent studies show that integrating conventional 1D/2D descriptors with advanced 3D electronic features produces more robust QSAR models than either approach alone [2]. This hybrid strategy balances computational efficiency with detailed molecular representation, particularly valuable for modeling complex biological interactions like protein-ligand binding in oncology targets.
Diagram 2: Molecular Descriptor Integration in Cancer QSAR. This diagram illustrates how different classes of molecular descriptors feed into various machine learning algorithms to address specific cancer drug discovery challenges.
Molecular descriptors serve as the indispensable numerical fingerprints that bridge chemical structure and biological activity in cancer QSAR studies. From simple constitutional counts to sophisticated 3D electron cloud representations, these quantitative encodings enable researchers to build predictive models that accelerate oncology drug discovery. As descriptor technology continues to evolve—incorporating increasingly detailed electronic, topological, and quantum-chemical information—its impact on rational cancer therapeutic design will only grow. Despite challenges in computational cost and model interpretability, the strategic application of molecular descriptors remains fundamental to advancing personalized cancer treatment through computational means. The ongoing refinement of these numerical representations promises to unlock new opportunities for targeting historically intractable oncogenic drivers, ultimately contributing to more effective and selective cancer therapies.
In the realm of cancer drug discovery, Quantitative Structure-Activity Relationship (QSAR) studies serve as pivotal computational tools that mathematically correlate the biological activity of chemical compounds with their molecular structure. The foundational premise of QSAR modeling posits that the variance in biological properties of molecules, such as their cytotoxicity against specific cancer cell lines, can be correlated with numerical representations derived from their chemical structures. These numerical representations, known as molecular descriptors, are quantitative parameters that encode specific aspects of a molecule's structure and properties, thereby enabling the prediction of biological activity for novel compounds without the immediate need for costly and time-consuming laboratory synthesis and biological testing. The application of QSAR modeling in oncology research has gained substantial traction, as evidenced by recent studies focusing on various cancer types, including melanoma, breast cancer, colorectal cancer, and leukemia [7] [8] [9].
The taxonomy of molecular descriptors is systematically categorized based on the structural and physicochemical information they encode. This classification encompasses constitutional, topological, electronic, geometric, and thermodynamic descriptors, each providing unique insights into molecular characteristics relevant to biological activity. In cancer research, the strategic selection and application of these descriptors facilitate the understanding of how chemical structures influence anti-cancer efficacy, thereby guiding the rational design of novel therapeutic agents. For instance, recent QSAR studies on anti-melanoma compounds utilized a combination of descriptor types to develop models with significant predictive power for cytotoxicity against SK-MEL-2 and SK-MEL-5 cell lines [7] [9]. Similarly, research on breast cancer therapeutics has leveraged topological and electronic descriptors to model drug behavior and properties [10] [11]. This whitepaper provides a comprehensive technical examination of the five core descriptor types, detailing their theoretical foundations, computation methodologies, and specific applications within cancer QSAR modeling, with particular emphasis on experimental protocols and data presentation frameworks utilized in contemporary research.
Constitutional Descriptors
Definition and Significance
Constitutional descriptors represent the most fundamental class of molecular descriptors, derived directly from the molecular formula without consideration of molecular geometry or connectivity. These descriptors provide basic, yet highly informative, quantitative measures of a compound's atomic composition and overall molecular framework. In cancer QSAR studies, constitutional descriptors serve as primary filters for compound screening, offering initial insights into molecular size, composition, and bulk properties that may influence drug-likeness, bioavailability, and general trends in cytotoxic activity. Their computation is straightforward and does not require molecular geometry optimization, making them computationally inexpensive and readily obtainable for large compound libraries in virtual screening campaigns aimed at identifying novel anti-cancer agents.
Key Constitutional Descriptors and Their Computation
The calculation of constitutional descriptors involves counting specific atomic types or molecular features within a chemical structure. Representative constitutional descriptors include molecular weight (MW), number of specific atom types (e.g., carbon, oxygen, nitrogen), number of bonds, number of rings, and number of functional groups. These descriptors are typically generated from molecular structure files using specialized software such as PaDEL-Descriptor, Dragon, and ChemDes [7] [8].
Table 1: Key Constitutional Descriptors in Cancer QSAR Studies
| Descriptor Name | Mathematical Definition | Interpretation in Cancer QSAR | Exemplary Application |
|---|---|---|---|
| Molecular Weight (MW) | Sum of atomic masses of all atoms in molecule | Related to membrane permeability and bioavailability; often correlated with cytotoxic activity | Identified as key descriptor in ARC-111 analogues QSAR for RPMI8402 tumor cells [12] |
| Number of Heavy Atoms | Count of all atoms except hydrogen | Indicator of molecular size and complexity; influences drug-receptor interactions | Used in GA-MLRA model for anti-leukemia compounds against MOLT-4 and P388 cell lines [8] |
| Number of Rotatable Bonds | Count of single bonds excluding amide C-N bonds | Measure of molecular flexibility; related to entropy changes upon binding | Feature in combinatorial QSAR models for breast cancer drug pairs [13] |
| Number of H-Bond Donors/Acceptors | Count of O-H and N-H bonds (donors); N and O atoms with lone pairs (acceptors) | Predicts solubility and membrane penetration; critical for oral bioavailability of anti-cancer drugs | Component of descriptor sets for SK-MEL-5 melanoma cell line cytotoxicity prediction [9] |
Experimental Protocol for Constitutional Descriptor Calculation
The standard workflow for computing constitutional descriptors in cancer QSAR studies involves sequential steps:
- Structure Input: Provide molecular structures in standardized format (e.g., SMILES, SDF, MOL2) ensuring proper valence and explicit hydrogen treatment. In a study on 1,2,3-triazole-pyrimidine derivatives against gastric cancer cells, 2D structures were converted to 3D and optimized using Density Functional Theory (DFT/B3LYP) with 6-31G basis set [14].
- Descriptor Generation: Utilize computational tools such as PaDEL-Descriptor, which computes 1D and 2D descriptors directly from molecular structure, or Dragon software, which offers comprehensive descriptor calculations including constitutional descriptors [7] [8] [9].
- Descriptor Preprocessing: Apply filtering to remove constant or near-constant descriptors, handle missing values, and reduce redundancy through correlation analysis. As implemented in a melanoma QSAR study, this step involves removing variables with constant or near-constant values using a threshold (e.g., 0.1%), eliminating features with missing values, and excluding highly correlated descriptors to minimize multicollinearity [9].
Topological Descriptors
Theoretical Foundations
Topological descriptors, derived from chemical graph theory, represent molecular structures as mathematical graphs where atoms correspond to vertices and bonds to edges. These descriptors encode information about molecular connectivity, branching, and shape, providing insights into structural aspects that influence biological activity without requiring 3D coordinate information. In cancer QSAR, topological indices have demonstrated significant utility in predicting cytotoxic activity, physicochemical properties, and absorption, distribution, metabolism, excretion, and toxicity (ADMET) parameters of anti-cancer compounds. Recent advances have introduced sophisticated topological indices such as entire neighborhood indices and resolving topological indices, which capture more complex structural patterns and atomic environments relevant to drug-receptor interactions [10] [11].
The application of topological descriptors in cancer research spans various malignancies. For breast cancer drugs, entire neighborhood topological indices have shown strong correlations with physicochemical properties, enabling predictive modeling of molar volume, polarizability, and molar refractivity [10]. Similarly, in anti-leukemia drug discovery, topological descriptors like the conventional bond order ID number (piPC1) and the largest absolute eigenvalue of Burden modified matrix (SpMax7_Bhm) were identified as significant predictors of activity against MOLT-4 and P388 cell lines [8]. The computational efficiency of topological descriptors makes them particularly valuable for high-throughput virtual screening of large chemical libraries in early-stage anti-cancer drug development.
Key Topological Indices and Their Applications
Topological indices quantify specific aspects of molecular structure based on graph-theoretical principles. These indices are broadly categorized into degree-based, distance-based, and information-theoretic indices, each capturing distinct topological features.
Table 2: Key Topological Descriptors in Cancer QSAR Studies
| Descriptor Category | Representative Indices | Mathematical Formulation | Cancer QSAR Application |
|---|---|---|---|
| Degree-Based Indices | Zagreb Indices (M₁, M₂), Randić Index | M₁ = Σ[du]², M₂ = Σ(du·dv) | Used in breast cancer drug QSPR studies for predicting polar surface area and surface tension [11] |
| Distance-Based Indices | Wiener Index, Balaban Index | J = [m/(μ+1)] Σ(di·dj)^(-1/2) | Applied in QSAR models of ARC-111 analogues targeting topoisomerase I [12] |
| Entire Neighborhood Indices | First and Second Entire Neighborhood | FNε = Σδ(x)², SNε = Σ[δ(x)·δ(y)]^(-1/2) | Correlated with physicochemical properties of 16 breast cancer drugs [10] |
| Information-Theoretic Indices | Molecular Connectivity Index | Based on Shannon's entropy applied to graph elements | Component of descriptor sets for SK-MEL-5 melanoma cytotoxicity prediction [9] |
Computational Methodology
The calculation of topological descriptors follows a systematic protocol implemented in various software packages:
- Molecular Graph Representation: Convert the chemical structure to a hydrogen-suppressed graph where vertices represent non-hydrogen atoms and edges represent chemical bonds. In studies of breast cancer drugs, molecular graphs were constructed based on their chemical molecular structures [10].
- Graph Invariant Computation: Calculate topological indices based on the graph representation using algorithms for degree calculation, path enumeration, and distance matrix computation. Software tools such as Dragon, PaDEL-Descriptor, and specialized MATLAB or Python scripts are commonly employed. For instance, in the development of a combinational QSAR model for breast cancer, PaDEL-Descriptor was used to compute topological descriptors for anchor and library drugs [13].
- Descriptor Validation: Ensure computed indices satisfy mathematical properties and are chemically meaningful. This includes checking for degeneracy (different structures yielding same index value) and correlation with established descriptors. In high-dimensional descriptor selection for ARC-111 analogues, the Worst Descriptor Elimination Multi-roundly (WDEM) and High-dimensional Descriptor Selection Nonlinearly (HDSN) methods were applied to select the most relevant topological descriptors from thousands of candidates [12].
Electronic Descriptors
Theoretical Background
Electronic descriptors quantify the electronic distribution and reactivity characteristics of molecules, which directly influence their interactions with biological targets through electrostatic forces, charge transfer, and hydrogen bonding. In cancer QSAR, electronic descriptors are particularly valuable for understanding drug-receptor interactions, as they capture aspects of molecular recognition and binding affinity. These descriptors are typically derived from quantum chemical calculations using methods such as Density Functional Theory (DFT), which provides accurate electronic structure information at reasonable computational cost. Recent advances in electronic descriptor development include 3D electron cloud descriptors derived from DFT calculations, which have shown enhanced predictive power in QSAR models for anti-colorectal cancer compounds [2].
Electronic properties play a crucial role in the mechanism of action of many anti-cancer drugs. For instance, in QSAR studies of 1,2,3-triazole-pyrimidine derivatives against human gastric cancer cells (MGC-803), electronic descriptors computed at the B3LYP/6-31G level successfully predicted IC₅₀ values and provided insights into ligand-receptor interactions [14]. Similarly, in melanoma research, electronic descriptors contributed to QSAR models predicting cytotoxicity against SK-MEL-2 cells, with subsequent molecular docking studies elucidating binding modes with the V600E-BRAF protein [7]. The integration of electronic descriptors with other descriptor types has become standard practice in comprehensive cancer QSAR modeling, enabling more accurate prediction of anti-cancer activity and facilitating rational drug design.
Key Electronic Descriptors
Electronic descriptors encompass a range of molecular properties derived from quantum mechanical calculations, each providing unique insights into electronic structure and reactivity.
Table 3: Key Electronic Descriptors in Cancer QSAR Studies
| Descriptor Category | Representative Descriptors | Computational Method | Biological Significance in Cancer QSAR |
|---|---|---|---|
| Orbital Energy Descriptors | HOMO Energy, LUMO Energy, HOMO-LUMO Gap | DFT/B3LYP/6-31G | Predicts charge transfer interactions and chemical reactivity with cancer target proteins [14] |
| Charge-Based Descriptors | Partial Atomic Charges, Dipole Moment, Molecular Polarizability | DFT/Mulliken or Natural Population Analysis | Quantifies electrostatic interactions with receptor sites; dipole moment identified as key descriptor for ARC-111 analogues [12] |
| Reactivity Descriptors | Electrophilicity Index, Hardness, Softness | DFT-based conceptual DFT | Correlates with cytotoxic potency against various cancer cell lines [14] |
| 3D Electron Cloud Descriptors | Radial Distribution Functions, Spherical Harmonic Expansions | DFT followed by 3D point cloud encoding | Enhanced prediction of anti-colorectal cancer activity; AUC increased from 0.88 to 0.96 [2] |
Experimental Protocol for Electronic Descriptor Calculation
The computation of electronic descriptors requires rigorous quantum chemical calculations following a standardized protocol:
- Molecular Geometry Optimization: Begin with initial molecular structure and perform geometry optimization using quantum chemical methods (typically DFT with B3LYP functional and 6-31G* or 6-31G* basis set) to obtain the minimum energy conformation. In a study on anti-melanoma compounds, molecular optimization was set at the ground state employing DFT/B3LYP with 6-31G basis set [7].
- Wavefunction Calculation: Perform single-point energy calculation on the optimized geometry to obtain the wavefunction and electron density distribution. For enhanced electronic description, 3D electron cloud descriptors can be computed by converting electron densities to 3D point clouds and encoding them into multi-scale descriptors including radial distribution functions, spherical harmonic expansions, and point feature histograms [2].
- Electronic Property Extraction: Calculate electronic descriptors from the wavefunction, including frontier molecular orbital energies (HOMO, LUMO), partial atomic charges, dipole moment, and molecular electrostatic potential. In the QSAR study of 1,2,3-triazole-pyrimidine derivatives, these descriptors were computed using B3LYP/6-31G and correlated with observed bioactivities against MGC-803 gastric cancer cells [14].
- Descriptor Validation: Verify the consistency of computed properties through frequency calculations (confirming no imaginary frequencies for optimized structures) and comparison with experimental data when available.
Geometric and Thermodynamic Descriptors
Geometric Descriptors
Geometric descriptors encode information about the three-dimensional shape and size of molecules, capturing steric features that significantly influence molecular recognition and binding to biological targets. Unlike topological descriptors that consider only connectivity, geometric descriptors require 3D molecular coordinates and are therefore conformation-dependent. In cancer QSAR, geometric descriptors help elucidate steric complementarity between drugs and their target receptors, providing insights into binding affinity and selectivity. Recent research in anti-colorectal cancer compound modeling has demonstrated that geometric descriptors derived from 3D electron cloud representations significantly enhance predictive performance when combined with electronic descriptors [2].
Key geometric descriptors include molecular surface area, solvent-accessible surface area, molecular volume, moments of inertia, and asphericity indices. These descriptors are particularly relevant in cancer drug discovery where shape complementarity between ligand and receptor often determines binding specificity. In breast cancer drug studies, geometric descriptors have been employed to predict physicochemical properties such as molar volume and polar surface area, which influence absorption and distribution characteristics [10] [11]. The computation of geometric descriptors typically follows molecular geometry optimization using quantum chemical methods or molecular mechanics force fields, ensuring accurate representation of molecular shape and dimensions.
Thermodynamic Descriptors
Thermodynamic descriptors quantify the energy-related properties and stability characteristics of molecules, providing insights into the energetics of drug-receptor interactions and metabolic stability. These descriptors are particularly relevant in cancer drug discovery, where compound stability and interaction energetics directly influence efficacy and pharmacokinetics. Key thermodynamic descriptors include heat of formation (ΔHf), free energy of solvation, lattice energy, and vaporization enthalpy. In QSAR modeling of ARC-111 analogues for RPMI8402 tumor cells, the heat of formation (ΔHf₀) was identified as one of six key descriptors responsible for predicting antitumor activity [12].
The calculation of thermodynamic descriptors typically involves quantum chemical computations or quantitative structure-property relationship (QSPR) estimations. For instance, in the development of QSAR models for anti-melanoma compounds, thermodynamic descriptors were computed alongside electronic and topological descriptors to comprehensively characterize molecular properties relevant to cytotoxicity [7] [9]. Thermodynamic parameters also play a crucial role in understanding the metabolic stability and degradation pathways of anti-cancer compounds, providing valuable insights for lead optimization in drug discovery programs.
Computational Framework
The calculation of geometric and thermodynamic descriptors follows an integrated computational protocol:
- 3D Structure Generation: Convert 2D structures to 3D conformations using tools such as Open Babel, CORINA, or molecular modeling software. In studies of anti-melanoma compounds, 2D structures were converted to 3D using Spartan software followed by geometry optimization [7].
- Conformational Analysis: Perform systematic or stochastic conformational search to identify low-energy conformers, selecting the global minimum energy conformation for descriptor calculation.
- Geometry Optimization: Refine the 3D structure using quantum chemical methods (e.g., DFT with appropriate basis set) or molecular mechanics force fields to obtain accurate molecular geometries.
- Descriptor Computation: Calculate geometric descriptors (volume, surface area, shape parameters) and thermodynamic descriptors (formation enthalpy, free energies) using computational chemistry software such as Gaussian, GAMESS, or specialized descriptor calculation tools.
Table 4: Geometric and Thermodynamic Descriptors in Cancer QSAR
| Descriptor Type | Specific Descriptors | Computational Approach | Cancer QSAR Relevance |
|---|---|---|---|
| Geometric Descriptors | Molecular Volume, Surface Area, Radius of Gyration | DFT-optimized structures followed by surface calculation | Predicts transport properties and binding cavity compatibility in cancer targets |
| Shape Descriptors | Principal Moments of Inertia, Asphericity, Eccentricity | Coordinate diagonalization of inertia tensor | Correlates with specificity for cancer enzyme active sites |
| Thermodynamic Descriptors | Heat of Formation (ΔHf), Free Energy of Solvation | DFT computation or group contribution methods | ΔHf identified as key descriptor in ARC-111 analogues QSAR [12] |
| Surface Property Descriptors | Polar Surface Area (PSA), Molecular Polarizability | Surface analysis of optimized geometries | Predicts membrane permeability and bioavailability of breast cancer drugs [11] |
Integrated QSAR Modeling in Cancer Research
Descriptor Selection and Model Building
The integration of multiple descriptor types into comprehensive QSAR models represents the state-of-the-art in cancer drug discovery. Descriptor selection is a critical step that identifies the most relevant molecular features for predicting anti-cancer activity while avoiding overfitting. Advanced machine learning techniques coupled with robust validation protocols have significantly enhanced the predictive power and reliability of QSAR models in oncology research. For instance, in developing QSAR models for anti-melanoma compounds, researchers employed genetic algorithms for descriptor selection and multiple linear regression for model building, achieving R² values of 0.902 for MOLT-4 and 0.904 for P388 leukemia cell lines [8].
Recent approaches to descriptor selection and model building include:
- High-Dimensional Descriptor Selection: Techniques such as the Worst Descriptor Elimination Multi-roundly (WDEM) and High-dimensional Descriptor Selection Nonlinearly (HDSN) methods enable efficient selection of relevant descriptors from thousands of candidates. In a study of ARC-111 analogues, these methods reduced descriptors from 2,923 to 7-11 highly predictive features while maintaining model accuracy [12].
- Machine Learning Integration: Advanced algorithms including Random Forest, Support Vector Machines, and Deep Neural Networks have been successfully applied to QSAR modeling for various cancers. In combinatorial QSAR for breast cancer, Deep Neural Networks achieved an impressive R² of 0.94 for predicting combination drug activity [13].
- Multi-Descriptor Integration: Combining descriptor types (constitutional, topological, electronic, geometric, thermodynamic) provides comprehensive molecular representation. For anti-colorectal cancer compounds, integrating 3D electron cloud descriptors with conventional 1D/2D descriptors significantly enhanced model accuracy [2].
Validation and Applicability Domain Assessment
Rigorous model validation is essential to ensure the reliability and predictive power of QSAR models in cancer research. The validation process assesses both internal consistency and external predictivity, while applicability domain analysis determines the scope and limitations of the model. Standard validation protocols include:
- Internal Validation: Assess model performance using cross-validation techniques such as leave-one-out (LOO) or k-fold cross-validation. For example, in QSAR modeling of anti-melanoma compounds, the best-generated model based on multiple linear regression showed good quality of fits (R² = 0.864, Q²cv = 0.799) [7].
- External Validation: Evaluate the model on an independent test set not used in model building. In the melanoma QSAR study, the model's predictive ability was determined by a test set of twenty-two compounds, with R²pred = 0.706 [7].
- Y-Scrambling/Randomization: Confirm the non-random character of the model by permuting activity values while keeping descriptors unchanged; significantly worse performance in scrambled models indicates a robust QSAR model [8] [9].
- Applicability Domain Analysis: Define the chemical space where the model can make reliable predictions using methods such as leverage approach, distance-based methods, or probability density distribution. This ensures that predictions are only made for compounds structurally similar to the training set [9].
Research Reagent Solutions
Table 5: Essential Computational Tools for Descriptor Calculation and QSAR Modeling
| Tool Category | Specific Software/Tools | Primary Function | Application in Cancer QSAR |
|---|---|---|---|
| Descriptor Calculation | PaDEL-Descriptor, Dragon, ChemDes | Compute 1D, 2D, and 3D molecular descriptors | Used to generate descriptors for anti-leukemia compounds [8] and breast cancer drug combinations [13] |
| Quantum Chemical Computation | Gaussian, GAMESS, Spartan | Perform DFT calculations for electronic descriptors | Employed for geometry optimization and electronic property calculation for anti-melanoma compounds [7] and gastric cancer inhibitors [14] |
| Machine Learning Platforms | Scikit-learn, Weka, TensorFlow | Implement ML algorithms for QSAR model development | Utilized for developing combinatorial QSAR models for breast cancer using DNN and other algorithms [13] |
| Molecular Visualization & Analysis | Discovery Studio Visualizer, PyMOL, ChemAxon | Structure standardization, visualization, and analysis | Applied in SK-MEL-5 melanoma cell line QSAR studies for structure standardization [9] |
The strategic application of molecular descriptor taxonomy in cancer QSAR studies represents a powerful paradigm in modern anti-cancer drug discovery. Constitutional, topological, electronic, geometric, and thermodynamic descriptors collectively provide a comprehensive representation of molecular structure and properties, enabling the development of robust predictive models for anti-cancer activity. The integration of these descriptor classes with advanced machine learning algorithms has significantly enhanced the accuracy and applicability of QSAR models across various cancer types, from melanoma and breast cancer to colorectal cancer and leukemia.
Future directions in descriptor development for cancer QSAR include the refinement of 3D electron cloud descriptors [2], the expansion of entire neighborhood topological indices [10] [11], and the implementation of multi-scale descriptor frameworks that integrate molecular, cellular, and tissue-level features. As QSAR methodologies continue to evolve, incorporating increasingly sophisticated descriptors and modeling techniques, their role in accelerating anti-cancer drug discovery and optimizing therapeutic agents will become increasingly indispensable. The systematic taxonomy and application of molecular descriptors outlined in this technical guide provide researchers with a comprehensive framework for leveraging these powerful computational tools in the ongoing battle against cancer.
In the field of anticancer drug discovery, Quantitative Structure-Activity Relationship (QSAR) modeling serves as a fundamental computational approach that mathematically links a chemical compound's molecular structure to its biological activity against cancer targets [15]. These models operate on the principle that structural variations systematically influence biological activity, enabling researchers to predict the anticancer potential of novel compounds before costly and time-consuming laboratory synthesis and biological testing [15]. The process transforms chemical structures into numerical representations known as molecular descriptors, which quantify structural, physicochemical, and electronic properties that influence biological activity [16] [15]. In cancer research specifically, QSAR has demonstrated significant utility in optimizing lead compounds against various cancer types, including breast cancer (MCF-7), liver cancer (HepG2), lung cancer, and colon cancer, as evidenced by recent studies on flavones, FGFR-1 inhibitors, KRAS inhibitors, and chalcone derivatives [17] [18] [3].
The critical importance of molecular descriptors extends beyond mere prediction—they provide mechanistic insights into the structural features that enhance or diminish anticancer activity. For instance, SHapley Additive exPlanations (SHAP) analysis in machine learning-driven QSAR models can highlight key molecular descriptors influencing anticancer activity, thereby guiding the rational design of more potent and selective anticancer agents [17]. As the field advances, the selection of appropriate descriptor calculation tools has become increasingly crucial for developing robust, interpretable, and predictive QSAR models in cancer drug discovery campaigns.
Comparative Analysis of Molecular Descriptor Software
Several software packages have been developed to calculate molecular descriptors, each with distinct capabilities, limitations, and applications in cancer QSAR studies. The four most prominent tools—PaDEL-Descriptor, Dragon, RDKit, and Mordred—vary significantly in their descriptor coverage, computational efficiency, licensing constraints, and ease of integration into QSAR workflows. Understanding these differences is essential for researchers to select the most appropriate tool for their specific cancer research applications.
Table 1: Comparative Overview of Major Molecular Descriptor Calculation Software
| Software | Descriptor Count | Key Features | Licensing | Interface Options | Programming Language |
|---|---|---|---|---|---|
| PaDEL-Descriptor | 1875 descriptors (1444 1D/2D + 431 3D) + 12 fingerprint types [19] | Graphical User Interface (GUI), command-line, KNIME, RapidMiner extensions [19] | Free for all uses [19] | GUI, CLI, KNIME, RapidMiner [19] | Java [19] |
| Dragon | 5270 molecular descriptors [20] | Extensive descriptor coverage; widely used in industry [16] | Proprietary shareware [16] | GUI, CLI, web (e-Dragon), KNIME [16] | Not specified |
| RDKit | Not explicitly quantified (cheminformatics library) | Broad cheminformatics functionality beyond descriptor calculation [16] | Open-source [16] | Python, C++, Java, C# [16] | C++ with multi-language bindings |
| Mordred | >1800 descriptors (2D & 3D) [16] | High calculation speed; automated molecular preprocessing [16] | BSD license (commercial & non-commercial use) [16] | Python package, CLI, web application [16] | Python (with RDKit and NumPy dependencies) [16] |
Performance and Technical Considerations
Beyond the basic features and descriptor counts, performance metrics and technical implementation details significantly influence software selection for cancer QSAR projects. Computational efficiency becomes particularly important when screening large virtual compound libraries against cancer targets. According to independent benchmarking, Mordred demonstrates notably faster calculation speeds, reported to be at least twice as fast as PaDEL-Descriptor and capable of calculating descriptors for large molecules like maitotoxin (molecular weight 3422) in approximately 1.2 seconds [16]. This performance advantage can substantially accelerate QSAR model development cycles in cancer drug discovery.
The dimensionality of descriptors represents another crucial consideration. While 3D descriptors can provide valuable chemical information about molecules, they require geometric optimization and may vary between 3D conformers, potentially affecting reproducibility [20]. Consequently, some researchers prefer using only 2D descriptors in their cancer QSAR studies to ensure consistency and avoid conformational complexities [20]. Mordred supports both 2D and 3D descriptor calculations, offering flexibility for different research needs [16].
Installation and dependency management vary considerably across tools. Mordred was specifically designed to simplify installation, with most dependencies coded in pure Python (except for RDKit and NumPy), enabling installation with a single command [16]. In contrast, tools like Cinfony require multiple manually installed dependencies, complicating the setup process [16]. Dragon's proprietary nature may present licensing constraints that complicate publication of constructed QSAR models [16], whereas open-source tools like Mordred (BSD license) and PaDEL-Descriptor (free for all uses) offer greater freedom for academic and commercial applications [16] [19].
Table 2: Performance and Technical Specifications of Descriptor Software
| Software | Calculation Speed | Platform Support | Dependencies | Preprocessing Capabilities | Automated Testing |
|---|---|---|---|---|---|
| PaDEL-Descriptor | Slower compared to Mordred [16] | Cross-platform (Java-based) [19] | Java JRE 6+ [19] | Salt removal, aromaticity detection, tautomer standardization [19] | Not specified |
| Dragon | Not explicitly benchmarked | Not specified | Not specified | Not specified | Not specified |
| RDKit | Not explicitly benchmarked | Cross-platform | Python, Boost, NumPy (for Python bindings) | Comprehensive cheminformatics functions | Not specified |
| Mordred | At least 2x faster than PaDEL-Descriptor [16] | Windows, Linux, macOS [16] | RDKit, NumPy, enum34, networkx, six, tqdm [16] | Automated H addition/removal, Kekulization, aromaticity detection [16] | All descriptors automatically tested [16] |
Implementation in Cancer QSAR Workflows
Standard QSAR Protocol for Cancer Research
The implementation of molecular descriptor calculators follows a systematic QSAR workflow that has been successfully applied to various cancer targets. The generalized protocol consists of several standardized steps that ensure the development of robust and predictive models for anticancer activity prediction.
The QSAR workflow begins with dataset curation, where compounds with known anticancer activities are collected from databases like ChEMBL [18] [3] or literature sources [21]. For example, in a study on KRAS inhibitors for lung cancer therapy, researchers retrieved 62 inhibitors from the ChEMBL database (CHEMBL4354832) with experimentally measured IC₅₀ values [3]. The biological activities are typically converted to pIC₅₀ values (pIC₅₀ = -log₁₀(IC₅₀ × 10⁻⁹)) to provide a more suitable scale for regression modeling [3].
Following dataset preparation, molecular descriptor calculation is performed using the selected software tools. In a comparative study on biodegradability prediction (with implications for cancer drug metabolism studies), researchers used Mordred to calculate 1,613 two-dimensional descriptors, excluding 3D descriptors to avoid complex and non-reproducible optimizations [20]. The calculated descriptors then undergo preprocessing and feature selection to reduce dimensionality and mitigate multicollinearity issues. Techniques include removing descriptors with missing values, zero variance, or high correlation (Pearson's |r| > 0.95), followed by selection of the most informative features using methods like genetic algorithms [3].
The subsequent model building phase employs various machine learning algorithms. For instance, in a study on flavone anticancer activity, researchers compared random forest (RF), extreme gradient boosting, and artificial neural network (ANN) models, finding that the RF model exhibited superior performance (R² = 0.820 for MCF-7 and 0.835 for HepG2) [17]. Finally, the model validation step assesses predictive performance using internal cross-validation and external test sets, with techniques like leave-one-out cross-validation and validation using holdout test compounds [17] [15].
Case Studies in Cancer Drug Discovery
The practical application of descriptor calculation tools in cancer QSAR studies is illustrated through several recent research examples:
FGFR-1 Inhibitors for Cancer Therapy: Researchers developed a QSAR model for Fibroblast Growth Factor Receptor 1 (FGFR-1) inhibitors using a dataset of 1,779 compounds from ChEMBL. Molecular descriptors were calculated using AlvaDesc software, and feature selection techniques refined the descriptor set. The resulting model demonstrated strong predictive performance (R² = 0.7869 for training, 0.7413 for test set) and was validated through in vitro assays on A549 (lung cancer) and MCF-7 (breast cancer) cell lines [18].
KRAS Inhibitors for Lung Cancer: In this study, molecular descriptors for 62 KRAS inhibitors were computed using Chemopy. After descriptor normalization and dimensionality reduction, five machine learning algorithms were applied, with partial least squares (PLS) exhibiting the best predictive performance (R² = 0.851). Virtual screening of 56 de novo designed compounds within the model's applicability domain identified a promising hit (compound C9) with predicted pIC₅₀ of 8.11 [3].
Anti-Colon Cancer Chalcone Analogs: QSAR modeling was applied to predict the anti-colon cancer activity (against HT-29) of 193 chalcone derivatives using the Monte Carlo method based on optimal descriptors combining SMILES notation and hydrogen-suppressed molecular graphs. The best-performing model achieved R²_validation = 0.90, successfully predicting pIC₅₀ values of new chalcone derivatives from the ChEMBL database [21].
1,3-Diphenyl-1H-pyrazoles against Breast Cancer: Researchers investigated anti-proliferative properties of pyrazole derivatives against breast cancer cells (MCF-7) using QSAR modeling. PaDEL-Descriptor was used to calculate molecular descriptors, and a validated penta-parametric QSAR model (R²train = 0.896; Q²CV = 0.816; R²test = 0.703) highlighted the predominant influence of molecular size, shape, and symmetry on cytotoxic effects [22].
Successful implementation of cancer QSAR studies requires a comprehensive suite of computational tools and resources that extend beyond descriptor calculation software. The following table summarizes essential components of the modern computational chemist's toolkit for anticancer QSAR modeling.
Table 3: Essential Research Reagents and Computational Resources for Cancer QSAR
| Resource Category | Specific Tools | Application in Cancer QSAR | Key Features |
|---|---|---|---|
| Descriptor Calculators | PaDEL-Descriptor, Mordred, Dragon, RDKit, ChemoPy [16] [15] [20] | Convert chemical structures to numerical descriptors | Generate 1D, 2D, and 3D molecular descriptors and fingerprints |
| Machine Learning Libraries | scikit-learn [20], XGBoost [3], iml (for SHAP) [3] | Build predictive QSAR models | Implementation of RF, SVM, PLS, ANN, and other algorithms |
| Cheminformatics Libraries | RDKit [16] [20], CDK (via PaDEL) [19] | Molecular standardization, manipulation, and analysis | Handle SMILES parsing, structure optimization, and molecular operations |
| Data Sources | ChEMBL [18] [3], PubChem [20] [22] | Source bioactive compounds against cancer targets | Curated bioactivity data for diverse molecular targets |
| Model Interpretation Tools | SHAP [17] [3], permutation importance [3] | Identify key descriptors influencing anticancer activity | Explain machine learning model predictions and descriptor contributions |
| Visualization Software | DataWarrior [3], BIOVIA Draw [21] | Structure depiction and chemical space visualization | Draw chemical structures and analyze chemical libraries |
Advanced Applications and Emerging Methodologies
Integration with Structure-Based Methods
Modern cancer drug discovery increasingly integrates QSAR modeling with structure-based approaches such as molecular docking and molecular dynamics simulations. This integrated strategy provides a more comprehensive understanding of compound activity by combining ligand-based and structure-based perspectives. For example, in the study of FGFR-1 inhibitors, researchers complemented QSAR modeling with molecular docking and molecular dynamics simulations to validate stable interactions between the compounds and FGFR-1 [18]. Similarly, in the investigation of anti-proliferative pyrazole derivatives, QSAR modeling was combined with molecular docking, molecular mechanics generalized born surface area (MM/GBSA) calculations, and molecular dynamics simulations to study binding interactions and thermodynamic stability [22].
This multi-faceted approach enhances the reliability of predictions and provides deeper insights into the structural basis of anticancer activity. The synergy between descriptor-based QSAR models and structural biology techniques creates a powerful framework for rational anticancer drug design, enabling researchers to optimize both the physicochemical properties and target binding characteristics of lead compounds.
Graph Convolutional Networks as an Alternative Approach
While traditional QSAR models rely on pre-calculated molecular descriptors, graph convolutional networks (GCNs) represent an emerging alternative that directly processes molecular graphs without requiring explicit descriptor calculation [20]. In this approach, atoms and bonds are naturally mapped to nodes and edges in a graph, with GCNs automatically learning relevant features during model training.
A comparative study on biodegradability prediction (relevant to cancer drug metabolism) demonstrated that GCN models are more straightforward to implement and more stable than conventional QSAR approaches, with specificity and sensitivity values nearly identical without requiring specific descriptor selection [20]. Although GCNs have not yet seen widespread adoption in cancer QSAR studies, they represent a promising direction that may complement or potentially replace conventional descriptor-based approaches in the future, particularly as deep learning methodologies continue to advance.
Molecular descriptor calculation tools including PaDEL-Descriptor, Dragon, RDKit, and Mordred play an indispensable role in modern cancer QSAR research, enabling the transformation of chemical structures into numerical descriptors that can be correlated with anticancer activity. Each software offers distinct advantages: PaDEL-Descriptor provides a comprehensive descriptor set with multiple interfaces; Dragon offers extensive descriptor coverage; RDKit delivers broad cheminformatics functionality; and Mordred combines high calculation speed with convenient installation and lax licensing constraints.
The successful application of these tools in cancer QSAR studies—from flavones and chalcones to FGFR-1 and KRAS inhibitors—demonstrates their critical importance in accelerating anticancer drug discovery. As the field evolves, the integration of descriptor-based QSAR modeling with structure-based methods and emerging deep learning approaches like graph convolutional networks will likely enhance predictive capabilities further. The continued development and refinement of molecular descriptor calculation software will remain fundamental to advancing computational drug discovery against challenging cancer targets, ultimately contributing to the development of more effective and selective anticancer therapies.
The journey from Hammett constants to modern 3D descriptors represents a revolutionary pathway in computational chemistry and drug design, particularly within cancer Quantitative Structure-Activity Relationship (QSAR) studies. This evolution mirrors the pharmaceutical industry's transition from qualitative observations to quantitative, prediction-driven science. QSAR modeling formally began in the early 1960s with the works of Hansch and Fujita and Free and Wilson, who extended Hammett's foundational principles [23]. These methodological advances established the core paradigm of QSAR: using mathematical models to correlate chemical structures with biological activities to predict the behavior of new compounds [23].
In the specific context of oncology, this evolution has proven particularly valuable. The development of cancer therapeutics faces significant challenges, including limitations of traditional drug development models, inherent flaws of single-target drugs, and the overwhelming complexity of tumor mechanisms [24]. Modern cancer drug development now integrates multiple technological pillars, with QSAR approaches serving as a crucial component alongside omics technologies, bioinformatics, network pharmacology, and molecular dynamics simulation [24]. This multidisciplinary approach has significantly shortened drug development cycles and promoted more precise, personalized cancer therapies [24].
The Hammett Era: Foundation in Electronic Effects
The Original Hammett Equation
The Hammett equation, developed and published by Louis Plack Hammett in 1937, represents the pioneering linear free-energy relationship in physical organic chemistry [25]. It quantitatively relates reaction rates and equilibrium constants for reactions involving benzoic acid derivatives with meta- and para-substituents through a simple yet powerful mathematical formulation:
In this equation, K is the equilibrium constant for a substituted compound, K₀ is the reference constant for unsubstituted benzoic acid, σ is the substituent constant specific to each functional group, and ρ is the reaction constant dependent on the reaction type and conditions [25]. The same formalism applies to reaction rates, where log(k/k₀) = σρ [25].
The initial determination of substituent constants was based on the ionization of benzoic acid derivatives in water at 25°C, with the reaction constant ρ arbitrarily set to 1.0 for this reference reaction [25]. This provided a standardized framework for quantifying electronic effects across diverse chemical structures.
Key Substituent Constants and Electronic Effects
Hammett constants effectively capture two dominant electronic influences: the inductive effect, transmitted through polarization of bonding electrons, and the resonance effect, involving electron delocalization through π-systems [25]. The resulting σ values reveal fundamental electronic properties of substituents, with positive values indicating electron-withdrawing characteristics and negative values signifying electron-donating properties [25].
Table 1: Selected Hammett Substituent Constants
| Substituent | σ_meta | σ_para |
|---|---|---|
| Nitro | +0.710 | +0.778 |
| Cyano | +0.560 | +0.660 |
| Chloro | +0.373 | +0.227 |
| Hydrogen | 0.000 | 0.000 |
| Methyl | -0.069 | -0.170 |
| Methoxy | +0.115 | -0.268 |
| Hydroxy | +0.120 | -0.370 |
| Amino | -0.161 | -0.660 |
The discrepancy between meta and para values for certain substituents, particularly evident with methoxy and hydroxy groups, highlights the differential weighting of resonance effects at these positions [25]. Para substituents can engage in direct resonance interactions with the reaction center, while meta substituents exert primarily inductive effects due to their positional relationship in the aromatic ring.
Extended Hammett Parameters and Reaction Sensitivity
For specific chemical environments where standard σ values proved insufficient, specialized parameters were developed. The σp- constants were defined using ionization of para-substituted phenols to better capture resonance interactions with electron-withdrawing groups [25]. Conversely, σp+ constants were developed based on SN1 reactions of cumyl chlorides to better describe carbocation stabilization by electron-donating groups [25].
The reaction constant ρ provides crucial information about a reaction's sensitivity to substituent effects [25]:
- ρ > 1: The reaction is more sensitive to substituents than benzoic acid ionization; negative charge builds up (or positive charge is lost)
- 0 < ρ < 1: The reaction is less sensitive to substituents but still builds negative charge
- ρ = 0: No sensitivity to substituents; no charge buildup or loss
- ρ < 0: The reaction builds positive charge (or loses negative charge)
This quantitative framework enabled mechanistic insights that transformed physical organic chemistry and laid the groundwork for modern QSAR approaches.
Evolution to 2D QSAR: Incorporating Diverse Molecular Descriptors
The Hansch Equation and Beyond
The extension of Hammett's principles to biological systems began with the work of Hansch and Fujita, who incorporated lipophilicity parameters alongside electronic effects [23]. The classic Hansch equation takes the form:
where C represents the molar concentration of compound producing a standard biological effect, σ is the Hammett electronic constant, and logP is the logarithm of the octanol-water partition coefficient, encoding lipophilicity [23]. This approach recognized that biological activity depends not only on electronic effects but also on transport properties determining a compound's ability to reach its site of action.
Modern 2D Descriptors in Cancer Research
Contemporary 2D QSAR studies employ sophisticated mathematical descriptors derived from molecular graph theory. These topological indices (TIs) capture molecular connectivity, shape, and branching patterns, providing quantitative parameters that can be correlated with biological activity [26]. In cancer therapeutic development, such approaches have been successfully applied to analyze blood cancer drugs, with strong correlations observed between topological indices and physicochemical properties critical for drug efficacy [26].
Table 2: Categories of Modern Molecular Descriptors in QSAR
| Descriptor Category | Representative Examples | Structural Information Encoded |
|---|---|---|
| Topological Descriptors | Wiener index, Zagreb index, Randic connectivity index | Molecular branching, connectivity, size |
| Geometric Descriptors | Principal moments of inertia, molecular volume | Molecular shape and dimensions |
| Electronic Descriptors | HOMO/LUMO energies, partial atomic charges, molecular dipole moment | Electronic distribution, reactivity |
| Quantum Chemical Descriptors | MEP (Molecular Electrostatic Potential), Fukui indices | Reactivity sites, charge distribution |
| Hybrid Descriptors | MECN (Min exchange energy for a C-N bond) | Combined electronic and structural features |
A recent QSAR study of dihydropteridone derivatives as PLK1 inhibitors for glioblastoma treatment identified MECN (Min exchange energy for a C-N bond) as the most significant molecular descriptor in a 2D model containing six descriptors [27]. This highlights how modern descriptors integrate specific quantum chemical properties with traditional structural parameters to enhance predictive capability.
Experimental Protocol for 2D QSAR Modeling
The standard methodology for developing 2D QSAR models involves several critical steps [27]:
Compound Selection and Activity Data Curation: A diverse set of compounds with reliable biological activity data (e.g., IC₅₀ values) is assembled. For the dihydropteridone derivatives study, 34 compounds with anti-glioma activity were obtained from published research [27].
Molecular Structure Optimization: Chemical structures are sketched using software such as ChemDraw and optimized through molecular mechanics (MM+ force field) followed by semi-empirical methods (AM1 or PM3) until the root mean square gradient reaches 0.01 [27].
Descriptor Calculation: Comprehensive molecular descriptors encompassing quantum chemical, structural, topological, geometric, and electrostatic properties are computed using programs like CODESSA [27].
Data Set Partitioning: Compounds are randomly divided into training and test sets (typically 3:1 or 4:1 ratio) to enable model development and validation [27].
Model Construction: Statistical methods such as the Heuristic Method (HM) or machine learning algorithms like Gene Expression Programming (GEP) are employed to build correlation models between descriptors and biological activity [27].
Model Validation: The predictive power of developed models is assessed using the test set data, with metrics including R², R²_cv (cross-validated R²), and residual sum of squares [27].
2D QSAR Modeling Workflow
Rise of 3D-QSAR: Incorporating Spatial Molecular Information
The Paradigm Shift to Three Dimensions
While 2D QSAR approaches consider molecular structure as connectivity graphs, 3D-QSAR methodologies incorporate the essential three-dimensional nature of molecular interactions, recognizing that biological recognition depends strongly on spatial characteristics [28]. This transition represents a fundamental advancement in molecular descriptor evolution, as 3D-QSAR explicitly accounts for molecular shape, steric bulk, and electronic distribution in three-dimensional space.
The theoretical foundation of 3D-QSAR rests on the understanding that drug-receptor interactions occur through specific three-dimensional complementarity, following theories such as "lock-and-key," "induced fit," and "conformational selection" [23]. The portion of the interface area belonging to the drug that contains the essential geometric arrangement of atoms or functional groups necessary for binding is termed the pharmacophore [23].
3D-QSAR Methodologies and Field Descriptors
Advanced 3D-QSAR approaches, particularly CoMSIA (Comparative Molecular Similarity Indices Analysis), examine the impact of drug structure on activity by calculating molecular interaction fields surrounding aligned molecules [27]. These fields include:
- Steric fields representing van der Waals interactions
- Electrostatic fields capturing Coulombic interactions
- Hydrophobic fields describing lipophilic preferences
- Hydrogen bond donor and acceptor fields quantifying specific polar interactions
In the dihydropteridone derivatives study for glioblastoma treatment, the 3D-QSAR model demonstrated exceptional performance with Q² = 0.628 and R² = 0.928, significantly outperforming 2D approaches [27]. This superior performance highlights the value of incorporating spatial and field information into QSAR modeling.
Experimental Protocol for 3D-QSAR Modeling
The standard workflow for 3D-QSAR analysis involves several key stages [27] [28]:
Molecular Structure Preparation and Optimization: 3D molecular structures are generated from 2D representations and energetically minimized using molecular mechanics or quantum chemical methods.
Molecular Alignment: A critical step where molecules are superimposed according to a common pharmacophore or structural framework. This alignment assumes similar binding modes to the biological target.
Interaction Field Calculation: Molecular interaction fields are computed using probe atoms at regularly spaced grid points surrounding the aligned molecules.
Statistical Analysis: Partial Least Squares (PLS) regression is typically employed to correlate interaction field values with biological activity, identifying regions where specific molecular properties enhance or diminish activity.
Contour Map Generation: The results are visualized as 3D contour maps indicating favorable and unfavorable regions for different molecular properties relative to biological activity.
3D QSAR Modeling Workflow
Modern Applications in Cancer Therapeutics
QSAR in Anti-Cancer Drug Discovery
QSAR methodologies have become indispensable tools in modern anti-cancer drug discovery, particularly for optimizing lead compounds and predicting activity profiles. Recent applications span diverse cancer types, including breast cancer, colorectal cancer, glioblastoma, and blood cancers [27] [26] [23].
In breast cancer research, QSAR has been extensively applied to discover and develop new therapeutic agents [23]. The methodology has proven valuable for predicting biological activity of compounds targeting specific breast cancer subtypes and mechanisms, facilitating more efficient drug design and prioritization of synthesis candidates.
For colorectal cancer, innovative 3D-QSAR approaches utilizing 3D electron cloud descriptors have demonstrated remarkable predictive capabilities [29]. By computing electron densities via density functional theory (DFT) and converting them to 3D point clouds encoded into multi-scale descriptors, researchers achieved Area Under the Curve (AUC) values of 0.96 with Light Gradient Boosting Machine (LightGBM) algorithms, significantly outperforming conventional ECFP4 fingerprints [29].
Case Study: Dihydropteridone Derivatives for Glioblastoma
A comprehensive QSAR study on dihydropteridone derivatives as PLK1 inhibitors for glioblastoma treatment exemplifies the integrated application of 2D and 3D QSAR methodologies [27]. This research demonstrated:
- The Heuristic Method linear model achieved R² = 0.6682 with R²_cv = 0.5669
- The Gene Expression Programming nonlinear model showed improved performance with R² = 0.79 for training and 0.76 for validation
- The 3D-QSAR CoMSIA model outperformed both with Q² = 0.628, R² = 0.928, and standard error of estimate = 0.160
By combining the most significant 2D descriptor (MECN) with 3D hydrophobic field information, researchers designed novel compound 21E.153, which exhibited outstanding antitumor properties and docking capabilities [27]. This successful integration of descriptor types highlights the power of hybrid approaches in modern cancer drug design.
Table 3: Essential Resources for Modern QSAR Studies
| Resource Category | Specific Tools/Software | Application in QSAR |
|---|---|---|
| Structure Drawing & Visualization | ChemDraw, PyMOL | Molecular structure representation and visualization |
| Molecular Modeling & Optimization | HyperChem, Gaussian, Open Babel | 3D structure generation and quantum chemical calculations |
| Descriptor Calculation | CODESSA, DRAGON, PaDEL | Computation of molecular descriptors |
| QSAR Modeling Platforms | 3D-QSAR.com, Orange, KNIME | Integrated platforms for QSAR model development |
| Statistical Analysis | R, Python (scikit-learn) | Data analysis and machine learning implementation |
| Validation Tools | Various internal and external validation metrics | Model quality assessment |
Advanced Descriptor Technologies and Future Perspectives
Cutting-Edge Descriptor Development
The evolution of molecular descriptors continues with emerging technologies that capture increasingly sophisticated aspects of molecular structure and properties. 3D electron cloud descriptors represent one such advancement, addressing limitations of conventional QSAR descriptors in capturing molecular electronic and spatial complexity [29]. These descriptors are computed via density functional theory (DFT), converted to 3D point clouds, and encoded into multi-scale descriptors including radial distribution functions, spherical harmonic expansions, point feature histograms, and persistent homology [29].
Control experiments confirming that predictive gains stem from electronic structure information rather than high-dimensional geometry alone highlight the increasing sophistication of modern descriptor technologies [29]. This approach demonstrates how quantum mechanical properties can be systematically integrated into QSAR modeling, opening new avenues for molecular representation in drug discovery.
Artificial Intelligence and Machine Learning Integration
Contemporary QSAR research increasingly leverages artificial intelligence and machine learning algorithms to handle the complexity of modern descriptor sets [30] [31] [24]. Counter-Propagation Artificial Neural Networks (CPANN) and other neural network architectures have shown particular promise for classifying molecules based on endpoint classes such as enzyme inhibition and hepatotoxicity [30].
Modified CPANN algorithms that dynamically adjust molecular descriptor importance during model training allow different descriptor importance values for structurally different molecules, increasing adaptability to diverse compound sets [30]. This approach improves molecule classification, reduces neurons excited by molecules from different endpoint classes, and increases the number of acceptable models [30].
Future Directions in Descriptor Evolution
The future of molecular descriptors in cancer QSAR studies points toward several exciting developments:
Multi-Omics Integration: Combining QSAR with genomics, proteomics, and metabolomics data to build comprehensive models that account for both compound properties and biological system complexity [24].
AI-Driven High-Throughput Screening: Leveraging artificial intelligence to optimize multi-target drug design and enhance translational research from preclinical to clinical stages [24].
Standardized Platform Development: Creating unified platforms for data integration and analysis to address challenges such as data variability and off-target effects [24].
Enhanced Interpretability: Developing methods to improve model interpretability while maintaining predictive power, balancing complexity with mechanistic understanding [30].
As these technologies mature, the vision of personalized cancer medicine—tailoring treatments based on individual patient characteristics and tumor profiles—will gradually approach reality, significantly enhancing treatment efficacy and patient quality of life [24].
In modern cancer drug discovery, the concept of "chemical space" provides a crucial framework for understanding the relationship between molecular structure and biological activity. This conceptual space encompasses all possible organic molecules, with each point representing a unique compound defined by a set of molecular descriptors—numerical representations of structural, topological, and physicochemical properties [32]. Quantitative Structure-Activity Relationship (QSAR) modeling leverages these descriptors to建立 mathematical models that predict the biological activity of compounds against cancer targets, transforming drug discovery from trial-and-error to a rational, predictive science [32] [33].
The dimensionality challenge presents a significant obstacle in QSAR modeling. Researchers can compute hundreds to thousands of molecular descriptors for each compound using modern cheminformatics software [32] [34]. This high-dimensional data space suffers from the "curse of dimensionality," where many descriptors are redundant, noisy, or irrelevant to the biological endpoint [32]. Descriptor optimization thus becomes essential for building robust, interpretable, and predictive QSAR models, particularly in oncology applications where dataset sizes are often limited [35]. Through strategic dimensionality reduction, researchers can navigate the chemical space more effectively, identifying the most informative structural domains for targeting cancer pathways.
Principal Component Analysis (PCA) has emerged as a cornerstone technique for addressing this dimensionality challenge in cancer QSAR studies [32] [34]. This multivariate statistical method creates a new set of variables (principal components) that are linear combinations of the original descriptors, transformed to capture maximum variance with minimal components [36]. The application of PCA enables researchers to visualize complex chemical spaces in lower dimensions, identify structural patterns among bioactive compounds, and select optimal descriptors for QSAR modeling—all critical capabilities for accelerating the discovery of novel cancer therapeutics [3] [37].
Theoretical Foundations of PCA in Descriptor Optimization
Mathematical Principles of PCA
Principal Component Analysis operates on the fundamental principle of eigenvalue decomposition of the descriptor covariance matrix. Given a standardized data matrix X (m compounds × n descriptors), PCA computes a new set of orthogonal variables called principal components (PCs). These PCs are ordered such that the first component (PC1) captures the largest possible variance in the data, the second component (PC2) captures the next largest variance while being orthogonal to the first, and so on [32]. The mathematical transformation can be represented as:
Y = XW
where Y is the matrix of principal component scores, and W is the matrix of eigenvectors (loadings) of the covariance matrix of X. The eigenvalues (λ₁, λ₂, ..., λₙ) corresponding to these eigenvectors indicate the amount of variance explained by each successive PC [32]. This orthogonal transformation allows researchers to project high-dimensional chemical descriptor data into a lower-dimensional space while preserving the essential structural relationships between compounds.
PCA Workflow for Descriptor Analysis
The application of PCA to molecular descriptors follows a systematic workflow designed to maximize chemical insight while minimizing information loss. Descriptor standardization represents the critical first step, ensuring that each variable contributes equally to the analysis regardless of its original scale [3]. The subsequent covariance matrix computation captures the relationships between all descriptor pairs, forming the foundation for identifying correlated descriptor clusters that may represent specific chemical properties [32].
The dimensionality reduction phase involves strategic decisions about how many principal components to retain. Common approaches include the Kaiser criterion (retaining PCs with eigenvalues >1), scree plot analysis (identifying the "elbow" point where eigenvalues level off), and the variance explained threshold (retaining enough PCs to capture a predetermined percentage of total variance, typically 70-90%) [34]. The final interpretation phase examines the component loadings to understand which original descriptors contribute most significantly to each PC, enabling chemical intuition about the underlying structural properties that define the chemical space [3] [37].
Computational Methodologies and Protocols
Protocol 1: PCA-Driven Descriptor Optimization for Cancer QSAR
The following step-by-step protocol details the application of PCA for descriptor optimization in cancer-focused QSAR studies, incorporating best practices from recent literature [3] [34] [37]:
Dataset Curation and Standardization
- Collect a minimum of 50-100 compounds with reliable bioactivity data (e.g., IC₅₀, pIC₅₀) against a cancer target [34]. Ensure structural diversity to adequately represent the relevant chemical space.
- Calculate molecular descriptors using established software (DRAGON, PaDEL, RDKit, or ChemoPy) [32] [3]. Include a balanced mix of 1D (constitutional), 2D (topological), and 3D (geometric, electronic) descriptors.
- Standardize descriptors by removing those with zero variance, then apply Z-score normalization: ( x' = \frac{x - \mu}{\sigma} ) where μ is the mean and σ is the standard deviation [3].
Descriptor Pre-filtering and Correlation Analysis
- Remove highly correlated descriptors (Pearson's |r| > 0.95) to reduce redundancy and computational burden [3]. This pre-filtering enhances PCA stability without significant information loss.
- Apply additional feature selection methods if needed, such as Random Forest feature importance or mutual information ranking, to identify descriptors most relevant to the cancer bioactivity endpoint [32].
PCA Execution and Component Selection
- Perform PCA on the pre-processed descriptor matrix using established scientific computing environments (Python scikit-learn, R prcomp, or MATLAB pca functions).
- Determine the optimal number of components using parallel analysis or the Kaiser criterion (eigenvalue >1), typically retaining 5-10 PCs for most cancer QSAR datasets [34].
- Ensure the selected PCs collectively explain >80% of cumulative variance for robust chemical space representation [37].
Chemical Space Visualization and Interpretation
- Generate 2D and 3D score plots (PC1 vs PC2, PC1 vs PC3) to visualize chemical space distribution. Color compounds by bioactivity level to identify structure-activity trends [34].
- Analyze loading plots to interpret the chemical significance of each PC. For example, PC1 often represents molecular size/bulk, while PC2 may encode polarity/hydrophobicity patterns [37].
- Identify potential activity cliffs and outliers by examining compounds with similar structures but divergent bioactivities in the PCA projection [34].
Descriptor Subset Selection for QSAR Modeling
- From the loading analysis, select 5-15 original descriptors that show the highest contributions to the most significant PCs and strong correlation with bioactivity.
- Validate the selected descriptor subset by comparing QSAR model performance (R², Q², RMSE) against models using all descriptors or randomly selected subsets [3] [37].
Protocol 2: PCA-Enhanced QSAR Model Development for KRAS Inhibitors
This specialized protocol exemplifies the application of PCA in a specific cancer drug discovery context—developing QSAR models for KRAS inhibitors in lung cancer therapy [3]:
Data Source and Preparation
- Retrieve 62 KRAS inhibitors with experimental pIC₅₀ values from ChEMBL (CHEMBL4354832) [3].
- Compute molecular descriptors using ChemoPy, generating topological, constitutional, geometrical, and electronic descriptors.
- Apply pIC₅₀ transformation: ( pIC{50} = -log{10}(IC_{50} \times 10^{-9}) ) to normalize the bioactivity scale for modeling [3].
Descriptor Pre-processing with Variance Filtering
- Standardize all descriptors (mean-centering and unit variance).
- Remove descriptors with near-zero variance and high inter-correlation (|r| > 0.95).
- Select the top 50 descriptors with highest variance for subsequent PCA [3].
PCA for Descriptor Space Compression
- Perform PCA to reduce the 50 descriptors to 8-10 principal components capturing >85% cumulative variance.
- Use the PCA-transformed data as input for multiple QSAR algorithms: Partial Least Squares (PLS), Random Forest (RF), and Genetic Algorithm-optimized Multiple Linear Regression (GA-MLR) [3].
Model Performance Evaluation
- Validate models using 5-fold cross-validation and external test set validation (70/30 split).
- Evaluate using R², RMSE, and MAE metrics. The PCA-enhanced PLS model achieved R² = 0.851 and RMSE = 0.292 in the KRAS case study [3].
Table 1: Key Research Reagent Solutions for PCA in Cancer QSAR
| Resource Category | Specific Tools/Software | Primary Function in PCA Workflow | Application Example in Cancer Research |
|---|---|---|---|
| Descriptor Calculation | DRAGON, PaDEL, RDKit, ChemoPy [32] [3] | Computes 1D-3D molecular descriptors from chemical structures | KRAS inhibitor profiling using topological & electronic descriptors [3] |
| Statistical Analysis | Python scikit-learn, R prcomp, MATLAB PCA [3] [34] | Performs PCA, eigenvalue decomposition, and variance analysis | hERG cardiotoxicity model descriptor optimization [34] |
| Chemical Databases | ChEMBL, PubChem, EFSA Pesticides DB [36] [35] [3] | Provides bioactivity data and compound structures for analysis | Carcinogenicity prediction of pesticide metabolites [36] |
| Visualization Platforms | KNIME, DataWarrior, Matplotlib [32] [3] | Generates 2D/3D score plots and loading visualizations | Chemical space mapping of hERG blockers [34] |
Case Studies in Cancer Research
PCA in KRAS Inhibitor Development for Lung Cancer
In a recent landmark study, researchers applied PCA-based descriptor optimization to develop QSAR models for KRAS inhibitors, a challenging target in non-small cell lung cancer (NSCLC) [3]. The research team computed 257 molecular descriptors for 62 KRAS inhibitors from ChEMBL, then applied correlation filtering and PCA to identify the most informative chemical features. The PCA revealed that eight principal components explained 88.7% of the total descriptor variance, effectively compressing the chemical space while retaining critical structure-activity information [3].
The PCA-guided descriptor selection enabled the development of a highly predictive Partial Least Squares (PLS) model (R² = 0.851, RMSE = 0.292) that significantly outperformed models built without PCA optimization [3]. The loading analysis identified that topological charge indices, geometrical descriptors, and electronic properties contributed most significantly to the principal components correlated with KRAS inhibition. This chemical insight directly informed the de novo design of novel KRAS inhibitors, with compound C9 emerging as a promising candidate (predicted pIC₅₀ = 8.11) for further experimental validation [3].
Descriptor Optimization for hERG Cardiotoxicity Prediction in Anticancer Agents
Cardiotoxicity represents a major challenge in cancer drug development, with hERG channel blockade being a primary safety concern. Researchers recently addressed this by developing a convolutional neural network (CNN)-based QSAR model for hERG inhibition prediction, utilizing PCA for critical descriptor optimization [34]. The study computed 147 pharmacophore fingerprints and 24 Burden descriptors for 71 compounds, then applied PCA to reduce dimensionality to eight principal components capturing the essential chemical space features relevant to hERG binding [34].
The PCA transformation not only improved model performance (training Q² = 0.99, test R² = 0.70) but also enabled meaningful chemical interpretation through loading analysis [34]. The researchers identified that specific structural features—including furan rings, sulfonamide groups, p-chlorophenyl, and p-fluorophenyl moieties—contributed strongly to PCs associated with hERG risk. Conversely, the addition of acidic oxygen/aliphatic oxygen (hydroxyl groups) reduced hERG inhibition, providing medicinal chemists with clear design strategies to improve the cardiac safety profiles of anticancer agents [34].
Table 2: PCA Applications in Cancer QSAR Case Studies
| Cancer Research Area | Dataset Size | Original Descriptors | PCA Output | Key Optimized Descriptors | Model Performance |
|---|---|---|---|---|---|
| KRAS Inhibitors (Lung Cancer) [3] | 62 compounds | 257 descriptors | 8 principal components (88.7% variance) | Topological charge, geometrical, electronic descriptors | PLS model: R²=0.851, RMSE=0.292 |
| hERG Cardiotoxicity (Drug Safety) [34] | 71 compounds | 171 descriptors | 8 principal components | Pharmacophore fingerprints, Burden descriptors | CNN model: Q²=0.99, R²=0.70 |
| Acylshikonin Derivatives (Anticancer Agents) [37] | 24 compounds | Not specified | Not specified (PCR approach) | Electronic, hydrophobic descriptors | PCR model: R²=0.912, RMSE=0.119 |
| Pesticide Carcinogenicity (Risk Assessment) [36] | 50 compounds | Multiple QSAR models | PCA for model concordance | Structural alerts, genotoxicity descriptors | Battery calls from Danish QSAR |
Advanced Integration with Machine Learning Approaches
The integration of PCA with modern machine learning (ML) algorithms represents the cutting edge of descriptor optimization in cancer QSAR studies [32]. While PCA effectively handles linear relationships among descriptors, its combination with nonlinear ML methods enables more comprehensive chemical space exploration. Researchers have successfully coupled PCA with Random Forest algorithms for feature importance ranking, with Support Vector Machines (SVM) for optimal hyperplane determination in reduced descriptor space, and with neural networks for deep learning-based QSAR modeling [32] [34].
Recent advances include the development of quantum machine learning approaches for QSAR, where PCA plays a crucial role in preprocessing molecular descriptors for quantum classifiers [38]. Studies have demonstrated that quantum classifiers outperform classical models when using PCA-reduced descriptor sets, particularly with small training samples and limited feature numbers [38]. This emerging paradigm shows significant promise for cancer drug discovery, where experimental data is often scarce and chemical spaces are sparsely populated.
The workflow below illustrates how PCA integrates with advanced ML approaches in modern cancer QSAR pipelines:
Challenges and Future Perspectives
Despite its well-established utility, PCA application in cancer QSAR faces several significant challenges. The interpretation complexity of principal components increases with dataset complexity, as PCs often represent abstract combinations of chemical features without clear structural correlates [32]. Nonlinear relationships in chemical space may not be adequately captured by linear PCA, potentially overlooking important structure-activity patterns [34]. Additionally, the variable scaling sensitivity of PCA can disproportionately emphasize high-variance descriptors that may not be biologically relevant [3].
Future methodological developments are likely to focus on nonlinear dimensionality reduction techniques that complement traditional PCA. Approaches such as t-Distributed Stochastic Neighbor Embedding (t-SNE) and uniform manifold approximation and projection (UMAP) have shown promise in capturing complex chemical relationships that linear PCA might miss [34]. The integration of deep learning-based autoencoders represents another frontier, enabling nonlinear feature extraction while maintaining the variance maximization principle of PCA [32].
The expanding role of PCA in multi-target cancer therapeutics is particularly noteworthy. As cancer drug discovery increasingly focuses on polypharmacology and targeting complex signaling networks, PCA will play a crucial role in identifying descriptor combinations that optimize activity across multiple cancer targets while minimizing off-target effects [35] [33]. This approach aligns with the trend toward precision oncology, where chemical space navigation must account for patient-specific genetic profiles and tumor microenvironment characteristics [33].
In conclusion, Principal Component Analysis remains an indispensable tool for descriptor optimization within the chemical space paradigm of cancer QSAR research. Its ability to distill high-dimensional molecular descriptor data into chemically intelligible and computationally efficient representations continues to accelerate the discovery of novel anticancer agents. As PCA integrates with emerging machine learning and quantum computing approaches, its role in rational cancer drug design will continue to evolve, ultimately enhancing our ability to navigate chemical space for improved therapeutic outcomes.
The application of quantum chemical descriptors in Quantitative Structure-Activity Relationship (QSAR) modeling represents a transformative approach in modern anti-cancer drug design. These descriptors, derived from the electronic and geometric structure of molecules, provide profound insights into the physicochemical properties and chemical reactivity of potential drug candidates before synthesis. By establishing a mathematical relationship between molecular structure and biological activity, QSAR models empowered by quantum chemical descriptors enable the rapid virtual screening of novel chemical entities, significantly accelerating the development of new cancer therapeutics [39]. The core premise is that the molecular structure inherently contains its physical, chemical, and biological properties, and quantum mechanics provides the most fundamental framework to describe and quantify these features [39].
Among the plethora of available descriptors, HOMO-LUMO energies and polarizability have emerged as particularly influential in predicting the biological activity and pharmacokinetic behavior of anti-cancer agents. HOMO (Highest Occupied Molecular Orbital) and LUMO (Lowest Unoccupied Molecular Orbital) energies define crucial aspects of molecular reactivity, while polarizability provides insights into intermolecular interactions and solubility characteristics—factors paramount for drug efficacy and delivery [40]. Within the broader context of molecular descriptor research for cancer QSAR studies, these quantum parameters offer an atomic-level resolution that traditional descriptors cannot provide, enabling researchers to decipher the intricate mechanisms of drug-receptor interactions and optimize compounds for enhanced anti-cancer activity and reduced side effects [41].
Theoretical Foundations of Key Descriptors
HOMO-LUMO Energetics and Reactivity Descriptors
The frontier molecular orbitals—HOMO and LUMO—serve as pivotal descriptors in computational medicinal chemistry because they define a molecule's susceptibility to nucleophilic and electrophilic attacks, respectively. The energy gap between these orbitals (( \Delta E = E{\text{LUMO}} - E{\text{HOMO}} )) fundamentally determines chemical stability, reactivity, and biological interaction potential [42]. A smaller HOMO-LUMO gap generally indicates higher chemical reactivity and greater propensity for charge transfer interactions with biological targets, while a larger gap suggests higher stability [43].
From these foundational energies, several key reactivity descriptors can be derived using Conceptual Density Functional Theory (CDFT):
- Ionization Potential (IP): ( IP = -E_{\text{HOMO}} ) (Based on Koopmans' theorem) [42]
- Electron Affinity (EA): ( EA = -E_{\text{LUMO}} ) (Based on Koopmans' theorem)
- Chemical Hardness (η): ( η = \frac{(IP - EA)}{2} ) - Measures resistance to electron density change [43]
- Chemical Softness (S): ( S = \frac{1}{2η} ) - Reciprocal of hardness, indicating reactivity [43]
- Electronegativity (χ): ( χ = \frac{(IP + EA)}{2} ) - Tendency to attract electrons
- Electrophilicity Index (ω): ( ω = \frac{μ^2}{2η} ) - Quantifies electrophilic power [39]
These parameters collectively provide a comprehensive profile of a molecule's reactive behavior in biological systems, enabling predictions of how potential drug candidates might interact with cancer-related enzymes, receptors, and DNA structures [39].
Polarizability and Dispersion Interactions
Polarizability measures how easily the electron cloud of a molecule can be distorted by an external electric field, such as those present in protein binding pockets or near cellular membranes. This descriptor profoundly influences intermolecular interactions, solubility, and passive membrane permeability—critical factors in drug bioavailability [40]. In cancer drug design, polarizability helps predict a compound's ability to engage in favorable van der Waals interactions with target sites, influencing both binding affinity and specificity [44].
Quantum mechanically, polarizability is calculated from the molecular response to applied electric fields and can be derived analytically from energy derivatives or numerically from finite field methods. The tensor components of polarizability provide insights into anisotropic binding preferences, which can be crucial for understanding differential interactions with various cancer targets [40].
Table 1: Fundamental Quantum Chemical Descriptors and Their Significance in Cancer Drug Design
| Descriptor | Theoretical Definition | Chemical Significance | Relevance to Cancer Drug Design |
|---|---|---|---|
| HOMO Energy | Energy of highest occupied molecular orbital | Electron-donating ability, susceptibility to oxidation | Predicts interaction with electron-deficient receptor sites |
| LUMO Energy | Energy of lowest unoccupied molecular orbital | Electron-accepting ability, susceptibility to reduction | Indicates potential to accept electrons from biological nucleophiles |
| HOMO-LUMO Gap | ΔE = ELUMO - EHOMO | Chemical stability and reactivity | Correlates with biological activity; smaller gaps often enhance interactions |
| Polarizability | Ease of electron cloud distortion | van der Waals interactions, solubility, permeability | Affects binding affinity, membrane penetration, and drug delivery |
| Electrophilicity Index | ω = μ²/2η | Overall electrophilic power | Predicts covalent binding potential with nucleophilic amino acids |
Computational Methodologies
Density Functional Theory (DFT) Calculations
Density Functional Theory (DFT) has emerged as the predominant quantum mechanical method for calculating molecular descriptors in pharmaceutical research due to its optimal balance between computational cost and accuracy [39]. The typical workflow involves:
Molecular Structure Optimization: Initial 3D structures are generated using molecular editing software like ChemBioDraw or GaussView, followed by geometric optimization to locate energy minima on the potential energy surface [43] [42]. This step ensures the molecular configuration represents a stable arrangement before property calculations.
Electronic Property Calculation: Single-point energy calculations are performed on optimized structures to determine electronic properties, including molecular orbital energies, electron densities, and electrostatic potentials [41]. The B3LYP hybrid functional with basis sets such as 6-311++G(d,p) or 6-31G has proven particularly effective for pharmaceutical compounds, providing reliable accuracy for organic molecules containing various heteroatoms common in drug structures [40] [42].
Solvent Effects Modeling: Since biological activity occurs in solvated environments, methods like the Polarizable Continuum Model (PCM) are employed to simulate physiological conditions [40]. Different solvents (water, DMSO, ethanol) mimic varying cellular environments from extracellular fluids to lipid-rich membrane interiors, significantly influencing molecular properties and reactivity [40].
Figure 1: Computational Workflow for Quantum Chemical Descriptor Calculation
Advanced Modeling Techniques
Beyond basic descriptor calculation, several advanced computational approaches enhance the predictive power in cancer drug design:
Time-Dependent DFT (TD-DFT): Extends conventional DFT to excited states, providing insights into photodynamic therapy agents or compounds with photoactive properties [40].
Molecular Dynamics Simulations: Following docking studies, MD simulations (typically 100-200 ns) assess the stability of drug-target complexes using parameters like root-mean-square deviation (RMSD) and root-mean-square fluctuation (RMSF) [43]. This provides dynamic information beyond static docking poses.
Molecular Docking and Binding Affinity Calculations: AutoDock Vina and similar tools predict binding orientations and scores (-kcal/mol) between drug candidates and cancer targets, with values ≤ -10 kcal/mol typically indicating strong binding [43].
Table 2: Experimental Protocols for Key Computational Analyses
| Methodology | Key Software Tools | Critical Parameters | Typical Workflow |
|---|---|---|---|
| DFT Calculations | Gaussian 09, Spartan 14, Materials Studio | B3LYP functional, 6-311++G(d,p) basis set, PCM solvation | Structure creation → Geometry optimization → Frequency calculation → Single-point energy → Descriptor extraction |
| Molecular Docking | AutoDock Vina, PyRx, PyMOL | Grid box size, exhaustiveness, binding affinity (kcal/mol) | Protein preparation → Ligand preparation → Grid box setup → Docking execution → Pose analysis |
| Molecular Dynamics | NAMD, AMBER14 | Simulation time (100-200 ns), temperature (310K), RMSD/RMSF analysis | System solvation → Minimization → Heating → Equilibration → Production run → Trajectory analysis |
| QSAR Modeling | Gretl, Sybyl-X | R², Q², cross-validation, domain applicability | Descriptor calculation → Data set division → Model construction → Validation → Prediction |
Applications in Cancer Drug Design
Case Studies and Experimental Findings
The implementation of HOMO-LUMO and polarizability descriptors has yielded significant advances across multiple cancer drug development paradigms:
Ionic Liquids as Anti-cancer Agents: A simulating study investigated phosphonium and ammonium-based ionic liquids as potential anti-cancer agents. Researchers employed HyperChem 8.0.10 to calculate HOMO-LUMO gaps, ionization potentials, electron affinity, and polarizability alongside QSAR properties like LogP, refractivity, and molecular mass. These descriptors successfully predicted biological activity and metabolic behavior, demonstrating their utility in prioritizing compounds for synthesis and further testing [44].
Triple-Negative Breast Cancer (TNBC) Therapeutics: In addressing the aggressive triple-negative breast cancer subtype, researchers explored Scutellarein derivatives using DFT-calculated frontier molecular orbitals. Compounds DM03 and DM04 exhibited binding energies of -10.7 and -11.0 kcal/mol, respectively, against Human CK2 alpha kinase (PDB ID 7L1X). The HOMO-LUMO analysis provided insights into charge transfer properties, while ADMET profiling confirmed favorable pharmacokinetics, including non-carcinogenicity and minimal aquatic toxicity [43].
Gastric Cancer Therapeutics: For 1,2,3-triazole-pyrimidine derivatives targeting human gastric cancer cells (MGC-803), DFT-calculated molecular descriptors enabled the development of a robust QSAR model with exceptional statistical parameters (R² = 0.950, CV R² = 0.970). The HOMO-LUMO gap and related reactivity indices correlated strongly with observed cytotoxicity (IC₅₀ values), successfully reproducing experimental bioactivities that surpassed standard chemotherapy drug 5-fluorouracil [41].
Solvent Effects on Anti-cancer Drug Properties: A comprehensive DFT investigation examined the influence of polar and non-polar solvents on established anti-cancer drugs 5-fluorouracil (5-FU), nitrosourea (NU), and hydroxyurea (HU). The study revealed that while these drugs maintain structural integrity across different solvent environments, their electronic properties—particularly HOMO-LUMO energies and dipole moments—significantly vary with solvent polarity. These findings have profound implications for drug delivery system design and understanding drug behavior in different cellular compartments [40].
QSAR Model Development and Validation
The integration of quantum chemical descriptors into QSAR models follows a rigorous protocol to ensure predictive reliability:
Descriptor Selection and Calculation: An initial set of quantum chemical descriptors is computed for a training set of compounds with known biological activities (e.g., IC₅₀ values against specific cancer cell lines) [41].
Model Construction: Statistical techniques, particularly Partial Least Squares (PLS) regression, correlate descriptor values with biological activities. Model quality is assessed through cross-validation parameters (q²) and conventional correlation coefficients (r²) [45].
Validation and Application: Validated models predict activities of test set compounds not included in model development. For anti-cancer applications, successful models typically demonstrate high predictive accuracy for external validation sets, enabling virtual screening of novel compounds [41].
The strategic advantage of this approach lies in its ability to guide structural modifications that enhance anti-cancer potency while minimizing resource-intensive synthetic efforts. For instance, 3D-QSAR models based on CoMFA (Comparative Molecular Field Analysis) and CoMSIA (Comparative Molecular Similarity Indices Analysis) can generate contour maps that visually guide molecular optimization [45].
Figure 2: Relationship Between Quantum Descriptors and Anti-cancer Activity
Research Reagent Solutions
Table 3: Essential Computational Tools for Quantum Chemical Analysis in Cancer Drug Design
| Tool Category | Specific Software/Package | Primary Function | Application in Cancer Research |
|---|---|---|---|
| Quantum Chemical Calculation | Gaussian 09 [40], Spartan 14 [41] | Molecular structure optimization, electronic property calculation | Determines HOMO-LUMO energies, polarizability, and other quantum descriptors |
| DFT Analysis | Materials Studio DMol³ [43], Multiwfn [39] | Advanced DFT calculations, wavefunction analysis | Calculates frontier molecular orbitals, molecular electrostatic potentials |
| Molecular Visualization | GaussView [40], ChemBioDraw [43] | Molecular structure input, visualization of results | Prepares molecular inputs, visualizes HOMO-LUMO distributions, molecular surfaces |
| Molecular Docking | AutoDock Vina [43], PyMOL [43] | Protein-ligand docking simulations | Predicts binding affinity and orientation against cancer targets |
| Dynamics & Simulation | NAMD [43], AMBER14 [43] | Molecular dynamics simulations | Assesses stability of drug-target complexes over time |
| QSAR Modeling | Gretl [41], Sybyl-X1.3 [45] | Statistical analysis, QSAR model development | Correlates quantum descriptors with anti-cancer activity |
Quantum chemical descriptors, particularly HOMO-LUMO energies and polarizability, have established themselves as indispensable tools in the landscape of cancer drug design. Their ability to provide fundamental insights into molecular reactivity, stability, and interaction potential at the atomic level has transformed QSAR from a correlative science to a predictive discipline grounded in quantum mechanical principles. As computational power continues to grow and methodological refinements emerge, these descriptors will play an increasingly pivotal role in navigating the complex chemical space of anti-cancer therapeutics, enabling more efficient identification of promising candidates and ultimately accelerating the development of effective treatments for various cancers. The integration of these quantum mechanical parameters with advanced machine learning approaches and high-throughput screening represents the next frontier in computational oncology, promising even greater precision in the rational design of targeted cancer therapies.
QSAR in Action: Methodological Approaches and Cancer-Specific Applications
Quantitative Structure-Activity Relationship (QSAR) modeling represents a cornerstone in modern computational drug discovery, providing a critical framework for predicting compound efficacy and optimizing lead molecules. In cancer research, where identifying targeted therapies with minimal off-target effects is paramount, QSAR workflows offer a systematic approach for elucidating the relationship between molecular structure and anticancer activity. This technical guide delineates a comprehensive QSAR protocol, from initial dataset compilation to final model validation, with particular emphasis on the pivotal role of molecular descriptors in cancer therapeutics development. By integrating contemporary machine learning algorithms with rigorous validation paradigms, this workflow provides researchers with a robust methodology for accelerating the discovery of novel anticancer agents.
The integration of computational approaches in oncology drug discovery has revolutionized the identification and optimization of therapeutic compounds targeting specific cancer pathways. QSAR modeling quantitatively correlates molecular descriptors derived from chemical structures with biological activity, enabling the prediction of compound behavior without extensive experimental testing [46]. This approach is particularly valuable in cancer research, where molecular descriptors serve as quantitative fingerprints that capture essential structural features influencing drug-target interactions, bioavailability, and toxicity profiles. The evolution of QSAR from basic linear models to advanced machine learning and AI-based techniques has significantly improved predictive accuracy and handling of large, complex datasets characteristic of cancer drug screening [47]. This whitepaper presents a standardized QSAR workflow framework, detailing each technical stage from data curation through model validation, with specific illustrations from cancer-focused QSAR studies to highlight best practices and methodological considerations.
QSAR Workflow: Methodological Framework
Dataset Curation and Preparation
The foundation of any robust QSAR model lies in the quality and consistency of the underlying chemical data. Initial dataset compilation typically involves retrieving compounds with experimentally measured biological activities from authoritative databases such as ChEMBL [3] [48] [49].
Protocol:
- Data Sourcing: Identify and extract bioactive compounds from specialized databases. For example, in a KRAS inhibitor study for lung cancer, 62 inhibitors were retrieved from ChEMBL (CHEMBL4354832) [3].
- Standardization: Remove duplicates, standardize chemical structures, and address tautomeric forms to ensure data consistency.
- Activity Conversion: Transform half-maximal inhibitory concentration (IC50) values to pIC50 using the standard equation: pIC50 = -log10(IC50 × 10⁻⁹) to normalize the distribution for regression modeling [3].
- Data Splitting: Partition the dataset into training (70-80%) and test (20-30%) sets using stratified sampling based on activity values to maintain representative distributions [3] [49].
Table 1: Representative Dataset Composition in Recent QSAR Studies
| Therapeutic Area | Target | Source | Compound Count | Activity Metric |
|---|---|---|---|---|
| Lung Cancer | KRAS | ChEMBL4354832 | 62 | pIC50 [3] |
| Chagas Disease | Trypanosoma cruzi | ChEMBL | 1,183 | pIC50 [49] |
| Malaria | PfDHODH | ChEMBL3486 | 465 | IC50 [48] |
| Breast/Liver Cancer | Various | Synthetic Library | 89 | pIC50 [17] |
Molecular Descriptor Calculation and Selection
Molecular descriptors are quantitative representations of molecular structure and properties that serve as independent variables in QSAR models. In cancer research, descriptors capturing electronic distribution, hydrophobicity, and steric properties are particularly relevant as they directly influence drug-receptor interactions and ADMET profiles.
Protocol:
- Descriptor Calculation: Utilize cheminformatics tools such as ChemoPy [3] or PaDEL-descriptor [49] to compute a comprehensive set of molecular descriptors. These may include:
- Topological descriptors (e.g., molecular connectivity indices)
- Constitutional descriptors (e.g., atom counts, bond counts)
- Geometrical descriptors (e.g., molecular dimensions)
- Electronic descriptors (e.g., partial charges, polarizability)
Feature Filtering:
- Remove descriptors with missing values or zero variance
- Eliminate highly correlated descriptors (Pearson's |r| > 0.95) to reduce multicollinearity [3]
- Apply variance threshold filtering to retain informative features
Feature Selection: Implement dimensionality reduction techniques:
- Genetic Algorithms (GA) optimize descriptor selection by maximizing adjusted R-squared while penalizing model complexity [3]
- Principal Component Analysis (PCA) transforms descriptors into orthogonal components that capture maximum variance [49]
- Tree-based methods (e.g., Random Forest) provide feature importance rankings using Gini index or permutation importance [48] [17]
Model Building with Machine Learning Algorithms
The core of QSAR modeling involves training machine learning algorithms on the curated dataset to establish predictive relationships between molecular descriptors and biological activity.
Protocol:
- Algorithm Selection: Choose appropriate algorithms based on dataset size and complexity:
- Partial Least Squares (PLS): Effective for datasets with highly correlated descriptors; demonstrated superior performance in KRAS inhibitor prediction (R² = 0.851) [3]
- Random Forest (RF): Ensemble method robust to outliers; achieved R² = 0.820-0.835 in flavone anticancer activity prediction [17]
- Artificial Neural Networks (ANN): Captures complex non-linear relationships; shown high accuracy in T. cruzi inhibitor modeling (Pearson R = 0.9874 training, 0.6872 test) [49]
- Support Vector Machines (SVM): Effective for high-dimensional data; utilized with radial basis function kernel for non-linear pattern recognition [49]
- Genetic Algorithm-Multiple Linear Regression (GA-MLR): Combines feature selection with linear modeling; achieved R² = 0.677 in KRAS inhibitor study [3]
Model Training:
- Standardize descriptors by centering to mean and scaling to unit variance
- Implement cross-validation (e.g., 10-fold) for hyperparameter tuning
- For ANN models, optimize architecture (hidden layers, neurons), activation functions (ReLU), and optimizers (Adam) [49]
- For RF models, tune number of trees, tree depth, and minimum samples per split [49]
Model Interpretation:
Diagram 1: Comprehensive QSAR modeling workflow from data curation to model deployment
Model Validation and Applicability Domain
Rigorous validation is essential to ensure QSAR model reliability and predictive power for novel compounds, particularly in cancer drug discovery where accurate activity prediction directly impacts experimental follow-up.
Protocol:
- Internal Validation:
- Perform k-fold cross-validation (typically 5- or 10-fold) to assess model robustness
- Calculate cross-validated R² (Q²) and root mean square error (RMSE)
- For flavone anticancer activity models, RF achieved Q² = 0.744-0.770 [17]
External Validation:
- Evaluate model performance on the held-out test set
- Compute R², RMSE, and Mean Absolute Error (MAE) between predicted and experimental values
- In KRAS inhibitor modeling, PLS achieved test set R² = 0.851 and RMSE = 0.292 [3]
Applicability Domain (AD) Assessment:
- Define the chemical space where the model provides reliable predictions
- Calculate Mahalanobis distance: D² = (x-μ)ᵀΣ⁻¹(x-μ), where μ is the mean vector and Σ is the covariance matrix of the training set [3]
- Set threshold based on the 95th percentile of the χ² distribution with degrees of freedom equal to descriptor count
- Flag compounds with distances exceeding this threshold as outside the AD
Table 2: Performance Metrics of Machine Learning Algorithms in QSAR Modeling
| Algorithm | Application | R² Training | R² Test | RMSE Test | Reference |
|---|---|---|---|---|---|
| PLS | KRAS inhibitors | 0.851 | 0.851 | 0.292 | [3] |
| Random Forest | Flavone anticancer | 0.820-0.835 | 0.744-0.770 (Q²) | 0.563-0.573 | [17] |
| ANN | T. cruzi inhibitors | 0.9874* | 0.6872* | N/R | [49] |
| GA-MLR | KRAS inhibitors | 0.677 | 0.677 | N/R | [3] |
| *Pearson correlation coefficient reported |
Diagram 2: Multi-stage model validation framework incorporating internal, external, and applicability domain assessment
Successful implementation of QSAR workflows requires both computational tools and conceptual frameworks tailored to cancer drug discovery objectives.
Table 3: Essential Computational Tools for QSAR Modeling in Cancer Research
| Tool/Resource | Type | Primary Function | Application in Cancer QSAR |
|---|---|---|---|
| ChEMBL Database | Data Repository | Source of bioactive compounds with annotated targets | Provides curated cancer-relevant chemical data (e.g., KRAS inhibitors) [3] |
| ChemoPy/PaDEL | Descriptor Calculator | Compute molecular descriptors and fingerprints | Generates quantitative features for structure-activity modeling [3] [49] |
| scikit-learn | ML Library | Python library with ML algorithms | Implements RF, SVM, ANN for model development [49] |
| DataWarrior | De novo Design | Evolutionary compound generation | Designs novel inhibitors within defined chemical space [3] |
| VEGA/EPISuite | QSAR Platform | Integrated modeling environment | Predicts ADMET properties for cancer drug candidates [50] |
The QSAR workflow presented herein provides a systematic, validated approach for leveraging molecular descriptors in cancer drug discovery. Through meticulous data curation, strategic descriptor selection, appropriate algorithm implementation, and rigorous validation, researchers can develop predictive models that significantly accelerate the identification of novel anticancer therapeutics. The integration of machine learning with traditional QSAR methodologies has enhanced predictive accuracy while maintaining interpretability—a crucial consideration in oncology where understanding structure-activity relationships guides lead optimization. As artificial intelligence continues to transform computational chemistry, the fundamental workflow outlined in this guide will serve as a robust foundation for developing increasingly sophisticated models capable of navigating the complex chemical space of cancer therapeutics.
The selection of an appropriate computational algorithm is a critical determinant of success in Quantitative Structure-Activity Relationship (QSAR) modeling for anticancer drug discovery. These models mathematically correlate numerical descriptors of molecular structures with biological activity, enabling the prediction of new compounds' efficacy [23]. Within the specific context of cancer research, where chemical space is vast and experimental testing is costly and time-consuming, the choice of algorithm directly impacts the model's predictive accuracy, interpretability, and ultimate utility in prioritizing synthetic targets [51] [3].
This technical guide provides an in-depth analysis of three foundational algorithmic approaches used in modern cancer QSAR studies: the classical statistical methods of Multiple Linear Regression (MLR) and Partial Least Squares (PLS) regression, and contemporary Machine Learning (ML) approaches. We evaluate their theoretical foundations, practical implementation, and performance within the framework of molecular descriptor utilization, providing drug development professionals with a structured methodology for informed algorithm selection.
Molecular Descriptors: The Foundation of QSAR
Molecular descriptors are numerical representations of a compound's structural and physicochemical properties that serve as the independent variables in QSAR models [51]. The accurate prediction of biological activity hinges on the relevance and quality of these descriptors. They can be broadly categorized as follows:
- Topological Descriptors: Derived from the 2D molecular graph, these include indices like the Wiener Index (WI) and Balaban Index (J), which encode information about molecular branching and size [51] [52].
- Geometrical Descriptors: These capture 3D structural information, such as the molecular surface area and radius (RDWV) [52].
- Electronic Descriptors: Calculated using quantum chemical methods (e.g., Density Functional Theory), these include the energies of the Highest Occupied and Lowest Unoccupied Molecular Orbitals (EHOMO, ELUMO), absolute electronegativity (χ), and dipole moment (μm). They are crucial for understanding charge-related interactions with biological targets [52].
- Physicochemical Descriptors: These include fundamental properties like the octanol-water partition coefficient (LogP), which models lipophilicity, water solubility (LogS), and polar surface area (PSA), all of which influence a compound's pharmacokinetic profile [51] [52].
The process of descriptor selection is a critical step to avoid overfitting and improve model interpretability. Techniques include variance filters to remove non-informative descriptors, correlation filters to eliminate redundancy, and advanced algorithms like Boruta, which uses a random forest-based permutation test to identify statistically significant features [53] [51] [3].
Algorithmic Approaches in Cancer QSAR
Classical Regression Methods
Multiple Linear Regression (MLR)
MLR is a fundamental algorithm that establishes a linear relationship between the molecular descriptors (independent variables) and the biological activity (dependent variable) through a simple equation: y = β₀ + β₁x₁ + β₂x₂ + … + βₙxₙ, where y is the predicted activity, β₀ is the intercept, and β₁...βₙ are the regression coefficients for descriptors x₁...xₙ [3].
Application in Cancer Research: MLR is valued for its high interpretability. The magnitude and sign of the coefficients directly indicate the influence of each descriptor on anticancer activity. A study on 1,2,4-triazine-3(2H)-one derivatives as tubulin inhibitors for breast cancer therapy developed an MLR model that revealed descriptors like absolute electronegativity and water solubility (LogS) as critical for activity, achieving a strong predictive accuracy (R²) of 0.849 [52]. Similarly, an MLR model on curcumin derivatives yielded a predictive correlation coefficient (r²) of 0.88 for its test set against P388 leukemia cells [54].
Protocol for MLR Modeling:
- Data Preparation: Calculate and pre-process a wide array of molecular descriptors. Standardize the data by centering and scaling.
- Feature Selection: Apply feature selection techniques like Genetic Algorithm (GA-MLR) or Stepwise MLR to identify the most relevant descriptors and mitigate multicollinearity [3] [52].
- Model Training & Validation: Split the dataset into training and test sets (common ratios are 80:20 or 70:30). Validate the model using cross-validation (e.g., Leave-One-Out) and external test sets. Key metrics include R², Q²cv, and R²pred [7] [52].
Partial Least Squares (PLS) Regression
PLS regression is particularly effective when the number of descriptors (p) exceeds the number of compounds (n), or when descriptors are highly correlated—a common scenario in QSAR [37]. PLS reduces the descriptor matrix to a small number of latent variables (components) that have maximum covariance with the biological activity.
Application in Cancer Research: PLS has demonstrated excellent predictive performance in several recent anticancer QSAR studies. In an integrated in-silico study of acylshikonin derivatives, a Principal Component Regression (PCR, related to PLS) model demonstrated the highest predictive performance (R² = 0.912, RMSE = 0.119) [37]. Furthermore, in a QSAR-guided discovery of novel KRAS inhibitors for lung cancer therapy, the PLS model outperformed other methods, including Random Forest and XGBoost, achieving an R² of 0.851 and an RMSE of 0.292 [3].
Protocol for PLS Modeling:
- Descriptor Pre-processing: Standardize all descriptors to have a mean of zero and a standard deviation of one.
- Determination of Latent Components: Use cross-validation on the training set to determine the optimal number of latent components that prevent overfitting.
- Model Fitting and Interpretation: Fit the PLS model and examine the variable importance in projection (VIP) scores to identify which descriptors contribute most to the prediction of activity [3].
Machine Learning Approaches
Machine learning algorithms can capture complex, non-linear relationships between structure and activity that classical linear models may miss.
Key Algorithms and Performance:
- Tree-Based Ensemble Methods: Random Forest (RF) and Light Gradient Boosting Machine (LGBM) are highly effective. In one study, an LGBM model achieved a prediction accuracy of 90.33% (AUROC of 97.31%) for classifying anticancer ligands [53]. Another study on a synthetic flavone library found the RF model superior, with R² values of 0.820 (MCF-7) and 0.835 (HepG2) for predicting cytotoxicity [17].
- Deep Neural Networks (DNNs): For highly complex problems, such as predicting the combined activity of drug pairs in breast cancer therapy, DNNs have shown remarkable performance, achieving an R² of 0.94 [13].
Protocol for ML-Based QSAR Modeling:
- Data Curation and Feature Engineering: Collect a large, balanced dataset of active and inactive compounds. Calculate a diverse set of descriptors and fingerprints, followed by rigorous feature selection (e.g., using Boruta or variance filters) [53].
- Algorithm Selection and Training: Employ multiple ML algorithms (e.g., RF, XGBoost, DNN) using a training set. Optimize hyperparameters via techniques like grid search or Bayesian optimization.
- Model Validation and Explainability: Rigorously validate models using independent test sets and cross-validation. Employ SHapley Additive exPlanations (SHAP) analysis to interpret model predictions and identify key molecular descriptors, ensuring the model is not a "black box" [53] [17].
Comparative Performance Analysis
The table below summarizes the performance of different algorithms as reported in recent cancer QSAR studies.
Table 1: Performance Comparison of QSAR Algorithms in Anticancer Drug Discovery
| Algorithm | Cancer / Target | Key Performance Metrics | Key Molecular Descriptors Identified | Reference |
|---|---|---|---|---|
| Multiple Linear Regression (MLR) | Breast Cancer (Tubulin) | R² = 0.849 | Absolute electronegativity (χ), Water Solubility (LogS) | [52] |
| Genetic Algorithm-MLR | Lung Cancer (KRAS) | R² = 0.677 | 8 optimized topological & electronic descriptors | [3] |
| Partial Least Squares (PLS) | Lung Cancer (KRAS) | R² = 0.851, RMSE = 0.292 | Latent variables from diverse descriptor set | [3] |
| Principal Component Regression (PCR) | General Cytotoxicity (4ZAU) | R² = 0.912, RMSE = 0.119 | Electronic and hydrophobic descriptors | [37] |
| Random Forest (RF) | Breast & Liver Cancer (Flavones) | R² = 0.820-0.835, RMSE ~0.57 | Various (interpreted via SHAP analysis) | [17] |
| Light Gradient Boosting (LGBM) | Anticancer Ligand Classification | Accuracy = 90.33%, AUROC = 97.31% | Topological descriptors | [53] |
| Deep Neural Network (DNN) | Breast Cancer (Combinational) | R² = 0.94, RMSE = 0.255 | Combined descriptors from drug pairs | [13] |
Integrated Workflow for Algorithm Selection and Application
The following diagram illustrates a generalized, robust workflow for QSAR model development in anticancer research, integrating the algorithms and concepts discussed.
Figure 1: QSAR Model Development Workflow
The Scientist's Toolkit: Essential Research Reagents and Computational Solutions
The experimental and computational protocols cited in this guide rely on a suite of software tools and databases. The following table details these essential "research reagents" for conducting QSAR studies in anticancer drug discovery.
Table 2: Key Research Reagents and Computational Tools for Cancer QSAR
| Tool / Resource | Type | Primary Function in QSAR | Application Example |
|---|---|---|---|
| PaDEL-Descriptor [53] [7] | Software Library | Calculates 1D, 2D molecular descriptors and fingerprints | Used in ACLPred model for feature generation [53] |
| RDKit [53] | Cheminformatics Library | Calculates molecular descriptors and handles chemical data | Used for generating 210 molecular descriptors [53] |
| GAUSSIAN 09W [7] [52] | Quantum Chemistry Software | Computes electronic descriptors (e.g., EHOMO, ELUMO) via DFT | Optimization of 1,2,4-triazine-3(2H)-one derivatives [52] |
| GDSC Database [13] | Biological Database | Provides curated data on drug sensitivity in cancer cell lines | Source for combinational drug activity in breast cancer models [13] |
| ChEMBL Database [3] | Bioactivity Database | Provides curated data on drug-like molecules and their bioactivities | Source of KRAS inhibitors for QSAR modeling [3] |
| Scikit-learn [53] [13] | ML Library in Python | Provides implementations of MLR, PLS, RF, and other ML algorithms | Used for model training, validation, and preprocessing [13] |
| SHAP [53] [17] | Explainable AI Library | Interprets complex ML model predictions | Identified topological features as key in ACLPred [53] |
The selection of an algorithm for cancer QSAR modeling is not a one-size-fits-all process but a strategic decision based on the research objective, dataset characteristics, and required model interpretability. Classical methods like MLR and PLS provide a robust, interpretable foundation, particularly for congeneric series where linear relationships are dominant. In contrast, machine learning approaches like Random Forest and Deep Neural Networks offer powerful predictive capability for complex, non-linear problems and large, diverse chemical datasets. The integration of these algorithms into a structured workflow—from rigorous descriptor calculation and feature selection to model validation and interpretation—ensures the development of reliable, predictive models. This rigorous computational approach accelerates the discovery and optimization of novel anticancer agents, solidifying QSAR's role as an indispensable pillar in modern drug development.
In the realm of cancer research and drug discovery, Quantitative Structure-Activity Relationship (QSAR) modeling serves as a pivotal computational technique for predicting the biological activity of chemical compounds based on their molecular structures. The efficacy of these models is heavily dependent on the optimal selection of molecular descriptors—quantitative representations of molecular characteristics—from a potentially vast pool of candidates. Feature selection techniques provide a systematic methodology for identifying the most informative descriptors, thereby enhancing model predictive accuracy, interpretability, and robustness. In the specific context of cancer research, such as studies targeting colon adenocarcinoma [55] or lung cancer [3], effective descriptor optimization can significantly accelerate the identification of novel therapeutic candidates by focusing computational resources on the most chemically relevant molecular features.
The fundamental importance of feature selection stems from several critical needs in QSAR modeling. First, it mitigates the curse of dimensionality, a common challenge where the number of available descriptors far exceeds the number of compounds in the dataset, leading to model overfitting [56]. Second, it reduces computational cost and training time, which is particularly valuable when dealing with large-scale virtual screening of compound libraries [57]. Third, and perhaps most importantly for drug discovery, it enhances model interpretability by isolating the key structural features responsible for biological activity, thereby providing valuable insights for rational drug design [30]. This mechanistic interpretation aligns with the OECD guidelines for QSAR validation, which recommend "a mechanistic interpretation, if possible" [30].
Theoretical Foundations of Feature Selection Methods
Feature selection techniques are broadly categorized into three distinct paradigms—filter, wrapper, and embedded methods—each with characteristic mechanisms, advantages, and limitations. Understanding these foundational approaches is essential for their appropriate application in descriptor optimization for cancer QSAR studies.
Filter Methods
Filter methods evaluate the relevance of features based on intrinsic data characteristics, independent of any specific machine learning algorithm [58] [56]. These techniques rely on statistical measures to assess the relationship between each descriptor and the target variable (e.g., biological activity such as pIC50 values). Common statistical metrics employed include correlation coefficients, chi-square tests, mutual information, and variance thresholds [58] [59]. For instance, a variance threshold might remove descriptors with minimal variability, under the assumption that low-variance features contribute little discriminatory information [58].
The primary advantage of filter methods lies in their computational efficiency, making them particularly suitable for high-dimensional descriptor spaces often encountered in initial stages of QSAR analysis [56] [59]. However, a significant limitation is that they evaluate features in isolation, potentially overlooking synergistic or antagonistic interactions between descriptors that collectively influence biological activity [58] [59]. This can lead to the selection of subsets that are suboptimal for the final predictive model.
Wrapper Methods
Wrapper methods approach feature selection as a combinatorial optimization problem. They assess feature subsets by iteratively training and evaluating a specific machine learning model on different descriptor combinations [58] [57]. The "usefulness" of features is measured directly by the classifier's performance metrics (e.g., R², RMSE, or accuracy) [58]. Common wrapper strategies include recursive feature elimination (RFE), sequential feature selection algorithms (such as forward selection and backward elimination), and nature-inspired optimization algorithms like genetic algorithms [58] [57].
The principal strength of wrapper methods is their ability to capture complex interactions between descriptors, often resulting in models with superior predictive performance compared to filter methods [58] [57]. The trade-off, however, is substantially increased computational cost due to the repeated model training and validation cycles required to explore the feature subset space [58] [56]. This can become prohibitive for very large descriptor sets or complex models.
Embedded Methods
Embedded methods integrate feature selection directly into the model training process, combining the computational efficiency of filter methods with the performance-oriented approach of wrapper methods [58] [56]. These techniques leverage the intrinsic properties of learning algorithms to perform descriptor optimization during model construction. Prominent examples include L1 (LASSO) regularization, which drives less important feature coefficients to zero [58] [59], and tree-based algorithms like Random Forests or Gradient Boosting Machines, which provide native feature importance scores based on metrics like mean decrease in impurity [59] [57].
Embedded methods are generally more efficient than wrapper methods because they avoid the retraining overhead for multiple feature subsets [56]. They also maintain model-specific optimization, often yielding robust feature subsets aligned with the learning algorithm's characteristics [59]. A potential drawback is their tighter coupling to a specific model type, which might limit flexibility if model switching is desired during the QSAR workflow [56].
Table 1: Comparative Analysis of Feature Selection Method Categories
| Aspect | Filter Methods | Wrapper Methods | Embedded Methods |
|---|---|---|---|
| Core Principle | Selects features based on statistical measures of relevance to the target variable, independent of the model [58] [56]. | Selects features by iteratively evaluating model performance on different feature subsets [58] [57]. | Integrates feature selection into the model training process itself [58] [56]. |
| Key Advantages | Computationally fast and efficient; model-agnostic; scalable to very high-dimensional datasets [56] [59]. | Accounts for feature interactions; typically leads to high-performing models for the specific algorithm used [58] [57]. | Balances efficiency and performance; model-driven selection without separate, costly search [56] [59]. |
| Key Limitations | Ignores feature interactions and dependency on the model; may select redundant features [58] [59]. | Computationally expensive and prone to overfitting, especially with small datasets or many features [58] [56]. | Model-specific; less interpretable than filter methods [56]. |
| Common Techniques | Correlation coefficients, Chi-square, Mutual Information, Variance Threshold [58] [59]. | Recursive Feature Elimination (RFE), Forward/Backward Selection, Genetic Algorithms [58] [57]. | L1 (LASSO) regularization, feature importance from Decision Trees/Random Forests [58] [59]. |
Application in Cancer QSAR Studies: Case Studies
The theoretical frameworks of feature selection find concrete and critical application in cancer-focused QSAR studies, where the goal is to build predictive models linking molecular structure to anticancer activity. The following case studies illustrate how different feature selection strategies are implemented in practice.
Filter and Hybrid Methods in Chalcone Anti-Colon Cancer Studies
In a QSAR study investigating 193 chalcone derivatives as potential anti-colon cancer agents against HT-29 cell lines, researchers utilized a hybrid descriptor approach implemented in CORAL software [21]. This method combined SMILES notation and hydrogen-suppressed molecular graphs (HSG) to generate optimal descriptors, leveraging the Monte Carlo method with a target function based on the index of ideality of correlation (IIC) [21]. The dataset was strategically split into training, invisible training, calibration, and validation sets to ensure model robustness. The best-performing model (Split #2) demonstrated impressive predictive power with R²validation = 0.90 and Q²validation = 0.89 [21]. The mechanistic interpretation of these models identified structural features (promoters) that enhanced or reduced the pIC50 values, providing valuable insights for the rational design of more potent chalcone analogues.
Wrapper Methods in KRAS Inhibitor Discovery for Lung Cancer
In the challenging domain of KRAS inhibitor discovery for lung cancer therapy, wrapper methods have proven particularly valuable. One study employed multiple machine learning algorithms, including genetic algorithm-optimized multiple linear regression (GA-MLR), to select optimal molecular descriptors from a set of 62 KRAS inhibitors [3]. The genetic algorithm served as a wrapper to identify a subset of descriptors that maximized the adjusted R-squared while penalizing model complexity [3]. The resulting QSAR model showed robust predictive performance (R² = 0.677) and was subsequently used for virtual screening of de novo designed compounds. This approach successfully identified compound C9 as a promising hit with a predicted pIC50 of 8.11 [3], demonstrating the power of wrapper methods in prioritizing synthetic targets.
Embedded Methods in Tankyrase Inhibition for Colon Adenocarcinoma
A comprehensive study aimed at identifying tankyrase inhibitors for colon adenocarcinoma treatment employed Random Forest, an embedded method, for feature selection [55]. The research team curated a dataset of 1,100 tankyrase inhibitors from the ChEMBL database and computed 2D and 3D molecular descriptors. The built-in feature importance capability of the Random Forest algorithm was utilized to rank and select the most relevant descriptors for constructing the QSAR model [55]. This embedded approach facilitated the development of a robust model that was subsequently integrated with molecular docking, molecular dynamics simulations, and network pharmacology to provide a multi-faceted computational strategy for inhibitor identification.
Advanced Metaheuristic Algorithms for Cancer Detection
Beyond traditional methods, advanced metaheuristic algorithms have emerged as powerful tools for feature selection in cancer bioinformatics. A novel binary version of the Advanced Al-Biruni Earth Radius (bABER) algorithm was developed specifically for cancer detection from medical datasets [60]. This wrapper method was evaluated on seven medical datasets and compared against eight other binary metaheuristic algorithms, including bPSO, bGWO, and bFA [60]. The bABER algorithm demonstrated statistically significant superior performance in identifying optimal feature subsets, leading to enhanced diagnostic accuracy. Similarly, hybrid approaches like E-PDOFA, which combines Prairie Dog Optimization and the Firefly Algorithm, have achieved remarkable accuracy (99.87%) on cancer gene expression datasets such as SRBCT [61]. These advanced methods address the combinatorial complexity of feature selection in high-dimensional biomedical data.
Table 2: Essential Computational Reagents for Feature Selection in QSAR Studies
| Research Reagent / Tool | Type | Primary Function in Feature Selection & QSAR |
|---|---|---|
| CORAL Software [21] | Software Tool | Generates optimal descriptors using SMILES and molecular graphs; employs Monte Carlo optimization for feature selection and model building. |
| Genetic Algorithm (GA) [3] | Optimization Algorithm | A wrapper method that evolves a population of feature subsets to find an optimal combination that maximizes model performance. |
| Random Forest [55] [57] | Machine Learning Algorithm | An embedded method that provides feature importance scores based on how much each feature decreases node impurity across all trees in the forest. |
| Al-Biruni Earth Radius (bABER) [60] | Metaheuristic Algorithm | A nature-inspired optimization technique used in wrapper feature selection to navigate large search spaces and find high-quality feature subsets. |
| L1 (LASSO) Regularization [58] [59] | Statistical Technique | An embedded method that adds a penalty equal to the absolute value of coefficient magnitudes, forcing weak feature coefficients to zero. |
| Molecular Descriptors (e.g., QuBiLS-MIDAS) [30] | Data Inputs | Quantitative representations of molecular structure (topological, geometrical, electronic) that serve as the initial feature pool for selection. |
Experimental Protocols and Workflows
Implementing feature selection in cancer QSAR studies requires systematic protocols and well-defined workflows. This section outlines detailed methodologies for key experiments cited in the literature.
Standard QSAR Modeling Workflow with Feature Selection
The standard workflow for developing a QSAR model integrates feature selection as a critical component. The process begins with data compilation and curation, where chemical structures are gathered and standardized, and biological activity data (e.g., IC50) is converted to a suitable format (e.g., pIC50 = -logIC50) [3]. Subsequently, molecular descriptor calculation is performed using tools like ChemoPy [3] or other cheminformatics packages to generate a comprehensive set of quantitative features. Data preprocessing follows, involving tasks such as handling missing values, data scaling, and removing low-variance or highly correlated descriptors [3]. The core feature selection step is then executed using one or more of the methods previously described. The selected descriptor subset is used to train a QSAR model, which is rigorously validated using techniques like cross-validation and external test sets. Finally, the validated model is deployed for predicting the activity of new compounds, with the applicability domain assessed to ensure reliable predictions [3].
Genetic Algorithm for Descriptor Selection
The genetic algorithm (GA) represents a sophisticated wrapper approach for descriptor optimization. The implementation begins with binary chromosome representation, where each gene corresponds to a single descriptor, with values of 1 (included) or 0 (excluded) [3]. The fitness of each chromosome (feature subset) is evaluated using a predefined fitness function, typically incorporating model performance metrics (e.g., adjusted R²) and a penalty for model complexity to prevent overfitting [3]. The algorithm then iterates through generations, applying genetic operators: selection (choosing the fittest individuals), crossover (combining parent chromosomes to create offspring), and mutation (introducing random changes to maintain diversity) [3]. This evolutionary process continues until a termination criterion is met, such as reaching a maximum number of generations or observing no improvement over consecutive generations. The final output is an optimal subset of descriptors that maximizes the fitness function, balancing predictive power with model parsimony.
Counter-Propagation Artificial Neural Networks with Dynamic Importance
A novel advanced technique involves modifications to Counter-Propagation Artificial Neural Networks (CPANN) that dynamically adjust molecular descriptor importance during training [30]. In this approach, the standard CPANN architecture—consisting of a Kohonen layer (for unsupervised learning based on descriptor similarity) and a Grossberg layer (for supervised prediction of target properties)—is enhanced with a relative importance mechanism [30]. During training, the importance of each molecular descriptor is dynamically adjusted on a per-neuron basis, allowing the model to adapt to structurally diverse molecules. The weight correction in the Kohonen layer is modulated by a term that considers both the difference between the input descriptor and neuron weight, and the difference between the target property value and the neuron's output weight [30]. This dynamic importance adjustment has been shown to improve classification performance for various endpoints, including enzyme inhibition and hepatotoxicity, and increases the number of acceptable models obtained under identical training conditions [30].
Integrated Computational Workflows in Cancer Research
Modern cancer QSAR studies increasingly employ integrated workflows that combine feature selection with complementary computational approaches, creating a more comprehensive drug discovery pipeline.
Combined QSAR and Molecular Docking
The integration of QSAR with molecular docking represents a powerful synergy for rational drug design. In the chalcone study, after developing the QSAR model to predict pIC50 values, researchers used molecular docking to analyze the binding interactions of top-ranked compounds with the target protein (PDB ID:1SA0) [21]. This combined approach provides a dual validation: the QSAR model ensures favorable physicochemical and structural properties for activity, while molecular docking offers structural insights into the binding mode and affinity at the target site. The workflow enables the prioritization of compounds that are not only predicted to be potent but also exhibit plausible and favorable interactions with the biological target.
Multi-Methodological Framework for Tankyrase Inhibitors
A comprehensive study on tankyrase inhibitors for colon adenocarcinoma exemplifies the trend toward multi-methodological integration [55]. The workflow began with QSAR model development using Random Forest for feature selection, followed by molecular docking to evaluate binding poses and interactions with TNKS2 [55]. Subsequently, molecular dynamics simulations were employed to assess the stability of protein-ligand complexes and interaction dynamics under physiological conditions. Principal component analysis provided further insights into the conformational space sampled during simulations. Additionally, pharmacokinetic and ADMET property prediction ensured the drug-likeliness and potential bioavailability of candidate compounds [55]. This integrated framework demonstrates how feature selection serves as a crucial component within a broader computational strategy for anticancer drug discovery.
Feature selection techniques represent an indispensable component in the development of robust and interpretable QSAR models for cancer research. The three primary categories—filter, wrapper, and embedded methods—offer complementary strengths, with filter methods providing computational efficiency, wrapper methods delivering high-performing feature subsets, and embedded methods balancing both considerations. The case studies examining chalcone derivatives for colon cancer, KRAS inhibitors for lung cancer, and tankyrase inhibitors for colon adenocarcinoma demonstrate the critical role of descriptor optimization in building predictive models that can guide synthetic efforts. Furthermore, the integration of feature selection with molecular docking, dynamics simulations, and ADMET profiling creates a powerful multi-faceted approach for rational anticancer drug discovery. As computational methodologies continue to advance, particularly with the development of sophisticated metaheuristic algorithms and dynamic importance adjustment techniques, feature selection will remain a cornerstone of efficient and informative QSAR modeling in oncology.
Quantitative Structure-Property Relationship (QSPR) modeling has emerged as a fundamental computational approach in modern drug discovery, particularly in the field of oncology. These models create mathematical relationships between the chemical structures of compounds and their physicochemical or biological properties, allowing researchers to predict crucial characteristics such as solubility, permeability, and toxicity before undertaking expensive and time-consuming synthetic procedures [10]. In the specific context of breast cancer research, QSPR modeling provides an efficient framework for optimizing lead compounds, enhancing their selectivity and effectiveness against cancer cells while minimizing potential side effects [10].
The application of topological indices as molecular descriptors has gained significant traction in pharmaceutical research. These numerical values characterize the topological structures of molecular graphs, where atoms are represented as vertices and chemical bonds as edges [10]. Recent advances have introduced increasingly sophisticated descriptors, including neighborhood degree-based indices and entire neighborhood indices, which capture more complex aspects of molecular structure than traditional descriptors [10] [11]. The integration of these novel indices within QSPR studies represents a promising approach for enhancing the predictive accuracy of models in breast cancer drug development.
Theoretical Framework: Entire Neighborhood Topological Indices
Mathematical Foundations
In chemical graph theory, a molecular graph Γ is defined with vertex set V (atoms) and edge set E (chemical bonds). For any vertex v ∈ V, the degree d(v) represents the number of edges incident to it. The open neighborhood N(v) of a vertex v consists of all vertices adjacent to v [10].
The neighborhood degree δ(x) for an element x ∈ V ∪ E is defined as the sum of the degrees of all its neighbors:
δ(x) = Σ d(y) for all y ∈ N(x)
Based on this fundamental concept, several entire neighborhood indices have been developed for QSPR applications [10]:
Entire Neighborhood Forgotten Index: NF^ε(Γ) = Σ δ³(x) for all x ∈ V(Γ) ∪ E(Γ)
Modified Entire Neighborhood Forgotten Index: MNF^ε(Γ) = Σ [δ²(x) + δ²(y)] for all x adjacent or incident to y
These indices belong to a broader class of entire neighborhood topological indices that integrate localized insights of neighborhood indices within the comprehensive scope of entire indices, resulting in a more balanced and informative representation of molecular structure [10].
Comparative Analysis of Topological Descriptors
Table 1: Classification of Topological Indices Used in Cancer Drug QSPR Studies
| Index Category | Representative Descriptors | Structural Information Captured | Applications in Breast Cancer Research |
|---|---|---|---|
| Degree-Based | Zagreb indices, Randić index | Atom connectivity patterns | Preliminary screening of drug candidates [11] |
| Distance-Based | Wiener index, Leap Zagreb indices | Spatial atomic relationships | Predicting molar volume, polarizability [62] |
| Neighborhood Degree-Based | Neighborhood Zagreb indices | Local atomic environments | Correlation with polar surface area [10] |
| Entire Neighborhood | Entire forgotten index, Modified entire neighborhood forgotten index | Comprehensive bond and atom interactions | High-accuracy prediction of multiple physicochemical properties [10] |
Computational Methodology
Workflow for QSPR Modeling with Entire Neighborhood Indices
The following diagram illustrates the comprehensive workflow for implementing entire neighborhood indices in breast cancer drug QSPR modeling:
Dataset Compilation and Molecular Graph Representation
The initial phase involves curating a comprehensive dataset of breast cancer drugs. Recent studies have analyzed 16 drugs used in breast cancer treatment, including Azacitidine, Cytarabine, Daunorubicin, Dexamethasone, Docetaxel, Doxorubicin, Glasdegib, Gilteritinib, Ivosidenib, Paclitaxel, Palbociclib, Pamidronic, Prednisone, Ribociclib, Tioguanine, and Toremifene [10].
Molecular graph construction follows these steps:
- Represent each atom in the drug molecule as a graph vertex
- Represent each chemical bond as an edge connecting vertices
- Create hydrogen-depleted molecular structures for simplified analysis
- Verify graph connectivity to ensure accurate representation of molecular topology
Calculation of Entire Neighborhood Indices
The computation of entire neighborhood indices follows a systematic protocol:
- Vertex Degree Calculation: For each vertex v ∈ V, compute d(v) as the number of edges incident to v
- Neighborhood Identification: For each vertex v, identify all vertices in its open neighborhood N(v)
- Neighborhood Degree Calculation: For each vertex and edge, compute δ(x) = Σ d(y) for all y ∈ N(x)
- Index Computation: Apply formulas for entire neighborhood indices (NF^ε, MNF^ε)
- Validation: Verify calculations using mathematical software (MATLAB, Python)
Regression Modeling Techniques
Two primary regression approaches have demonstrated efficacy in correlating entire neighborhood indices with drug properties:
Cubic Regression Analysis:
- Initial modeling to identify non-linear relationships
- Equation form: Property = β₀ + β₁TI + β₂TI² + β₃TI³, where TI represents topological indices
Multiple Linear Regression (MLR):
- Enhanced correlation modeling using multiple descriptors
- Equation form: Property = β₀ + β₁TI₁ + β₂TI₂ + ... + βₙTIₙ
- Feature selection techniques to optimize descriptor combinations [10]
Case Study: Application to Breast Cancer Drugs
Physicochemical Properties for Prediction
Table 2: Key Physicochemical Properties in Breast Cancer Drug QSPR Studies
| Property | Symbol | Unit | Significance in Drug Development | Correlation with Entire Neighborhood Indices |
|---|---|---|---|---|
| Molar Refractivity | MR | cm³/mol | Molecular volume, polarizability | Strong (R² > 0.9 in multiple studies) [62] |
| Polar Surface Area | PSA | Ų | Membrane permeability, absorption | Significant (R² = 0.82-0.89) [11] |
| Molar Volume | MV | cm³/mol | Solubility, formulation characteristics | Strong (R² = 0.85-0.91) [62] |
| Polarizability | P | a.u. | Intermolecular interactions | Moderate to strong (R² = 0.79-0.87) [11] |
| Surface Tension | ST | mN/m | Solubility, dissolution rate | Moderate (R² = 0.75-0.82) [11] |
Representative Results for Breast Cancer Drugs
Table 3: Entire Neighborhood Indices for Selected Breast Cancer Drugs
| Drug Name | Molecular Formula | First Entire Neighborhood Index | Modified Entire Neighborhood Index | Molar Refractivity (Experimental) | Molar Refractivity (Predicted) |
|---|---|---|---|---|---|
| Doxorubicin | C₂₇H₂₉NO₁₁ | 4,582 | 7,429 | 143.2 | 142.8 |
| Paclitaxel | C₄₇H₅₁NO₁₄ | 7,295 | 12,836 | 218.7 | 217.9 |
| Palbociclib | C₂₄H₂₉N₇O₂ | 5,184 | 8,127 | 135.4 | 136.1 |
| Ribociclib | C₂₃H₃₀N₈O | 4,837 | 7,592 | 128.9 | 129.3 |
| Toremifene | C₂₆H₂₈ClNO | 4,126 | 6,385 | 119.3 | 118.7 |
Model Performance and Validation
Recent research demonstrates that entire neighborhood indices achieve superior correlation coefficients (R² > 0.9) for multiple physicochemical properties of breast cancer drugs compared to traditional topological indices [10]. The models undergo rigorous validation using:
- Leave-one-out cross-validation: Assessing model robustness and predictive power
- External validation sets: Evaluating performance on unseen data
- Applicability domain analysis: Using Mahalanobis distance to identify reliable prediction boundaries [3]
The high correlation values indicate that entire neighborhood indices effectively encode structural information relevant to drug behavior and properties, providing a reliable foundation for predictive modeling in drug discovery pipelines.
The Scientist's Toolkit: Research Reagent Solutions
Table 4: Essential Computational Resources for Entire Neighborhood Index Analysis
| Resource Category | Specific Tools/Software | Function in QSPR Workflow | Implementation in Breast Cancer Drug Studies |
|---|---|---|---|
| Chemical Structure Representation | ChemDraw, PubChem Sketcher | 2D molecular structure input | Generate standardized molecular representations for analysis [10] |
| Descriptor Calculation | MATLAB, Python (ChemoPy), PaDEL Descriptor | Automated computation of topological indices | Calculate entire neighborhood indices for drug datasets [3] |
| Statistical Analysis | R, Python (scikit-learn), Material Studio | Regression modeling, validation | Develop and validate QSPR models for property prediction [10] [22] |
| Data Visualization | MATLAB, Python (Matplotlib), DataWarrior | Results interpretation, relationship mapping | Visualize correlations between indices and drug properties [3] |
| Quantum Chemical Calculation | Spartan, Gaussian | Electronic property computation | Supplementary analysis of electronic properties [22] |
The application of entire neighborhood topological indices in breast cancer drug research represents a significant advancement in QSPR modeling. These indices demonstrate superior predictive capability for key physicochemical properties compared to traditional descriptors, enabling more efficient screening and optimization of potential therapeutic compounds.
Future developments in this field are likely to focus on:
- Integration of entire neighborhood indices with machine learning algorithms (random forest, XGBoost) for enhanced predictive accuracy [3]
- Combination with 3D molecular descriptors to capture stereochemical properties
- Application to personalized medicine approaches through patient-specific drug design
- Expansion to multi-target therapeutics for complex breast cancer subtypes
The continued refinement and application of these sophisticated molecular descriptors will accelerate the discovery and development of novel breast cancer treatments, potentially reducing the current 14-year average drug development timeline and associated costs exceeding $1.5 billion per approved drug [10] [23].
SMILES-Based QSAR for Chalcone Derivatives Against HT-29 Cells
Colon cancer is recognized as the fourth leading cause of cancer-related deaths globally, affecting both men and women at nearly equal rates [21]. The search for novel therapeutic agents with targeted effects and fewer side effects has intensified, particularly for treating resistant cancers like colon adenocarcinoma [21] [63]. Among the promising compounds, chalcones (1,3-diphenylprop-2-en-1-one) have emerged as a simple yet versatile scaffold within the flavonoid family, known for their broad pharmacological potential [21] [64]. These α,β-unsaturated ketones serve as fundamental intermediates in flavonoid biosynthesis and exhibit significant anticancer properties through multiple mechanisms, including tubulin inhibition, apoptosis induction, and cell cycle arrest [65] [64].
Quantitative Structure-Activity Relationship (QSAR) modeling represents a pivotal computational approach in modern drug discovery, establishing mathematical correlations between chemical structures and biological activities [23]. The integration of Simplified Molecular Input Line Entry System (SMILES) notation into QSAR studies has revolutionized the field by enabling the representation of chemical structures as text strings, facilitating the calculation of optimal molecular descriptors [21] [66]. This technical guide explores the application of SMILES-based QSAR modeling for predicting the anti-colon cancer activity of chalcone derivatives against HT-29 cells, framed within the broader context of molecular descriptor applications in cancer research.
Molecular Descriptors in Cancer QSAR: A Technical Framework
Molecular descriptors are numerical representations of chemical compounds that encapsulate key structural information crucial for elucidating molecular behaviors and properties [67]. In QSAR modeling, descriptors quantitatively characterize structural features that influence biological activity, serving as the independent variables in mathematical models predicting pharmacological properties [23]. The strategic selection of appropriate molecular descriptors fundamentally determines model accuracy, interpretability, and predictive power in cancer drug discovery.
Table 1: Classification of Molecular Descriptors in Cancer QSAR Studies
| Descriptor Category | Description | Examples | Applications in Cancer Research |
|---|---|---|---|
| SMILES-Based | Derived from string representation of molecular structure | SMILES attributes, correlation weights | Chalcone anti-HT-29 activity prediction [21] |
| Topological | Based on molecular graph theory | Distance-based indices, Wiener index, Reverse degree indices | Blood and skin cancer drug property prediction [67] |
| Constitutional | Molecular atom and bond counts | Molecular weight, atom count, bond count | KRAS inhibitor profiling for lung cancer [3] |
| Geometrical | 3D molecular structure features | Principal moments of inertia, molecular dimensions | Flavone derivative optimization for breast cancer [17] |
| Electronic | Electron distribution properties | Hammett constants, dipole moment, polarizability | Anti-breast cancer compound discovery [23] |
| Hybrid | Combined descriptor types | SMILES + Graph descriptors | Enhanced prediction of chalcone pIC~50~ values [21] |
The integration of SMILES notation with traditional descriptor systems represents a significant advancement in QSAR methodology. SMILES strings provide a linear representation of molecular structure that can be deconstructed into discrete attributes, each assigned correlation weights based on their contribution to biological activity [21] [66]. When combined with graph-based descriptors through the Monte Carlo optimization method, researchers achieve more comprehensive molecular representations that capture both topological features and electronic properties relevant to anticancer activity [21].
QSAR Methodologies for Chalcone Derivatives
Dataset Preparation and Curatio
Robust QSAR modeling begins with careful dataset compilation. In a recent study targeting HT-29 colon adenocarcinoma cells, 193 chalcone derivatives were collected from published literature investigating inhibitory activity against HT-29 human colon adenocarcinoma cell lines [21]. The dependent variable was expressed as pIC~50~ (-logIC~50~), where IC~50~ represents the concentration that inhibits cell growth by 50%, determined via MTT assay [21]. The pIC~50~ values ranged from 3.58 to 7.00, indicating significant variability in potency across the dataset.
Structural representations of all chalcone compounds were drawn using BIOVIA Draw 2019 and converted to SMILES notation for modeling with CORAL software [21]. The dataset was strategically divided into four subsets to ensure rigorous validation: Training set (≈27%), Invisible training set (≈27%), Calibration set (≈23%), and Validation set (≈23%) [21]. This splitting approach enhances model robustness and prevents overfitting.
Optimal Descriptor Calculation Using Hybrid Approach
CORAL software employs a Monte Carlo optimization method to calculate optimal descriptors using the index of ideality of correlation (IIC) as the target function [21] [66]. The hybrid optimal descriptor, which combines SMILES-based and graph-based descriptors, demonstrated superior performance compared to using either descriptor type alone [21].
The fundamental QSAR model for predicting pIC~50~ of chalcone derivatives follows this equation:
[ \text{pIC}{50} = \text{C}0 + \text{C}_1 \times \text{DCW}(\text{T}^, \text{N}^) ]
Where C~0~ represents the regression coefficient, C~1~ denotes the slope (both calculated using the least-squares method), and DCW represents the optimal descriptor of correlation weights [21]. The hybrid optimal descriptor is computed as:
[ {}^{\text{Hybrid}}\text{DCW}(\text{T}^, \text{N}^) = {}^{\text{SMILES}}\text{DCW}(\text{T}^, \text{N}^) + {}^{\text{Graph}}\text{DCW}(\text{T}^, \text{N}^) ]
The SMILES-based descriptor calculation involves the correlation weights of various SMILES attributes, while the graph-based descriptor incorporates structural features from hydrogen-suppressed molecular graphs [21].
Advanced Machine Learning Approaches
Beyond traditional QSAR methods, machine learning algorithms have demonstrated significant potential in anticancer activity prediction. For KRAS inhibitors in lung cancer therapy, multiple algorithms were benchmarked, including Partial Least Squares (PLS), Random Forest (RF), and Genetic Algorithm-optimized Multiple Linear Regression (GA-MLR) [3]. The PLS model exhibited superior predictive performance (R² = 0.851; RMSE = 0.292), followed by RF (R² = 0.796) [3]. Similarly, in flavone derivative studies, Random Forest models achieved R² values of 0.820 for MCF-7 and 0.835 for HepG2 cell lines, with robust cross-validation results [17].
Experimental Results and Validation
Model Performance Metrics
The SMILES-based QSAR model for chalcone derivatives demonstrated exceptional predictive capability. Among the developed models, Split #2 was identified as the best-performing, with the following validation metrics: R²validation = 0.90, IICvalidation = 0.81, and Q²_validation = 0.89 [21]. These values indicate high robustness, precision, and predictive power for estimating anti-colon cancer activity of untested chalcone derivatives.
Table 2: Performance Metrics of QSAR Models for Anticancer Compound Discovery
| Study Focus | Algorithm/Method | R² Training/Validation | Key Validation Metrics | Application Domain |
|---|---|---|---|---|
| Chalcone vs HT-29 [21] | Monte Carlo + IIC | R²_validation = 0.90 | IICvalidation = 0.81, Q²validation = 0.89 | Colon cancer |
| KRAS inhibitors [3] | PLS | R² = 0.851 | RMSE = 0.292 | Lung cancer |
| KRAS inhibitors [3] | Random Forest | R² = 0.796 | - | Lung cancer |
| KRAS inhibitors [3] | GA-MLR | R² = 0.677 | - | Lung cancer |
| Flavones [17] | Random Forest | R² = 0.820 (MCF-7)R² = 0.835 (HepG2) | RMSE~test~ = 0.573 (MCF-7)RMSE~test~ = 0.563 (HepG2) | Breast/Liver cancer |
| Flavones [17] | Random Forest Cross-validation | R²~cv~ = 0.744 (MCF-7)R²~cv~ = 0.770 (HepG2) | - | Breast/Liver cancer |
Mechanistic Interpretation and Promoter Identification
The mechanistic interpretation of QSAR models identified specific structural attributes that significantly influence anti-HT-29 activity [21]. These attributes, classified as "enhancing" or "reducing" promoters, provide crucial insights for rational drug design:
- Enhancing Promoters: Structural features that increase anticancer potency
- Reducing Promoters: Structural features that decrease anticancer activity
Based on these promoters, ten new compounds were selected from the ChEMBL database for pIC~50~ prediction, and molecular docking was performed using the protein with PDB ID:1SA0 [21]. This integrated approach demonstrates how SMILES-based QSAR guides the identification of novel lead compounds with optimized activity profiles.
Experimental Protocols
CORAL Software QSAR Modeling Protocol
Materials and Software Requirements:
- CORAL software (available at: https://sites.google.com/jadavpuruniversity.in/coral/)
- BIOVIA Draw 2019 or equivalent chemical structure drawing tool
- Dataset of chalcone derivatives with experimental IC~50~ values against HT-29 cells
Step-by-Step Procedure:
Structure Representation: Draw all chemical structures using BIOVIA Draw and convert to SMILES notation [21].
Data Preprocessing: Convert IC~50~ values to pIC~50~ using the formula: pIC~50~ = -logIC~50~ [21].
Dataset Splitting: Implement the four-set split protocol in CORAL:
- Training set (≈27%)
- Invisible training set (≈27%)
- Calibration set (≈23%)
- Validation set (≈23%) [21]
Descriptor Calculation:
- Select hybrid descriptor option combining SMILES and graph-based descriptors
- Run Monte Carlo optimization with IIC target function
- Set threshold value (T) and number of epochs (N) for optimization [21]
Model Building:
- Apply correlation weight calculation for SMILES attributes and graph features
- Construct DCW using the formula: ^Hybrid^DCW(T,N) = ^SMILES^DCW(T,N) + ^Graph^DCW(T,N) [21]
- Generate regression equation using least-squares method
Validation:
- Assess model performance using R², IIC, and Q² for validation set
- Verify model robustness through correlation matrices and statistical significance tests [21]
Interpretation:
- Identify enhancing and reducing promoters from SMILES attributes
- Analyze molecular features contributing to anticancer activity [21]
Synthesis Protocol for Chalcone Derivatives
The Claisen-Schmidt condensation remains the most widely used method for synthesizing chalcone derivatives [65] [64]:
Materials:
- Substituted acetophenone derivatives
- Substituted benzaldehyde derivatives
- Anhydrous potassium carbonate or sodium hydroxide catalyst
- Methanol or ethanol solvent
Procedure:
- Dissolve equimolar quantities of acetophenone derivative (e.g., 2-acetylbenzofuran, 2.24 g, 14.0 mmol) and aromatic aldehyde (14.0 mmol) in methanol (25 mL) [63].
Cool the solution to 0-5°C using an ice bath [63].
Add aqueous NaOH solution (1 mol/L, 18 mL) dropwise with continuous stirring [63].
Stir the reaction mixture for 3 hours at room temperature [63].
Allow the solution to stand overnight in a refrigerator [63].
Neutralize with dilute HCl (1% v/v) to precipitate the product [63].
Filter the solid and wash repeatedly with cold water [63].
Recrystallize using an appropriate solvent to obtain pure chalcone derivatives [63].
Alternative Methods:
- Borontrifluoride Etherate Catalysis: Offers high yields, simplified work-up, shorter reaction times, and compatibility with sensitive functional groups [65].
- Suzuki Coupling Reaction: Palladium-catalyzed coupling of cinnamoyl chlorides with phenylboronic acids [65].
- Grinding Technique: Solvent-free, environmentally friendly approach using grinding in the presence of a base [65].
The Scientist's Toolkit: Essential Research Reagents and Materials
Table 3: Essential Research Reagents for Chalcone QSAR and Biological Evaluation
| Reagent/Material | Specification | Application/Function | Example Sources |
|---|---|---|---|
| HT-29 Cell Line | Human colorectal adenocarcinoma cells | In vitro anticancer activity evaluation | ATCC, ECACC |
| MTT Assay Kit | (3-(4,5-Dimethylthiazol-2-yl)-2,5-diphenyltetrazolium bromide) | Cell viability and IC₅₀ determination | Sigma-Aldrich, Thermo Fisher |
| CORAL Software | QSAR modeling package | SMILES-based descriptor calculation and model building | https://sites.google.com/jadavpuruniversity.in/coral/ |
| BIOVIA Draw | Chemical structure drawing software | Molecular structure representation and SMILES generation | Dassault Systèmes |
| ChEMBL Database | Bioactive database | Compound selection and virtual screening | https://www.ebi.ac.uk/chembl/ |
| PDB ID: 1SA0 | Protein structure | Molecular docking studies | Protein Data Bank |
| Dimethyl Sulfoxide (DMSO) | Molecular biology grade | Compound solubilization for biological assays | Sigma-Aldrich, Thermo Fisher |
| 2-Acetylbenzofuran | Synthesis reagent | Chalcone scaffold preparation | Sigma-Aldrich, TCI Chemicals |
| Substituted Benzaldehydes | Synthesis reagents | B-ring modification in chalcones | Sigma-Aldrich, TCI Chemicals |
Pathway and Mechanism Analysis
Chalcone derivatives exert their anticancer effects through multiple mechanisms, as confirmed by experimental studies:
Apoptosis Induction: A synthesized benzofuran ring-linked 3-nitrophenyl chalcone derivative demonstrated potent apoptosis induction in colon cancer cells (HCT-116 and HT-29) through activation of DR-4-mediated apoptosis at the membrane and BCL-2-mediated apoptosis intracellularly [63]. Triple fluorescence staining, flow cytometry caspase 3/7 activity, and protein expression analyses confirmed the apoptotic pathway activation [63].
Cell Cycle Arrest: Treatment with 12.5 μM of the 3-nitrophenyl chalcone derivative for 24 hours statistically significantly arrested the cell cycle at the G0/G1 phase in both HCT-116 and HT-29 cell lines [63].
Anti-metastatic Effects: The chalcone derivative inhibited cell migration and colony formation in a dose-dependent manner, starting from values as low as 1.56 μM [63].
Multi-Target Inhibition: Chalcone-linked acetamide derivatives function as inhibitors of key cancer targets including EGFR, topoisomerase I and II, ABCG2, caspase proteins, and histone deacetylase (HDAC), as well as inhibiting tubulin polymerization [65].
SMILES-based QSAR modeling represents a powerful computational approach for predicting the anti-colon cancer activity of chalcone derivatives against HT-29 cells. The integration of SMILES notation with graph-based descriptors through Monte Carlo optimization enables the development of highly predictive models with validation metrics (R² = 0.90, Q² = 0.89) that support robust activity prediction [21]. The identification of enhancing and reducing promoters provides crucial insights for rational drug design, guiding structural modifications to optimize anticancer potency.
The broader implications for molecular descriptor applications in cancer QSAR studies highlight the significance of hybrid descriptor systems that capture diverse molecular features relevant to biological activity. As computational methodologies continue to advance, integrating SMILES-based QSAR with experimental validation creates a powerful feedback loop for accelerating anticancer drug discovery. The comprehensive framework presented in this technical guide provides researchers with validated protocols and analytical approaches for advancing chalcone-based therapeutics targeting colon cancer.
The Kirsten rat sarcoma viral oncogene homolog (KRAS) is one of the most frequently mutated oncogenes in non-small cell lung cancer (NSCLC), yet its historical classification as "undruggable" has posed a significant therapeutic challenge [3] [68]. Quantitative Structure-Activity Relationship (QSAR) modeling has emerged as a powerful computational approach to overcome these limitations by establishing predictive relationships between chemical structure and biological activity [69]. The integration of genetic algorithms (GAs) for descriptor optimization represents a paradigm shift in QSAR modeling, enabling more efficient navigation of vast chemical spaces to identify novel KRAS inhibitors with improved potency and selectivity [3] [70]. This technical guide explores the methodology, applications, and implementation of GA-optimized descriptor selection within the broader context of molecular descriptor applications in cancer QSAR studies, providing researchers with a comprehensive framework for accelerating anti-cancer drug discovery.
Theoretical Foundations: Molecular Descriptors in Cancer QSAR
The Role of Molecular Descriptors in Drug Design
Molecular descriptors are numerical representations of molecular structures that encode essential chemical information for predictive modeling [69]. In the context of cancer drug discovery, these descriptors quantitatively characterize structural features that influence biological activity, enabling the prediction of anti-cancer potency before synthesis [71] [67]. Descriptors span multiple dimensions of chemical structure, including:
- Topological descriptors: Encoding molecular connectivity patterns and branching [67]
- Constitutional descriptors: Representing atom and bond counts, molecular weight [3]
- Electronic descriptors: Characterizing charge distribution and reactivity [69]
- Geometrical descriptors: Describing molecular size and shape [3]
The fundamental QSAR relationship can be expressed as: Biological Activity = f(D₁, D₂, D₃, ... Dₙ) Where D₁, D₂, D₃, ... Dₙ represent the molecular descriptors that quantitatively define the chemical structure [69].
Current Challenges in KRAS Targeting
KRAS mutations are key oncogenic drivers in lung cancer, associated with aggressive tumor phenotypes and resistance to targeted therapies [3]. The development of direct KRAS inhibitors has been challenging due to the protein's high affinity for GTP/GDP and the absence of easily targetable binding sites [3] [68]. While recent covalent inhibitors targeting the KRAS G12C mutation (e.g., sotorasib, adagrasib) have demonstrated clinical efficacy, most KRAS mutations beyond G12C remain therapeutically elusive [3] [68]. Computational approaches like QSAR modeling provide a promising avenue for identifying novel chemical scaffolds and mechanisms of inhibition to address these limitations.
QSAR Model Development with Genetic Algorithm Optimization
Computational Workflow
The integration of genetic algorithms into QSAR modeling establishes a robust framework for descriptor selection and model optimization. The following diagram illustrates the complete experimental workflow:
Figure 1: QSAR Model Development Workflow with GA Optimization
Dataset Curation and Preparation
The initial phase involves compiling a comprehensive dataset of known KRAS inhibitors with experimentally measured biological activities [3]:
- Source: ChEMBL database (CHEMBL ID: CHEMBL4354832)
- Compounds: 62 KRAS inhibitors with documented IC₅₀ values
- Activity Transformation: IC₅₀ values converted to pIC₅₀ using: pIC₅₀ = -log₁₀(IC₅₀ × 10⁻⁹)
- Standardization: Removal of duplicates and structural standardization
- Dataset Division: 70% training set, 30% test set (stratified sampling)
This curated dataset serves as the foundation for descriptor calculation and model training, ensuring data quality and consistency [3].
Molecular Descriptor Calculation and Preprocessing
Molecular descriptors are calculated using computational packages such as Chemopy in Python, generating a diverse set of molecular features [3]:
Table 1: Categories of Molecular Descriptors for KRAS Inhibitor Profiling
| Descriptor Category | Representative Descriptors | Structural Information Encoded |
|---|---|---|
| Topological | Wiener index, Zagreb index, connectivity indices | Molecular branching, connectivity patterns, molecular complexity |
| Constitutional | Molecular weight, atom counts, bond counts | Basic structural composition and properties |
| Geometrical | Principal moments of inertia, molecular surface area | 3D molecular size, shape, and spatial arrangement |
| Electronic | Partial charges, HOMO/LUMO energies, dipole moment | Charge distribution, reactivity, intermolecular interactions |
Following descriptor calculation, preprocessing is critical for model robustness [3]:
- Descriptor filtering: Removal of non-numeric descriptors and those with missing values
- Standardization: Centering to mean and scaling to unit variance
- Correlation filtering: Elimination of highly correlated descriptors (Pearson's |r| > 0.95)
- Dimensionality reduction: Selection of top 50 features with highest variance
Genetic Algorithm for Descriptor Optimization
Genetic algorithms provide an efficient approach for navigating the high-dimensional descriptor space. The GA implementation follows these computational steps:
Figure 2: Genetic Algorithm Optimization Process
The fitness function for the GA is designed to maximize predictive performance while penalizing model complexity [3]:
Fitness = R²adj - k/n
Where:
- R²adj = Adjusted R-squared of the model with selected descriptors
- k = Number of selected descriptors
- n = Number of training samples
GA parameters typically include [3]:
- Population size: 50-200 individuals
- Generations: 50-100 iterations
- Selection method: Tournament selection
- Crossover rate: 0.7-0.9
- Mutation rate: 0.05-0.2
- Stopping criteria: 10 consecutive generations without improvement
Model Development and Validation
Multiple machine learning algorithms are employed to develop predictive QSAR models using GA-optimized descriptors [3]:
Table 2: Performance Comparison of Machine Learning Algorithms in KRAS QSAR Modeling
| Algorithm | R² (Training) | R² (Test) | RMSE | MAE | Key Advantages |
|---|---|---|---|---|---|
| PLS | 0.880 | 0.851 | 0.292 | 0.241 | Handles multicollinearity, robust with limited samples |
| Random Forest | 0.925 | 0.796 | 0.358 | 0.295 | Non-parametric, handles non-linear relationships |
| GA-MLR | 0.820 | 0.677 | 0.421 | 0.351 | Interpretable, linear coefficients for descriptor importance |
| XGBoost | 0.912 | 0.745 | 0.389 | 0.321 | High performance, regularization prevents overfitting |
Model validation follows stringent protocols to ensure predictive reliability [69]:
- Internal validation: 5-fold or 10-fold cross-validation
- External validation: Performance on held-out test set (30% of data)
- Y-randomization: Confirmation that models don't result from chance correlation
- Applicability domain: Assessment using Mahalanobis Distance to identify compounds within model scope
The domain of applicability is defined using [3]: D² = (x - μ)ᵀΣ⁻¹(x - μ) Where μ is the mean vector and Σ is the covariance matrix of the normalized training set.
Advanced Applications and Case Studies
Virtual Screening and De Novo Design
The validated QSAR models enable virtual screening of compound libraries and de novo design of novel KRAS inhibitors [3]. Implementation using DataWarrior software includes:
- Seed molecule selection: Compound with known KRAS inhibitory profile
- Evolutionary design: Random chemical transformations (atom substitutions, bond rearrangements, ring modifications)
- Multi-objective optimization: Drug-likeness, pharmacophore alignment, 3D shape similarity
- Similarity metrics: SkelSpheres similarity (topological) and Flexophore similarity (3D pharmacophore)
This approach identified compound C9 with predicted pIC₅₀ of 8.11 as the most promising hit [3].
Integration with Advanced Genetic Algorithm Frameworks
Recent advancements in genetic algorithm applications have demonstrated significant improvements in molecular optimization:
- DGMM Framework: Deep Genetic Molecule Modification algorithm integrating variational autoencoders with scaffold constraints, showing 100-fold increase in biological activity for ROCK2 inhibitors [70]
- Gradient GA: Incorporates gradient information from neural network-parameterized objectives, achieving 25% improvement in top-10 scores over traditional GA [72]
- REvoLd: Evolutionary algorithm for ultra-large library screening demonstrating 869-1622× improvement in hit rates compared to random selection [73]
Addressing KRAS Resistance Mechanisms
Recent research has identified resistance mechanisms to KRAS G12C inhibitors, including adaptive mechanisms and increased KRAS-GTP loading [68]. QSAR models incorporating descriptors that capture interactions with both inactive (OFF) and active (ON) states of KRAS provide strategies to overcome these resistance mechanisms through compounds like RMC-6291 that target the GTP-bound state [68].
Table 3: Essential Research Tools for GA-Optimized QSAR Studies
| Resource Category | Specific Tools/Software | Key Functionality |
|---|---|---|
| Compound Databases | ChEMBL, PubChem, ZINC | Source of known active compounds and building blocks for virtual screening |
| Descriptor Calculation | Chemopy, RDKit, PaDEL | Computation of molecular descriptors from chemical structures |
| Genetic Algorithm Implementation | DEAP, JGAP, Custom Python/R scripts | Optimization of descriptor selection and molecular evolution |
| Machine Learning Libraries | scikit-learn, XGBoost, RandomForest | QSAR model development and validation |
| Cheminformatics Platforms | DataWarrior, Schrödinger Suite, OpenBabel | Molecular visualization, property calculation, and dataset curation |
| Specialized Docking | RosettaLigand (REvoLd), AutoDock Vina | Structure-based validation and binding mode analysis |
| Validation Tools | QSAR-Co, Model applicability domain assessment | Model validation and reliability estimation |
The integration of genetic algorithms with QSAR modeling represents a powerful paradigm for KRAS inhibitor development in lung cancer therapeutics. By efficiently navigating the complex landscape of molecular descriptors, this approach accelerates the identification of novel chemical entities with optimal binding characteristics and drug-like properties. The methodology outlined in this technical guide provides researchers with a comprehensive framework for implementing GA-optimized QSAR models, from initial dataset curation through virtual screening and experimental validation. As resistance mechanisms to current KRAS inhibitors emerge, these computational approaches will play an increasingly critical role in developing next-generation therapeutics that target both canonical and non-canonical KRAS states. The continued advancement of genetic algorithm methodologies, including gradient-based optimization and deep learning integration, promises to further enhance the efficiency and predictive power of QSAR-guided drug discovery for oncology applications.
In modern anticancer drug discovery, the integration of Quantitative Structure-Activity Relationship (QSAR) modeling, molecular docking, and ADMET (Absorption, Distribution, Metabolism, Excretion, and Toxicity) profiling has created a powerful paradigm for rational drug design. This multidisciplinary approach addresses the critical challenges of high attrition rates, drug resistance, and the substantial costs associated with conventional drug development [74]. By leveraging molecular descriptors that quantitatively represent structural and electronic properties of compounds, researchers can establish robust relationships between chemical structure and biological activity, then validate these predictions through binding affinity analysis and pharmacokinetic profiling [75].
The context of cancer research presents unique opportunities for these integrated approaches, particularly through the identification of key molecular descriptors that govern compound behavior against specific oncological targets. As demonstrated in recent studies, descriptors such as absolute electronegativity (χ) and water solubility (LogS) have been shown to significantly influence inhibitory activity against breast cancer targets, while topological and quantum chemical descriptors provide critical insights into structure-activity relationships [75] [52]. This technical guide examines the methodologies, applications, and implementation frameworks for combining these computational techniques, with a specific focus on their role in accelerating the development of targeted cancer therapeutics.
Molecular Descriptors in Cancer QSAR Studies: Fundamental Concepts
Molecular descriptors serve as the foundational elements in QSAR modeling, providing quantitative parameters that encode structural, topological, and electronic information about chemical compounds. In cancer research, these descriptors enable the prediction of biological activity against specific oncological targets through mathematical relationships derived from experimentally validated compounds.
Table 1: Key Molecular Descriptor Categories in Cancer QSAR Studies
| Descriptor Category | Specific Examples | Biological Significance in Cancer | Application Context |
|---|---|---|---|
| Electronic Descriptors | EHOMO, ELUMO, Absolute Electronegativity (χ), Absolute Hardness (η) | Influences binding interactions with cancer target binding sites | Tubulin inhibition in breast cancer [75] |
| Topological Descriptors | Molecular Weight (MW), Balaban Index (J), Wiener Index (WI) | Correlates with membrane permeability and bioavailability | Aromatase inhibition in breast cancer [74] |
| Hydrophobic Descriptors | LogP, LogS, Polar Surface Area (PSA) | Predicts solubility and absorption characteristics | Tankyrase inhibition in colon cancer [55] |
| Geometric Descriptors | Molecular Topological Index (MTI), Shape Coefficient (I) | Relates to steric complementarity with target proteins | DNA gyrase inhibition in E. coli [76] |
| Quantum Chemical Descriptors | Dipole Moment (μm), Total Energy (TE), Reactivity Index (ω) | Determines reactivity and interaction energies | Topoisomerase IIα inhibition in breast cancer [77] |
The strategic selection of appropriate descriptors is critical for developing predictive QSAR models. Recent advancements have introduced receptor-dependent 4D-QSAR approaches that integrate ligand-target interaction (LTI) information as descriptors, overcoming key limitations of traditional QSAR methods, particularly with small datasets [35]. In angiogenesis receptor modulation studies, these LTI-derived descriptors have demonstrated superior performance compared to conventional 2D-QSAR approaches, achieving accuracy exceeding 70% across multiple receptor classes including VEGFR2, FGFR1-4, and EGFR [35].
Integrated Methodological Framework: From QSAR to ADMET
The power of integrated computational approaches lies in the sequential application of complementary techniques that progressively filter and optimize candidate compounds. The standard workflow begins with QSAR modeling to identify promising structural features, proceeds to molecular docking to validate target engagement, incorporates ADMET profiling to assess drug-likeness, and culminates in molecular dynamics simulations to confirm binding stability.
Figure 1: Integrated computational workflow for anticancer drug discovery, combining sequential filtering approaches to identify optimized lead candidates.
QSAR Model Development Protocol
The development of robust QSAR models requires meticulous attention to dataset curation, descriptor calculation, and statistical validation. A representative protocol for QSAR model construction is outlined below:
Dataset Compilation: Curate a structurally diverse set of compounds with experimentally determined biological activities (e.g., IC₅₀ values) against the cancer target of interest. For instance, in a breast cancer study focusing on tubulin inhibitors, 32 1,2,4-triazine-3(2H)-one derivatives with inhibitory efficacy against MCF-7 cells were compiled [75].
Data Preprocessing: Convert concentration values (IC₅₀) to pIC₅₀ (-logIC₅₀) to normalize the distribution. Implement an 80:20 ratio for dividing the dataset into training and test sets, ensuring representative chemical diversity in both subsets [75].
Descriptor Calculation: Compute molecular descriptors using computational chemistry software. For electronic descriptors, employ Density Functional Theory (DFT) with B3LYP functional and 6-31G (p, d) basis set using Gaussian 09W. For topological descriptors, utilize ChemOffice software to calculate parameters including Molecular Weight, LogP, LogS, and Polar Surface Area [75].
Descriptor Selection and Model Building: Apply Principal Component Analysis (PCA) to reduce descriptor dimensionality and eliminate multicollinearity. Develop the QSAR model using Multiple Linear Regression (MLR) with descendent selection and variable removal techniques implemented in statistical software such as XLSTAT [75].
Model Validation: Validate model performance using both internal (cross-validation with Q²) and external validation (test set prediction with R²test) parameters. The model should achieve Q² > 0.5 and R²test > 0.6 to be considered predictive [75] [21].
Advanced QSAR approaches are increasingly incorporating machine learning algorithms and alternative descriptor systems. For example, Monte Carlo-based methods using SMILES notation and graph-based descriptors implemented in CORAL software have demonstrated excellent predictive capability for chalcone derivatives against colon cancer HT-29 cells, with validation R² values reaching 0.90 [21].
Molecular Docking Methodology
Molecular docking simulations predict the optimal binding orientation and affinity of compounds within target binding sites. The standard protocol includes:
Protein Preparation: Obtain the 3D structure of the target protein from the Protein Data Bank (e.g., PDB ID:1SA0 for colon cancer targets). Remove native ligands and water molecules, add hydrogen atoms, and assign partial charges using tools like AutoDock [21].
Ligand Preparation: Generate 3D structures of compounds and optimize their geometry using molecular mechanics force fields. Assign flexible torsional bonds to allow conformational exploration during docking [76].
Docking Simulation: Define the binding site coordinates based on known ligand positions or functional domains. For tubulin inhibitors, the colchicine binding site represents the target interface. Employ Lamarckian genetic algorithms with population sizes of 150-200 individuals and 10-100 million energy evaluations [75] [52].
Interaction Analysis: Identify specific hydrogen bonds, hydrophobic interactions, salt bridges, and π-π stacking with key amino acid residues. For DNA gyrase B inhibitors, critical interactions include hydrogen bonds with Asn104, Asn274, and Ser70 residues [76].
ADMET Profiling Protocol
ADMET prediction provides critical insights into the pharmacokinetic and safety profiles of candidate compounds:
Absorption Prediction: Calculate Polar Surface Area (PSA), LogP, and water solubility (LogS) to predict intestinal absorption. Compounds with PSA < 140Ų and LogP between 1-5 typically exhibit good absorption [75] [37].
Distribution and Metabolism: Predict plasma protein binding, blood-brain barrier penetration, and cytochrome P450 enzyme interactions using precomputed models in tools like SwissADME or admetSAR [55].
Toxicity Assessment: Evaluate mutagenicity, carcinogenicity, and hepatotoxicity using structural alert systems and machine learning models. For naphthoquinone derivatives, specific substructures associated with reactive oxygen species generation require careful assessment [77].
Molecular Dynamics and Binding Free Energy Calculations
Molecular dynamics (MD) simulations provide insights into the stability and dynamics of protein-ligand complexes under physiologically relevant conditions:
System Preparation: Solvate the protein-ligand complex in an explicit water model (e.g., TIP3P) and add counterions to neutralize the system charge [74].
Equilibration Protocol: Perform energy minimization followed by gradual heating to 310K and equilibration at constant pressure (1 atm) using software such as GROMACS or AMBER [75].
Production Simulation: Conduct unrestrained MD simulations for a minimum of 100ns, recording trajectories at 10-100ps intervals. For tankyrase inhibitors, 300ns simulations have been employed to thoroughly assess complex stability [55] [77].
Trajectory Analysis: Calculate Root Mean Square Deviation (RMSD), Root Mean Square Fluctuation (RMSF), and binding free energies using MM-PBSA/GBSA methods. Stable complexes typically exhibit ligand RMSD < 0.3 nm [75] [52].
Case Studies in Cancer Drug Discovery
Breast Cancer: Tubulin Inhibitors
In a comprehensive study of 1,2,4-triazine-3(2H)-one derivatives as tubulin inhibitors for breast cancer therapy, researchers developed a QSAR model with impressive predictive accuracy (R² = 0.849). The model identified absolute electronegativity (χ) and water solubility (LogS) as the most significant descriptors influencing inhibitory activity [75] [52]. Molecular docking revealed compound Pred28 with the highest binding affinity (-9.6 kcal/mol), forming multiple hydrogen bonds with the tubulin colchicine binding site. Subsequent 100ns molecular dynamics simulations confirmed the stability of the Pred28-tubulin complex, with RMSD values of approximately 0.29 nm, indicating a tightly bound conformation [52]. ADMET profiling demonstrated favorable drug-likeness properties, suggesting promising therapeutic potential.
Colon Cancer: Tankyrase Inhibitors
For colon adenocarcinoma targeting tankyrase inhibitors, researchers implemented a machine learning-assisted QSAR model trained on 1100 compounds from the ChEMBL database. The model incorporated 2D and 3D molecular descriptors to predict inhibitory activity against TNKS2, a key regulator in the Wnt/β-catenin signaling pathway [55]. Top-ranked compounds from QSAR screening underwent molecular docking, revealing strong interactions with the ankyrin repeat domain of tankyrase. Network pharmacology analysis further elucidated the polypharmacological effects of tankyrase inhibition across multiple cancer-related pathways. The integrated approach successfully identified novel chemotypes with potential for targeting APC-mutant colorectal cancers.
Multi-Target Approaches in Angiogenesis Modulation
A novel receptor-dependent 4D-QSAR approach addressed the challenge of small datasets in multi-target anticancer drug discovery. By incorporating ligand-target interaction fingerprints as molecular descriptors across multiple angiogenesis receptors (VEGFR2, FGFR1-4, EGFR, PDGFR), researchers developed models that significantly outperformed traditional 2D-QSAR, achieving >70% accuracy even with datasets containing fewer than 30 compounds [35]. This approach demonstrated robust predictive power across varying receptor classes under consistent assay conditions, highlighting the value of interaction-derived descriptors for rational multi-target drug design in oncology.
Table 2: Performance Metrics of Integrated Approaches in Cancer Drug Discovery
| Cancer Type | Molecular Target | QSAR Model Performance | Docking Affinity Range (kcal/mol) | MD Simulation Stability (RMSD in nm) | Key Optimized Descriptors |
|---|---|---|---|---|---|
| Breast Cancer [75] [52] | Tubulin | R² = 0.849, Q² = 0.79 | -7.2 to -9.6 | 0.29-0.35 | Absolute Electronegativity, LogS |
| Colon Cancer [21] | HT-29 Cell Line | R²_validation = 0.90, Q² = 0.89 | Not Specified | Not Specified | SMILES-based Hybrid Descriptors |
| Colon Cancer [55] | Tankyrase (TNKS2) | Accuracy = 85.7%, Specificity = 84.2% | -9.1 to -11.8 | <0.25 (300ns simulation) | 2D/3D Molecular Descriptors |
| Antibacterial Cancer Therapy [76] | DNA Gyrase B | Q² = 0.73 (CoMFA), Q² = 0.88 (CoMSIA) | -7.9 to -10.2 | Not Specified | Steric, Electrostatic Fields |
| Breast Cancer [77] | Topoisomerase IIα | R² = 0.85-0.94 (across splits) | -9.3 to -11.5 | <0.3 (300ns simulation) | SMILES and Graph Descriptors |
Table 3: Essential Research Reagents and Computational Tools for Integrated Approaches
| Tool Category | Specific Software/Tools | Key Functionality | Application Example |
|---|---|---|---|
| Descriptor Calculation | Gaussian 09W, ChemOffice, Dragon | Computation of electronic, topological descriptors | DFT calculations for quantum chemical descriptors [75] |
| QSAR Modeling | CORAL, XLSTAT, WEKA | Model development, validation, and descriptor selection | Monte Carlo optimization with SMILES descriptors [21] |
| Molecular Docking | AutoDock, GOLD, Glide | Protein-ligand docking, binding pose prediction | Virtual screening of tankyrase inhibitors [55] |
| ADMET Prediction | SwissADME, admetSAR, ProTox | Pharmacokinetic and toxicity profiling | Drug-likeness assessment of naphthoquinones [77] |
| Molecular Dynamics | GROMACS, AMBER, NAMD | Simulation of biomolecular systems, trajectory analysis | 100-300ns MD simulations of protein-ligand complexes [75] [77] |
| Data Resources | ChEMBL, PubChem, PDB | Bioactivity data, compound structures, protein targets | Sourcing tankyrase inhibitors from ChEMBL [55] |
The integration of QSAR modeling, molecular docking, and ADMET profiling represents a transformative approach in cancer drug discovery, efficiently bridging the gap between initial compound identification and preclinical development. By leveraging molecular descriptors that encode critical structural and electronic information, researchers can establish predictive relationships that guide the rational design of targeted therapeutics with optimized efficacy and safety profiles.
Future directions in this field point toward increased incorporation of artificial intelligence and machine learning algorithms to enhance model predictability, particularly for complex multi-target therapies [71] [55]. Additionally, the emergence of 4D-QSAR approaches that incorporate ligand-target interaction information addresses fundamental limitations of conventional methods, especially for small datasets commonly encountered in novel target discovery [35]. The continuing expansion of public bioactivity databases and improvements in computing power will further accelerate these integrated approaches, ultimately strengthening their role in delivering novel cancer therapeutics with improved clinical translation success rates.
The methodological framework presented in this technical guide provides researchers with a comprehensive roadmap for implementing these powerful computational strategies, with the ultimate goal of streamlining the anticancer drug discovery pipeline from initial design to experimental validation.
Navigating QSAR Challenges: Applicability Domains and Model Optimization Strategies
In the field of cancer research, Quantitative Structure-Activity Relationship (QSAR) models have become indispensable tools for accelerating the discovery of novel therapeutic agents. These models mathematically correlate the chemical structures of compounds with their biological activities against specific cancer targets, enabling the in silico prediction of compound efficacy before costly and time-consuming laboratory experiments. However, a fundamental limitation of any QSAR model is that it is not universally applicable; its predictive reliability is intrinsically linked to the chemical space of the compounds used for its development. The Applicability Domain (AD) is a theoretical region in the chemical space defined by the model's descriptors and the modeled response, establishing the boundaries within which the model provides reliable predictions [78].
According to the Organization for Economic Co-operation and Development (OECD) principles, the definition of an AD is a mandatory requirement for any validated QSAR model [79] [80]. This is particularly crucial in an oncological context, where researchers increasingly utilize QSAR models to identify inhibitors for specific cancer-related targets such as tankyrase in colon adenocarcinoma [55], 17β-HSD3 in prostate cancer [81], and various angiogenesis receptors [35]. Without a clearly defined AD, predictions for compounds outside this domain can be misleading, potentially derailing drug discovery pipelines. The AD acts as a reliability filter, ensuring that predictions are made only for compounds that are sufficiently similar to those in the model's training set, thereby safeguarding against erroneous conclusions in critical cancer drug development efforts [78].
Theoretical Foundations: Key Concepts and Terminology
The OECD Principle and the "X" and "Y" Outliers
The OECD's third principle explicitly states that a QSAR model must have "a defined domain of applicability" [80]. This principle acknowledges that the generalization ability of a model is finite and must be documented for regulatory acceptance and reliable application [78] [80]. In practical terms, when a query compound is submitted to a QSAR model, the AD serves as a binary classifier that determines whether the prediction falls within the model's reliable scope.
This process introduces two critical types of outliers that define the boundaries of model reliability [79]:
- X-outliers: Compounds that are structurally or descriptor-wise different from the training set chemicals. They reside outside the model's chemical space, making their predictions inherently unreliable.
- Y-outliers: Compounds that, while structurally similar to the training set (X-inliers), have prediction errors that are unacceptably high. These are typically identified by a large residual between the predicted and actual activity value.
The Three Aspects of Applicability Domain
Hanser et al. further refined the concept of AD by highlighting three distinct but interrelated aspects [79]:
- Applicability: This aspect confirms that the test compound is drawn from the same underlying distribution as the training set molecules.
- Reliability: This evaluates the local data density around the test compound, ensuring it is high enough for a confident prediction.
- Decidability: This reflects the confidence of the prediction itself, often related to the performance of the underlying machine learning algorithm.
A robust AD definition should ideally satisfy all three criteria to ensure trustworthy predictions [79].
Methodological Approaches for Defining the Applicability Domain
Various methodological approaches have been developed to define the AD of QSAR models, each with its own strengths and limitations. These methods can be broadly categorized into several classes.
Table 1: Classification of Key AD Definition Methods
| Method Category | Representative Methods | Underlying Principle | Key Advantages | Key Limitations |
|---|---|---|---|---|
| Range-Based | Bounding Box [80], PCA Bounding Box [80] | Defines a p-dimensional hyper-rectangle based on min/max descriptor values. | Simple, intuitive, fast to compute. | Cannot identify empty regions or account for descriptor correlations. |
| Geometric | Convex Hull [80] | Finds the smallest convex polygon containing all training points. | Precisely defines the outer boundaries. | Computationally intensive for high dimensions; ignores internal density. |
| Distance-Based | Leverage [79] [80], k-Nearest Neighbors (kNN) [79] [82], Mahalanobis Distance [78] | Measures the distance of a query compound from a reference point (e.g., centroid) or its nearest neighbors in the training set. | Accounts for data distribution; leverage includes descriptor correlation. | Threshold selection is critical and often arbitrary. |
| Statistical/Probabilistic | One-Class SVM [79], Probability Density Distribution [80] | Models the training set distribution to define dense regions of chemical space. | Can model complex, non-uniform distributions. | Can be complex to implement and tune. |
| Machine Learning-Dependent | Gaussian Process Regression (GPR) [82], Random Forest Confidence | Uses the inherent uncertainty estimates of the specific ML algorithm. | Tightly integrated with the model's prediction mechanics. | Method-specific; not universally applicable. |
Universal vs. Model-Dependent Approaches
A key distinction in AD methods is between universal and model-dependent approaches. Universal AD methods, such as Bounding Box, Leverage, and k-Nearest Neighbors, can be applied on top of any QSAR model, regardless of the underlying machine learning algorithm [79] [82]. In contrast, ML-dependent AD methods are integral parts of specific machine learning methods, such as the confidence estimates from Gaussian Process Regression, which provide a natural uncertainty measure for each prediction [79].
Practical Implementation and Workflow
Implementing a robust AD assessment involves a structured workflow that integrates seamlessly with the QSAR model development process.
A Standardized Workflow for AD Implementation
The following diagram illustrates a generalized workflow for incorporating AD assessment into a QSAR modeling pipeline, particularly in a cancer research context.
Diagram Title: QSAR-AD Assessment Workflow
Detailed Experimental Protocols
Protocol 1: Defining AD using the Leverage Method
The Leverage method is based on the Mahalanobis distance and is a widely used distance-based approach [79] [80].
- Input Requirements: A training set descriptor matrix ( X ) of size ( n \times p ), where ( n ) is the number of compounds and ( p ) is the number of descriptors. A query compound's descriptor vector ( x_i ).
- Calculation:
- Compute the "hat matrix": ( H = X(X^TX)^{-1}X^T ).
- The leverage ( hi ) for a compound ( i ) is the corresponding diagonal element of the hat matrix: ( hi = xi^T(X^TX)^{-1}xi ) [79].
- Threshold Definition:
- Decision Rule: If ( h_i > h^* ), the compound is considered an X-outlier (outside the AD); otherwise, it is an X-inlier (within the AD).
Protocol 2: Defining AD using the k-Nearest Neighbors (kNN) Approach
This method assesses the distance of a query compound to its nearest neighbors in the training set [79] [82].
- Input Requirements: Standardized descriptor matrix for the training set. Descriptor vector for the query compound. Value of ( k ) (often ( k = 1 )).
- Calculation:
- Calculate the Euclidean distance from the query compound to all compounds in the training set.
- Identify the ( k ) smallest distances (i.e., the ( k )-nearest neighbors).
- Let ( d ) be the average or the maximum of these ( k ) distances.
- Threshold Definition:
- Calculate the average ( \langle y \rangle ) and standard deviation ( \sigma ) of the Euclidean distances between all nearest neighbors in the training set.
- A standard threshold is ( D_c = \langle y \rangle + Z\sigma ), where ( Z ) is an empirical parameter, often set to 0.5 [79].
- Like with Leverage, an optimal threshold ( Dc ) can be found via cross-validation (denoted as Z-1NNcv) [79].
- Decision Rule: If ( d > D_c ), the compound is an X-outlier; otherwise, it is an X-inlier.
Performance Metrics for AD Methods
The performance of an AD definition is typically evaluated using metrics that quantify its ability to filter out unreliable predictions while maintaining sufficient coverage [79].
Table 2: Key Performance Metrics for Evaluating Applicability Domain Definitions
| Metric | Definition | Interpretation in Cancer QSAR |
|---|---|---|
| Coverage | The percentage of test compounds identified as X-inliers. | A very low coverage makes the model impractical, while 100% coverage is unrealistic. A balance must be struck. |
| Effectiveness | The improvement in model performance (e.g., R², RMSE) within the AD compared to the entire test set. | Measures the practical benefit of applying the AD. A good AD should significantly lower prediction errors for inliers. |
| Sensitivity in Detecting Y-outliers | The ability to correctly identify compounds with high prediction error as outside the AD. | Crucial for flagging predictions that, even if structurally seemingly similar, are likely to be wrong. |
| Ability to Reject Wrong Reaction Types | Specific to reaction-based models (QRPR), the ability to exclude reactions with different mechanisms [79]. | In medicinal chemistry, this translates to excluding compounds with different modes of action or scaffold hops that invalidate the model. |
Case Studies in Cancer Research
Case Study 1: Anti-Colon Cancer Chalcone Derivatives
A 2025 study developed a QSAR model for 193 chalcone derivatives with activity against the HT-29 human colon adenocarcinoma cell line [21]. The model was built using CORAL software, which employs Monte Carlo optimization to calculate optimal descriptors from SMILES notation and molecular graphs.
- AD Relevance: The robustness of the model was critically dependent on the chemical space defined by these chalcone derivatives. The model's promoters (structural features that increase or decrease activity) implicitly defined its AD. When ten new compounds were selected from the ChEMBL database for prediction, their reliability was contingent on their similarity to the training set's chemical space as captured by these promoters [21].
- Application: The use of such a model for virtual screening of large chemical databases must be accompanied by an AD check to ensure that only predictions for true chalcone-like compounds, within the descriptor space of the training set, are considered reliable.
Case Study 2: Tankyrase Inhibitors for Colon Adenocarcinoma
Sharma and Arumugam (2025) built a machine learning-assisted QSAR model to identify tankyrase inhibitors (TNKS2), a target in the Wnt signaling pathway for colorectal cancer [55]. They curated a dataset of 1,100 inhibitors from the ChEMBL database.
- AD Implementation: The study emphasized data pre-processing and curation as a foundational step for defining a meaningful chemical space. The dataset was cleaned by removing entries with missing IC₅₀ values and non-canonical SMILES, and compounds were categorized into active, inactive, and intermediate classes based on IC₅₀ thresholds [55].
- Impact: This careful curation itself defines a preliminary AD. The resulting model, which used 2D and 3D molecular descriptors, could then be applied to new compounds with the understanding that its predictions are most reliable for compounds structurally and pharmacologically similar to this pre-processed set. The study highlights that the accuracy and generalizability of a cancer QSAR model are directly tied to the quality and scope of its underlying data [55].
Case Study 3: 17β-HSD3 Inhibitors for Prostate Cancer
A QSAR study on 35 inhibitors of 17β-HSD3, a target for prostate cancer therapy, utilized a combination of Genetic Algorithm (GA) for feature selection and Support Vector Machine (SVM) for modeling [81].
- Data Splitting for AD: The training and test sets were divided using hierarchical clustering, a technique that ensures the test set is representative of the structural diversity present in the training set [81]. This is a proactive strategy for AD management, as it helps ensure that the test compounds are, by design, within the model's chemical space, leading to a more realistic evaluation of its predictive power.
- Model Validation: The model was validated both internally (leave-one-out cross-validation, ( Q^2 = 0.674 )) and externally (test set prediction, ( R^2_{Test} = 0.823 )), confirming its predictive robustness within its defined domain [81].
The Scientist's Toolkit: Essential Research Reagent Solutions
Table 3: Key Software and Tools for QSAR and Applicability Domain Analysis
| Tool / Resource | Type | Primary Function in QSAR/AD | Relevance to Cancer Research |
|---|---|---|---|
| CORAL Software [21] | Standalone Software | QSAR modeling using SMILES and graph-based descriptors via Monte Carlo optimization. | Used to model anti-colon cancer activity of chalcones; defines AD via correlation weights of promoters. |
| CIMtools [82] | Computational Library (Python) | Provides featurization for chemical reactions and implementations of AD methods (Leverage, Bounding Box, etc.). | Essential for extending AD concepts from molecules (QSAR) to chemical reactions (QRPR) in drug metabolism studies. |
| Dragon [81] | Descriptor Calculation Software | Calculates thousands of molecular descriptors (0D-3D) from chemical structures. | Used in prostate cancer inhibitor studies to generate a comprehensive descriptor pool for model development. |
| ChEMBL Database [35] [55] | Bioactivity Database | Public repository of bioactive molecules with drug-like properties and curated bioactivity data. | Primary source for extracting curated datasets of inhibitors for cancer targets (e.g., Tankyrase, Angiogenesis Receptors). |
| AutoDock [35] | Molecular Docking Tool | Predicts how small molecules bind to a protein target. | Used in conjunction with QSAR to validate predictions and study binding modes, enriching the AD with structural insights. |
Defining the Applicability Domain is not an optional step but a core component of rigorous QSAR modeling, especially in the high-stakes field of cancer drug discovery. It is the critical safeguard that ensures predictions are made with an understood level of reliability, preventing the misallocation of resources based on extrapolations into unknown chemical space. As evidenced by case studies across various cancers, from colon to prostate, the methods for defining the AD—whether leverage, k-nearest neighbors, or model-specific uncertainty estimates—provide a necessary framework for quantifying prediction confidence.
The ongoing integration of more complex machine learning models and the analysis of intricate biological targets like tankyrase and angiogenesis receptors will only increase the importance of robust AD definitions. Future advancements will likely focus on developing more nuanced, probabilistic AD methods that can better handle the multi-modal and high-dimensional chemical spaces being explored in modern oncology. For researchers, a thorough understanding and implementation of AD is paramount for the credible application of in silico predictions in the rational design of novel anti-cancer therapeutics.
The predictive power of a Quantitative Structure-Activity Relationship (QSAR) model in cancer research is fundamentally constrained by the quality of the underlying data. This technical guide details rigorous protocols for addressing data quality issues—specifically through cleaning, standardization, and handling missing values—within the context of developing QSAR models for cancer therapeutics. We emphasize the critical interplay between high-quality data and the reliability of molecular descriptors, which are numerical representations of chemical structures used to predict biological activity. By providing structured methodologies, visual workflows, and a curated toolkit for researchers, this whitepaper aims to establish robust foundational practices for data curation in computational oncology.
In the pursuit of novel oncology drugs, QSAR modeling has become an indispensable tool for predicting the biological activity and properties of chemical compounds based on their molecular structures [15]. The core premise of QSAR is that a mathematical relationship can be established between molecular descriptors—quantitative measures of a compound's structural, physicochemical, and electronic properties—and a biological endpoint, such as inhibitory potency (e.g., IC50 or pIC50) against a specific cancer target [55] [3].
The reliability of this model is entirely contingent on the integrity of the input data. As noted in a study on tankyrase inhibitors for colon adenocarcinoma, "the quality and curation of the datasets are crucial for developing robust and reliable QSAR models" [55]. Inaccurate, inconsistent, or incomplete data propagates errors through the model, leading to misleading predictions and wasted experimental resources. This is particularly critical in cancer research, where the goal is to identify potent and selective therapeutic agents from vast chemical spaces [23]. This guide outlines a systematic approach to ensuring data quality, thereby enhancing the predictive power and translational potential of cancer QSAR studies.
Data Cleaning and Curation Protocols
The initial phase of any QSAR workflow involves assembling and refining a dataset from experimental sources. This process requires meticulous attention to detail to eliminate errors and ensure consistency.
Dataset Compilation and Initial Curation
The first step is to compile a dataset of chemical structures and their associated biological activities from reliable sources such as literature, patents, and public databases like ChEMBL [15] [55]. For instance, studies on KRAS and tankyrase inhibitors specifically mention retrieving curated datasets from the ChEMBL database (e.g., CHEMBL6125, CHEMBL4354832) [55] [3].
Upon compilation, the dataset must undergo rigorous cleaning:
- Removal of Duplicates and Errors: Eliminate duplicate, ambiguous, or erroneous data entries to prevent skewing the model [15].
- Standardization of Biological Activity: Convert all biological activities to a common unit and scale. A common practice is to transform IC50 values (measured in nM or μM) to pIC50 values using the equation
pIC50 = -log10(IC50 × 10⁻⁹)to create a more suitable scale for regression modeling [3]. - Handling Outliers: Identify and scrutinize extreme values in the biological activity data, as they may represent experimental errors or highly unique chemical entities [15].
Chemical Structure Standardization
The accurate calculation of molecular descriptors requires chemically consistent and standardized structural representations. This process involves several key operations:
- Standardization of Chemical Structures: This includes removing salts, normalizing tautomers, and handling stereochemistry consistently [15]. This ensures that a single, well-defined chemical entity is represented for each compound.
- Structural Optimization: For QSAR studies that utilize 3D descriptors or molecular docking, the 2D structures must be converted to 3D and their geometries optimized by energy minimization [83]. This step is crucial for obtaining realistic conformational data.
The following workflow diagram illustrates the comprehensive data cleaning and standardization pipeline:
Table 1: Common Data Sources and Preprocessing Tools for Cancer QSAR
| Resource/Tool | Primary Function | Application in Cancer QSAR Context |
|---|---|---|
| ChEMBL Database [55] [3] | Public repository of bioactive molecules with curated IC50 data. | Source of experimentally validated inhibitors for cancer targets (e.g., KRAS, TNKS2). |
| PubChem [84] | Database of chemical molecules and their activities. | Source of chemical structures and associated bioassay data. |
| PaDEL-Descriptor [15] [83] | Software for calculating molecular descriptors. | Generates 2D descriptors for QSAR model development. |
| Dragon [15] [83] | Software for calculating molecular descriptors. | Calculates a wide array of 2D and 3D molecular descriptors. |
| ChemBioDraw [83] | Chemical drawing and modeling software. | Used to manually draw structures and perform initial 3D geometry optimization. |
Handling Missing Values in QSAR Datasets
Missing data is a common issue in large, biologically-oriented datasets. The chosen strategy for handling it can significantly impact the model's robustness.
Assessment and Strategic Decision-Making
The initial step is to identify the extent and patterns of the missing data. If only a very low fraction of compounds have missing values for a particular descriptor, one viable strategy is to remove those compounds from the dataset entirely [15]. However, if the missing data is more widespread, removal is not feasible as it would critically reduce the dataset size.
Imputation Techniques
When deletion is not an option, imputation techniques are employed to estimate the missing values. The choice of technique depends on the nature of the data.
- Removal of Compounds: This is acceptable only if the fraction of missing data is low [15].
- Advanced Imputation Methods: For more significant gaps, methods such as k-nearest neighbors (k-NN) imputation can be used. This technique identifies the 'k' most similar compounds in the dataset (based on other available descriptors) and uses their values to impute the missing one [15]. Other sophisticated methods include matrix factorization or even QSAR-based prediction of the missing descriptor value itself [15].
The protocol for handling missing values is summarized in the following decision tree:
The Scientist's Toolkit: Essential Reagents and Software
Successful data preparation for QSAR modeling relies on a suite of computational tools and resources. The table below details key solutions used by researchers in the field.
Table 2: Research Reagent Solutions for QSAR Data Preparation
| Category | Item | Function in Data Preparation |
|---|---|---|
| Database | ChEMBL | Primary source for curated chemical structures and associated bioactivity data (e.g., IC50) for targets like TNKS2 and KRAS [55] [3]. |
| Descriptor Calculation | PaDEL-Descriptor | Open-source software to calculate a comprehensive set of 2D molecular descriptors and fingerprints from chemical structures [15] [83]. |
| Descriptor Calculation | Dragon | Commercial software capable of generating thousands of molecular descriptors, including 2D, 3D, and topological indices [15] [83]. |
| Cheminformatics | RDKit | Open-source toolkit for cheminformatics used for canonical SMILES generation, descriptor calculation, and molecular operations [15]. |
| Structure Standardization | ChemAxon / OpenBabel | Software suites for standardizing chemical structures, handling tautomers, and file format conversion [15]. |
| Data Preprocessing & Modeling | QSARINS | Specialized software for QSAR model development, validation, and dataset splitting to ensure robust model creation [83]. |
The path to a predictive and interpretable QSAR model in cancer research is paved with meticulously prepared data. Neglecting the foundational steps of data cleaning, standardization, and the thoughtful handling of missing values irrevocably compromises the model's validity and its utility in guiding drug discovery. By adhering to the rigorous protocols and methodologies outlined in this guide—from the initial compilation of datasets from trusted sources like ChEMBL to the final checks on data consistency—researchers can construct a reliable foundation for their computational models. This disciplined approach ensures that the critical relationship between molecular structure and anticancer activity is accurately captured, ultimately accelerating the rational design of novel therapeutic agents.
In the field of cancer research, Quantitative Structure-Activity Relationship (QSAR) models serve as powerful mathematical tools that correlate the biological activity of chemical compounds against cancer targets with descriptors derived from their molecular structures [85] [69]. The central challenge in developing robust QSAR models lies in mitigating overfitting, a phenomenon where a model learns not only the underlying pattern in the training data but also its statistical noise. This results in models that perform exceptionally well on training compounds but fail to generalize to new, unseen data, ultimately undermining their predictive utility in drug discovery campaigns [86].
The risk of overfitting is particularly acute in cancer QSAR studies due to the "curse of dimensionality"—a scenario where the number of molecular descriptors far exceeds the number of tested compounds. For instance, a study on SK-MEL-5 melanoma cell lines utilized 13 blocks of molecular descriptors, leading to the construction of 186 distinct models to identify reliable predictors [85]. This review provides an in-depth technical guide to the feature selection and cross-validation techniques that are essential for developing validated, trustworthy QSAR models in cancer research.
Molecular Descriptors in Cancer QSAR: The Foundation and the Challenge
Types of Molecular Descriptors
Molecular descriptors are quantitative representations of molecular structure and properties. In cancer QSAR studies, several classes of descriptors are routinely employed, each capturing different aspects of molecular structure [85] [86]:
- Physicochemical properties: Fundamental properties including molecular weight, logP (partition coefficient), polar surface area, and hydrogen bonding characteristics.
- Topological indices: Descriptors derived from 2D molecular graph representations that capture information on molecular size, shape, branching, and atom connectivity.
- Information indices: Metrics quantifying the information content of molecular structures.
- 2D-autocorrelation descriptors: Spatial relationship descriptors based on 2D molecular structure.
- Edge-adjacency indices: Descriptors encoding connectivity information between adjacent atoms.
The Problem of Descriptor Intercorrelation
A critical challenge in QSAR modeling is descriptor intercorrelation (multicollinearity), where two or more predictor variables are highly correlated. This redundancy can lead to model instability and overfitting, making it difficult to determine individual descriptor contributions to the predicted activity [86]. Analysis of descriptor spaces frequently reveals significant redundancy, with one study reporting that 92.70% of molecular descriptor pairs exhibited strong correlations (Pearson correlation coefficient >0.8 or <-0.8) [87].
Feature Selection Strategies for Robust QSAR Models
Feature selection techniques mitigate overfitting by identifying and retaining only the most informative molecular descriptors, thereby reducing model complexity and enhancing interpretability.
Filter Methods
Filter methods assess descriptor relevance based on intrinsic data characteristics without involving learning algorithms. The Representative Feature Selection (RFS) algorithm exemplifies this approach by systematically reducing information redundancy through correlation analysis [87]. The RFS workflow implements a two-stage process: an initial clustering of molecular descriptors followed by correlation-based filtering to select a representative subset with minimal redundancy.
Figure 1: Workflow of the Representative Feature Selection (RFS) Algorithm
Wrapper and Embedded Methods
Wrapper methods evaluate descriptor subsets using the predictive performance of a specific learning algorithm, while embedded methods perform feature selection as part of the model building process.
- Random Forest Importance: Utilizes tree-based algorithms that naturally rank descriptors by their predictive importance, effectively identifying descriptors relevant for biological activity prediction [85].
- Gradient Boosting Machines: These models are inherently robust to collinearity and multicollinearity, as their decision-tree-based architecture naturally prioritizes informative splits and down-weights redundant descriptors [86].
- Recursive Feature Elimination (RFE): An iterative procedure that progressively removes the least important descriptors based on model performance, retaining only those truly predictive within the full descriptor context [86].
Comparative Performance of Feature Selection Methods
Table 1: Comparison of Feature Selection Techniques in QSAR Modeling
| Method | Key Principle | Advantages | Limitations | Reported Efficacy |
|---|---|---|---|---|
| Representative Feature Selection (RFS) | Correlation analysis and clustering | Automates descriptor selection, significantly reduces redundancy (92.7%) | May overlook non-linear relationships | Outperformed PCA and Autoencoder in prediction accuracy [87] |
| Random Forest Importance | Tree-based importance scoring | Handles non-linear relationships, provides importance rankings | Computationally intensive for large descriptor sets | Successfully identified 7 top models for melanoma cell line prediction [85] |
| Gradient Boosting | Embedded tree learning with boosting | Naturally robust to descriptor collinearity | Complex hyperparameter tuning | Achieved R² >0.5 on test set for hERG prediction [86] |
| Recursive Feature Elimination | Iterative elimination of weakest features | Considers feature interactions, model-agnostic | High computational cost with multiple iterations | Effective for descriptor removal in QSAR models [86] |
Cross-Validation Protocols for Reliable Performance Estimation
Cross-validation provides a robust framework for estimating model performance on unseen data, serving as a critical safeguard against overfitting.
Cross-Validation Fundamentals
Cross-validation is a resampling technique that systematically partitions available data into training and validation subsets to assess model generalizability. Unlike simple holdout validation, which uses a single train-test split, cross-validation utilizes all available data for both training and validation, providing more reliable performance estimates—particularly valuable with limited datasets common in cancer research [88].
The essential steps in a cross-validation workflow encompass both development and validation phases. Development includes data preprocessing, feature selection, classifier selection, and hyperparameter tuning, while validation focuses on performance estimation using appropriate metrics for discrimination and calibration [88].
K-Fold and Nested Cross-Validation
K-fold cross-validation randomly partitions the dataset into k equal-sized subsets (folds). The model is trained k times, each time using k-1 folds for training and the remaining fold for validation. This process cycles through all folds, with performance metrics averaged across all iterations [88].
Nested cross-validation extends this approach with two layers of cross-validation: an inner loop for hyperparameter optimization and model selection, and an outer loop for performance assessment. This strict separation between model selection and evaluation provides a less biased estimate of true performance on independent data [88].
Figure 2: Nested Cross-Validation Workflow
Specialized Cross-Validation Considerations for Cancer QSAR
Cancer QSAR studies present unique challenges that necessitate specialized cross-validation approaches:
- Subject-wise vs. Record-wise Validation: When modeling multiple measurements from the same chemical compound, subject-wise cross-validation ensures all data from one compound resides in either training or validation sets, preventing optimistic bias from information leakage [88].
- Stratified Cross-Validation: For classification problems with imbalanced active/inactive compounds (e.g., 174 active vs. 248 inactive in SK-MEL-5 dataset), stratified cross-validation preserves class distribution across folds, ensuring reliable performance estimation [85] [88].
Integrated Case Studies in Cancer Research
Case Study 1: Melanoma (SK-MEL-5) Cytotoxicity Prediction
A comprehensive QSAR study on the SK-MEL-5 melanoma cell line exemplifies rigorous overfitting mitigation. Researchers developed 186 classification models using 422 compounds, addressing overfitting through multiple strategies [85]:
Table 2: Experimental Protocol for SK-MEL-5 QSAR Modeling
| Aspect | Implementation Details |
|---|---|
| Data Curation | 445 initial observations curated to 422 after duplicate removal; standardization using ChemAxon Standardizer [85] |
| Activity Definition | Binary classification (active: GI₅₀ < 1 µM; inactive: GI₅₀ > 1 µM) [85] |
| Descriptor Calculation | 13 blocks of molecular descriptors computed using Dragon 7.0 [85] |
| Feature Selection | Pre-processing removed constant, near-constant, and highly correlated descriptors (threshold = 0.80); maximum 7 features selected using RF importance and symmetrical uncertainty [85] |
| Model Validation | Nested cross-validation; external validation with test set (106 compounds); y-scrambling to confirm non-random models [85] |
| Key Results | 7 models with PPV >0.85; all utilized Random Forest algorithm with topological and 2D-autocorrelation descriptors [85] |
Case Study 2: FGFR-1 Inhibitors for Cancer Therapy
A recent QSAR study targeting Fibroblast Growth Factor Receptor 1 (FGFR-1), a key target in lung and breast cancers, further demonstrates integrated overfitting mitigation:
- Dataset: 1,779 compounds from ChEMBL database curated for model development [18].
- Feature Selection: Molecular descriptors calculated with Alvadesc software, followed by feature selection techniques to refine the descriptor set [18].
- Validation Framework: 10-fold cross-validation combined with external validation; model achieved R² = 0.7869 (training) and 0.7413 (test set), indicating good generalizability without overfitting [18].
- Experimental Corroboration: In vitro validation using MTT, wound healing, and clonogenic assays on cancer cell lines confirmed model predictions, with oleic acid identified as a promising FGFR-1 inhibitor [18].
Table 3: Essential Research Reagents and Computational Tools for QSAR Modeling
| Resource/Tool | Function | Application in Cancer QSAR |
|---|---|---|
| Dragon 7.0 | Molecular descriptor calculation | Computes 5000+ molecular descriptors for structural representation [85] [87] |
| RDKit | Cheminformatics and descriptor calculation | Calculates 200+ physical-chemical and topological descriptors [86] |
| Alvadesc Software | Molecular descriptor calculation | Generates descriptors for QSAR modeling; used in FGFR-1 inhibitor study [18] |
| ChemAxon Standardizer | Molecular structure standardization | Standardizes molecular representations prior to descriptor calculation [85] |
| R miner package | Data partitioning and machine learning | Divides datasets into training/test sets; implements machine learning algorithms [85] |
| Flare Python API | Descriptor selection and model building | Implements recursive feature elimination and correlation analysis [86] |
| ISIDA/Duplicates | Detection of duplicate structures | Identifies and removes duplicate compounds from datasets [85] |
Mitigating overfitting through rigorous feature selection and cross-validation represents a cornerstone of reliable QSAR modeling in cancer research. As demonstrated across multiple case studies, the integration of these techniques enables the development of predictive models that genuinely generalize to novel compounds, thereby accelerating oncology drug discovery.
Future directions in this field point toward increased adoption of hybrid feature selection methods, automated machine learning pipelines for model optimization, and greater emphasis on model interpretability. Furthermore, the growing availability of large-scale cancer cell line screening data presents opportunities for developing more comprehensive models with expanded applicability domains. By adhering to the rigorous methodologies outlined in this technical guide, researchers can advance the development of predictive QSAR models that meaningfully contribute to the discovery of novel anticancer therapeutics.
Quantitative Structure-Activity Relationship (QSAR) modeling has become an indispensable computational tool in modern drug discovery, particularly in the development of anti-cancer agents. By establishing mathematical relationships between chemical descriptors and biological activity, QSAR models enable researchers to predict the potency, selectivity, and ADMET properties of novel compounds prior to synthesis and experimental testing. However, the proliferation of diverse QSAR methodologies and descriptor sets has introduced a significant challenge: conflicting predictions across different models when applied to the same compounds. These inconsistencies pose substantial obstacles in cancer drug discovery pipelines, where reliable activity predictions are crucial for prioritizing synthetic targets and allocating resources efficiently.
The foundation of QSAR modeling in cancer research rests upon the accurate representation of molecular structure through molecular descriptors. As noted in studies of anti-colorectal cancer compounds, conventional descriptors often struggle to capture the full complexity of molecular electronic and spatial properties, leading to variations in predictive outcomes [2]. Similarly, research on chalcone analogs as anti-colon cancer agents demonstrates how different descriptor methodologies (SMILES-based versus graph-based) can yield divergent model performances and interpretations [21]. These discrepancies highlight the critical need for systematic frameworks to resolve conflicting predictions, particularly when working with promising but challenging target classes such as KRAS inhibitors for lung cancer therapy [3].
This technical guide provides a comprehensive examination of the sources of QSAR model inconsistencies and presents validated strategies for resolving conflicting predictions within the context of cancer drug discovery. By integrating advanced descriptor methodologies, robust validation techniques, and structured decision frameworks, researchers can enhance the reliability of their computational predictions and accelerate the development of novel anti-cancer therapeutics.
The Central Role of Molecular Descriptors in Prediction Variance
Molecular descriptors serve as the fundamental building blocks of QSAR models, quantitatively encoding chemical information that correlates with biological activity. The selection and type of descriptors significantly influence model predictions, particularly in cancer research where precise activity predictions are essential. Descriptor variance emerges as a primary source of model inconsistency, manifesting in several key dimensions:
Electronic versus Structural Representation: Studies on anti-colorectal cancer compounds demonstrate that 3D electron cloud descriptors derived from Density Functional Theory (DFT) consistently outperform conventional descriptors like ECFP4 fingerprints, with Area Under the Curve (AUC) improvements from 0.88 to 0.96 [2]. Control experiments confirmed that predictive gains stemmed specifically from electronic structure information rather than geometric features alone, highlighting how different descriptor philosophies capture distinct aspects of molecular properties.
Descriptor Dimensionality and Complexity: Research on chalcone analogs for colon cancer reveals that hybrid descriptors combining SMILES notation and hydrogen-suppressed molecular graphs (HSG) produce more robust and predictive models compared to using either descriptor type alone [21]. The integration of multiple descriptor domains provides complementary information that reduces the risk of model-specific biases.
Information Complementarity: The enhanced performance of hybrid descriptors demonstrates that different descriptor types capture non-redundant chemical information. Local geometric descriptors and intensity-based electronic features have been identified as primary contributors to predictive accuracy in anti-cancer QSAR models [2].
Table 1: Classification of Molecular Descriptors and Their Impact on Prediction Consistency
| Descriptor Category | Representative Types | Strengths | Limitations | Impact on Consistency |
|---|---|---|---|---|
| 0D-2D (Constitutional) | Atom counts, molecular weight, logP | Fast calculation, high interpretability | Limited structural resolution | Low-moderate: Generally consistent but limited predictive power |
| 3D-Spatial | Molecular shape, volume, surface area | Captures stereochemistry | Conformation-dependent | High: Sensitive to modeling parameters |
| Electronic | DFT-derived electron density, electrostatic potentials | Directly encodes reactivity | Computationally intensive | High: Captures quantum effects but method-dependent |
| Topological | Molecular connectivity indices | Structure-based, conformation-independent | Limited physicochemical insight | Moderate: Generally consistent across models |
| Hybrid | SMILES+HSG, 3D electron clouds | Comprehensive representation | Reduced interpretability | Variable: Can reconcile conflicts through information integration |
Validation Paradigms and Their Limitations
The validation of QSAR models represents another dimension of inconsistency, where different validation approaches and criteria can yield conflicting assessments of model reliability. A comprehensive study evaluating 44 reported QSAR models revealed that employing the coefficient of determination (r²) alone could not adequately indicate model validity [89]. External validation—splitting data into training and test sets—remains one of the most common approaches, yet various established criteria produce different conclusions about model validity.
Key limitations in current validation practices include:
Insufficient Single Metrics: R² values alone provide inadequate evidence of model robustness, as evidenced by models with high R² but poor predictive performance on external test sets [89].
Variable Validation Criteria: Different statistical parameters for external validation (r₀², r₀'², etc.) can yield contradictory assessments of the same model, complicating model selection [89].
Applicability Domain Ambiguity: Predictions for compounds outside a model's applicability domain introduce inconsistencies, yet domain boundaries are often poorly defined or implemented inconsistently across modeling platforms [50].
Methodological Framework: Integrated Strategies for Conflict Resolution
Advanced Descriptor Selection and Integration
Resolving prediction conflicts begins with strategic descriptor selection and integration. The following methodologies have demonstrated success in cancer QSAR studies:
3D Electron Cloud Descriptors for Enhanced Consistency In anti-colorectal cancer QSAR modeling, researchers developed a high-dimensional framework using three-dimensional electron density features to address limitations of conventional descriptors [2]. The methodology included:
- Electron density computation via Density Functional Theory (DFT)
- Conversion of electron densities to 3D point clouds
- Encoding into multi-scale descriptors including radial distribution functions, spherical harmonic expansions, point feature histograms, and persistent homology
This approach enabled comprehensive molecular characterization across statistical, geometric, and topological dimensions, consistently improving performance across multiple machine learning models and demonstrating superior performance versus industry-standard ECFP4 fingerprints [2].
Hybrid SMILES-Graph Descriptors for Chalcone Anti-Cancer Activity For predicting anti-colon cancer activity of chalcone derivatives, researchers implemented a hybrid descriptor approach using CORAL software [21]. The optimal descriptor was calculated as:
[{}^{\text{Hybrid}}\text{DCW}\left({\text{T}}^{\text{}},{\text{N}}^{\text{}}\right)={}^{\text{SMILES}}\text{DCW}\left({\text{T}}^{\text{}},{\text{N}}^{\text{}}\right)+{}^{\text{Graph}}\text{DCW}\left({\text{T}}^{\text{}},{\text{N}}^{\text{}}\right)]
Where DCW represents the descriptor of correlation weights, T* is the threshold value, and N* is the number of epochs in the Monte Carlo optimization process. This hybrid approach achieved exceptional predictive performance with R²validation = 0.90 and Q²validation = 0.89, demonstrating how descriptor integration can resolve inconsistencies from single-descriptor methodologies [21].
Robust Validation and Applicability Domain Assessment
A multi-faceted validation strategy is essential for identifying and resolving prediction conflicts:
Comprehensive Validation Protocol
- Statistical Validation: Employ multiple metrics including R², Q², RMSE, and MAE rather than relying on single parameters [89] [3]
- External Validation: Strict separation of training and test sets, with performance evaluation primarily based on test set predictions [89]
- Prospective Validation: Use time-split cross-validation to estimate goodness of prospective prediction when temporal factors influence data [90]
Applicability Domain (AD) Assessment The Mahalanobis Distance method provides a quantitative approach to define a model's applicability domain [3]:
[D^2 = (x - \mu)^T \Sigma^{-1} (x - \mu)]
Where (x) is the descriptor vector of the query compound, (\mu) is the mean vector of the training set descriptors, and (\Sigma) is the covariance matrix. Compounds with D² values exceeding the threshold based on the 95th percentile of the χ² distribution should be flagged as outside the AD, and their predictions treated with caution [3].
Table 2: Validation Criteria and Their Interpretation for Model Reliability
| Validation Type | Key Metrics | Threshold Values | Interpretation | Limitations |
|---|---|---|---|---|
| Internal Validation | Q², RMSECV | Q² > 0.6, RMSECV low | Good fit to training data | Limited value for predictive assessment |
| External Validation | R²_ext, RMSEP, MAE | R²_ext > 0.6, RMSEP < 0.5 | Good predictive ability | Dependent on test set selection |
| Statistical Significance | p-values for coefficients | p < 0.05 | Statistically significant relationships | Does not guarantee predictive power |
| Domain of Applicability | Mahalanobis Distance, leverage | Within confidence bounds | Reliable extrapolation | Method-dependent thresholds |
Decision Framework for Resolving Prediction Conflicts
Machine Learning Ensemble Approaches
Ensemble methods that combine multiple machine learning algorithms have demonstrated superior performance in cancer-related QSAR studies. In the development of KRAS inhibitors for lung cancer therapy, researchers benchmarked five different algorithms: partial least squares (PLS), random forest (RF), stepwise multiple linear regression (MLR), genetic algorithm optimized MLR (GA-MLR), and XGBoost [3].
The PLS model exhibited the best predictive performance (R² = 0.851; RMSE = 0.292), followed by RF (R² = 0.796), while the GA-MLR model achieved good interpretability and robust internal validation (R² = 0.677) [3]. This demonstrates that no single algorithm consistently outperforms others across all scenarios, supporting the use of ensemble approaches for conflict resolution.
Genetic Algorithm for Feature Selection The genetic algorithm approach implemented in the KRAS inhibitor study identified an optimal subset of descriptors that maximized adjusted R-squared while penalizing model complexity [3]. The fitness function was defined as:
[ \text{Fitness} = R_{adj}^2 - \frac{k}{n} ]
Where k is the number of selected descriptors and n is the number of training samples. This approach mitigates overfitting and enhances model generalizability, reducing conflicts between training and test set predictions.
Experimental Protocols and Workflows
Comprehensive QSAR Modeling Protocol with Conflict Resolution
This integrated protocol synthesizes methodologies from multiple cancer QSAR studies to provide a systematic approach for resolving prediction conflicts:
Phase 1: Data Curation and Preprocessing
- Dataset Compilation: Collect experimental bioactivity data from reliable sources (e.g., ChEMBL). For KRAS inhibitors, 62 compounds were retrieved from CHEMBL4354832 [3].
- Activity Standardization: Convert IC₅₀ values to pIC₅₀ using: pIC₅₀ = -log₁₀(IC₅₀ × 10⁻⁹) [3].
- Chemical Standardization: Standardize molecular structures, remove duplicates, and validate chemical representation.
- Dataset Splitting: Implement stratified splitting into training (≈70%), calibration (≈15%), and test (≈15%) sets to ensure representative chemical space coverage [3] [21].
Phase 2: Multi-Descriptor Calculation and Selection
- Diverse Descriptor Calculation: Compute multiple descriptor types including:
- Descriptor Preprocessing:
Phase 3: Model Development with Multiple Algorithms
- Parallel Model Development: Implement multiple machine learning algorithms:
- Partial Least Squares (PLS) regression
- Random Forest (RF) with 500 trees [3]
- Genetic Algorithm-optimized Multiple Linear Regression (GA-MLR)
- Extreme Gradient Boosting (XGBoost)
- Hyperparameter Optimization: Use cross-validation for parameter tuning.
- Model Interpretation: Apply SHAP analysis and permutation-based importance to understand feature contributions [3].
Phase 4: Conflict Resolution and Consensus Prediction
- Applicability Domain Assessment: Calculate Mahalanobis distance for all query compounds [3].
- Prediction Variance Analysis: Identify compounds with conflicting predictions across models.
- Consensus Weighting: Assign weights to models based on their:
- Predictive performance on test set
- Applicability domain coverage for the query compound
- Domain-specific expertise (e.g., electronic descriptors for covalent inhibitors)
- Experimental Prioritization: Flag compounds for experimental verification based on:
- Prediction confidence levels
- Chemical novelty and synthetic accessibility
- Therapeutic potential and project priorities
Workflow Visualization for Conflict Resolution Protocol
QSAR Conflict Resolution Workflow
Table 3: Essential Computational Tools for QSAR Conflict Resolution
| Tool Category | Specific Tools/Software | Key Functionality | Application in Conflict Resolution |
|---|---|---|---|
| Descriptor Calculation | ChemoPy, PaDEL-Descriptor, Dragon | Compute diverse molecular descriptors | Generate complementary descriptor sets for consensus modeling |
| Quantum Chemical | Gaussian, ORCA, DFTB+ | Calculate 3D electron cloud descriptors [2] | Resolve electronic effects missed by conventional descriptors |
| Machine Learning | Scikit-learn, XGBoost, Random Forest | Implement multiple ML algorithms | Develop ensemble models to mitigate algorithm-specific biases |
| Specialized QSAR | CORAL, VEGA, ADMETLab 3.0 | Provide optimized QSAR modeling environments | Offer validated approaches for specific endpoints [50] [21] |
| Validation & AD | QSAR Model Reporting Format (QPRF), In-house scripts | Assess model validity and applicability domain | Standardize validation protocols across models [91] |
| Visualization & Interpretation | SHAP, Matplotlib, DataWarrior | Interpret model predictions and feature importance | Identify sources of prediction conflicts through visualization [3] |
Resolving conflicting predictions across multiple QSAR models requires a systematic, multi-faceted approach that addresses the fundamental sources of inconsistency. By implementing integrated descriptor strategies, robust validation protocols, and structured conflict resolution frameworks, researchers can significantly enhance the reliability of computational predictions in cancer drug discovery. The methodologies outlined in this technical guide—drawn from cutting-edge applications in colorectal, lung, and colon cancer research—provide a roadmap for navigating prediction inconsistencies and advancing more effective anti-cancer therapeutic development.
As QSAR methodologies continue to evolve with advances in machine learning, quantum chemical computation, and multi-scale descriptor development, the strategies for conflict resolution must similarly advance. Future efforts should focus on standardized reporting formats, benchmark datasets for conflict resolution evaluation, and automated consensus frameworks that can dynamically integrate the most predictive aspects of diverse modeling approaches. Through continued refinement of these methodologies, the cancer research community can overcome current limitations in prediction consistency and accelerate the discovery of novel therapeutic agents.
The accurate prediction of molecular properties is a cornerstone of modern computational drug discovery, particularly in oncology. This whitepaper examines the emerging paradigm of hybrid molecular descriptors, which integrate the sequential information from SMILES strings with the topological information from molecular graphs. We demonstrate that this synergistic approach consistently surpasses the predictive performance of single-representation models in Quantitative Structure-Activity Relationship (QSAR) studies for anti-cancer agents. Supported by comparative tables, detailed experimental protocols, and original visualizations, this guide provides researchers with a comprehensive framework for implementing hybrid descriptor systems to accelerate the development of novel cancer therapeutics.
In the relentless pursuit of new oncology therapeutics, Quantitative Structure-Activity Relationship (QSAR) modeling serves as a critical computational tool for predicting the biological activity of candidate molecules. The foundational element of any QSAR model is the molecular descriptor—a numerical representation of a compound's structure. The fidelity of this representation directly governs the model's predictive accuracy and its utility in virtual screening [23].
Traditionally, two dominant descriptor paradigms have existed in parallel: SMILES-based representations and graph-based representations. SMILES (Simplified Molecular Input Line Entry System) notation describes molecular structure as a linear string of symbols, encoding atoms, bonds, and sometimes stereochemistry. In contrast, graph-based representations treat a molecule as a mathematical graph, with atoms as nodes and bonds as edges, thereby explicitly capturing its topological connectivity [92]. While SMILES strings are compact and intuitive, they can suffer from a lack of robustness and an abstract representation of molecular topology. Molecular graphs offer a more natural structural representation but may require complex featurization to capture higher-order chemical concepts [92] [93].
Hybrid descriptor systems aim to resolve this dichotomy. By combining the strengths of both approaches, these systems create a more information-rich molecular representation. This paper delineates the theoretical underpinnings, practical implementation, and superior performance of hybrid descriptors, contextualized within QSAR-driven anti-cancer drug discovery.
Comparative Analysis of Descriptor Modalities
The selection of molecular representation is a primary determinant of QSAR model performance. The table below summarizes the core characteristics, advantages, and limitations of the three primary descriptor modalities.
Table 1: Comparison of Molecular Descriptor Types in QSAR Modeling
| Descriptor Type | Core Principle | Key Advantages | Inherent Limitations |
|---|---|---|---|
| SMILES-Based | Uses linear string notation to represent molecular structure [92]. | Simple, compact, and widely supported; allows the use of powerful natural language processing techniques. | Non-uniqueness (multiple SMILES for one molecule); abstract representation that does not explicitly encode topology [92] [94]. |
| Graph-Based | Represents a molecule as a graph (atoms=nodes, bonds=edges) [93]. | Natural and intuitive representation of molecular topology; excels at capturing local atomic environments. | Early methods struggled to represent known explicit knowledge and were less interpretable than feature-based models [95]. |
| Hybrid (SMILES + Graph) | Combines SMILES strings and molecular graphs into a single, unified descriptor [21]. | Mitigates limitations of individual representations; achieves superior predictive accuracy by providing complementary structural information. | Increased implementation complexity and computational cost for descriptor calculation. |
The impetus for developing hybrid systems is clear from performance benchmarks. A comprehensive 2021 study compared descriptor-based and graph-based models across 11 public datasets, noting that "on average the descriptor-based models outperform the graph-based models" for standard endpoints [93]. However, for specific, complex tasks—such as predicting activity against cancer cell lines—the integrated approach of hybrid descriptors has proven particularly effective. A 2025 study on chalcone analogues for colon cancer demonstrated that the hybrid model was the most accurate, with a high coefficient of determination (R²) for the validation set [21]. This demonstrates that the whole of a hybrid representation can be greater than the sum of its parts.
Implementation of a Hybrid Descriptor System: A Protocol
The following section provides a detailed methodology for constructing and validating a QSAR model using a hybrid descriptor system, based on a proven protocol for predicting anti-colon cancer activity [21].
Data Curation and Preparation
- Dataset Compilation: Assemble a set of molecules with reliably measured biological activity (e.g., IC50 or Ki values against a specific cancer cell line like HT-29 or MCF-7). For the cited study, 193 chalcone derivatives were collected from published literature [21].
- Activity Data Standardization: Convert dose-response values (e.g., IC50) to a uniform molar scale and transform them into a negative logarithmic scale (pIC50 = -logIC50) to be used as the dependent variable in the QSAR model.
- Structure Standardization: Draw all molecular structures using a tool like BIOVIA Draw and generate their canonical SMILES notations. These SMILES strings serve as the primary input for the next stage.
Hybrid Descriptor Calculation Using CORAL Software
The hybrid descriptor is computed as the sum of two separate optimal descriptors, as defined in the following equation [21]: HybridDCW(T, N) = SMILESDCW(T, N) + GraphDCW(T, N)
Here, DCW stands for Descriptor of Correlation Weights, T* is an optimized threshold, and N* is the optimal number of epochs determined by the Monte Carlo optimization process.
Table 2: Research Reagent Solutions for Hybrid QSAR Modeling
| Tool / Resource | Type | Primary Function in the Workflow |
|---|---|---|
| BIOVIA Draw | Commercial Software | Chemical structure drawing and generation of initial SMILES strings [21]. |
| CORAL Software | Free QSAR Tool | Core platform for calculating optimal SMILES-based and Graph-based descriptors using the Monte Carlo method, and for building the QSAR model [21] [94]. |
| RDKit | Open-Source Cheminformatics Library | Used in many graph-based and descriptor-based studies for processing SMILES, generating molecular graphs, and calculating fingerprints [93] [96]. |
| Monte Carlo Optimization | Computational Algorithm | The method used inside CORAL to randomize and optimize the correlation weights for molecular features to build a robust model [21]. |
The workflow for generating the hybrid descriptor and building the QSAR model is illustrated below.
Model Building, Validation, and Application
- Data Splitting: Randomly split the dataset into four subsets: Training (~25%), Invisible Training (~25%), Calibration (~25%), and Validation (~25%). This multi-set split helps in rigorously evaluating the model's robustness [21].
- Model Construction: Use the least-squares method to establish the linear correlation: pIC50 = C0 + C1 × HybridDCW(T, N), where C0 and C1 are the regression coefficients.
- Validation: Assess model performance using the validation set. Key statistical metrics include the coefficient of determination for the validation set (R²validation), the index of ideality of correlation (IICvalidation), and the cross-validated R² (Q²_validation). A robust model should exhibit high values across these metrics (e.g., R² > 0.85) [21].
- Mechanistic Interpretation and Virtual Screening: Analyze the " promoters" of increased and decreased activity identified by the model. This provides insight into which structural fragments enhance or diminish anti-cancer activity. The validated model can then predict the activity of new compounds from chemical databases (e.g., ChEMBL), enabling the virtual screening of millions of compounds to identify promising candidates for synthesis and biological testing [21] [97].
Performance Benchmarking and Applications in Cancer Research
The efficacy of hybrid descriptors is best demonstrated by their performance in real-world QSAR studies, particularly in oncology.
Table 3: Benchmarking Performance of Hybrid Descriptors in Cancer QSAR Studies
| Study Focus / Compound Class | Biological Endpoint | Descriptor Type | Key Performance Metric | Reported Value |
|---|---|---|---|---|
| Chalcone Analogues [21] | Anti-colon cancer activity (HT-29) | Hybrid (SMILES + HSG) | R² (Validation) | 0.90 |
| Index of Ideality of Correlation | 0.81 | |||
| 1,2 & 1,4-Naphthoquinone Derivatives [98] | Anti-breast cancer activity (MCF-7) | Hybrid (SMILES + HSG) | Model used for virtual screening of 2,435 compounds | 67 high-activity hits identified |
| Anti-Breast Cancer Candidate Drugs [95] | ERα activity & ADMET properties | Graph-Based (ABCD-GGNN) integrated with descriptors | Outperformed representative methods | Improved prediction accuracy |
The application of these models extends beyond mere prediction. In the naphthoquinone study, the best QSAR model was used to predict the activity of 2,435 derivatives. This virtual screening identified 67 compounds with high predicted potency (pIC50 > 6). Subsequent filtering based on Absorption, Distribution, Metabolism, Excretion, and Toxicity (ADMET) properties and molecular docking studies narrowed this down to 16 promising candidates, with one (Compound A14) showing stable binding in molecular dynamics simulations, underscoring the practical utility of this approach in a drug discovery pipeline [98].
Furthermore, advanced graph-based models like ABCD-GGNN have been developed to topologically learn both structure and substructure characteristics, integrating them with explicit molecular descriptors. This enhanced representation has shown outstanding performance in predicting critical properties for anti-breast cancer drug selection, including ERα activity and ADMET profiles [95].
Hybrid descriptor systems represent a significant evolution in molecular representation for QSAR modeling. By synergistically combining the complementary information from SMILES strings and molecular graphs, they overcome the inherent limitations of each individual approach. As demonstrated by multiple studies in cancer research, this strategy yields models with enhanced predictive accuracy, robustness, and mechanistic interpretability.
For researchers and drug development professionals, the adoption of hybrid systems offers a tangible path to improving the efficiency and success rate of early-stage drug discovery. The ability to more accurately identify and optimize lead compounds for oncology targets through virtual screening can significantly reduce the time and cost associated with experimental workflows. As computational power and machine learning algorithms continue to advance, hybrid descriptor systems are poised to become an indispensable component of the rational drug design toolkit, playing a pivotal role in the accelerated development of next-generation cancer therapeutics.
In the field of cancer drug discovery, Quantitative Structure-Activity Relationship (QSAR) modeling serves as a pivotal computational tool for predicting the biological activity of compounds based on their molecular structures. The central challenge in developing these models lies in balancing interpretability and complexity—a trade-off between simple, explainable models and sophisticated, predictive algorithms. Linear models, such as Multiple Linear Regression (MLR) and Partial Least Squares (PLS), offer high interpretability with clear mathematical relationships between molecular descriptors and biological activity [99] [3]. In contrast, non-linear approaches, including machine learning methods like Random Forest, XGBoost, and Gene Expression Programming (GEP), capture complex patterns at the cost of reduced interpretability [100] [101] [102]. Within cancer research, this balance carries particular significance as researchers must not only predict compound efficacy but also understand mechanistic drivers to guide rational drug design against specific oncology targets such as VEGFR-2, KRAS, and various anti-colorectal cancer targets [2] [3] [102].
The selection of molecular descriptors—numerical representations of molecular structures—fundamentally influences this balance. Descriptors range from simple two-dimensional (2D) structural fingerprints to complex three-dimensional (3D) electron density features derived from density functional theory (DFT) [2] [99]. As QSAR models evolve from traditional linear regression to contemporary machine learning approaches, understanding the implications of model selection on both predictive performance and biochemical insight becomes crucial for advancing anticancer drug discovery.
Molecular Descriptors: The Foundation of Cancer QSAR Models
Molecular descriptors form the essential input variables for QSAR models, quantitatively encoding structural and physicochemical properties that influence biological activity. In cancer drug discovery, these descriptors help elucidate the structural determinants of anticancer activity, enabling more targeted molecular design.
Table 1: Categories of Molecular Descriptors in Cancer QSAR Studies
| Descriptor Dimension | Description | Examples | Advantages | Limitations | Cancer Applications |
|---|---|---|---|---|---|
| 0D-2D Descriptors | Constitutional & topological descriptors based on molecular formula & connectivity | Molecular weight, atom counts, logP, topological indices [10] [99] | Computational efficiency, easy interpretation, no conformation needed | Limited 3D structural information | Breast cancer drug QSPR with entire neighborhood indices [10] |
| 3D Descriptors | Based on molecular geometry & spatial arrangement | 3D electron density features, radial distribution functions, spherical harmonic expansions [2] | Captures stereochemistry & shape complementarity | Conformation-dependent, computationally intensive | Anti-colorectal cancer compounds with DFT-derived point clouds [2] |
| Quantum Chemical Descriptors | Derived from electronic structure calculations | HOMO/LUMO energies, electrostatic potentials, partial charges [99] | Describes electronic interactions & reactivity | High computational cost, specialized expertise required | Osteosarcoma drug design with semi-empirical AM1 calculations [100] [101] |
The information content of descriptors increases with dimensionality, but so does computational expense and potential for overfitting. Recent innovations in cancer QSAR include 3D electron cloud descriptors that capture electronic and spatial complexity through DFT-calculated electron densities converted to 3D point clouds and encoded into multi-scale descriptors including radial distribution functions and persistent homology [2]. Similarly, entire neighborhood topological indices have demonstrated value in characterizing breast cancer drugs by integrating localized atomic environment insights within comprehensive bond interaction representations [10]. Descriptor selection must align with both the biological endpoint and model complexity, with simpler descriptors often suficient for linear models, while advanced descriptors may justify their complexity through enhanced predictive power in non-linear frameworks.
Linear Modeling Approaches: Interpretability in Cancer Drug Design
Linear QSAR models establish mathematically straightforward relationships between molecular descriptors and biological activity, providing transparent, interpretable frameworks that are particularly valuable in early-stage anticancer drug discovery. These models assume a linear dependence between descriptor values and the measured activity endpoint, such as IC₅₀ or pIC₅₀ values.
The fundamental equation for a linear QSAR model takes the form:
Activity = β₀ + β₁x₁ + β₂x₂ + ... + βₙxₙ
Where β₀ is the intercept, β₁...βₙ are regression coefficients, and x₁...xₙ are molecular descriptor values [3]. The magnitude and sign of each coefficient directly indicate the descriptor's contribution to biological activity, enabling clear structural insights.
Table 2: Linear Modeling Techniques in Cancer QSAR
| Method | Key Principles | Advantages | Limitations | Cancer Application Examples |
|---|---|---|---|---|
| Multiple Linear Regression (MLR) | Ordinary least squares regression with multiple descriptors | Simple interpretation, clear descriptor contribution | Sensitive to descriptor correlation, overfitting risk | KRAS inhibitor design with GA-MLR [3] |
| Partial Least Squares (PLS) | Projects variables to latent factors maximizing covariance with activity | Handles correlated descriptors, reduced overfitting | Latent factor interpretation less direct | KRAS inhibitors (R² = 0.851) [3] |
| Genetic Algorithm-MLR (GA-MLR) | MLR with descriptor selection optimized via evolutionary algorithms | Automated feature selection, improved model robustness | Computational intensity for feature selection | KRAS inhibitors with 8 optimized descriptors [3] |
In practice, linear models have demonstrated substantial utility across various cancer domains. For KRAS inhibitor development in lung cancer therapy, PLS regression achieved outstanding predictive performance (R² = 0.851, RMSE = 0.292) using topological, constitutional, geometrical, and electronic descriptors [3]. Similarly, in osteosarcoma research, a heuristic method using four carefully selected descriptors generated a linear model with reasonable performance (R² = 0.603), though it was surpassed by a non-linear approach [100] [101].
The primary advantage of linear models lies in their interpretability—the ability to derive clear structure-activity relationships from regression coefficients. For instance, in VEGFR-2 inhibitor development, linear correlations enabled identification of key molecular features influencing anti-angiogenic activity [102]. However, linear models struggle to capture complex non-linear relationships that often characterize biological systems, particularly in the intricate mechanisms of cancer cell inhibition.
Non-linear Modeling Approaches: Capturing Complexity in Cancer Systems
Non-linear QSAR models employ advanced computational techniques to identify complex, non-additive relationships between molecular descriptors and biological activity, often achieving superior predictive performance at the cost of interpretability. These approaches are particularly valuable in cancer research where biological responses frequently exhibit threshold effects, synergistic interactions, and complex binding mechanics that linear models cannot adequately capture.
Gene Expression Programming (GEP) has demonstrated remarkable efficacy in modeling anti-osteosarcoma activity, achieving significantly higher performance (R² = 0.839 in training, 0.760 in test sets) compared to linear approaches for 2-Phenyl-3-(pyridin-2-yl) thiazolidin-4-one derivatives [100] [101]. GEP's advantage lies in its automated feature generation that unveils intricate descriptor-activity relationships often overlooked by manual selection, while maintaining some interpretability through evolved mathematical expressions [101].
Ensemble machine learning methods represent another powerful non-linear approach. In VEGFR-2 inhibitor development, XGBoost achieved exceptional performance (accuracy = 83.67%, AUC = 0.9009) using 164 molecular descriptors from a curated dataset of 10,221 compounds [102]. Similarly, Random Forest regression demonstrated strong predictive capability for KRAS inhibitors (R² = 0.796), leveraging multiple decision trees to capture complex descriptor-activity patterns [3].
The Table 3 below compares non-linear methods used in cancer QSAR studies:
Table 3: Non-linear Modeling Techniques in Cancer QSAR
| Method | Key Principles | Advantages | Limitations | Performance Examples |
|---|---|---|---|---|
| Gene Expression Programming (GEP) | Evolutionary algorithm generating mathematical expressions | Automates feature generation, captures non-linearity, moderate interpretability | Computational intensity, complex implementation | Osteosarcoma drug design (R² = 0.839) [100] [101] |
| Random Forest (RF) | Ensemble of decision trees with bagging | Robust to outliers, handles high-dimensional data | Black-box nature, limited interpretability | KRAS inhibitors (R² = 0.796) [3] |
| XGBoost | Gradient boosting with optimized execution | High predictive accuracy, feature importance ranking | Hyperparameter sensitivity, overfitting risk | VEGFR-2 inhibitors (AUC = 0.9009) [102] |
| LightGBM | Gradient boosting framework with selective sampling | Computational efficiency with large datasets | Less effective on small datasets | Anti-colorectal cancer with 3D descriptors [2] |
While non-linear models typically outperform linear approaches in predictive accuracy, their "black-box" nature presents challenges for mechanistic interpretation in cancer drug discovery. However, techniques such as SHAP analysis and LIME have enabled some interpretability, revealing that descriptors related to hydrogen bonding, electrostatics, and lipophilicity were key contributors to VEGFR-2 inhibitory activity [102]. Similarly, feature attribution analysis in 3D electron cloud descriptors for anti-colorectal cancer compounds identified local geometric descriptors and intensity-based electronic features as primary activity drivers [2].
Methodological Framework: Experimental Protocols for Cancer QSAR
Robust QSAR modeling requires systematic protocols encompassing data preparation, model development, and validation. The following methodologies represent standardized approaches employed in cancer QSAR studies.
Data Compilation and Preprocessing
The initial phase involves careful dataset construction from experimental bioactivity data. For KRAS inhibitor modeling, researchers retrieved 62 inhibitors from the ChEMBL database (CHEMBL4354832) with experimentally measured IC₅₀ values, which were converted to pIC₅₀ (-logIC₅₀) to normalize the scale for regression modeling [3]. Similarly, VEGFR-2 inhibitor studies utilized a meticulously curated dataset of 10,221 compounds from ChEMBL, represented by 164 molecular descriptors [102].
Standardization procedures typically include:
- Removal of duplicates and compounds with ambiguous activity measurements
- Calculation of molecular descriptors using tools like ChemoPy, Dragon, or CODESSA
- Elimination of descriptors with missing values or zero variance
- Descriptor standardization through mean-centering and scaling to unit variance
- Reduction of multicollinearity by removing highly correlated descriptors (Pearson's |r| > 0.95) [3]
Dataset Splitting and Validation
The preprocessed dataset is divided into training and test sets, typically employing a 70-30% or 75-25% split using stratified sampling based on activity values [3]. For smaller datasets, cross-validation techniques (leave-one-out or leave-many-out) provide more reliable performance estimates [103] [100].
Feature Selection Strategies
Feature selection optimizes model performance and interpretability by identifying the most relevant molecular descriptors. Genetic Algorithms (GA) represent an effective approach for this purpose, with fitness functions designed to maximize adjusted R-squared while penalizing model complexity [3]. Alternative methods include stepwise selection based on information criteria and permutation importance ranking [3] [102].
Model Validation and Applicability Domain
Rigorous validation is essential for reliable QSAR models. External validation through test set prediction provides the most realistic performance assessment [103]. The Applicability Domain (AD) defines the chemical space where models can make reliable predictions, typically assessed using Mahalanobis Distance to evaluate whether new compounds fall within the training set's descriptor space [3] [104]. Studies indicate that predictions for compounds outside the AD should be treated with caution, as they represent extrapolations beyond validated chemical space [104].
Comparative Analysis: Performance Metrics and Validation in Cancer Studies
Empirical comparisons between linear and non-linear approaches reveal context-dependent advantages across various cancer domains. Comprehensive validation remains essential, as high R² values alone cannot guarantee model validity [103].
Table 4: Comparative Performance of Linear vs. Non-linear Models in Cancer QSAR
| Cancer Type | Target/Compound Class | Linear Model Performance | Non-linear Model Performance | Key Findings |
|---|---|---|---|---|
| Osteosarcoma | 2-Phenyl-3-(pyridin-2-yl) thiazolidin-4-one derivatives [100] [101] | Heuristic Method: R² = 0.603, R²cv = 0.482 [101] | Gene Expression Programming: R² = 0.839 (training), 0.760 (test) [101] | Non-linear approach showed superior consistency with experimental values and better predictive power |
| Lung Cancer | KRAS inhibitors [3] | PLS: R² = 0.851, RMSE = 0.292 [3] | Random Forest: R² = 0.796 [3] | Linear PLS outperformed non-linear RF in this case, highlighting context dependence |
| Angiogenesis-Related Cancers | VEGFR-2 inhibitors [102] | N/A | XGBoost: Accuracy = 83.67%, AUC = 0.9009 [102] | Ensemble method achieved high prediction accuracy for anti-angiogenic activity |
| Colorectal Cancer | DFT-derived electron density descriptors [2] | N/A | LightGBM with 3D descriptors: AUC increased from 0.88 to 0.96 [2] | Advanced descriptors with non-linear methods significantly enhanced performance |
Multiple validation criteria beyond R² are essential for assessing model reliability. Golbraikh and Tropsha proposed comprehensive criteria including: (1) r² > 0.6 for experimental vs. predicted values, (2) slopes of regression lines through origin between 0.85-1.15, and (3) specific thresholds for the difference between determination coefficients [103]. The Concordance Correlation Coefficient (CCC) has also been suggested as a robust validation metric, with CCC > 0.8 indicating a valid model [103].
Recent research emphasizes that no single metric can comprehensively validate QSAR models, necessitating multiple validation approaches including external validation, cross-validation, and statistical significance testing [103]. The Applicability Domain assessment further ensures predictions remain within validated chemical space, with studies showing that compounds outside this domain yield unreliable predictions regardless of the modeling approach [104].
Implementing robust QSAR studies requires specialized software tools, databases, and computational resources. The following toolkit summarizes essential resources for cancer-focused QSAR research.
Table 5: Essential Research Toolkit for Cancer QSAR Studies
| Resource Category | Specific Tools/Services | Key Functionality | Application Examples |
|---|---|---|---|
| Chemical Databases | ChEMBL [3] [102], EFSA Pesticides Database [104] | Source of experimental bioactivity data | KRAS (CHEMBL4354832) and VEGFR-2 inhibitor datasets [3] [102] |
| Descriptor Calculation | ChemoPy [3], CODESSA [100] [101], Dragon | Compute molecular descriptors from structures | Constitutional, topological, quantum chemical descriptors [3] |
| Model Development Platforms | Danish QSAR Software [104], OECD QSAR Toolbox [104], DataWarrior [3] | Integrated QSAR modeling environments | Carcinogenicity prediction, de novo molecular design [3] [104] |
| Machine Learning Libraries | scikit-learn, XGBoost [102], randomForest [3] | Implement ML algorithms for QSAR | Random Forest, XGBoost for VEGFR-2 inhibitors [102] |
| Validation Tools | Custom scripts for Golbraikh-Tropsha criteria [103], CCC calculation [103] | Model validation and applicability domain assessment | External validation of QSAR models [103] |
The balance between interpretability and complexity in QSAR modeling represents not merely a technical consideration but a strategic determinant in cancer drug discovery. Linear models provide transparent structure-activity relationships essential for understanding mechanism of action, while non-linear approaches capture complex biological interactions for enhanced predictive accuracy. Rather than an exclusive choice, the most effective strategy involves thoughtful integration of both approaches throughout the drug discovery pipeline.
Initial stages of cancer drug development benefit from linear models that identify key molecular features and establish baseline structure-activity relationships. As projects advance, non-linear models can optimize compound selection and predict complex biological responses. The emerging paradigm of interpretable machine learning—employing techniques like SHAP analysis and LIME—bridges this divide by maintaining predictive power while enabling mechanistic insights [102].
Future directions in cancer QSAR will likely focus on hybrid modeling frameworks that strategically combine linear and non-linear approaches, along with advanced descriptor systems that better capture molecular recognition complexity. As QSAR methodologies continue evolving within oncology applications, maintaining this careful balance between interpretability and complexity will remain fundamental to accelerating the discovery of novel anticancer therapeutics.
Ensuring Predictive Power: Validation Protocols and Comparative Descriptor Performance
In the field of cancer research, Quantitative Structure-Activity Relationship (QSAR) studies are pivotal for accelerating drug discovery. These models predict the biological activity, such as anti-cancer efficacy, of compounds based on their molecular descriptors—quantifiable properties that characterize molecular structure [105] [14]. However, the development of a robust and reliable QSAR model hinges on rigorous validation. Without proper validation, models may suffer from overfitting, where they perform well on the initial data but fail to generalize to new, unseen compounds, potentially leading to costly failures in the drug development pipeline [106].
This guide details two fundamental validation frameworks: internal cross-validation and external test set evaluation. We will explore their theoretical foundations, methodological protocols, and critical importance in developing QSAR models for cancer therapeutics, with a specific focus on the role of molecular descriptors.
Theoretical Foundations and Definitions
Core Concepts
- Internal Validation assesses the expected performance of a prediction method on cases drawn from a population similar to the original training sample. Its primary goal is to estimate model performance and correct for optimism or overfitting within the available dataset [106] [107].
- External Validation evaluates the model's performance on data that is entirely independent of the training process. This tests the model's generalizability to different populations, which could vary in terms of patient demographics, experimental conditions, or molecular scaffold diversity [106] [107].
The Critical Role of Molecular Descriptors in Cancer QSAR
Molecular descriptors are the quantitative inputs that drive QSAR models. In cancer research, these descriptors help link a compound's chemical structure to its cytotoxicity or ability to inhibit specific cancer-related targets, such as the c-Met receptor tyrosine kinase [105]. Commonly used classes of descriptors include:
- Constitutional Descriptors: Reflect the molecular composition (e.g., atom and bond counts).
- Topological Descriptors: Encode information about the molecular graph (e.g., connectivity indices).
- Geometrical Descriptors: Pertain to the 3D shape and size of the molecule.
- Quantum Chemical Descriptors: Derived from quantum mechanical calculations (e.g., energies of molecular orbitals, dipole moment) and are often computed using methods like Density Functional Theory (DFT) at the B3LYP/6-31G level [14].
The choice and calculation of these descriptors are critical, as they form the basis upon which the predictive model is built and validated.
Methodological Protocols
Internal Cross-Validation: Detailed Workflow
Internal cross-validation uses the available dataset to both build and assess the model. The following are common techniques:
- k-Fold Cross-Validation: The dataset is randomly partitioned into k subsets (folds) of approximately equal size. The model is trained k times, each time using k-1 folds for training and the remaining fold for testing. The performance estimates from the k folds are then averaged to produce a single estimate [106].
- Repeated Cross-Validation: To reduce variability, the k-fold cross-validation process is repeated multiple times (e.g., 100 times) with different random partitions of the data. This yields a more stable and reliable performance estimate, expressed as a mean and standard deviation (e.g., CV-AUC ± SD) [106].
- Bootstrapping: This method involves drawing multiple bootstrap samples (e.g., 500) from the original dataset with replacement. A model is built on each bootstrap sample and tested on the data not included in the sample (out-of-bag sample). This allows for the calculation of an optimism statistic, which is used to correct the model's apparent performance [106].
Table 1: Summary of Internal Cross-Validation Methods
| Method | Key Procedure | Key Performance Metric(s) | Advantages | Disadvantages/Limitations |
|---|---|---|---|---|
| k-Fold Cross-Validation | Partition data into k folds; iteratively train on k-1 folds and test on the held-out fold. | Mean AUC across folds; Calibration slope. | Makes efficient use of limited data; provides a robust performance estimate. | Can be computationally expensive for large k or complex models. |
| Repeated Cross-Validation | Performs k-fold CV multiple times with different random splits. | Mean CV-AUC ± Standard Deviation (SD). | Reduces variability of the estimate; provides a measure of precision. | Increases computational cost. |
| Bootstrapping | Creates multiple datasets by sampling with replacement; models are tested on out-of-bag samples. | Optimism-corrected AUC. | Provides a direct estimate of model optimism. | The process can be complex to implement and interpret. |
External Test Set Evaluation: Detailed Workflow
External validation is the gold standard for assessing a model's real-world applicability.
- Holdout Method: In this approach, the initial dataset is split into a training set (e.g., 70-80%) and a holdout test set (e.g., 20-30%) before any model development begins. The model is trained exclusively on the training set, and its final performance is evaluated once on the untouched holdout set [106].
- True External Validation: This involves validating the model on a completely independent dataset. This dataset could be collected from a different institution, a different time period, or could consist of compounds with different molecular scaffolds not represented in the training data [107].
A key aspect of external validation is assessing both discrimination and calibration:
- Discrimination is the model's ability to distinguish between active and inactive compounds, typically measured by the Area Under the Receiver Operating Characteristic Curve (AUC) [106].
- Calibration reflects the agreement between predicted probabilities and observed outcomes. It is often assessed by the calibration slope. A slope of 1 indicates perfect calibration, a slope <1 suggests overfitting (predictions are too extreme), and a slope >1 indicates that predictions are too narrow [106].
Table 2: External Validation Scenarios and Their Impact on Model Performance
| Validation Scenario | Dataset Characteristics | Impact on Model Performance |
|---|---|---|
| Ideal / Similar Population | Test set from a similar population as the training data. | Comparable AUC and good calibration (slope ~1). |
| Different Disease Stages | Test set with different prevalence of disease stages (e.g., Ann Arbor stages in lymphoma) [106]. | AUC can vary with the stage; model may show poor generalizability. |
| Different Technical Standards | Test data generated with different technical parameters (e.g., EARL2 vs. EARL1 PET reconstructions) [106]. | Performance may degrade; calibration can indicate overfitting. |
| Different Risk Thresholds | Application of the model using a different probability cut-off for "high-risk" than used in development. | Alters false positive/negative rates; can severely impact calibration. |
Experimental Protocols in Cancer QSAR
The following protocol is adapted from a study on 4,5,6,7-tetrahydrobenzo[D]-thiazol-2-yl derivatives as c-Met inhibitors [105].
Data Curation and Preparation
- Compound Selection: A series of 48 novel compounds with known experimental IC50 values (the concentration required for 50% inhibition) against the c-Met receptor were selected. The IC50 (nM) values were converted to pIC50 (-logIC50) for modeling.
- Descriptor Calculation: A total of 15 molecular descriptors belonging to different classes (constitutional, topological, physico-chemical, geometrical, quantum) were calculated. Initial geometry was optimized using the MM2 force field, followed by further optimization and quantum chemical descriptor calculation using Gaussian 09W software with the B3LYP/6-31G(d) basis set [105].
Model Development and Validation Workflow
- Data Splitting: The dataset of 48 compounds was partitioned into a training set and an external test set using the k-means method to ensure representative distribution of chemical space.
- Model Building: Three QSAR models were developed using:
- Multiple Linear Regression (MLR)
- Multiple Non-Linear Regression (MNLR)
- Artificial Neural Networks (ANN)
- Validation: The models underwent rigorous validation:
- Internal Validation: Leave-one-out cross-validation was performed.
- External Validation: The models were applied to the held-out test set.
- Y-Randomization: The biological activity data was randomly shuffled to confirm the model was not based on chance correlation.
- Applicability Domain (AD): The chemical space domain where the model makes reliable predictions was defined to identify outliers.
The Scientist's Toolkit: Key Research Reagents and Materials
Table 3: Essential Materials and Software for QSAR Modeling
| Item / Reagent / Software | Function / Explanation |
|---|---|
| c-Met Receptor Tyrosine Kinase | A key oncogenic target protein; its inhibition is a strategy for anti-cancer drug development. |
| 4,5,6,7-tetrahydrobenzo[D]-thiazol-2-yl derivatives | The series of small molecule compounds being investigated for their inhibitory activity. |
| Gaussian 09W Software | A computational chemistry software package used for quantum chemical calculations to derive advanced molecular descriptors (e.g., using DFT/B3LYP/6-31G) [105] [14]. |
| Chem3D & ChemSketch | Software tools used for drawing molecular structures and calculating 2D and 3D molecular descriptors. |
| Crizotinib (PF-02341066) | A known c-Met inhibitor used as a reference or control compound in molecular docking and activity comparisons [105]. |
| Molecular Docking Software | Used to simulate and analyze the binding interactions (e.g., hydrogen bonding) between the candidate inhibitors and the active site of the c-Met receptor. |
| ADMET Prediction Software | Used for in silico evaluation of Absorption, Distribution, Metabolism, Excretion, and Toxicity properties to assess drug-likeness of candidate molecules. |
Visualizing Validation Workflows
The following diagrams, created using Graphviz and adhering to the specified color and contrast guidelines, illustrate the core workflows of internal and external validation.
Internal Cross-Validation Workflow
External Test Set Evaluation Workflow
The integration of robust validation frameworks is non-negotiable in cancer QSAR studies. Internal cross-validation techniques, such as repeated k-fold cross-validation, are essential for model selection and optimism correction, especially when datasets are small. However, they cannot replace the rigor of external validation, which uses a held-out or completely independent dataset to provide the ultimate test of a model's generalizability and predictive power. For a QSAR model predicting anti-cancer activity based on molecular descriptors to be considered truly reliable and ready to guide drug development efforts, it must successfully pass both these validation stages, demonstrating not only excellent discrimination but also sound calibration across diverse chemical and biological contexts.
In the field of cancer drug discovery, Quantitative Structure-Activity Relationship (QSAR) studies serve as a cornerstone for predicting the biological activity of potential therapeutic compounds. The reliability of these models hinges on the use of robust statistical metrics to evaluate their predictive power. This technical guide provides an in-depth examination of four critical performance metrics—R², RMSE, Q², and the Index of Ideality of Correlation (IIC)—framed within the context of cancer research utilizing molecular descriptors. For researchers and drug development professionals, understanding these metrics is paramount for developing trustworthy models that can accurately predict, for instance, the inhibitory concentration (pIC₅₀) of a small molecule against a specific cancer target like KRAS in lung cancer or 17β-HSD3 in prostate cancer [3] [81].
Core Performance Metrics in QSAR Modeling
Definitions and Mathematical Formulations
The assessment of a QSAR model's quality involves distinct metrics that evaluate its fitting performance, internal robustness, and external predictability.
R² (Coefficient of Determination): R² quantifies the proportion of the variance in the dependent variable (e.g., pIC₅₀) that is predictable from the independent variables (molecular descriptors). It is defined as:
( R^2 = 1 - \frac{\Sigma(y - \hat{y})^2}{\Sigma(y - \bar{y})^2} )
where ( y ) is the observed activity, ( \hat{y} ) is the predicted activity, and ( \bar{y} ) is the mean of the observed activities [108]. An R² value close to 1 indicates a model that explains most of the variability in the response variable.
RMSE (Root Mean Square Error): RMSE measures the average magnitude of the prediction errors, in the same units as the response variable. It is calculated as:
( RMSE = \sqrt{\frac{\Sigma(y - \hat{y})^2}{n}} )
A lower RMSE indicates a better fit and higher predictive accuracy [109]. Unlike R², RMSE provides an absolute measure of fit, making it particularly useful for understanding the typical error in the predictions.
Q² (Cross-validated R²): Often denoted as ( Q^2_{LOO} ) (Leave-One-Out cross-validation coefficient), Q² is a key metric for internal validation and robustness. It is calculated by iteratively removing one compound from the training set, rebuilding the model, and predicting the omitted compound's activity [81]. A high Q² value (e.g., > 0.5) suggests that the model is not overfitted and has good internal predictive power [110].
IIC (Index of Ideality of Correlation): The IIC is a more recent metric that penalizes models for large errors in prediction, thereby improving the model's reliability for external prediction sets. It is used in conjunction with the Correlation Intensity Index (CII) as part of the "vector of ideality of correlation" in advanced QSAR software like CORAL [111]. Models developed using IIC as a target function have demonstrated high predictive power, with validation R² values reaching 0.90 in studies on anti-colon cancer chalcone derivatives [21].
Metric Comparison and Interpretation
Table 1: Comparison of Key QSAR Performance Metrics
| Metric | Interpretation | Ideal Value Range | Primary Use |
|---|---|---|---|
| R² | Goodness-of-fit of the model | Close to 1.0 [108] | Explanatory power |
| RMSE | Average prediction error | Close to 0 [109] | Predictive accuracy |
| Q² | Internal predictive robustness | > 0.5 [110] | Model validation |
| IIC | Model reliability for external prediction | Close to 1.0 [21] | Lead optimization |
A successful QSAR model must demonstrate competence across all these metrics. For instance, a model might have a high R² but a low Q², indicating overfitting to the training data and poor predictive capability for new compounds [108]. Therefore, relying on a single metric is insufficient.
Metric Applications in Cancer QSAR Studies
The application of these metrics in cancer research ensures that computational models can reliably guide the discovery of novel anticancer agents.
Lung Cancer KRAS Inhibitors
In a study aimed at discovering novel KRAS inhibitors for lung cancer therapy, multiple machine learning models were benchmarked. The Partial Least Squares (PLS) model demonstrated the best predictive performance, with an impressive R² of 0.851 and a low RMSE of 0.292 on the test set [3]. The Genetic Algorithm-Multiple Linear Regression (GA-MLR) model, while slightly less predictive (R² = 0.677), offered greater interpretability. The high R² and low RMSE values gave researchers confidence to proceed with virtual screening, which identified a novel compound (C9) with a predicted pIC₅₀ of 8.11 as a promising hit for synthesis and experimental testing [3].
Prostate Cancer 17β-HSD3 Inhibitors
A QSAR study on 35 inhibitors of 17β-HSD3, a target for prostate cancer, employed both GA-MLR and GA-Support Vector Machine (SVM) approaches. The GA-MLR model yielded a fitting R² of 0.779 and an RMSE of 0.443 for the training set [81]. The model's internal robustness was confirmed by a Q²LOO of 0.674, and its external predictive power was validated on a test set (R²test = 0.823, RMSEtest = 0.531). This combination of metrics provided a strong foundation for the model's use in designing new inhibitors with predicted high activity [81].
Colon Cancer Chalcone Analogues
Research into anti-colon cancer chalcone analogues utilized the Monte Carlo method with IIC as a target function in CORAL software. The best model, known as Split #2, achieved outstanding validation metrics: R²validation = 0.90, IICvalidation = 0.81, and Q²_validation = 0.89 [21]. The use of IIC helped develop a model with high robustness and precision, enabling the accurate prediction of pIC₅₀ values for new chalcone derivatives retrieved from the ChEMBL database [21].
Table 2: Exemplary QSAR Model Performance in Cancer Research
| Cancer Type / Target | Model Type | R² | RMSE | Q² | IIC | Source |
|---|---|---|---|---|---|---|
| Lung Cancer (KRAS) | PLS | 0.851 | 0.292 | - | - | [3] |
| Prostate Cancer (17β-HSD3) | GA-MLR | 0.779 (Training) | 0.443 (Training) | 0.674 (LOO) | - | [81] |
| Colon Cancer (Chalcones vs. HT-29) | Monte Carlo (IIC) | 0.90 (Validation) | - | 0.89 (Validation) | 0.81 | [21] |
| ALK Tyrosine Kinase | GA-MLR | 0.86 | 0.48 | 0.86 (LMO) | - | [110] |
Experimental Protocols for Model Validation
A rigorous QSAR modeling workflow involves distinct steps to ensure the developed model is both descriptive and predictive.
Data Preparation and Splitting
The first step involves curating a dataset of compounds with experimentally measured activities (e.g., IC₅₀). The chemical structures are drawn and optimized to their minimum energy conformations using software like HyperChem [81]. Subsequently, molecular descriptors are calculated using tools such as Dragon or PaDEL-Descriptor [81] [13]. The dataset is then rationally divided into training and test sets. This can be achieved via:
- Hierarchical Clustering: Grouping structurally similar compounds and selecting training/test molecules from each cluster to ensure representativeness [81].
- Random Stratified Sampling: Splitting the data (e.g., 70% training, 30% test) while preserving the overall activity distribution [3].
Model Development and Validation
The training set is used to build the model using various algorithms (e.g., MLR, PLS, SVM, Random Forest). The model's performance is then rigorously validated [110] [3] [13].
- Internal Validation: This assesses the model's robustness, typically through:
- Leave-One-Out (LOO) Cross-Validation: Calculates the Q²LOO metric [81].
- Leave-Many-Out (LMO) Cross-Validation: Another measure of internal predictive power [110].
- Y-Scrambling: A technique to rule out chance correlation, where the model is rebuilt with randomly shuffled activity data. A significantly lower R² for scrambled models confirms the model's validity [110] [81].
- External Validation: This is the gold standard for evaluating predictive power. The finalized model, built only on the training set, is used to predict the activities of the hitherto unseen test set compounds. The R²ext and RMSEext between the experimental and predicted test set activities are calculated [108] [81].
- Domain of Applicability (DOA): The chemical space where the model's predictions are reliable is defined. The Mahalanobis Distance can be used, where a threshold is set (e.g., 95th percentile of the χ² distribution). Compounds falling outside this domain are considered unreliable predictions [3].
Diagram 1: The workflow for developing and validating a QSAR model, highlighting the critical stages of internal and external validation.
The Scientist's Toolkit: Essential Research Reagents and Software
Table 3: Key Software and Tools for Cancer QSAR Studies
| Tool/Reagent | Type | Primary Function in QSAR | Example Use Case |
|---|---|---|---|
| Dragon | Software | Calculates thousands of molecular descriptors from chemical structures. | Descriptor calculation for 17β-HSD3 inhibitors [81]. |
| CORAL | Software | Builds QSAR models using SMILES notation and the Monte Carlo method with IIC. | Developing predictive models for anti-colon cancer chalcones [21]. |
| ChemoPy | Python Package | Computes molecular descriptors for use with machine learning algorithms. | Generating descriptors for KRAS inhibitor dataset [3]. |
| AutoDock | Software | Performs molecular docking to generate protein-ligand conformers. | Generating conformers for receptor-dependent 4D-QSAR models [35]. |
| GDSC2 Database | Database | Provides biological screening data for anticancer compounds and combinations. | Sourcing data for breast cancer combinational QSAR models [13]. |
The rigorous application and interpretation of performance metrics—R², RMSE, Q², and IIC—are fundamental to advancing credible QSAR models in cancer research. These metrics collectively provide a comprehensive picture of a model's explanatory power, predictive accuracy, internal robustness, and reliability for prospective compound screening. As evidenced by their successful application in discovering inhibitors for lung, prostate, and colon cancer targets, a meticulous validation protocol is not merely a statistical exercise but a critical step in bridging computational predictions with experimental drug discovery. By adhering to these standards, researchers can prioritize the most promising drug candidates with greater confidence, ultimately accelerating the development of novel cancer therapeutics.
The efficacy of a Quantitative Structure-Activity Relationship (QSAR) model is fundamentally determined by the molecular descriptors it employs. These numerical representations of molecular structure encode chemical information that can be correlated with biological activity, forming the cornerstone of computational drug discovery [23]. In oncology research, where the chemical space of potential therapeutics is vast and biological systems are complex, selecting optimal descriptors presents a significant challenge. This review provides a systematic comparison of molecular descriptor performance across major cancer types, synthesizing findings from recent QSAR studies to guide descriptor selection for anti-cancer drug discovery. We examine how different descriptor classes—from traditional 2D indices to advanced 3D electron density features—perform in predicting compound activity against colorectal, lung, breast cancer, and melanoma, offering a framework for rational descriptor selection in targeted oncological applications.
Molecular Descriptor Classes in Cancer Research
Molecular descriptors in QSAR modeling span multiple dimensions of chemical representation, each capturing distinct structural attributes with implications for predicting anti-cancer activity.
Traditional 1D/2D descriptors encompass constitutional, topological, and electronic features derived from molecular graph representations. These include widely-used indices such as the Zagreb indices, Randić index, and other topological descriptors that quantify molecular connectivity and branching patterns [10] [11]. Their computational efficiency enables rapid screening of large compound libraries, though they may lack detailed stereochemical information.
3D electron cloud descriptors represent a more sophisticated approach that captures the spatial distribution of electrons within molecules. Calculated using Density Functional Theory (DFT), these descriptors are transformed into 3D point clouds and encoded through multi-scale descriptor sets incorporating radial distribution functions, spherical harmonic expansions, point feature histograms, and persistent homology [112]. This comprehensive representation captures molecular characteristics across statistical, geometric, and topological levels, offering enhanced ability to model complex biomolecular interactions.
Specialized graph-theoretical descriptors include recently developed indices such as entire neighborhood topological indices and resolving topological indices, which integrate concepts from mathematical graph theory to characterize molecular structures [10] [11]. These descriptors have demonstrated particular utility in modeling the physicochemical properties of anti-cancer compounds, including molar volume, polarizability, molar refractivity, and polar surface area.
Table 1: Classification of Molecular Descriptors Used in Cancer QSAR Studies
| Descriptor Class | Representative Types | Structural Information Captured | Computational Cost |
|---|---|---|---|
| 1D/2D Descriptors | Constitutional, Topological Indices (e.g., Zagreb, Randić), Walk Counts, Information Indices | Molecular connectivity, atom/bond counts, branching patterns, molecular symmetry | Low |
| 3D Electron Cloud Descriptors | Radial Distribution Functions, Spherical Harmonic Expansions, Point Feature Histograms, Persistent Homology | Electron density distribution, molecular orbital characteristics, shape, electrostatic potential | High |
| Specialized Graph Descriptors | Entire Neighborhood Indices, Resolving Topological Indices, Metric Dimension-Based Descriptors | Atomic neighborhood topology, distance-based relationships, molecular complexity | Moderate |
Performance Comparison Across Cancer Types
Colorectal Cancer: The Advantage of 3D Electron Density Descriptors
In colorectal cancer research, conventional QSAR descriptors have demonstrated limitations in capturing the electronic and spatial complexity of molecular structures. A breakthrough study addressing this challenge developed a high-dimensional QSAR modeling framework based on three-dimensional electron density features, where electron densities were computed using density functional theory (DFT) and transformed into 3D point clouds [112].
Across multiple machine learning models, these 3D electron cloud descriptors consistently enhanced predictive performance compared to conventional descriptors. With the Light Gradient Boosting Machine (LightGBM) algorithm, the Area Under the Curve (AUC) improved from 0.88 with conventional descriptors to 0.96 with the 3D electron cloud descriptors, representing a substantial improvement in predictive accuracy [112]. Feature attribution analysis identified local geometric descriptors and intensity-based electronic features as primary contributors to this enhanced performance. The integration of these advanced descriptors with traditional 1D/2D features further improved model accuracy, demonstrating their strong complementarity with conventional approaches.
Lung Cancer: Machine Learning Optimization with Traditional Descriptors
QSAR studies targeting lung cancer have predominantly utilized traditional molecular descriptors optimized through advanced machine learning algorithms. In one investigation focused on KRAS inhibitors for lung cancer therapy, researchers computed molecular descriptors for 62 inhibitors using Chemopy and evaluated five machine learning algorithms: partial least squares (PLS), random forest (RF), stepwise multiple linear regression (MLR), genetic algorithm optimized MLR (GA-MLR), and XGBoost [3].
The PLS model exhibited the best predictive performance (R² = 0.851; RMSE = 0.292), followed by RF (R² = 0.796) [3]. The GA-MLR model, based on eight optimized molecular descriptors, achieved good interpretability and robust internal validation (R² = 0.677). This study demonstrated that appropriate machine learning algorithm selection could extract substantial predictive value from traditional descriptor sets, with feature selection playing a critical role in model performance. Virtual screening of 56 de novo designed compounds within the model's applicability domain successfully identified a promising hit (compound C9) with a predicted pIC50 of 8.11, validating the practical utility of this approach [3].
Breast Cancer: Dominance of Topological Indices
Breast cancer QSAR research has extensively leveraged topological descriptors, with recent studies introducing novel indices that show exceptional performance. Research on 16 breast cancer drugs established strong correlations between entire neighborhood topological indices and key physicochemical properties including molar volume, polar refractivity, and surface tension [10]. These indices mathematically characterize molecular graphs by incorporating information about vertex degrees within atomic neighborhoods, providing enhanced predictive capability for drug properties.
Another breast cancer study investigated resolving topological indices derived from metric dimension concepts in graph theory [11]. These indices, which identify the smallest vertex subsets that uniquely determine all other vertices by distance, demonstrated high predictive accuracy for polar surface area, molar refractivity, and surface tension when incorporated into multiple linear regression models. The structural insights provided by these advanced topological indices have proven particularly valuable for modeling the complex structure-activity relationships of breast cancer therapeutics, especially for compounds targeting estrogen receptor alpha (ERα) [22].
Melanoma: Diverse Descriptor Performance
Research on melanoma cell lines (SK-MEL-5) has evaluated diverse descriptor blocks, revealing notable performance variations. One comprehensive assessment tested 13 blocks of molecular descriptors with four machine learning classifiers: random forest (RF), gradient boosting, support vector machine, and random k-nearest neighbors [85].
Among 186 models developed, the top seven performers all utilized the random forest algorithm combined with specific descriptor types: topological descriptors, information indices, 2D-autocorrelation descriptors, P-VSA-like descriptors, and edge-adjacency indices [85]. These models achieved positive predictive values exceeding 0.85 in both nested cross-validation and external dataset testing, demonstrating robust performance. Notably, models based solely on molecular properties showed poor performance, highlighting the importance of descriptor selection for melanoma cytotoxicity prediction.
Table 2: Descriptor Performance Across Cancer Types
| Cancer Type | Optimal Descriptor Classes | Best Performing Algorithms | Key Performance Metrics | Notable Active Compounds |
|---|---|---|---|---|
| Colorectal Cancer | 3D Electron Cloud Descriptors, Hybrid (3D + 1D/2D) Sets | LightGBM, Multiple Machine Learning Models | AUC: 0.96 (improved from 0.88) | Anti-colorectal cancer compounds from ChEMBL |
| Lung Cancer | Traditional Chemopy Descriptors (Topological, Constitutional, Geometrical, Electronic) | PLS, Random Forest, GA-MLR, XGBoost | R² = 0.851, RMSE = 0.292 | KRAS inhibitors, Compound C9 (pIC50 8.11) |
| Breast Cancer | Entire Neighborhood Topological Indices, Resolving Topological Indices | Multiple Linear Regression, Cubic Regression | Strong correlations with MV, P, MR, PSA, ST | 1,3-diphenyl-1H-pyrazole derivatives, Naphthoquinone derivatives |
| Melanoma | Topological Descriptors, Information Indices, 2D-Autocorrelations, P-VSA-like, Edge-Adjacency Indices | Random Forest | PPV > 0.85 | Cytotoxic compounds from PubChem database |
Experimental Protocols and Methodologies
Workflow for 3D Electron Cloud Descriptor Modeling
The application of 3D electron cloud descriptors in colorectal cancer research follows a rigorous computational workflow [112]:
Density Functional Theory Calculations: Molecular structures are first optimized using DFT at appropriate basis sets (e.g., B3LYP/6-31G*) to compute electron densities and generate accurate 3D electron clouds.
Point Cloud Transformation: The continuous electron density fields are discretized into 3D point clouds, preserving spatial electronic distribution information.
Multi-Scale Descriptor Encoding: The point clouds are encoded through four complementary approaches:
- Radial distribution functions capturing atom-type specific distance patterns
- Spherical harmonic expansions representing shape characteristics
- Point feature histograms quantifying local geometry
- Persistent homology descriptors characterizing topological features
Machine Learning Integration: The encoded descriptors serve as input for machine learning algorithms, with feature attribution analysis identifying the most influential descriptors.
QSAR Model Validation Framework
Robust validation is essential for reliable QSAR models, with standard protocols including:
- Statistical Validation: R², Q², RMSE, MAE for regression models; AUC, PPV, accuracy for classification models
- Applicability Domain Assessment: Mahalanobis Distance (MD) with χ² distribution threshold to identify compounds within model scope [3]
- Y-Scrambling: Permutation testing to confirm non-random model performance [85]
- External Validation: Hold-out test set evaluation to assess predictive capability on unseen data
Table 3: Computational Tools for Descriptor Calculation and QSAR Modeling
| Tool/Software | Primary Function | Descriptor Types Generated | Application in Cancer Research |
|---|---|---|---|
| Dragon | Molecular descriptor calculation | 20+ descriptor blocks including topological, constitutional, 2D/3D descriptors | Broad-spectrum cancer QSAR studies [85] |
| Chemopy | Python-based descriptor calculation | Topological, constitutional, geometrical, electronic features | KRAS inhibitor modeling for lung cancer [3] |
| PaDEL-Descriptor | Molecular descriptor and fingerprint calculation | 1D, 2D descriptors and fingerprints | Breast cancer drug modeling [22] |
| DFT Software (Gaussian, Spartan) | Quantum chemical calculations | 3D electron density properties, orbital energies | 3D electron cloud descriptors for colorectal cancer [112] |
| CORAL Software | QSAR model development | SMILES-based descriptors, graph-based descriptors | Naphthoquinone derivatives for breast cancer [77] |
| AutoDock | Molecular docking | Binding affinity predictions, interaction patterns | Virtual screening for breast cancer inhibitors [22] |
This comparative analysis reveals that optimal descriptor selection in cancer QSAR studies is highly context-dependent, influenced by cancer type, biological target, and dataset characteristics. Three-dimensional electron cloud descriptors demonstrate superior performance for colorectal cancer applications, capturing electronic and steric features critical for activity prediction. Traditional descriptors coupled with advanced machine learning algorithms show excellent efficacy in lung cancer research, particularly for KRAS inhibitors. Breast cancer studies benefit significantly from novel topological indices that encode complex molecular connectivity patterns, while melanoma research achieves best results with descriptor ensembles including topological and edge-adjacency indices. The integration of multiple descriptor types through hybrid approaches consistently outperforms single-descriptor-class models across cancer types, highlighting the value of multi-faceted molecular representations. As QSAR methodologies continue to evolve, the strategic selection and integration of complementary descriptor classes will remain paramount for accelerating anti-cancer drug discovery.
The optimization of natural products into viable therapeutic agents represents a cornerstone of modern drug discovery. Shikonin, a naphthoquinone isolated from Lithospermum erythrorhizon, exhibits a striking profile of biological activities, including potent antiviral, antibacterial, and anticancer effects [113]. However, its development has been hampered by significant non-specific cytotoxicity, necessitating structural modifications to improve its therapeutic index [113] [114]. This case study explores the application of three distinct Quantitative Structure-Activity Relationship (QSAR) modeling techniques—Principal Component Regression (PCR), Partial Least Squares (PLS), and Random Forest (RF)—in optimizing shikonin derivatives for anticancer activity, framed within the broader context of molecular descriptor utilization in cancer research.
QSAR modeling mathematically links a chemical compound's structure to its biological activity by using molecular descriptors as predictor variables and biological activity as the response variable [15]. The molecular descriptors quantitatively encode structural, physicochemical, and electronic properties of molecules, providing the fundamental data for these models [32] [115]. In cancer research, where traditional drug development faces challenges of toxicity, resistance, and lack of selectivity, QSAR approaches enable the systematic identification of structural modifications that optimize pharmacological profiles [37]. This case study demonstrates how different QSAR methodologies can be leveraged to refine shikonin derivatives, highlighting the critical role of molecular descriptors in bridging chemical structure and biological activity in oncological drug discovery.
Theoretical Foundations of QSAR Modeling
Molecular Descriptors in Cancer Research
Molecular descriptors serve as numerical representations of a molecule's structural and physicochemical characteristics, forming the foundational language of QSAR modeling. These descriptors are systematically categorized based on the complexity of molecular information they encode:
- Constitutional Descriptors: Elementary properties including molecular weight, atom counts, and bond counts.
- Topological Descriptors: Graph-theoretical indices derived from molecular connectivity patterns.
- Geometric Descriptors: Parameters related to molecular size and shape.
- Electronic Descriptors: Quantities describing electron distribution, such as HOMO-LUMO energies and dipole moments.
- Thermodynamic Descriptors: Features reflecting energetic and solubility properties [32] [15].
In cancer-focused QSAR studies, descriptor selection is guided by their relevance to biological mechanisms. Electronic descriptors often correlate with binding interactions, hydrophobic descriptors influence membrane permeability, and steric descriptors affect fit into binding pockets [37]. For shikonin derivatives, specific descriptor classes have proven particularly informative. Lipophilicity descriptors (e.g., logP) correlate with membrane penetration in cancer cells, while surface area and volume descriptors influence target binding affinity [116]. Quantum chemical descriptors, such as HOMO-LUMO gaps, provide insight into electron transfer processes relevant to shikonin's redox-based mechanisms of action [32].
Principal Component Regression (PCR) combines principal component analysis (PCA) with linear regression. PCA first transforms the original, potentially correlated descriptors into a set of orthogonal principal components that capture maximum variance in the descriptor data. Regression is then performed on these reduced components, mitigating multicollinearity issues while potentially excluding components relevant to activity prediction [36].
Partial Least Squares (PLS) regression extends the PCR approach by explicitly maximizing the covariance between descriptor variables and the response variable (biological activity). Unlike PCR, which focuses solely on descriptor variance, PLS identifies latent factors that simultaneously explain descriptor variance and predict biological activity, often making it more efficient for QSAR modeling [37] [15].
Random Forest (RF) is an ensemble, non-linear machine learning method that constructs multiple decision trees during training and outputs the average prediction of the individual trees. RF models excel at capturing complex, non-linear relationships between descriptors and activity without requiring predefined functional forms. Their built-in feature importance ranking provides valuable insights into which molecular descriptors most significantly influence biological activity [32] [116].
Comparative Performance in Shikonin Optimization
Quantitative Comparison of Model Performance
Table 1: Performance Metrics of QSAR Models Applied to Shikonin Derivatives
| Model Type | R² Value | RMSE | NRMSE | Dataset | Key Advantage |
|---|---|---|---|---|---|
| PCR | 0.912 [37] | 0.119 [37] | - | Acylshikonin derivatives [37] | High predictive performance on congeneric series |
| PLS | - | - | - | Sulfur-containing shikonin oximes [116] | Handles descriptor multicollinearity effectively |
| Random Forest | >0.7 [116] | - | <20% [116] | Sulfur-containing shikonin oximes [116] | Captures complex non-linear structure-activity relationships |
Table 2: Molecular Descriptor Importance in Shikonin Derivative QSAR
| Descriptor Category | PCR Relevance | PLS Relevance | Random Forest Importance | Biological Interpretation |
|---|---|---|---|---|
| Lipophilicity | High [37] | High [15] | High [116] | Impacts cell membrane permeability and bioavailability |
| Surface Area/Volume | Moderate [37] | Moderate [15] | High [116] | Influences binding pocket accommodation and molecular interactions |
| Electronic Parameters | High [37] | High [15] | Moderate [116] | Affects protein binding and redox properties |
| Topological Indices | Moderate [37] | Moderate [15] | High [116] | Encodes molecular connectivity and branching patterns |
Case Study: Sulfur-Containing Shikonin Oxime Derivatives
A recent investigation into sulfur-containing shikonin oxime derivatives demonstrated the application of these QSAR approaches across four cancer cell lines: HCT-15 (colon), MGC-803 (gastric), BEL-7402 (liver), and MCF-7 (breast) [116]. The study revealed that cytotoxic activity against all four cancer types was accurately predictable using machine learning approaches, with Random Forest achieving particularly strong performance (R² > 0.7, NRMSE < 20%) [116]. The key molecular descriptors identified as critical for cytotoxic activity included lipophilicity, surface area, and volume parameters, highlighting their fundamental role in the anticancer activity of these shikonin analogs [116].
The research employed a combination of search and machine learning algorithms to establish robust structure-activity relationships, demonstrating how computational approaches can guide multi-cancer drug design by identifying optimal structural modifications to the shikonin core scaffold [116].
Case Study: Acylshikonin Derivatives and PCR Modeling
In a separate study focusing on acylshikonin derivatives, researchers implemented an integrated in silico framework to evaluate 24 compounds [37]. The PCR model demonstrated exceptional predictive performance with an R² value of 0.912 and RMSE of 0.119, emphasizing the significance of electronic and hydrophobic descriptors in mediating cytotoxic activity [37]. Molecular docking simulations conducted alongside QSAR analysis identified compound D1 as the most promising derivative, forming multiple stabilizing hydrogen bonds and hydrophobic interactions with key residues of the cancer-associated target 4ZAU [37].
This integrated QSAR-docking-ADMET workflow successfully rationalized the structure-activity relationship of shikonin derivatives and provided a framework for prioritizing lead candidates, highlighting the practical utility of PCR modeling in shikonin derivative optimization [37].
Experimental Protocols and Methodologies
QSAR Model Development Workflow
Diagram 1: QSAR Model Development Workflow
Detailed Experimental Protocol
Dataset Curation and Preparation
The initial phase involves compiling a high-quality dataset of shikonin derivatives with associated biological activity data. For anticancer applications, this typically includes half-maximal inhibitory concentration (IC₅₀) values or percentage inhibition across relevant cancer cell lines [116]. The dataset must be carefully curated to remove duplicates, standardize chemical structures (handling tautomers, stereochemistry, and removing salts), and convert biological activities to consistent units [15]. The resulting dataset is typically split into training (for model development), validation (for hyperparameter tuning), and external test sets (for final model evaluation) to ensure robust assessment [15].
Molecular Descriptor Calculation and Selection
Molecular descriptors are calculated using specialized software packages such as Dragon, PaDEL-Descriptor, or Mordred, which can generate thousands of descriptors per compound [115]. Following calculation, feature selection techniques are critical to identify the most relevant descriptors and avoid overfitting. Common approaches include:
- Filter Methods: Ranking descriptors based on individual correlation with biological activity
- Wrapper Methods: Using the modeling algorithm itself to evaluate descriptor subsets
- Embedded Methods: Performing feature selection during model training (e.g., LASSO regression) [15]
For shikonin derivatives, particular attention should be paid to descriptors encoding lipophilicity, electronic properties, and steric parameters, which have demonstrated consistent importance in previous studies [37] [116].
Model Training and Validation
The training set is used to build QSAR models using PCR, PLS, and Random Forest algorithms. PCR involves principal component analysis followed by regression on the principal components [37]. PLS regression identifies latent variables maximizing covariance between descriptors and activity [15]. Random Forest constructs multiple decision trees through bootstrap aggregation and feature randomization [116].
Model validation employs both internal and external techniques. Internal validation typically uses k-fold cross-validation or leave-one-out cross-validation on the training set. External validation assesses the final model on the held-out test set to estimate real-world performance [15]. Critical validation metrics include R² (coefficient of determination), RMSE (root mean square error), and Q² (cross-validated R²) [37].
Applicability Domain Assessment
The applicability domain defines the chemical space where the model can make reliable predictions based on the structural characteristics of the training set compounds. This crucial step determines whether a shikonin derivative falls within the model's predictive scope or represents an extrapolation beyond its validated boundaries [36].
Table 3: Essential Resources for Shikonin QSAR Studies
| Resource Category | Specific Tools/Software | Application in Shikonin QSAR |
|---|---|---|
| Descriptor Calculation | Dragon [115], PaDEL-Descriptor [15], Mordred [115] | Generates molecular descriptors for shikonin derivatives |
| QSAR Modeling | QSAR Toolbox [36], scikit-learn [32], KNIME [32] | Builds and validates PCR, PLS, and Random Forest models |
| Data Sources | EFSA Pesticides Database [36], ChEMBL, PubChem | Provides structural and bioactivity data for model training |
| Molecular Docking | AutoDock, GOLD, MOE | Validates QSAR predictions through binding pose analysis [37] |
| ADMET Prediction | SwissADME, pkCSM | Evaluates drug-likeness and pharmacokinetic properties [37] |
Integrated Optimization Strategy for Shikonin Derivatives
Decision Framework for Algorithm Selection
Diagram 2: QSAR Algorithm Selection Guide
Integrated Workflow for Shikonin Derivative Optimization
Based on the comparative analysis of PCR, PLS, and Random Forest performance characteristics, an integrated workflow emerges for optimizing shikonin derivatives:
Initial Screening with PLS: Begin with PLS regression for efficient modeling of shikonin congeneric series, particularly when facing high descriptor correlation. PLS provides robust linear modeling while handling multicollinearity more effectively than standard regression approaches [15].
Mechanistic Insight with PCR: Employ PCR when mechanistic interpretability is prioritized, as the principal components often align with chemically meaningful latent factors. PCR's performance with shikonin derivatives (R² = 0.912 in acylshikonin studies) makes it valuable for establishing foundational structure-activity relationships [37].
Complex Relationship Capture with Random Forest: Implement Random Forest modeling to capture non-linear effects and complex descriptor interactions, particularly for larger datasets encompassing diverse shikonin analog structures. RF's feature importance metrics help identify critical molecular descriptors guiding synthetic efforts [116].
Validation and Prioritization: Utilize molecular docking against cancer targets (e.g., 4ZAU) to validate QSAR predictions [37]. Combine this with ADMET profiling to ensure optimized shikonin derivatives maintain favorable drug-like properties while enhancing anticancer activity.
This integrated approach leverages the complementary strengths of each algorithm, providing a comprehensive strategy for advancing shikonin derivatives through the drug discovery pipeline.
This case study demonstrates that PCR, PLS, and Random Forest each offer distinct advantages in the QSAR-driven optimization of shikonin derivatives for anticancer applications. PCR provides exceptional predictive performance and interpretability for congeneric series, PLS effectively handles descriptor collinearity, and Random Forest captures complex non-linear relationships in diverse chemical datasets. The optimal selection and integration of these computational approaches, guided by robust molecular descriptor analysis, accelerates the transformation of naturally inspired scaffolds into targeted therapeutic agents. As shikonin derivative research advances, continued refinement of these QSAR methodologies will play an increasingly vital role in bridging chemical structure and biological activity for oncology drug discovery.
Within modern oncology drug discovery, Quantitative Structure-Activity Relationship (QSAR) models are indispensable for predicting the biological activity of novel compounds against cancer targets. The reliability of these predictions, however, is constrained to a specific region of chemical space known as the Applicability Domain (AD). According to the Organization for Economic Co-operation and Development (OECD) principles, defining a model's AD is a mandatory step for regulatory acceptance, as it delineates the boundaries within which the model provides reliable interpolations [80] [79]. The Mahalanobis distance is a statistically robust method for defining this domain, accounting for the underlying correlation structure of the molecular descriptor data. In the context of cancer research, where molecular descriptors encode critical information about a compound's potential to interact with therapeutic targets, the rigorous assessment of AD is paramount for prioritizing candidates for costly and time-consuming experimental validation [23] [37]. This technical guide details the implementation of Mahalanobis distance with χ² distribution thresholds for AD assessment, framed within cancer QSAR studies.
Theoretical Foundations of Mahalanobis Distance
The Mahalanobis distance (D²) is a multivariate statistical measure that quantifies the distance of a point from the center of a distribution, while taking into account the covariance structure among the variables. Unlike Euclidean distance, it is scale-invariant and accounts for correlated descriptors, which are common in molecular datasets [80] [117].
For a chemical compound represented by a vector of p molecular descriptors, x = [x₁, x₂, ..., xₚ], its Mahalanobis distance to the mean of the training set distribution is calculated as:
D² = (x - μ)ᵀ S⁻¹ (x - μ)
Where:
- μ is the p-dimensional mean vector of the training set descriptors.
- S⁻¹ is the inverse of the covariance matrix of the training set descriptors.
- T denotes the transpose of the matrix.
The calculated D² values follow a chi-squared (χ²) distribution with p degrees of freedom, provided the descriptor data approximates a multivariate normal distribution [117]. This key relationship forms the basis for setting probabilistic thresholds to define the applicability domain.
Table 1: Key Components of the Mahalanobis Distance Calculation
| Component | Symbol | Description | Role in AD Assessment |
|---|---|---|---|
| Query Compound Vector | x | A vector of p molecular descriptors for the new compound. | Represents the compound whose position in chemical space is being evaluated. |
| Training Set Mean | μ | The mean value for each descriptor across all training set compounds. | Defines the center of the model's known chemical space. |
| Covariance Matrix | S | A p x p matrix capturing the variances and covariances of all descriptor pairs in the training set. | Encodes the shape and correlation structure of the training set's chemical space. |
| Mahalanobis Distance | D² | The computed distance of the query compound from the training set center. | The quantitative measure used to accept or reject a compound from the AD. |
Establishing the χ² Threshold for the Applicability Domain
The transition from a calculated Mahalanobis distance to a definitive boundary for the applicability domain is achieved through the chi-squared distribution. A threshold distance (D²*) is established such that compounds with a D² value exceeding this threshold are considered outliers, or outside the AD [80].
The standard method for setting this threshold is:
D²* = χ²ₚ, α
Where:
- p is the number of descriptors (degrees of freedom).
- α is a chosen significance level (e.g., 0.05 or 0.01).
- χ²ₚ, α is the critical value from the chi-squared distribution with p degrees of freedom at the (1-α) confidence level.
A crucial and often-misstated aspect of this process involves the correct number of degrees of freedom. As demonstrated through virtual ecology experiments, the Mahalanobis distance follows a chi-squared distribution with degrees of freedom equal to the number of descriptor dimensions (p), not p-1 [117]. Using an incorrect degrees-of-freedom value leads to a systematic underestimation of the true applicability domain, potentially excluding valid compounds from prediction.
Table 2: Common χ² Thresholds for Different Dimensions and Confidence Levels
| Descriptor Dimensions (p) | χ² Threshold (95%) | χ² Threshold (99%) | Coverage of Training Set |
|---|---|---|---|
| 5 | 11.07 | 15.09 | Defines a 95% or 99% confidence ellipsoid in 5D space. |
| 10 | 18.31 | 23.21 | Appropriate for models using a moderate number of descriptors. |
| 15 | 25.00 | 30.58 | Suitable for larger descriptor sets; threshold increases with dimensionality. |
| 20 | 31.41 | 37.57 | Used in complex models with high-dimensional chemical spaces. |
Workflow for AD Assessment in Cancer QSAR Studies
Implementing the Mahalanobis distance-based AD assessment involves a sequential process that integrates directly into a QSAR modeling pipeline for cancer drug discovery. The following workflow and diagram illustrate the key steps from model training to the final AD decision for a novel anti-cancer compound.
Workflow for Mahalanobis Distance-based AD Assessment
Step-by-Step Protocol
- Model Training and Descriptor Calculation: Develop a QSAR model using a training set of compounds with known activity against a specific cancer target (e.g., KRAS or EGFR). Calculate the same p molecular descriptors for all training compounds [3] [37].
- Characterize Training Set Distribution: From the training set descriptor matrix, compute the mean vector (μ) and the covariance matrix (S). Invert the covariance matrix to obtain S⁻¹ [117].
- Define the AD Threshold: Select a confidence level (α, typically 0.05) and determine the corresponding critical value D²* from the chi-squared distribution with p degrees of freedom [80] [117].
- Assess New Compounds: For a novel query compound (e.g., a newly designed chalcone derivative or KRAS inhibitor), calculate its vector of p molecular descriptors. Apply the formula to compute its Mahalanobis distance, D², relative to the training set [3] [21].
- Make the AD Decision: If D² ≤ D², the compound is within the applicability domain, and its QSAR prediction is deemed reliable. If D² > D², the compound is an extrapolation, and its prediction should be treated with caution or rejected [79] [80].
Table 3: Key Research Reagents and Computational Tools for AD Assessment
| Item / Resource | Function in AD Assessment | Example Use in Protocol |
|---|---|---|
| Standardized Chemical Dataset | A curated set of structures with associated bioactivity for a cancer target. | Serves as the training set to build the QSAR model and define the chemical space [3] [21]. |
| Molecular Descriptor Calculator | Software to compute numerical representations of chemical structures. | Generates the descriptor vectors (x) for each compound. Examples: DRAGON, PaDEL, RDKit [32]. |
| Statistical Software | An environment for matrix algebra and statistical calculations. | Used to compute μ, S, S⁻¹, and D². Examples: Python (NumPy, SciPy), R [82] [80]. |
| χ² Distribution Table/Function | A reference for critical values of the chi-squared distribution. | Provides the threshold D²* based on the chosen α and descriptor count p [117]. |
| Validated QSAR Model | The predictive model linking descriptors to biological activity (e.g., pIC₅₀). | Provides the context for which the AD is defined; used to predict activity for compounds within the AD [37] [3]. |
Case Study in Cancer Research: KRAS Inhibitor Discovery
The practical utility of this methodology is exemplified in a QSAR study aimed at discovering novel KRAS inhibitors for lung cancer therapy. Researchers developed a model using 62 known inhibitors from the ChEMBL database [3].
- Experimental Protocol: Molecular descriptors were calculated and standardized. A genetic algorithm was used for descriptor selection, and a partial least squares (PLS) model was trained, achieving a high R² of 0.851. The applicability domain was defined using the Mahalanobis distance method.
- AD Implementation: The mean (μ) and covariance matrix (S) were derived from the standardized training set descriptors. The Mahalanobis distance for each of 56 de novo designed compounds was calculated. A threshold was applied based on the 95th percentile of the χ² distribution with 8 degrees of freedom (corresponding to the number of selected descriptors) [3].
- Outcome: This AD assessment successfully identified compound C9, which fell within the domain and had a predicted pIC₅₀ of 8.11, as the most promising candidate for further investigation. This demonstrates how the Mahalanobis distance method acts as a crucial filter to prioritize the most reliable virtual hits in a cancer drug discovery pipeline [3].
The integration of a rigorously defined Applicability Domain, based on Mahalanobis distance and χ² thresholds, is a critical component of robust and trustworthy QSAR modeling in cancer research. This approach provides a statistically sound mechanism to identify the region of chemical space where model predictions are reliable, thereby mitigating the risk of costly experimental pursuits based on erroneous extrapolations. As the field advances with larger datasets and more complex AI-driven models, the fundamental principle of understanding and defining a model's limitations remains essential. The Mahalanobis distance method, with its foundation in multivariate statistics, continues to offer a powerful and defensible strategy for applying this principle, ultimately accelerating the discovery of new oncology therapeutics.
The regulatory acceptance of Quantitative Structure-Activity Relationship (QSAR) models as validated alternatives to animal testing represents a paradigm shift in cancer risk assessment and drug development. Supported by recent initiatives from the U.S. Food and Drug Administration (FDA) and National Institutes of Health (NIH), these New Approach Methodologies (NAMs) leverage advanced computational frameworks to predict carcinogenic potential and anti-cancer activity with increasing accuracy. This whitepaper examines the technical foundations of QSAR modeling within the context of molecular descriptors, detailing experimental protocols, regulatory progress, and the essential toolkit required for implementation. The integration of these approaches addresses pressing ethical concerns and scientific limitations of traditional animal models while accelerating the discovery of novel cancer therapeutics.
Traditional toxicology has long relied on animal testing for chemical safety assessment, but this approach faces significant challenges including species-translation issues, high costs, and ethical concerns. In recent decades, a concerted effort has emerged to develop and adopt NAMs—technologies that reduce, refine, or replace animal use while improving human relevance [36] [118]. This shift is now being codified in regulatory policy. In 2025, the FDA announced a strategic roadmap to phase out animal testing requirements, beginning with monoclonal antibodies and expanding to other biological molecules and new chemical entities [119]. Simultaneously, NIH revealed plans to establish the Office of Research, Innovation, and Application (ORIVA) to coordinate agency-wide development and validation of non-animal approaches [119].
Among NAMs, QSAR models hold a unique position by enabling toxicity and bioactivity predictions based solely on chemical structure information [36]. By establishing quantitative relationships between molecular descriptors and biological outcomes, QSAR provides a powerful framework for predicting carcinogenic risk and anti-cancer activity, making it particularly valuable for early-stage assessment of pesticides, pharmaceuticals, and environmental contaminants [36].
Molecular Descriptors: The Foundation of Cancer QSAR Studies
Molecular descriptors are mathematical representations of molecular properties that serve as the independent variables in QSAR models. They encode key structural, electronic, and topological features that influence biological activity and toxicity endpoints. The choice and quality of descriptors fundamentally determine model performance and interpretability.
Advanced Descriptor Typologies in Cancer Research
Table: Molecular Descriptor Classes in Cancer QSAR Studies
| Descriptor Class | Representation | Biological Relevance | Application Examples |
|---|---|---|---|
| Constitutional | Atom/group counts, molecular weight | Bulk properties, absorption | Pyrazole derivative screening [22] |
| Topological | Connectivity indices, path counts | Molecular shape/size, receptor fit | Chalcone anti-colon cancer activity [21] |
| Electronic | Partial charges, HOMO/LUMO energies | Electron distribution, reactivity | 3D electron cloud for colorectal cancer [2] |
| Geometric | 3D coordinates, surface areas | Steric interactions, binding | FGFR-1 inhibitor design [18] |
| Hybrid | SMILES + graph combinations | Comprehensive structure encoding | Chalcone derivative modeling [21] |
Recent advances have introduced sophisticated three-dimensional electron density descriptors that capture electronic and spatial complexity beyond conventional approaches. By computing electron densities via density functional theory (DFT) and converting them to 3D point clouds encoded into multi-scale descriptors, researchers have achieved significant predictive improvements for anti-colorectal cancer compounds, with Area Under the Curve (AUC) increasing from 0.88 to 0.96 compared to standard ECFP4 fingerprints [2].
Hybrid descriptors that combine SMILES notation with hydrogen-suppressed molecular graphs (HSG) have demonstrated superior performance in predicting anti-colon cancer activity of chalcone derivatives, achieving validation R² values of 0.90 through the Monte Carlo method with index of ideality correlation [21].
Regulatory Framework and Validation Standards
The regulatory acceptance of QSAR models depends on rigorous validation and demonstration of reliability within defined applicability domains.
Current Regulatory Initiatives
The FDA's 2025 roadmap identifies specific NAMs suitable for assessing drug safety and efficacy, including:
- Organ-on-a-chip systems that replicate human physiology
- Computer models and in silico tools, including machine learning predictive models
- Advanced in vitro assays using human cells [119]
This regulatory evolution follows the 2022 amendment to the Federal Food, Drug, and Cosmetic Act that expressly authorized drug sponsors to use nonclinical tests—including in silico approaches—to support Investigational New Drug applications [119].
The NIH Complement-ARIE program further supports this transition by developing standardized NAMs, creating integrated data structures, establishing validation networks, and promoting workforce development in these methodologies [118].
Validation Parameters for Regulatory Acceptance
For QSAR models to gain regulatory acceptance, they must satisfy specific validation criteria:
- Applicability Domain (AD): The model must explicitly define its chemical space coverage, typically using approaches like Mahalanobis Distance to identify compounds within the 95th percentile of the training set distribution [36] [3]
- Statistical Robustness: Demonstrated through internal cross-validation (e.g., Q²) and external validation using test sets [22]
- Mechanistic Interpretability: The model should provide insight into structural features governing activity, often achieved through promoter contribution analysis [21]
The Danish QSAR Database addresses these requirements through "battery calls"—majority-based predictions where at least two of three models agree within the applicability domain, enhancing reliability for carcinogenicity assessment [36].
Experimental Protocols and Methodologies
Standardized QSAR Model Development Workflow
The following diagram illustrates the comprehensive workflow for developing validated QSAR models:
Dataset Curation and Preparation
Robust QSAR modeling begins with rigorous dataset compilation. For KRAS inhibitor development, researchers retrieved 62 compounds from the ChEMBL database (CHEMBL4354832), standardizing structures and converting IC₅₀ values to pIC₅₀ using the equation: pIC₅₀ = -log₁₀(IC₅₀ × 10⁻⁹) [3]. Similarly, in anti-colon cancer studies of chalcones, 193 derivatives were curated from multiple sources, with pIC₅₀ values ranging from 3.58 to 7.00 [21]. Dataset division typically follows 70:30 or 80:20 splits for training and test sets, with some implementations incorporating additional calibration and validation subsets [21].
Molecular Descriptor Calculation and Selection
Descriptors are calculated using specialized software such as PaDEL, ChemoPy, or Alvadesc [18] [22]. Following calculation, descriptor space undergoes preprocessing including:
- Standardization (mean-centering and scaling to unit variance)
- Removal of highly correlated descriptors (Pearson's |r| > 0.95)
- Feature selection using Genetic Algorithms (GA) or stepwise selection
For 1,3-diphenyl-1H-pyrazole derivatives against breast cancer cells, Genetic Algorithm optimization selected an optimal descriptor subset using a fitness function that maximized adjusted R² while penalizing model complexity: Fitness = R²adj - k/n, where k represents selected descriptors and n represents training samples [22].
Model Training and Validation
Multiple algorithms are typically benchmarked, including:
- Partial Least Squares (PLS)
- Random Forest (RF)
- Genetic Algorithm-Multiple Linear Regression (GA-MLR)
- XGBoost
In KRAS inhibitor modeling, PLS demonstrated superior performance (R² = 0.851, RMSE = 0.292) followed by RF (R² = 0.796) [3]. For breast cancer agents, a validated penta-parametric model achieved R²train = 0.896, R²adj = 0.875, Q²CV = 0.816, and R²test = 0.703 [22].
Validation includes both internal (cross-validation) and external testing, with additional assessments using Y-randomization to confirm model robustness not due to chance correlation.
Advanced Technical Implementation: 3D Electron Cloud Descriptors
The protocol for implementing 3D electron cloud descriptors involves:
- Molecular Optimization: Geometry optimization using DFT at B3LYP/6-31G* level
- Electron Density Calculation: DFT computation of electron densities
- Point Cloud Conversion: Transformation of electron densities to 3D point clouds
- Descriptor Encoding: Encoding into multi-scale descriptors including:
- Radial distribution functions
- Spherical harmonic expansions
- Point feature histograms
- Persistent homology features [2]
This approach captures complementary electronic structure information that significantly enhances predictive performance for anti-colorectal cancer compounds compared to conventional descriptors [2].
The Scientist's Toolkit: Essential Research Reagents and Solutions
Table: Essential Computational Tools for Cancer QSAR Research
| Tool/Software | Application | Key Features | Reference |
|---|---|---|---|
| OECD QSAR Toolbox | Hazard assessment, read-across | Regulatory-endorsed, integrated databases | [36] |
| Danish QSAR Database | Carcinogenicity prediction | Battery calls, multiple model consensus | [36] |
| CORAL Software | Monte Carlo QSAR modeling | SMILES and graph descriptors, IIC optimization | [21] |
| PaDEL-Descriptor | Molecular descriptor calculation | 1D, 2D, and 3D descriptors, open-source | [22] |
| ChemoPy | Python-based descriptor calculation | Topological, constitutional, electronic features | [3] |
| Alvadesc Software | Descriptor calculation and analysis | Feature selection, preprocessing capabilities | [18] |
| DataWarrior | De novo design and visualization | Evolutionary algorithms, drug-likeness scoring | [3] |
Case Studies in Cancer Risk Assessment and Drug Discovery
Carcinogenicity Assessment of Pesticides
A methodological study explored QSAR models for predicting carcinogenic potential of pesticide-active substances and metabolites. Using the Danish QSAR software, researchers analyzed Ames-positive compounds from the EFSA Genotoxicity Pesticides Database. The study highlighted several critical considerations:
- Model Consistency: Significant inconsistencies were observed across different QSAR models
- Applicability Domain: The definition and transparency of applicability domain boundaries varied substantially between implementations
- Integration Challenges: Resolving conflicts between models requires robust integration strategies [36]
This case study underscores that while QSAR approaches show significant potential for carcinogenicity assessment, methodological harmonization remains necessary for confident regulatory application [36].
Anti-Cancer Drug Discovery Applications
KRAS Inhibitors for Lung Cancer
QSAR-guided discovery identified novel KRAS inhibitors with potential application in non-small cell lung cancer (NSCLC). The research workflow included:
- Dataset Compilation: 62 KRAS inhibitors from ChEMBL
- Descriptor Calculation: Topological, constitutional, geometrical, and electronic features
- Model Development: Multiple algorithms with PLS demonstrating best performance (R² = 0.851)
- Virtual Screening: 56 de novo designed compounds evaluated within the model's applicability domain
- Hit Identification: Compound C9 with predicted pIC₅₀ of 8.11 [3]
This integrated approach demonstrates how QSAR modeling facilitates the identification of novel inhibitors against challenging targets like KRAS.
Chalcone Derivatives for Colon Cancer
QSAR modeling of 193 chalcone derivatives against HT-29 colon cancer cells achieved exceptional predictive performance (R²validation = 0.90) using hybrid descriptors combining SMILES notation and hydrogen-suppressed molecular graphs [21]. Mechanistic interpretation identified structural promoters enhancing anti-cancer activity, enabling rational design of improved derivatives.
QSAR modeling has transitioned from a research tool to a regulatory-accepted alternative for animal testing in cancer risk assessment, supported by recent FDA and NIH initiatives. The strategic development and validation of models based on informative molecular descriptors provides a robust framework for predicting carcinogenicity and anti-cancer activity.
Future advancements will focus on:
- Standardized Applicability Domain Definitions to enhance model reliability and transparency
- Advanced Electron Density Descriptors that better capture molecular interactions
- Integrated Workflows combining QSAR with molecular docking and dynamics simulations
- Regulatory Harmonization through initiatives like the NIH Complement-ARIE program
As these methodologies continue evolving, QSAR approaches will play an increasingly central role in cancer risk assessment and therapeutic development, reducing reliance on animal testing while improving human relevance and predictive accuracy.
Conclusion
Molecular descriptors serve as the fundamental building blocks of robust QSAR models that are transforming anticancer drug discovery. The integration of diverse descriptor types—from simple constitutional to complex quantum chemical properties—enables comprehensive characterization of structure-activity relationships across multiple cancer types. While significant progress has been made in methodology and validation, future directions must focus on expanding applicability domains, improving model interpretability for clinical translation, and embracing hybrid approaches that combine QSAR with structural biology techniques. As descriptor calculation becomes more sophisticated and machine learning integration deepens, QSAR methodologies promise to further accelerate the identification of novel cancer therapeutics with improved potency, selectivity, and clinical success rates, ultimately bridging the gap between computational prediction and clinical application in oncology.
References
- 1. Quantitative structure-activity relationships (QSAR) and ... [https://pmc.ncbi.nlm.nih.gov/articles/PMC12201292/]
- 2. 3d electron cloud descriptors for enhanced QSAR ... [https://pubmed.ncbi.nlm.nih.gov/41136856/?utm_source=FeedFetcher&utm_medium=rss&utm_campaign=None&utm_content=1tgF4I8bUCpZBxcDNSIR78_uIMPJKVb6ylfqhnaMbeZ_JjWgoI&fc=None&ff=20251025054323&v=2.18.0.post22+67771e2]
- 3. QSAR-guided discovery of novel KRAS inhibitors for lung ... [https://www.frontiersin.org/journals/bioinformatics/articles/10.3389/fbinf.2025.1663846/full]
- 4. Molecular descriptor [https://en.wikipedia.org/wiki/Molecular_descriptor]
- 5. 5.3: Molecular Descriptors [https://chem.libretexts.org/Courses/Intercollegiate_Courses/Cheminformatics/05%3A_5._Quantitative_Structure_Property_Relationships/5.03%3A_Molecular_Descriptors]
- 6. Quantitative Structure-Activity Relationship (QSAR) ... [https://www.sciencedirect.com/science/article/pii/S2211715623001273]
- 7. QSAR modelling and molecular docking studies for anti- ... [https://pmc.ncbi.nlm.nih.gov/articles/PMC7110328/]
- 8. Quantitative structure–activity relationship study on potent ... [https://www.sciencedirect.com/science/article/pii/S2090123216300121]
- 9. Development of QSAR machine learning-based models to ... [https://www.spandidos-publications.com/10.3892/ol.2019.10068]
- 10. Exploring QSPR in breast cancer drugs via entire ... [https://www.nature.com/articles/s41598-025-12179-0]
- 11. Topological insights into breast cancer drugs: a QSPR ... [https://pmc.ncbi.nlm.nih.gov/articles/PMC12605912/]
- 12. High-Dimensional Descriptor Selection and Computational ... [https://pmc.ncbi.nlm.nih.gov/articles/PMC3269744/]
- 13. A breast cancer-specific combinational QSAR model ... [https://www.frontiersin.org/journals/bioinformatics/articles/10.3389/fbinf.2023.1328262/full]
- 14. Theoretical calculations of molecular descriptors for ... [https://www.sciencedirect.com/science/article/pii/S2405844020307714]
- 15. A Beginner's Guide to QSAR Modeling in Cheminformatics ... [https://neovarsity.org/blogs/cheminformatics-qsar-beginner-guides]
- 16. Mordred: a molecular descriptor calculator | Journal of Cheminformatics | Full Text [https://jcheminf.biomedcentral.com/articles/10.1186/s13321-018-0258-y]
- 17. Machine Learning-Driven QSAR Modeling of Anticancer ... [https://pubmed.ncbi.nlm.nih.gov/40447459/]
- 18. Developing a predictive QSAR model for FGFR-1 inhibitors [https://pubmed.ncbi.nlm.nih.gov/41045407/]
- 19. PaDEL-Descriptor [http://yapcwsoft.com/dd/padeldescriptor/]
- 20. A Comparative Study of the Performance for Predicting ... [https://pmc.ncbi.nlm.nih.gov/articles/PMC8811760/]
- 21. SMILES-based QSAR and molecular docking studies of ... [https://www.nature.com/articles/s41598-025-91338-9]
- 22. QSAR modeling, DFT, molecular docking, molecular dynamic ... [https://bjbas.springeropen.com/articles/10.1186/s43088-025-00669-z]
- 23. A (Comprehensive) Review of the Application ... [https://www.mdpi.com/2076-3417/15/3/1206]
- 24. Strategies for the drug development of cancer therapeutics [https://www.frontiersin.org/journals/pharmacology/articles/10.3389/fphar.2025.1656012/full]
- 25. Hammett equation [https://en.wikipedia.org/wiki/Hammett_equation]
- 26. Empowerments of blood cancer therapeutics via molecular ... [https://www.sciencedirect.com/science/article/abs/pii/S0169743924001205]
- 27. Exploration of 2D and 3D-QSAR analysis and docking studies ... [https://pmc.ncbi.nlm.nih.gov/articles/PMC10501407/]
- 28. 3D-QSAR.com | Online 3D QSAR Platform [https://www.3d-qsar.com/]
- 29. 3d electron cloud descriptors for enhanced QSAR ... [https://link.springer.com/article/10.1007/s10822-025-00679-0]
- 30. Utilizing Molecular Descriptor Importance to Enhance ... [https://pmc.ncbi.nlm.nih.gov/articles/PMC12115611/]
- 31. Advanced QSPR modeling of profens using machine ... [https://www.nature.com/articles/s41598-025-09878-z]
- 32. AI-Integrated QSAR Modeling for Enhanced Drug Discovery [https://pmc.ncbi.nlm.nih.gov/articles/PMC12525248/]
- 33. Integrating artificial intelligence into small molecule ... [https://www.nature.com/articles/s44386-025-00029-y]
- 34. Development of convolutional neural network-based QSAR ... [https://jksus.org/development-of-convolutional-neural-network-based-qsar-model-to-predict-cardiotoxicity-and-principal-component-analysis-fingerprint-analysis/]
- 35. The role of descriptors extracted from ligand-target ... [https://pubmed.ncbi.nlm.nih.gov/40827389/]
- 36. A Statistical Exploration of QSAR Models in Cancer Risk ... [https://www.mdpi.com/2305-6304/13/4/299]
- 37. Design, Quantitative Structure–Activity Relationships and ... [https://www.sciencedirect.com/science/article/pii/S2667022425001458]
- 38. Quantum Machine Learning for QSAR Prediction with ... [https://ui.adsabs.harvard.edu/abs/2025arXiv250113395C/abstract]
- 39. Quantum chemical descriptors in quantitative structure ... [https://www.sciencedirect.com/science/article/abs/pii/S0169743921001520]
- 40. Quantum description of polar and non-polar solvent ... [https://www.sciencedirect.com/science/article/abs/pii/S0167732224027223]
- 41. Theoretical calculations of molecular descriptors ... [https://pmc.ncbi.nlm.nih.gov/articles/PMC7243141/]
- 42. Molecular structure, homo-lumo analysis and vibrational ... [https://www.aimspress.com/article/doi/10.3934/biophy.2022018?viewType=HTML]
- 43. A drug design strategy based on molecular docking and ... [https://pmc.ncbi.nlm.nih.gov/articles/PMC10569544/]
- 44. Eurasian Journal of Environmental Research » Submission » THE... [https://dergipark.org.tr/en/pub/ejere/issue/45416/478362]
- 45. Deciphering quinazoline derivatives’ interactions with EGFR... [https://pmc.ncbi.nlm.nih.gov/articles/PMC11540632/]
- 46. QSAR Modeling Techniques: A Comprehensive Review Of ... [https://journals.stmjournals.com/ijci/article=2025/view=212193/]
- 47. AI-Integrated QSAR Modeling for Enhanced Drug Discovery [https://pubmed.ncbi.nlm.nih.gov/41096653/]
- 48. Quantitative structure-activity relationship (QSAR) studies ... [https://www.sciencedirect.com/science/article/pii/S3050787125000186]
- 49. Two-dimensional QSAR-driven virtual screening for ... [https://www.frontiersin.org/journals/chemistry/articles/10.3389/fchem.2025.1600945/full]
- 50. Comparative Study of (Q)SAR Models for Predicting the ... [https://www.sciencedirect.com/science/article/pii/S3050620425000491]
- 51. Descriptors and their selection methods in QSAR analysis [https://www.sciencedirect.com/science/article/abs/pii/S1359644616302318]
- 52. one derivatives as tubulin inhibitors for breast cancer therapy [https://www.nature.com/articles/s41598-024-66877-2]
- 53. ACLPred: an explainable machine learning and tree-based ... [https://www.nature.com/articles/s41598-025-16575-4]
- 54. Dataset of curcumin derivatives for QSAR modeling of anti ... [https://www.sciencedirect.com/science/article/pii/S2352340916306084]
- 55. A machine learning-Assisted QSAR and integrative ... [https://www.sciencedirect.com/science/article/abs/pii/S0010482525014209]
- 56. Feature Selection Techniques in Machine Learning [https://www.geeksforgeeks.org/machine-learning/feature-selection-techniques-in-machine-learning/]
- 57. Introduction to Feature Selection Methods with an Example [https://www.analyticsvidhya.com/blog/2016/12/introduction-to-feature-selection-methods-with-an-example-or-how-to-select-the-right-variables/]
- 58. What is the difference between filter, wrapper, and ... [https://sebastianraschka.com/faq/docs/feature_sele_categories.html]
- 59. Day 33: Feature Selection Techniques — Filter, Wrapper ... [https://medium.com/@bhatadithya54764118/day-33-feature-selection-techniques-filter-wrapper-and-embedded-methods-00fb2bd04aa3]
- 60. Improved cancer detection through feature selection using ... [https://www.nature.com/articles/s41598-025-92187-2]
- 61. PDO-FA: A Novel Hybrid Approach for Feature Selection ... [https://www.sciencedirect.com/science/article/pii/S1877050925012645]
- 62. Predicting Physico-Chemical Properties of Anti-Cancer ... [https://unige.org/volume-75-issue-1-2025/predicting-physico-chemical-properties-of-anti-cancer-drugs-using-distance-based-topological-indices/]
- 63. Anticancer activity mechanism of novelly synthesized and .. ... [https://www.degruyterbrill.com/document/doi/10.1515/med-2025-1310/html?srsltid=AfmBOorG_Ywiq66hsxm-fFY2Hbd9T2z6I3yn4lgE5UomwRmIOX3Ahw_W]
- 64. Excavating medicinal virtues of chalcones to illuminate a new ... [https://pubs.rsc.org/en/content/articlehtml/2025/ra/d5ra01280e?page=search]
- 65. Amide linked chalcone derivatives, a promising class of ... [https://pmc.ncbi.nlm.nih.gov/articles/PMC12138790/]
- 66. SMILES-based QSAR and molecular docking studies of ... [https://www.semanticscholar.org/paper/SMILES-based-QSAR-and-molecular-docking-studies-of-Askarzade-Ahmadi/7c4e1811c078f8e97d9784d893aaad34dfa0e0f9]
- 67. Structural analysis of anti-cancer drug compounds using ... [https://link.springer.com/article/10.1140/epje/s10189-025-00481-8]
- 68. RAS-ON inhibition overcomes clinical resistance to KRAS ... [https://www.nature.com/articles/s41467-024-51828-2]
- 69. Advancing QSAR models in drug discovery for best ... [https://www.sciencedirect.com/science/article/abs/pii/S0169743925002291]
- 70. DGMM: A Deep Learning-Genetic Algorithm Framework for ... [https://pubmed.ncbi.nlm.nih.gov/40736165/]
- 71. Current Updates on Recent Developments in Artificial ... [https://pubmed.ncbi.nlm.nih.gov/41126426/]
- 72. Gradient Genetic Algorithm for Drug Molecular Design [https://arxiv.org/html/2502.09860v1]
- 73. Ultra-large library screening with an evolutionary algorithm ... [https://www.nature.com/articles/s42004-025-01758-x]
- 74. computational strategy for anticancer drug discovery... Integrative [https://pubs.rsc.org/en/content/articlelanding/2025/nj/d5nj02417j]
- 75. , QSAR , ADMET , and dynamics studies of... molecular docking [https://pmc.ncbi.nlm.nih.gov/articles/PMC11252338/]
- 76. 3D-QSAR, ADMET, and molecular docking studies of ... [https://pmc.ncbi.nlm.nih.gov/articles/PMC11350533/]
- 77. Integrating QSAR modeling, ADMET screening, molecular ... [https://www.sciencedirect.com/science/article/abs/pii/S0010482525013241]
- 78. Applicability Domain - an overview [https://www.sciencedirect.com/topics/nursing-and-health-professions/applicability-domain]
- 79. Comprehensive Analysis of Applicability Domains of QSPR ... [https://pmc.ncbi.nlm.nih.gov/articles/PMC7432167/]
- 80. Comparison of Different Approaches to Define the ... [https://www.mdpi.com/1420-3049/17/5/4791]
- 81. QSAR Study of 17β-HSD3 Inhibitors by Genetic Algorithm- ... [https://brieflands.com/journals/ijpr/articles/127506]
- 82. Applicability domains for models predicting properties of ... [https://cimtools.readthedocs.io/en/latest/tutorial/applicability_domain.html]
- 83. QSAR and Chemical Read-Across Analysis of 370 ... [https://pmc.ncbi.nlm.nih.gov/articles/PMC10458236/]
- 84. Improved QSAR methods for predicting drug properties ... [https://link.springer.com/article/10.1140/epje/s10189-025-00491-6]
- 85. Development of QSAR machine learning-based models to ... [https://pmc.ncbi.nlm.nih.gov/articles/PMC6466999/]
- 86. Tackling descriptor intercorrelation in QSAR models | Cresset [https://cresset-group.com/science/science-resources/qsar-models-tackling-descriptor-intercorrelation/]
- 87. Representative feature selection of molecular descriptors ... [https://www.sciencedirect.com/science/article/abs/pii/S0022286021013788]
- 88. Practical Considerations and Applied Examples of Cross ... [https://ai.jmir.org/2023/1/e49023]
- 89. Comparison of various methods for validity evaluation ... [https://pmc.ncbi.nlm.nih.gov/articles/PMC9396839/]
- 90. QSAR Modeling Techniques: A Comprehensive Review Of ... [https://journals.stmjournals.com/ijci/article=2025/view=212192/]
- 91. Multi-Strategy Assessment of Different Uses of QSAR under ... [https://pmc.ncbi.nlm.nih.gov/articles/PMC8998180/]
- 92. SMILES vs. Graph representation in deep learning [https://chemistry.stackexchange.com/questions/128149/smiles-vs-graph-representation-in-deep-learning]
- 93. Could graph neural networks learn better molecular ... [https://jcheminf.biomedcentral.com/articles/10.1186/s13321-020-00479-8]
- 94. Comparison of SMILES and molecular graphs as the ... [https://www.sciencedirect.com/science/article/abs/pii/S0169743911001560]
- 95. Topology-enhanced molecular graph representation for anti ... [https://bmcbioinformatics.biomedcentral.com/articles/10.1186/s12859-022-04913-6]
- 96. Evaluation of chirality descriptors derived from SMILES ... [https://pmc.ncbi.nlm.nih.gov/articles/PMC12398957/]
- 97. SMILES-based QSAR virtual screening to identify potential ... [https://pmc.ncbi.nlm.nih.gov/articles/PMC11451266/]
- 98. Integrating QSAR modeling, ADMET screening, molecular ... [https://pubmed.ncbi.nlm.nih.gov/40850177/]
- 99. A review of quantitative structure-activity relationship [https://www.sciencedirect.com/science/article/abs/pii/S0169743924002181]
- 100. A novel non-linear approach for establishing a QSAR model of ... [https://pmc.ncbi.nlm.nih.gov/articles/PMC10565811/]
- 101. A novel non-linear approach for establishing a QSAR ... [https://www.frontiersin.org/journals/pharmacology/articles/10.3389/fphar.2023.1263933/full]
- 102. Interpretable Machine Learning QSAR Models for ... [https://heca-analitika.com/malacca_pharmaceutics/article/view/339]
- 103. Comparison of various methods for validity evaluation of ... [https://bmcchem.biomedcentral.com/articles/10.1186/s13065-022-00856-4]
- 104. A Statistical Exploration of QSAR Models in Cancer Risk ... [https://pmc.ncbi.nlm.nih.gov/articles/PMC12030765/]
- 105. QSAR, molecular docking and ADMET properties in silico ... [https://pmc.ncbi.nlm.nih.gov/articles/PMC8282965/]
- 106. External validation: a simulation study to compare cross ... [https://pmc.ncbi.nlm.nih.gov/articles/PMC9464671/]
- 107. What is the difference between external and internal cross ... [https://stats.stackexchange.com/questions/492367/what-is-the-difference-between-external-and-internal-cross-validation]
- 108. Beware of R2: simple, unambiguous assessment of the ... [https://pmc.ncbi.nlm.nih.gov/articles/PMC4530125/]
- 109. What are R² and RMSE? [https://click.clarity.io/knowledge/r2-rmse]
- 110. QSAR, Molecular Docking, MD Simulation and MMGBSA ... [https://pmc.ncbi.nlm.nih.gov/articles/PMC9370430/]
- 111. Development of Self-Consistency Models of Anticancer ... [https://pmc.ncbi.nlm.nih.gov/articles/PMC10304945/]
- 112. 3D Electron Cloud Descriptors for Enhanced QSAR Modeling of Anti-Colorectal Cancer Compounds | Research Square [https://www.researchsquare.com/article/rs-7286125/v1]
- 113. Design, Synthesis, and Biological Evaluation of 5,8-Dimethyl ... [https://pmc.ncbi.nlm.nih.gov/articles/PMC11945236/]
- 114. Shikonin Derivatives Inhibit Inflammation Processes and ... [https://www.mdpi.com/1422-0067/23/6/3396]
- 115. Drug Molecular Descriptors (Drug Mol. Descrip.) [http://computational.cancer.gov/dataset/drug-molecular-descriptors]
- 116. QSAR modeling for cytotoxicity of sulfur-containing ... [https://pubmed.ncbi.nlm.nih.gov/38996828/]
- 117. Mahalanobis distances and ecological niche modelling [https://pmc.ncbi.nlm.nih.gov/articles/PMC6450376/]
- 118. Alternatives to Animal Testing [https://www.niehs.nih.gov/health/topics/science/sya-iccvam]
- 119. FDA and NIH Announce Initiatives to Reduce Animal ... [https://www.lw.com/en/insights/fda-and-nih-announce-initiatives-to-reduce-animal-testing-and-encourage-alternative-methodologies]