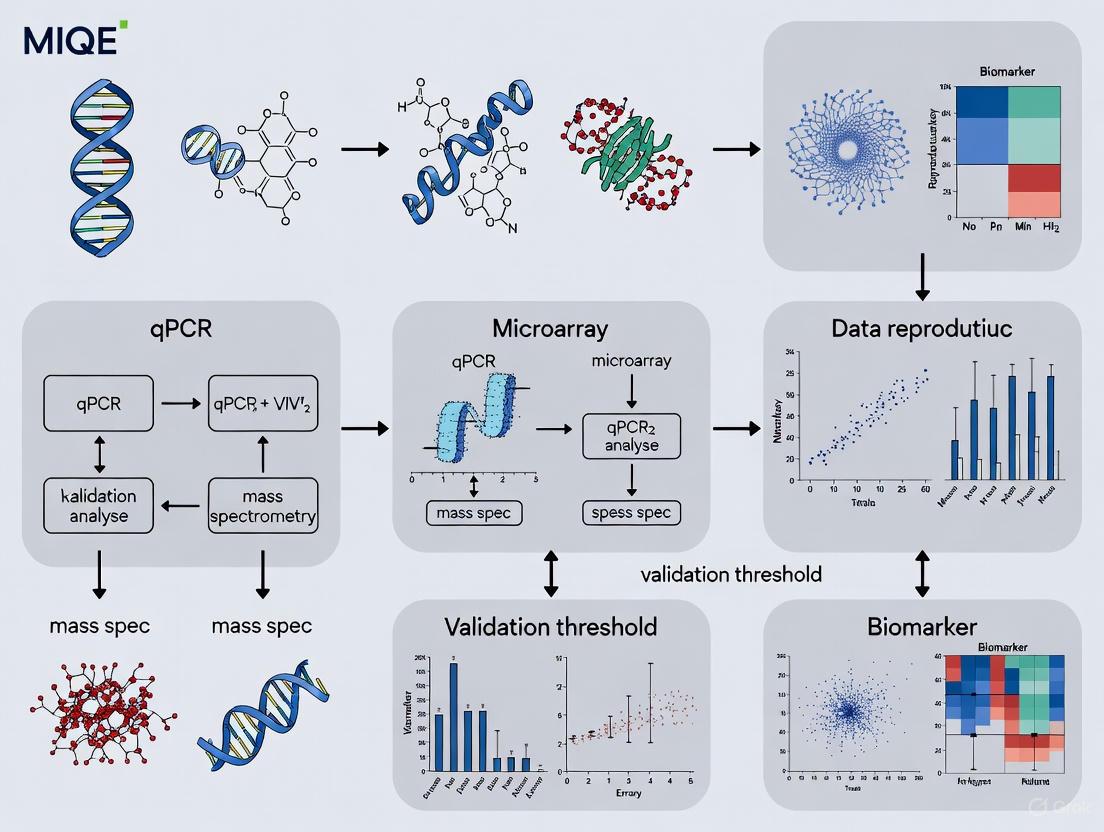
MIQE Guidelines for Cancer Biomarker Validation: Ensuring Reproducibility in Molecular Diagnostics
This article provides a comprehensive guide for researchers and drug development professionals on implementing MIQE (Minimum Information for Publication of Quantitative Real-Time PCR Experiments) guidelines specifically for cancer biomarker validation.
MIQE Guidelines for Cancer Biomarker Validation: Ensuring Reproducibility in Molecular Diagnostics
Abstract
This article provides a comprehensive guide for researchers and drug development professionals on implementing MIQE (Minimum Information for Publication of Quantitative Real-Time PCR Experiments) guidelines specifically for cancer biomarker validation. Covering foundational principles, methodological applications, troubleshooting strategies, and validation frameworks, we detail how MIQE-compliant workflows ensure reproducible and clinically relevant results when validating biomarker signatures discovered through next-generation sequencing. With emphasis on the updated MIQE 2.0 guidelines and their integration with domain-specific standards like MISEV for extracellular vesicle research, this resource addresses the critical need for methodological rigor in translating qPCR-based cancer biomarkers from discovery to clinical application.
Understanding MIQE: The Foundation of Reproducible Cancer Biomarker Research
Quantitative real-time polymerase chain reaction (qPCR) and reverse transcription qPCR (RT-qPCR) represent cornerstone technologies in molecular biology, forming the bedrock of gene expression analysis, pathogen detection, and molecular diagnostics. Despite their widespread adoption, the reproducibility and reliability of qPCR data have been persistently challenged by substantial variations in experimental conduct and reporting. To address this critical gap, the Minimum Information for Publication of Quantitative Real-Time PCR Experiments (MIQE) guidelines were first introduced in 2009, establishing a standardized framework for the design, execution, and documentation of qPCR experiments [1]. Over the past 16 years, MIQE has become one of the most widely cited methodological publications in molecular biology, informing journal editorial policies and contributing to the development of ISO standards for molecular diagnostics [1]. The recent publication of MIQE 2.0 in 2025 marks a critical milestone, refining and updating these guidelines to maintain their relevance amidst evolving technologies and applications, particularly in the high-stakes field of cancer biomarker validation [2] [1]. This evolution represents a concerted effort by an international consortium of multidisciplinary experts to ensure that qPCR remains a trustworthy tool for scientific discovery and clinical application.
The Original MIQE Guidelines (2009): Establishing a Foundation
The original MIQE guidelines, published in Clinical Chemistry in 2009, emerged as a response to growing concerns about the transparency, quality, and reproducibility of qPCR-based research [1]. Their primary goal was to provide a comprehensive checklist of minimum information required to ensure the repeatability and reproducibility of qPCR experiments. The guidelines established standards spanning all aspects of the qPCR workflow, encompassing experimental design, sample quality, assay validation, and data analysis [3].
A cornerstone of the original MIQE was its emphasis on detailed reporting. It mandated comprehensive documentation of nucleic acid extraction methods, quality assessment (including RNA integrity numbers), reverse transcription conditions, primer and probe sequences, amplification efficiency, and normalization strategies [4]. The guidelines stressed that mere citation of the MIQE paper was insufficient; instead, authors were expected to provide all necessary methodological details to allow independent verification of their results. This framework gave researchers, reviewers, and editors a common language for evaluating qPCR data quality, aiming to curb the publication of irreproducible findings and exaggerated claims, particularly in sensitive areas like biomarker discovery [1] [4].
The Driving Forces for Revision: Why MIQE Needed an Update
The expansion of qPCR into numerous new domains over the 16 years following the original publication drove the development of new reagents, methods, consumables, and instruments, creating a pressing need for updated best practices [2]. While the original MIQE guidelines raised awareness, compliance remained patchy and often superficial. A troubling complacency surrounding qPCR methodology persisted, with many studies suffering from fundamental flaws such as unverified nucleic acid quality, unvalidated assay efficiencies, inappropriate normalization using unverified reference genes, and overinterpretation of minimal fold-changes without assessment of measurement uncertainty [1].
The COVID-19 pandemic starkly illustrated the real-world consequences of variable quality in qPCR applications. While qPCR was central to global testing efforts, inconsistencies in assay design, data interpretation, and public communication undermined confidence in diagnostics [1]. Furthermore, the translational gap between research and clinical application became increasingly apparent, especially in fields like cancer biomarker validation. Despite promising findings, the noticeable lack of technical standardization remained a huge obstacle in the translation of qPCR-based tests from bench to bedside [5]. The emergence of new applications, including the analysis of complex sample types like liquid biopsies for circulating miRNA and DNA methylation biomarkers, further exposed limitations of the original guidelines [6] [7] [8]. These challenges collectively underscored the urgent need for a revised, more applicable set of guidelines.
MIQE 2.0 (2025): Key Updates and Advancements
Building on the collaborative efforts of an international team of researchers, MIQE 2.0 presents updates, simplifications, and new recommendations designed to maintain relevance in the context of emerging technologies and evolving qPCR applications [2] [9]. The revised guidelines reflect recent advances in qPCR technology and offer clear recommendations for sample handling, assay design, and validation, along with refined guidance on qPCR data analysis [2].
Enhanced Focus on Transparent Data Reporting and Analysis
MIQE 2.0 reinforces that quantification cycle (Cq) values should not be reported as final results. Instead, they must be converted into efficiency-corrected target quantities, reported with prediction intervals, along with detection limits and dynamic ranges for each target, based on the chosen quantification method [2]. The guidelines encourage instrument manufacturers to enable the export of raw data to facilitate thorough analyses and re-evaluation by manuscript reviewers and interested researchers [2]. Furthermore, reporting requirements have been clarified and streamlined to encourage researchers to provide all necessary information without undue burden, thereby promoting more rigorous and reproducible qPCR research [2].
Specific Provisions for Advanced Applications
The revised guidelines offer more tailored guidance for complex applications central to modern molecular biology. For miRNA biomarker validation—a prominent field in cancer research—MIQE 2.0 emphasizes the need for orthogonal validation of signatures initially identified by next-generation sequencing (NGS) [6] [7]. This is particularly relevant for liquid biopsies, where miRNA stability and complex normalization strategies present unique challenges [7]. Similarly, the guidelines support the growing use of DNA methylation biomarkers in liquid biopsies for cancer diagnosis, which leverage the inherent stability of DNA and its relative resistance to degradation compared to RNA [8]. The workflow for such biomarkers typically involves discovery via whole-genome bisulfite sequencing (WGBS) or reduced representation bisulfite sequencing (RRBS), followed by targeted, highly sensitive validation using qPCR or digital PCR (dPCR) [8].
Table 1: Core Updates in MIQE 2.0 Compared to the Original MIQE Guidelines
| Aspect | MIQE (2009) | MIQE 2.0 (2025) |
|---|---|---|
| Overall Scope | Established foundational principles for standard qPCR | Addresses emerging applications (e.g., liquid biopsies, complex biomarkers) |
| Data Analysis | Emphasized need for efficiency calculation and proper normalization | Mandates conversion of Cq to efficiency-corrected quantities with prediction intervals |
| Transparency | Advocated for detailed methodology reporting | Encourages raw data export and provides simplified reporting requirements |
| Technology Integration | Focused primarily on qPCR workflow | Acknowledges and provides guidance for validation of NGS-derived signatures |
Practical Implementation in Cancer Biomarker Research
For researchers engaged in cancer biomarker validation, adherence to MIQE 2.0 is not merely a publication formality but a critical component of developing robust, clinically translatable assays. The following section outlines practical protocols and a toolkit for implementing these guidelines.
Experimental Workflow for Biomarker Validation
The typical pipeline for establishing a transcriptional biomarker signature begins with an unbiased discovery phase using RNA-Seq on a subset of representative samples, followed by a targeted validation phase using RT-qPCR across the entire cohort in compliance with MIQE guidelines [6] [7] [4]. The diagram below illustrates this workflow, highlighting key MIQE 2.0 checkpoints.
The Scientist's Toolkit: Essential Reagents and Materials
Successful implementation of the workflow above requires carefully selected reagents and tools. The following table details key materials needed for a MIQE-compliant biomarker validation study.
Table 2: Research Reagent Solutions for MIQE-Compliant Cancer Biomarker Validation
| Item | Function/Description | MIQE 2.0 Compliance Consideration |
|---|---|---|
| Sample Stabilization Reagents(e.g., RNAlater, PAXgene) | Preserves nucleic acid integrity immediately after collection, preventing degradation. | Critical for obtaining high-quality RNA; directly impacts RNA Integrity Number (RIN) and subsequent quantification accuracy [7] [4]. |
| Nucleic Acid Extraction Kits | Isulates high-purity RNA/DNA from complex matrices like blood, urine, or tissue. | Must be documented precisely (including manufacturer and catalog number). Efficiency and purity (A260/A280 ratios) must be reported [1]. |
| Quality Assessment Instruments(e.g., Bioanalyzer, Fragment Analyzer) | Objectively assesses RNA/DNA integrity and quantity (e.g., RIN, DV2000). | Provides essential quality metrics that must be reported. Poor RNA integrity has a demonstrated, measurable impact on RT-qPCR results [7] [4]. |
| TaqMan Assays | Predesigned, highly specific probe-based qPCR assays for target quantification. | Providing the unique Assay ID and the amplicon context sequence fulfills MIQE 2.0 requirements for assay sequence disclosure [3]. |
| Reverse Transcription Kits | Converts RNA into complementary DNA (cDNA) for RT-qPCR. | Protocol (including priming strategy, enzyme, and volume used) must be thoroughly documented, as variability here is a major source of technical noise [1] [7]. |
Data Analysis and Normalization Strategy
A pivotal update in MIQE 2.0 is the reinforced mandate against using raw Cq values. Data analysis must incorporate PCR amplification efficiency for accurate quantification [2] [1]. For gene expression studies, normalization using stably expressed reference genes is non-negotiable. These genes must be empirically validated for stability under the specific experimental conditions; the use of a single reference gene is strongly discouraged unless thoroughly justified [1] [7]. The final output should be reported as efficiency-corrected target quantities, ideally with associated confidence measures.
For interpreting the resulting complex dataset, multivariate data analysis tools are indispensable. Principal Components Analysis (PCA) can visually demonstrate the separation of sample groups (e.g., cancer vs. control) based on the expression profile of the validated biomarker signature [4]. Hierarchical Cluster Analysis (HCA) and corresponding heatmaps further allow for the visualization of expression patterns across all samples and targets, confirming the robustness of the diagnostic or prognostic signature [4]. The diagram below outlines this core data analysis pipeline.
The evolution from MIQE to MIQE 2.0 represents a significant maturation in the molecular biology community's approach to one of its most fundamental techniques. The updated guidelines provide an authoritative, detailed roadmap for remedying the well-documented deficiencies in qPCR application and reporting [1]. However, as the authors themselves stress, guidelines alone are not enough. What is needed now is a cultural change among researchers, reviewers, journal editors, and regulatory agencies [1].
For the field of cancer biomarker research, the stakes are exceptionally high. A diagnostic platform that cannot reliably distinguish small fold-changes in target concentration at clinically relevant levels is not fit for purpose [1]. The transition of DNA methylation and miRNA biomarkers from concept to clinic, as seen in tests like Epi proColon, hinges on such methodological rigor [8]. The argument that rigorous implementation of MIQE slows down publication is counterproductive; if data cannot be reproduced, they are not worth publishing [1].
The credibility of molecular diagnostics and the integrity of the research that supports it now depend on the collective will to ensure that qPCR results are not just published, but are also robust, reproducible, and reliable. MIQE 2.0 provides the updated framework to achieve this. The scientific community now has the tools, the evidence, and the guidelines; the responsibility to implement them rests with every individual conducting, reviewing, or applying qPCR-based research.
The reproducibility of scientific findings is a cornerstone of scientific progress, yet many fields, including molecular diagnostics and biomarker research, face a significant reproducibility crisis. Quantitative real-time PCR (qPCR) is a ubiquitous technology in these fields, but its perceived simplicity often leads to poorly designed and reported experiments, generating unreliable results. This technical guide explores how the Minimum Information for Publication of Quantitative Real-Time PCR Experiments (MIQE) guidelines serve as a powerful tool to combat this crisis, with a specific focus on their critical role in validating robust transcriptional biomarkers for cancer research. By mandating comprehensive reporting and rigorous experimental practice, MIQE compliance ensures the generation of credible, reproducible data that can reliably inform drug development and clinical diagnostics.
Fluorescence-based quantitative real-time PCR (qPCR) is a fundamental technology in molecular biology, yet the inadequate reporting of experimental detail, combined with the frequent use of flawed protocols, has led to the publication of papers that may not be technically sound [10]. This problem is particularly acute in the development of transcriptional biomarkers for cancer, where the ultimate goal is often to create clinical diagnostic tests. The conclusions of thousands of peer-reviewed publications rely on data obtained using qPCR technology, but the relegation of materials and methods to online supplements often makes it impossible for reviewers and readers to judge a manuscript's technical adequacy [10].
The MIQE guidelines were established to address these challenges by providing a standardized framework for the execution and reporting of qPCR experiments [3]. Their primary aim is to achieve reproducibility and credibility of experimental results by ensuring that all critical experimental conditions are comprehensively documented [3] [11]. For cancer biomarker research, where qPCR is used to validate biomarker signatures discovered via high-throughput sequencing, adherence to MIQE is not merely a publication formality but a fundamental requirement for ensuring experimental validity [12] [6]. It gives researchers the tools to document all aspects of their qPCR experiments, from sample preparation to data analysis, thereby providing a bulwark against the reproducibility crisis [3].
The Central Role of qPCR in Transcriptional Biomarker Validation
Transcriptional biomarkers, which include messenger RNAs (mRNAs), long non-coding RNAs (lncRNAs), and microRNAs (miRNAs), offer significant advantages in molecular diagnostics. They allow for immediate detection of cellular changes, as the transcriptional profile of a cell responds to a signal within minutes, while alterations may only be visible after hours on the protein level [12]. Liquid biopsies, which are minimally invasive, have become a prominent source for these biomarkers, providing systemic information from blood plasma, urine, or saliva that might be missing in tissue biopsies [12].
The pipeline for developing these biomarkers typically begins with a holistic discovery phase, such as RNA sequencing (RNA-Seq), to establish a candidate biomarker signature. However, this must be followed by a confirmation process using a highly precise and reproducible method [12] [6]. This is where RT-qPCR proves its immense value. As a fast and reproducible quantification method, it is the gold standard for validating discovered biomarker signatures before they can be deployed in routine molecular diagnostics or personalized medicine [12]. The reliability of this validation step is paramount; a flawed process can lead to the promotion of useless biomarkers or the rejection of truly valuable ones.
Advantages of Nucleic Acid Biomarkers
- Low Detection Limits: Nucleic acids can be amplified by PCR, enabling detection at significantly lower concentrations than proteins [12].
- Cost Efficiency: Detection does not require highly affine and expensive antibodies, unlike many protein-based assays [12].
- Direct Link to Disease: Many diseases are directly caused by DNA changes, which are more easily detected by PCR-based methods than antibody-based assays [12].
- Stability in Circulation: miRNAs, for example, are relatively stable in body fluids due to protection within extracellular vesicles or by RNA-binding proteins [12].
Table 1: Types of Transcriptional RNA Biomarkers with Examples
| RNA Type | Size | Example | Disease Context | Potential Use |
|---|---|---|---|---|
| mRNA | Varies | PAM50 |
Breast Cancer | Diagnosis/Prognosis |
| lncRNA | >200 nt | HOTAIR |
Breast Cancer | Prognosis |
| miRNA | ~22 nt | miR-141 |
Prostate Cancer | Diagnosis |
| isomiR | ~22 nt | 5'isomiR-140-3p |
Breast Cancer | Prognosis |
The MIQE Guidelines: A Framework for Rigor
The MIQE guidelines are a set of minimum information standards that a researcher must provide when publishing qPCR experiments. This initiative was born from a clear need: a lack of consensus on how best to perform and interpret qPCR experiments, exacerbated by insufficient experimental detail in many publications [11]. This inadequacy impedes a reader's ability to critically evaluate the quality of the results or to repeat the experiments.
The core objective of MIQE is to ensure the integrity of the scientific literature, promote consistency between laboratories, and increase experimental transparency [11] [13]. By providing all relevant experimental conditions and assay characteristics, reviewers and readers can assess the validity of the protocols used. Full disclosure of reagents, sequences, and analysis methods is necessary to enable other investigators to reproduce results, which is the bedrock of the scientific method [11].
Key Pillars of the MIQE Guidelines
The guidelines cover the entire workflow of a qPCR experiment. The following are particularly critical for biomarker research:
Sample and Template Quality
The source, handling, and quality of the starting material fundamentally impact results. For RNA templates, the following must be reported:
- Tissue Source and Storage Conditions: Critical for longitudinal studies [10].
- Nucleic Acid Quality and Quantity: Assessed using tools like microfluidics-based systems (e.g., Bioanalyzer) [10].
- DNA Contamination: The extent of residual genomic DNA contamination must be reported, typically by comparing quantification cycles (Cq) with and without reverse transcription [10].
- Inhibition Testing: Every sample, or a representative set, should be tested for the absence of inhibitors using a spike-in control or a dilution series [10].
Assay Optimization and Validation
A key source of irreproducibility is the use of unvalidated or poorly characterized assays.
- Oligo Sequences and Accession Numbers: Primer sequences and database accession numbers must be reported. Disclosure of probe sequences is strongly encouraged [10]. For commercial assays like TaqMan, the unique Assay ID and the amplicon context sequence should be provided to comply with MIQE [3].
- Specificity and Efficiency: Primer specificity must be validated in silico (e.g., BLAST) and empirically (e.g., gel electrophoresis, melting curves). PCR efficiency for each assay must be determined using a calibration curve and reported [10].
- Precision: Measures of intra-assay variation (repeatability) and, for diagnostic assays, inter-assay precision (reproducibility) should be reported [10].
Experimental Run and Controls
The setup of the qPCR plate itself must be meticulously planned and documented.
- Essential Controls: The following controls are mandatory:
- Run Layout: A "sample maximisation" strategy (running all samples for a gene on the same plate) is encouraged over a "gene maximisation" strategy to minimise run-to-run variation. If multiple runs are necessary, inter-run calibrators (IRCs) must be used [10].
Data Analysis and Normalization
Improper data analysis is a major source of error.
- Reference Gene Validation: Normalization using reference genes is an essential component of a reliable qPCR assay. Their utility must be validated for the specific tissues or cell types in the experiment at hand. Normalization should generally be performed against multiple reference genes (at least three), chosen from a sufficient number of candidates using a dedicated algorithm like geNorm [10].
- Special Considerations for miRNA: For miRNA expression profiling, normalisation should be performed against the mean expression value of all expressed miRNAs in large-scale experiments. For smaller studies, suitable reference miRNAs must be identified through pilot experiments [10]. It is critical to use specialized miRNA extraction protocols, as extraction efficiency can be highly variable [10].
Figure 1: A MIQE-compliant workflow for validating a transcriptional biomarker signature discovered by next-generation sequencing. Adherence to MIQE at the validation stage ensures the reliability and reproducibility of the final biomarker [12] [6] [10].
A Practical MIQE Checklist for Cancer Biomarker Researchers
For the practicing scientist, the full MIQE guidelines can appear daunting. The following table summarizes the absolute minimum information required for publishing a qPCR-based biomarker study, adapted from the "MIQE précis" [10]. This checklist can serve as a practical guide for both designing experiments and preparing manuscripts.
Table 2: Essential MIQE Checklist for Biomarker Researchers
| Category | Information Required | Why It Matters for Biomarkers |
|---|---|---|
| Sample | Tissue/sample source, storage conditions, nucleic acid quality/quantity (e.g., RIN), DNA contamination assessment. | Liquid biopsies (e.g., plasma, urine) have unique handling requirements. Sample quality directly impacts quantification accuracy [12] [10]. |
| Assay | Primer sequences, amplicon size, database accession numbers. Strongly encouraged: Probe sequence. Validation data: PCR efficiency, correlation coefficient (R²) from calibration curve, linear dynamic range. | Ensures the assay correctly targets the biomarker (e.g., specific miRNA or isomiR) and operates with high sensitivity and efficiency over the required concentration range [3] [10]. |
| qPCR Protocol | Detailed reagent concentrations, instrument details, complete cycling conditions. | Necessary for exact experimental replication in another lab, a prerequisite for multi-center biomarker validation [11]. |
| Controls | No template control (NTC), no amplification control (NAC). For RNA: no-reverse transcription control. For multi-plate runs: inter-run calibrators (IRCs). | Detects contamination and monitor assay performance. IRCs correct for run-to-run variation, critical for large patient cohort studies [10]. |
| Data Analysis | Cq determination method, normalization strategy (validated reference genes/miRNAs), software used, statistical methods for precision. | Using unvalidated reference genes is a primary source of error. Proper normalization is essential for accurate fold-change calculations between patient and control groups [10]. |
Implementing MIQE requires not only a change in practice but also the use of appropriate reagents and tools. The following table details key resources that facilitate MIQE-compliant biomarker research.
Table 3: Research Reagent Solutions for MIQE-Compliant Workflows
| Tool / Reagent | Function | Role in MIQE Compliance |
|---|---|---|
| Specialized miRNA Kits | Optimized for isolation of small RNAs from liquid biopsies (plasma, urine). | Ensures efficient and consistent recovery of miRNA biomarkers, which is reagent-dependent and can be variable [10]. |
| Validated Assay Panels | Pre-designed and optimized primer/probe sets (e.g., TaqMan Assays). | Provides a standardized, well-characterized assay with known performance metrics (efficiency, specificity), reducing validation burden [3]. |
| DNA Removal Kits | Treatment of RNA samples with DNase to digest residual genomic DNA. | Critical for providing evidence of the absence of DNA contamination, an essential MIQE requirement for RNA templates [13] [10]. |
| Inhibition Test Kits | "Alien" spike-in controls or synthetic oligonucleotides. | Allows for testing each sample or a representative set for the presence of PCR inhibitors, a key QC step [10]. |
| Reference Gene Panels | Pre-selected sets of candidate reference genes for specific tissues or conditions. | Provides a starting point for the rigorous validation of multiple reference genes required for reliable normalization [10]. |
Figure 2: The relationship between common causes of irreproducible qPCR data and their corresponding solutions as prescribed by the MIQE guidelines. Addressing these technical flaws systematically is key to improving data integrity [11] [10].
The MIQE guidelines represent more than just a checklist for publication; they are a fundamental component of rigorous scientific practice in qPCR-based biomarker research. By addressing the root causes of the reproducibility crisis—inadequate experimental design, insufficient validation, and opaque reporting—MIQE provides a clear path toward generating reliable and credible data. For the field of cancer biomarker validation, where the ultimate stakes involve clinical decision-making and patient outcomes, the adoption of MIQE is not optional but imperative. It ensures that biomarker signatures are built on a foundation of technical robustness, enabling their successful translation from the research bench to clinical applications in diagnostics and personalized medicine. As the technology and applications evolve, a commitment to these minimum standards will be crucial for maintaining the integrity of the scientific literature and accelerating the development of impactful molecular diagnostics.
Within the critical field of cancer biomarker validation, the reliability of quantitative PCR (qPCR) data can directly influence diagnostic and therapeutic decisions. The Minimum Information for Publication of Quantitative Real-Time PCR Experiments (MIQE) guidelines provide a standardized framework to ensure the reproducibility and credibility of these experiments [3]. Despite their importance, widespread methodological failures—such as unreported PCR efficiencies and unvalidated reference genes—undermine data integrity, a particularly dangerous shortcoming in translational cancer research [14]. The recently released MIQE 2.0 guidelines update and refine these standards to address technological advances and persistent challenges [2]. This guide details the three pillars of robust qPCR assay validation—Cq values, amplification efficiency, and dynamic range—within the context of MIQE 2.0, providing a structured approach essential for any rigorous cancer biomarker research program.
Core Concepts and Definitions
Cq (Quantification Cycle) Values
The Cq value (Quantification Cycle) is the foundational metric in qPCR, defined as the cycle number at which the amplification curve crosses the quantification threshold. The MIQE 2.0 guidelines emphasize that Cq values alone are not reliable endpoints for publication; they must be converted into efficiency-corrected target quantities to allow for meaningful biological interpretation and cross-laboratory comparison [2]. Accurate Cq determination depends critically on a well-designed assay and proper baseline and threshold settings. In cancer research, where fold-changes in gene expression can be small yet biologically significant, precise and accurate Cq measurement is non-negotiable.
Amplification Efficiency
Amplification Efficiency (E) is a critical performance parameter that quantifies the rate of target amplification during the exponential phase of the PCR reaction. An ideal reaction, where the amount of product doubles every cycle, has an efficiency of 100% (E=2.0). In practice, the MIQE guidelines require researchers to determine and report the actual efficiency of each assay, not assume it [14]. Efficiency values outside the optimal range (typically 90–110%) indicate suboptimal assay performance that will skew relative quantification results, leading to inaccurate estimates of biomarker expression levels—a common source of irreproducibility in the literature.
Dynamic Range
The Dynamic Range of a qPCR assay defines the span of template concentrations over which the assay provides reliable quantification. It is bounded at the lower end by the Limit of Detection (LOD) and at the upper end by the point where the reaction plateau begins. The MIQE guidelines mandate that the dynamic range be established for each target using a calibration curve and reported in the manuscript [2]. For cancer biomarker applications, such as detecting low-abundance transcripts from circulating tumor cells or monitoring minimal residual disease, a wide dynamic range and a low LOD are paramount for clinical utility.
The relationship between these three concepts is fundamental to a properly validated assay. Amplification efficiency directly influences the accuracy of the calculated template concentration from a given Cq value, and this relationship must be linear across the entire reported dynamic range of the assay. Failure to characterize and report on all three elements in concert is a major source of unreliable data.
Diagram 1: The workflow from sample to reliable quantification, highlighting the essential inputs required for accurate calculation of target quantity.
MIQE 2.0 Reporting Requirements
The MIQE 2.0 guidelines have clarified and updated the reporting requirements for qPCR experiments to promote transparency and reproducibility [2]. The table below summarizes the essential information that must be reported for Cq values, amplification efficiency, and dynamic range in the context of a publication.
Table 1: Essential MIQE 2.0 Reporting Requirements for Core qPCR Concepts
| Concept | Specific Data to Report | Clinical/Biomarker Context |
|---|---|---|
| Cq Values | - Method for Cq determination- Export of raw data for independent verification [2] [14] | Report Cq values converted to efficiency-corrected target quantities with prediction intervals [2]. |
| Amplification Efficiency | - Calculated value for each assay (e.g., from slope of standard curve)- How the efficiency was determined | Critical for accurate fold-change calculations in biomarker expression studies [14]. |
| Dynamic Range | - Limit of Detection (LOD)- Upper and lower limits of quantification | Must be established for each target; vital for detecting low-abundance cancer transcripts [2]. |
Beyond these core concepts, MIQE 2.0 also stresses the importance of comprehensive reporting on sample quality, nucleic acid integrity, and rigorous validation of reference genes used for normalization [14]. These factors collectively form the foundation upon which reliable qPCR data is built.
Experimental Protocols for Assay Validation
Generating a Standard Curve for Efficiency and Dynamic Range
The standard curve is the primary tool for determining both amplification efficiency and dynamic range.
Detailed Protocol:
- Template Preparation: Create a serial dilution (e.g., 1:10 or 1:5) of a known, high-quality template (e.g., a plasmid containing the target amplicon or a cDNA sample with high expression of the target gene). Use gravimetric or volumetric dilutions for maximum accuracy [15].
- qPCR Run: Amplify each dilution in replicate (at least 3 technical replicates) using the same qPCR conditions planned for the experimental samples.
- Data Analysis:
- Plot the mean Cq value for each dilution against the logarithm of its known initial concentration.
- Perform linear regression on the plot. The slope of the line is used to calculate amplification efficiency: E = 10^(-1/slope).
- The R² value of the regression indicates the linearity of the assay across the dilution series, which defines the dynamic range.
- The Limit of Detection (LOD) is the lowest concentration in the dilution series that yields a consistent Cq value and is distinguishable from the no-template control (NTC).
Assay Specificity and Sequence Verification
For cancer biomarker research, confirming that an assay amplifies only the intended target is paramount.
Detailed Protocol:
- In Silico Specificity Check: Use tools like BLAST to ensure primers and probes are specific to the target sequence, especially to distinguish it from homologous pseudogenes or family members, which is common in cancer-related genes [15].
- Amplicon Context Sequence: To comply with MIQE guidelines on assay disclosure, provide the probe or amplicon context sequence. For TaqMan assays, this can be generated using the assay ID and RefSeq accession number via the NCBI nucleotide database [3].
- Experimental Verification: Analyze the qPCR end-product by gel electrophoresis to confirm a single band of the expected size, or use melt curve analysis for intercalating dye-based assays to confirm a single, sharp peak.
The Scientist's Toolkit: Essential Reagents and Materials
Table 2: Key Research Reagent Solutions for MIQE-Compliant qPCR
| Item | Function/Description | MIQE Compliance Consideration |
|---|---|---|
| TaqMan Assays | Predesigned, sequence-specific primer-probe sets. | Provide the unique Assay ID and, for full compliance, the amplicon context sequence from the Assay Information File (AIF) [3]. |
| Nucleic Acid Integrity Analyzer | Instrument (e.g., Bioanalyzer) to assess RNA Quality Number (RQN) or RNA Integrity Number (RIN). | Essential for documenting sample quality. Poor RNA integrity is a major source of variable reverse transcription and erroneous results [14]. |
| Standard Curve Template | Purified plasmid, gBlock, or cDNA with known concentration for generating calibration curves. | Required for calculating amplification efficiency and defining the dynamic range for each assay [2]. |
| Validated Reference Gene Assays | qPCR assays for genes used for normalization of target data. | Must be validated for stable expression across all experimental conditions (e.g., tumor vs. normal tissue); using unvalidated reference genes is a common failure [14]. |
Diagram 2: The logical relationship between foundational practices, core concepts, required actions, and the ultimate goal of reliable data.
The updated MIQE 2.0 guidelines provide a critical roadmap for generating qPCR data that is not only publishable but also clinically actionable. For researchers validating cancer biomarkers, a rigorous understanding and application of the principles surrounding Cq values, amplification efficiency, and dynamic range is non-negotiable. These concepts are deeply interconnected, forming the bedrock of any assay that aims to accurately quantify subtle but meaningful changes in gene expression. As emphasized by the international consortium behind MIQE 2.0, the ultimate goal is a cultural shift towards unwavering methodological rigor [14]. By adhering to these guidelines, the scientific community can ensure that qPCR results underpinning cancer biomarker discovery and validation are robust, reproducible, and reliable, thereby accelerating the translation of molecular findings into tangible patient benefits.
The Role of MIQE in Cancer Biomarker Development Pipelines
In the field of oncology, the discovery and validation of robust cancer biomarkers represent a critical pathway toward improving early detection, prognosis, and personalized treatment strategies. The pipeline from biomarker discovery to clinical application, however, is fraught with challenges, primarily concerning the reproducibility and reliability of experimental data. Among the various technological platforms used, reverse transcription quantitative PCR (RT-qPCR) has emerged as a cornerstone for target validation due to its sensitivity, specificity, and quantitative capabilities. The Minimum Information for Publication of Quantitative Real-Time PCR Experiments (MIQE) guidelines provide a standardized framework designed to ensure the transparency and technical rigor of qPCR experiments. This technical guide examines the integral role of MIQE compliance within cancer biomarker development pipelines, detailing how its application enhances the validity of transcriptional biomarkers across diverse liquid biopsy sources and RNA classes, thereby strengthening the translational bridge from research discovery to clinical diagnostics.
MIQE Guidelines: Evolution and Core Principles
The MIQE guidelines were originally established in 2009 to address widespread concerns about the reproducibility of qPCR-based research. The recent publication of MIQE 2.0 in 2025 reflects a significant evolution of these standards, incorporating advances in qPCR technology and the growing complexities of its applications [2].
The Core Principles of MIQE
The foundational principle of MIQE is that a transparent, clear, and comprehensive description of all experimental details is necessary to ensure the repeatability and reproducibility of qPCR results [2]. The guidelines encompass all phases of a qPCR experiment:
- Experimental Design: Appropriate sample collection, storage, and processing conditions.
- Assay Validation: Specificity, sensitivity, and efficiency of primer/probe sets.
- Data Acquisition and Analysis: Guidelines for robust quantification cycle (Cq) determination, data normalization, and statistical analysis.
- Reporting Standards: Detailed requirements for the information that must be included in publications to allow independent verification.
A key update in MIQE 2.0 is the emphasis on converting raw Cq values into efficiency-corrected target quantities and reporting them with prediction intervals [2]. This moves beyond simple relative quantification to a more accurate absolute measurement, which is crucial for the cross-laboratory comparability required in biomarker development.
The Cancer Biomarker Development Pipeline: Integration of MIQE-Compliant Validation
The development of a cancer biomarker follows a multi-stage pipeline, from initial discovery to clinical application. MIQE-compliant validation acts as a critical checkpoint, ensuring that candidate biomarkers identified through high-throughput screening possess the analytical robustness to proceed further. Figure 1 below illustrates this integrated workflow.
Figure 1. Integration of MIQE-Compliant Validation into the Cancer Biomarker Development Pipeline. The workflow shows the transition from high-throughput discovery platforms to targeted, MIQE-compliant RT-qPCR validation, which is a critical gatekeeper for the development of robust clinical assays.
From High-Throughput Discovery to Targeted Validation
The initial stage of biomarker development often involves holistic profiling using technologies like next-generation sequencing (NGS) or microarrays. For example, small RNA sequencing can identify differential expression of microRNAs (miRNAs) in blood total RNA, establishing a candidate biomarker signature [6]. Similarly, RNA sequencing (RNA-Seq) is used to discover messenger RNA (mRNA) and long non-coding RNA (lncRNA) signatures [12] [7]. These high-throughput methods are powerful for discovery but can be subject to technical noise and may not be readily implementable in a clinical setting.
The transition from discovery to validation is a critical juncture. Candidates identified by NGS must be confirmed by an orthogonal technology—a method based on different principles. RT-qPCR is the most widely used platform for this validation due to its quantitative nature, sensitivity, and potential for high-throughput clinical implementation [6] [12]. Performing this validation in accordance with MIQE guidelines is paramount to ensure that the observed differential expression is biologically real and not an artifact of the discovery platform or a poorly optimized assay.
Application of MIQE Across Different Transcriptional Biomarker Classes
MIQE principles provide a universal framework that can be adapted to the specific challenges of quantifying different RNA biomarker classes found in liquid biopsies. Table 1 summarizes the key advantages and MIQE compliance considerations for major RNA types.
Table 1: MIQE-Compliant Analysis of Major Transcriptional Biomarker Classes in Liquid Biopsies
| RNA Class | Key Characteristics | Advantages as Biomarkers | MIQE Compliance Considerations |
|---|---|---|---|
| mRNA | Protein-coding transcripts; ~1-2% of transcriptome. | Direct link to pathological processes; expression in blood is 80% identical to major tissues [12]. | Critical reference gene validation for normalization; careful RNA quality control due to lability. |
| miRNA | Short (~22 nt) non-coding RNAs; regulate gene expression. | High stability in biofluids; resistant to RNases; tissue-specific expression; protected in extracellular vesicles [12] [7]. | Specialized reverse transcription for short templates; assay design to distinguish canonical miRNAs from isomiRs [12]. |
| lncRNA | Long non-coding RNAs (>200 nt). | High tissue-specificity; associated with numerous diseases, especially cancer [7]. | Similar to mRNA; ensure assay specificity across often low-abundance and overlapping transcripts. |
MIQE in the Validation of miRNA Biomarkers
The validation of miRNA biomarkers is a prime example of MIQE's application. After a biomarker signature is established by small RNA sequencing, MIQE-compliant RT-qPCR validation is used for confirmation [6]. Key steps where MIQE guidelines are critical include:
- Assay Design: Designing primers and probes that accurately quantify the mature miRNA molecule, which is very short. Assays must be specific enough to potentially distinguish between closely related miRNA family members and different isomiRs (miRNA isoforms), which can have different target repertoires and even higher discriminatory power for cancer [12] [7].
- Normalization: Selecting and validating appropriate reference genes for data normalization is a core MIQE principle. This is particularly important for liquid biopsies, as traditional cellular reference genes may not be stably expressed in cell-free biofluids. The use of validated, stably expressed reference genes or spike-in controls is recommended [16].
Integration with Other Domain-Specific Guidelines
For biomarkers derived from specific substrates like extracellular vesicles (EVs), MIQE should be integrated with other domain-specific guidelines. EVs are nanoscale particles released by cells that carry molecular cargo, including RNAs, and are a promising source for liquid biopsy biomarkers [17] [16].
The MISEV (Minimal Information for Studies of Extracellular Vesicles) guidelines provide essential domain-specific recommendations for EV isolation, characterization, and reporting [16]. While MISEV ensures the quality and identity of the EV preparation itself, it deliberately refrains from prescribing methods for molecular quantification. This is where MIQE becomes indispensable. Integrating MIQE into the MISEV framework creates a comprehensive workflow that guarantees analytical rigor from EV isolation through to the quantitative analysis of EV-associated RNA cargo by RT-qPCR [16]. This synergy between general analytical (MIQE) and domain-specific (MISEV) standards provides a scalable blueprint for improving reproducibility in complex biomarker development workflows.
Essential Reagents and Methodologies for MIQE-Compliant Workflows
Adhering to MIQE guidelines requires careful selection and documentation of reagents and methodologies. The following section outlines key components and protocols for a MIQE-compliant biomarker validation experiment.
Research Reagent Solutions for MIQE Compliance
Table 2: Key Reagent Solutions for MIQE-Compliant Biomarker Validation
| Item | Function in Workflow | MIQE Compliance Requirement |
|---|---|---|
| TaqMan Assays | Predesigned, optimized primer-probe sets for specific targets. | Publication of unique Assay ID and amplicon context sequence fulfills MIQE sequence disclosure guidelines [3]. |
| Reference Gene Panels | A set of candidate genes for normalization. | Validation of stable expression in the specific sample matrix (e.g., plasma, serum) is mandatory; no single universal reference gene exists [12] [16]. |
| RNA Spike-in Controls | Synthetic, exogenous RNA molecules. | Controls for reverse transcription efficiency and normalization in samples with low or variable RNA input (e.g., EV isolates) [16]. |
| Droplet Digital PCR (ddPCR) | An orthogonal technology for absolute quantification. | Used for technical validation; provides highly sensitive, absolute quantification of target molecules without relying on Cq values, ideal for low-abundance targets in liquid biopsies [18]. |
Detailed Experimental Protocol: Validation of a Candidate miRNA Biomarker
This protocol exemplifies a MIQE-compliant workflow for validating a miRNA biomarker candidate previously identified by small RNA-Seq in a plasma liquid biopsy study [6] [12].
Sample Preparation (Pre-analytical Phase):
- Collect peripheral blood in EDTA or citrate tubes. Process within 2 hours to isolate plasma via double-centrifugation to avoid cell contamination.
- Isolve total RNA from 200-500 µL of plasma using a phenol-guanidine based method, including spike-in synthetic miRNAs (e.g., cel-miR-39) to control for extraction efficiency.
Reverse Transcription (RT):
- Convert RNA to cDNA using a miRNA-specific stem-loop RT primer. This method increases specificity and efficiency for short RNA templates.
- Include a minus-RT control (a reaction without the reverse transcriptase enzyme) for each sample to detect potential genomic DNA contamination.
MIQE-Compliant qPCR Assay:
- Use a predesigned TaqMan MicroRNA Assay. Record the Assay ID (e.g., hsa-miR-21-5p, Assay ID 000397) and obtain the amplicon context sequence from the manufacturer's website to fulfill MIQE disclosure requirements [3].
- Perform amplification in technical triplicates on a calibrated qPCR instrument.
- Include a standard curve (e.g., a 5-point, 10-fold serial dilution of a synthetic target) in each run to determine the amplification efficiency (should be 90-110% with an R² > 0.99).
- Include no-template controls (NTCs) to check for reagent contamination.
Data Analysis and Normalization:
- Export raw Cq values. Use the standard curve to convert Cqs into efficiency-corrected target quantities.
- Normalize the data using a validated strategy. This could be the ratio of the target miRNA quantity to the geometric mean of multiple validated reference genes (e.g., miR-16-5p, miR-92a-3p) that have been shown to be stable in your sample cohort. Alternatively, use the spike-in synthetic miRNA for normalization.
- Report the normalized quantities with appropriate confidence intervals or prediction intervals for each sample group, as emphasized in MIQE 2.0 [2].
The MIQE guidelines provide an indispensable foundation for building robust, reliable, and reproducible cancer biomarker development pipelines. By enforcing rigorous standards for experimental design, assay validation, data analysis, and transparent reporting, MIQE compliance directly addresses the critical issue of translational failure. As the field advances, with discoveries expanding into new RNA classes and complex liquid biopsy sources like extracellular vesicles, the integration of MIQE with other domain-specific standards such as MISEV will become increasingly important. For researchers and drug development professionals, the adoption of MIQE is not merely a matter of publication compliance but a fundamental component of a quality system that ensures only the most rigorously validated biomarker candidates progress toward clinical application, ultimately accelerating the development of effective molecular diagnostics for cancer patients.
The convergence of the Minimal Information for Studies of Extracellular Vesicles (MISEV) and Minimum Information for Publication of Quantitative Real-Time PCR Experiments (MIQE) guidelines represents a critical framework for advancing robust, reproducible cancer biomarker research. Extracellular vesicles have emerged as promising minimally invasive biomarkers for cancers, including endometrial cancer, due to their stability in biofluids, molecular richness, and reflection of their parent cell's pathological state [19] [20] [21]. However, variability in EV workflows and inadequate standardization of downstream molecular analysis pose major obstacles to reproducibility and clinical translation [16]. The MISEV guidelines provide essential domain-specific recommendations for EV isolation, characterization, and reporting but deliberately refrain from prescribing methods for molecular quantification of EV cargo [16] [22]. Meanwhile, MIQE 2.0 offers a detailed foundation for ensuring analytical validity in RT-qPCR-based quantification, which remains the most critical method for validating and quantifying EV-associated RNA [16] [1]. This integration creates a comprehensive quality framework that bridges pre-analytical EV-specific considerations with rigorous nucleic acid quantification standards, addressing a critical gap in the biomarker development pipeline.
Understanding the Complementary Roles of MISEV and MIQE
Scope and Positioning Within the EV Analysis Pipeline
MISEV and MIQE guidelines address complementary stages of the EV biomarker workflow. MISEV provides domain-specific standards for pre-analytical phases and EV characterization, while MIQE defines best practices for the molecular quantification phase. Their integrated application ensures comprehensive quality control from sample collection to data interpretation.
Table 1: Scope and Positioning of MISEV and MIQE Guidelines in EV Analysis
| Stage in EV Workflow | MISEV-Specific | MIQE-Specific | Both | Example Parameters |
|---|---|---|---|---|
| Pre-analytical | EV source description; isolation method; removal of contaminants; storage conditions | Not directly addressed | Transparent reporting of sample provenance, handling, and storage | Volume/type of starting material; storage temperature/duration; processing time |
| Characterization | Particle size, distribution and concentration; protein markers; imaging; biochemical composition | Not directly addressed | Documentation of EV purity and integrity alongside downstream molecular assays | Particle concentration units; vesicle morphology images; marker expression profiles |
| Molecular Assay Preparation | MISEV2023 §5.5: quantification of total RNA; MISEV2023 §6.5: nucleic acid characterization | RNA quality/quantity assessment; contamination checks | RNA input quantity, quality control, and contamination assessment | RNA integrity metrics; yield per vesicle/volume; DNA contamination checks |
| Assay Design & Validation | MISEV2023 §6.5: recognition of nucleic acid characterization/validation requirements | Primer/probe sequences; specificity checks; amplification efficiency; RT conditions | Transparency in assay design, validation of controls/standards, overall reproducibility | Primer sequence disclosure; efficiency 90%-110%; linear dynamic range; RT protocol |
| Data Acquisition | Not directly addressed | Reporting of Cq values; inclusion of controls (NTC, -RT); melt curves; replicates | Use of appropriate controls, standards and full reporting of raw data | Raw Cq tables; replicate Cq SD; melt curve profiles |
| Data Analysis & Reporting | Transparent description of EV identity/purity | Normalization strategy; error metrics; statistical analysis; confidence intervals | Reporting raw data tables, replicate statistics, technical vs. biological variability | Reference gene validation; normalization method; %CV on fold changes |
Fundamental Principles of MISEV
MISEV guidelines, developed by the International Society for Extracellular Vesicles, establish essential practices for EV research through several foundational principles. The guidelines recommend using operational terms like "small EVs" and "large EVs" based on physical characteristics rather than potentially ambiguous biogenetic terminology such as "exosomes" [16] [19]. They mandate the use of multiple complementary characterization techniques, including particle quantification (e.g., NTA, TRPS), visualization (e.g., TEM), and assessment of EV-specific protein markers (e.g., CD63, CD9, CD81) alongside negative markers to confirm absence of contaminants [19]. MISEV emphasizes transparent reporting of methodological details including isolation methods, source of biological material, and handling procedures to enable experimental replication [16]. The guidelines also stress functional characterization where appropriate, linking EV properties to biological outcomes in well-controlled assays.
Fundamental Principles of MIQE
The MIQE guidelines, originally published in 2009 and updated to MIQE 2.0, establish rigorous standards for quantitative PCR experiments through several core principles [11] [1]. They mandate comprehensive assay validation including demonstration of primer specificity, determination of amplification efficiency through standard curves, and establishment of linear dynamic range [3] [15]. MIQE emphasizes rigorous experimental design with appropriate technical and biological replication, inclusion of essential controls, and validation of reference genes for normalization [1]. The guidelines require complete transparency in reporting, including detailed descriptions of sample quality, nucleic acid extraction methods, reaction conditions, and raw data availability [3] [11]. MIQE also addresses appropriate data analysis methods including proper normalization strategies, statistical treatment, and clear reporting of uncertainty metrics [1].
Integrated Experimental Workflow: From EV Isolation to Quantitative Analysis
Diagram 1: Integrated MISEV-MIQE Workflow for EV Biomarker Research. This diagram illustrates the sequential stages of EV-based biomarker analysis, highlighting where MISEV and MIQE guidelines apply throughout the process.
EV Isolation and Characterization (MISEV-Compliant)
The initial phase focuses on obtaining high-quality EV preparations from biological samples using MISEV-compliant methods. Differential ultracentrifugation remains widely used, employing sequential centrifugation steps to remove cells, debris, and concentrate EVs [19]. Size-based separation techniques include size-exclusion chromatography, which preserves EV integrity, and ultrafiltration, though potential vesicle deformation should be considered [20]. Precipitation methods using polymers offer convenience but may co-precipitate contaminants [19]. For characterization, nanoparticle tracking analysis determines particle size distribution and concentration, while tunable resistive pulse sensing provides similar information with potentially improved sizing accuracy [19]. Transmission electron microscopy and atomic force microscopy offer morphological information at high resolution [20]. Western blot analysis or comparable techniques should demonstrate presence of EV-associated proteins and absence of contaminating proteins [19].
Nucleic Acid Extraction and Quality Control
Nucleic acid extraction from EV preparations requires methods optimized for limited starting material while maintaining reproducibility. Commercial kits specifically designed for EV RNA extraction are recommended as they typically include carrier molecules to improve recovery efficiency [16]. RNA quality assessment should include spectrophotometric or fluorometric quantification with acceptable 260/280 ratios (1.8-2.0 for RNA, 1.7-1.9 for DNA), and RNA integrity measurement using appropriate metrics when sufficient material is available [16]. Contamination checks should include assessment of genomic DNA contamination and, where relevant, hemolysis indicators for blood-derived samples [16]. The use of spike-in controls, such as recombinant EVs engineered to contain exogenous RNA, is encouraged to monitor extraction efficiency and enable normalization across samples [16].
Assay Design and Validation (MIQE-Compliant)
Robust assay design and validation are essential for generating reliable quantification data. Primer and probe sequences must be disclosed or accessible through databases, with in silico specificity verification using tools like BLAST and consideration of pseudogenes or homologous sequences [3] [15]. Experimental validation should include efficiency determination via serial dilution with acceptable efficiency ranges of 90-110%, demonstration of linear dynamic range over at least 3 orders of magnitude, and confirmation of specificity through melt curve analysis or sequencing of amplification products [3]. Essential controls must include no-template controls, minus reverse transcription controls for RNA assays, and inter-plate calibrators for experiments run across multiple plates [16]. Reference gene selection requires validation of stability across all experimental conditions using algorithms like geNorm or NormFinder [16].
Practical Implementation Strategies
The Scientist's Toolkit: Essential Research Reagents and Materials
Table 2: Essential Research Reagent Solutions for Integrated MISEV-MIQE Workflows
| Reagent/Material | Function | Application Notes |
|---|---|---|
| TaqMan Assays | Predesigned qPCR assays with optimized primers and probes | Provide assay ID and amplicon context sequence for MIQE compliance; >296K citations support widespread acceptance [3] |
| RNA Extraction Kits (EV-optimized) | Isolation of high-quality RNA from limited EV samples | Include carrier RNA to improve yield; select kits with DNase treatment to minimize genomic DNA contamination [16] |
| Reference Gene Panels | Validated stable reference genes for normalization | Essential for accurate quantification; requires validation across specific EV populations and biological conditions [16] |
| NTA Instrumentation | Particle quantification and size distribution analysis | Provides MISEV-required characterization of EV preparations; complement with protein markers for comprehensive characterization [19] |
| EV Separation Matrix | Size-exclusion chromatography media for gentle EV isolation | Preserves EV integrity better than harsh precipitation methods; reduces co-isolation of contaminants [19] |
| Synthetic Spike-in Controls | Exogenous RNA/DNA sequences for process monitoring | Added pre-extraction to monitor efficiency; enables normalization across different sample batches [16] |
Methodological Details for Key Experiments
For EV RNA quantification, the integrated approach requires specific methodological considerations. Starting material should be standardized by particle number rather than volume alone, with typical inputs of 10^8-10^9 particles for RNA extraction [16]. Reverse transcription should use optimized conditions with documented enzyme type, priming strategy, and reaction conditions, as RT efficiency significantly impacts quantitative results [16]. qPCR reaction optimization must include determination of optimal annealing temperature through gradient PCR, template input titration, and validation of minimal variation between technical replicates [3]. Data analysis should incorporate appropriate normalization strategies using validated reference genes, statistical methods that account for both technical and biological variability, and clear reporting of confidence intervals for fold-change calculations [16] [1].
Analysis of Current Adherence and Implementation Challenges
Implementation of integrated MISEV-MIQE standards faces several practical challenges. A systematic review of EV biomarkers in endometrial cancer revealed that none of the 23 included studies provided complete evidence supporting biomarkers being encapsulated within EVs rather than associated with co-isolated contaminants [19]. Only 7 of 23 studies (30%) characterized EVs using multiple complementary techniques as recommended by MISEV, while 6 studies (26%) failed to report any pre-analytical variables related to sample collection and processing [19]. Common deficiencies in qPCR aspects included insufficient description of RNA quality metrics, absence of amplification efficiency data, and inadequate validation of reference genes [19] [1]. The predominance of low-sample-size studies (typically <50 cases) combined with methodological limitations raises concerns about the validity of reported biomarkers and their potential for clinical translation [19].
Analytical Framework: Quality Assessment and Validation
Critical Appraisal of EV Biomarker Studies
A systematic evaluation framework is essential for assessing the quality of EV biomarker studies. The following criteria provide a structured approach to quality assessment, with specific examples from endometrial cancer biomarker research:
Table 3: Quality Assessment Framework for EV Biomarker Studies
| Assessment Domain | High-Quality Indicators | Common Deficiencies | Examples from Literature |
|---|---|---|---|
| EV Characterization | Multiple techniques (NTA+imaging+protein markers); reporting of particle concentration & size distribution | Single characterization method; incomplete marker panels; missing negative controls | Only 7/23 endometrial cancer EV studies used multiple characterization techniques [19] |
| Assay Validation | Reported amplification efficiency; linear dynamic range; specificity verification; reference gene stability | Assumed rather than measured efficiency; unvalidated reference genes; missing controls | Widespread reporting of fold-changes without measurement uncertainty or efficiency calculations [1] |
| Technical Replication | Appropriate technical replicates; clear distinction between technical and biological variation; reported Cq variation | Insufficient replicates; undefined replication strategy; high variation not addressed | Analyses of qPCR literature show serious deficiencies in experimental transparency [1] |
| Data Transparency | Raw Cq values available; complete reaction conditions; primer sequences disclosed | Selective data reporting; insufficient methodological detail; undisclosed sequences | Incomplete reporting remains prevalent despite MIQE awareness [1] |
| Analytical Specificity | Demonstration of EV association rather than co-isolation; controls for non-vesicular biomarkers | Assumption without evidence that biomarkers are EV-associated | No studies in endometrial cancer review provided complete evidence of EV encapsulation [19] |
Validation Strategies for EV-Associated Biomarkers
Rigorous validation is particularly challenging for EV-associated biomarkers due to sample heterogeneity and limited starting material. Orthogonal validation using different methodological approaches provides stronger evidence, such as correlating EV miRNA findings with tissue expression or independent quantification methods [19]. For miRNA biomarkers identified in endometrial cancer, the most promising candidates (miR-21-3p, miR-26a-5p, miR-130a-3p, miR-139, and miR-219a-5p) showed expression patterns in EV preparations that reflected those in endometrial tissue [19]. Spike-in controls using engineered EVs with known RNA content enable absolute quantification and inter-laboratory comparison, addressing critical reproducibility challenges [16]. Inter-laboratory reproducibility testing through multi-center validation studies is essential for clinical translation, though rarely implemented in current EV biomarker research [19].
The integration of MISEV and MIQE guidelines provides a comprehensive framework for enhancing the rigor and reproducibility of extracellular vesicle biomarker research. This synergistic approach addresses the entire workflow from EV isolation through molecular quantification, creating a robust foundation for generating reliable, clinically translatable data. The current literature reveals significant opportunities for improvement in methodological reporting and experimental design, particularly in the characterization of EV preparations and validation of quantitative assays. As EV biomarkers continue to show promise for cancer diagnosis and monitoring—with several candidate miRNAs already emerging for endometrial cancer—adherence to these integrated standards becomes increasingly critical. By embracing this combined framework, researchers can overcome existing reproducibility challenges, accelerate the validation of promising biomarkers, and ultimately advance the field toward meaningful clinical applications in precision oncology.
Implementing MIQE-Compliant Workflows in Cancer Biomarker Development
Within the framework of cancer biomarker validation, the reliability of any quantitative PCR (qPCR) result is fundamentally dependent on the quality of the starting material. The Minimum Information for Publication of Quantitative Real-Time PCR Experiments (MIQE) guidelines, recently updated to version 2.0, emphasize that transparent and comprehensive reporting of sample quality assessment is not optional but essential for reproducibility and credibility [2] [3]. For research aimed at discovering and validating cancer biomarkers, where experimental outcomes may directly influence clinical decision-making, rigorous pre-analytical control is paramount. This guide provides an in-depth technical overview of assessing RNA integrity and contamination controls, aligning with the stringent requirements of the MIQE guidelines to ensure that qPCR data generated for cancer biomarker research is robust, reliable, and reproducible.
RNA Integrity Assessment
RNA integrity is a critical determinant for the success of downstream applications like qPCR. Degraded RNA can lead to biased quantification, false positives, or false negatives, ultimately jeopardizing the validity of a biomarker's reported performance.
Gel Electrophoresis
The traditional method for assessing RNA integrity involves denaturing agarose gel electrophoresis. This technique separates RNA molecules by size, allowing for visual inspection of the major ribosomal RNA (rRNA) bands.
- Principle: Under denaturing conditions, RNA is separated by molecular weight. Sharp, distinct rRNA bands indicate intact RNA, while a smear suggests degradation [23].
- Interpretation: For eukaryotic total RNA, intact samples display sharp 28S and 18S rRNA bands. A key quality metric is the 28S:18S rRNA intensity ratio, which should be approximately 2:1 for high-quality RNA [23] [24]. A diminished ratio or a smeared appearance indicates partial or complete degradation (see Figure 1, lane 2) [23].
- Considerations: This method requires a relatively large amount of RNA (at least 200 ng for ethidium bromide staining) and is less suited for low-yield samples. Sensitivity can be improved using fluorescent dyes like SYBR Gold, which can detect as little as 1-2 ng of RNA [23] [24].
Microfluidics-Based Analysis (e.g., Agilent Bioanalyzer/TapeStation)
Microfluidics-based systems offer a more automated, sensitive, and quantitative alternative to gel electrophoresis.
- Principle: These systems use microchips with integrated channels filled with a polymer matrix. RNA samples are separated electrophoretically, and the resulting data is presented as both a gel-like image and an electropherogram [23] [24].
- Interpretation: The electropherogram provides a detailed profile of the RNA sample. Intact RNA shows distinct peaks for the 18S and 28S rRNAs, while the baseline in the low-molecular-weight region is flat. From this data, a RNA Integrity Number (RIN) or similar metric (e.g., RQN) is algorithmically derived, providing a numerical score from 1 (degraded) to 10 (intact) [23].
- Advantages: This method is highly sensitive, requiring as little as 5 ng of RNA per analysis, and provides simultaneous information on concentration, integrity, and potential contaminants [23]. It is the gold standard for pre-qPCR quality control, especially for precious cancer biopsy samples.
Table 1: Comparison of RNA Integrity Assessment Methods
| Method | Principle | Sample Required | Key Output | Advantages | Limitations |
|---|---|---|---|---|---|
| Denaturing Agarose Gel | Size-based separation via electrophoresis | ~200 ng (EtBr) [23] | 28S:18S rRNA ratio (visually estimated) | Low cost; simple to perform [23] [24] | Semi-quantitative; higher sample requirement; uses hazardous dyes [24] |
| Microfluidics (Bioanalyzer) | Microchip-based capillary electrophoresis | ~5-50 ng [23] | RNA Integrity Number (RIN); Electropherogram | High sensitivity; quantitative; provides concentration and integrity [23] [24] | Higher instrument cost; specialized chips required |
The following workflow diagram outlines the logical process for assessing RNA integrity, from sample preparation to interpretation of results and the subsequent decision-making process.
Contamination Controls and Purity Assessment
Contaminants in an RNA sample can profoundly inhibit enzymatic reactions like reverse transcription and qPCR, leading to inaccurate Cq values and compromised data. The MIQE guidelines stress the importance of reporting purity metrics [2].
Spectrophotometric Analysis (UV Absorbance)
UV absorbance is a ubiquitous method for the rapid quantification of nucleic acids and assessment of common contaminants.
- Principle: Nucleic acids and proteins absorb ultraviolet light at characteristic wavelengths. Concentration and purity ratios are calculated from these absorbance values [24].
- Key Metrics:
- A260/A280 Ratio: This assesses protein contamination. Acceptable ratios for pure RNA are generally 1.8–2.2 [24]. A ratio below 1.8 often indicates residual phenol or protein contamination.
- A260/A230 Ratio: This assesses contamination by salts, guanidine, or carbohydrates. This ratio should ideally be greater than 1.7 [24]. A low A260/A230 ratio suggests the presence of co-purified reagents common in isolation kits.
- Limitations: Absorbance cannot distinguish between DNA and RNA, nor can it detect genomic DNA contamination in an RNA preparation. It is also insensitive to degradation, as free nucleotides still absorb at 260 nm [24].
Fluorescent Dye-Based Quantification
Fluorometers using RNA-binding dyes offer a highly sensitive alternative for quantification.
- Principle: Fluorescent dyes bind specifically to RNA, and the resulting fluorescence is measured against a standard curve [24].
- Advantages: This method is significantly more sensitive than absorbance, capable of detecting RNA concentrations as low as 1 pg/µl [24]. This is ideal for quantifying low-yield samples common in cancer research (e.g., from microdissections).
- Disadvantages and Controls: Most fluorescent dyes are not RNA-specific and will also bind to DNA, potentially leading to an overestimation of RNA concentration. To comply with MIQE standards for accurate quantification, a DNase treatment step is strongly recommended prior to measurement to eliminate this confounding variable [24].
Table 2: Methods for RNA Quantification and Purity Assessment
| Method | Principle | Sensitivity | Information Provided | Key Considerations for MIQE Compliance |
|---|---|---|---|---|
| UV Spectrophotometry | Absorbance of UV light at 260nm, 280nm, 230nm | 2 ng/µl [24] | Concentration, A260/A280, A260/A230 ratios | Cannot detect gDNA contamination; overestimates concentration if contaminants absorb at 260nm [24] |
| Fluorometry | Fluorescence of RNA-binding dyes | 1 pg/µl (1000x more sensitive) [24] | Highly accurate RNA concentration | Requires DNase treatment to avoid gDNA confounding; provides no purity (absorbance) information [24] |
The Scientist's Toolkit: Essential Reagents and Materials
Successful RNA work requires specialized reagents and materials to preserve and assess sample quality. The following table details essential items for maintaining RNA integrity and ensuring accurate quality control.
Table 3: Research Reagent Solutions for RNA Quality Control
| Item | Function | Application in Cancer Biomarker Research |
|---|---|---|
| RNase Decontamination Reagents | To inactivate ubiquitous RNases on surfaces, glassware, and equipment [25]. | Critical for maintaining a sterile workflow, especially when processing multiple patient-derived samples to prevent cross-contamination and sample degradation. |
| RNA Stabilization Reagents (e.g., RNAprotect, PAXgene) | To immediately stabilize RNA at the moment of sample collection by inhibiting RNases [25]. | Vital for preserving the in vivo gene expression profile of clinical specimens (e.g., biopsies, blood) during transport and storage, preventing biomarker degradation. |
| DNase I, RNase-free | To digest contaminating genomic DNA in RNA preparations [24]. | Essential for obtaining accurate qPCR results in biomarker validation, as gDNA contamination can lead to false positive signals and overestimation of transcript levels. |
| Microfluidics Kits (e.g., RNA 6000 Nano Kit) | To perform RNA integrity and quantification analysis on systems like the Agilent Bioanalyzer [23]. | Provides the high-sensitivity analysis needed for low-input samples from core needle biopsies or laser-capture microdissected tissue areas. |
| RNA-Specific Fluorescent Dyes (e.g., Quant-iT RiboGreen) | To enable highly sensitive quantification of RNA concentrations, especially for dilute samples [24]. | Allows for accurate normalization of input RNA in downstream cDNA synthesis, a key requirement for reproducible qPCR data in biomarker assays. |
Best Practices for RNA Handling and Storage
Adherence to strict handling protocols is the first line of defense in preserving RNA integrity.
- Create an RNase-Free Environment: Designate a clean workspace dedicated to RNA use. Regularly decontaminate surfaces with RNase-inactivating reagents. Use single-use, certified RNase-free plasticware [25].
- Practice Aseptic Technique: Always wear gloves and change them frequently. Use filtered pipette tips to prevent aerosol contamination [25].
- Minimize Degradation During Processing: Keep samples on ice whenever possible. Use rapid and effective homogenization methods to quickly inactivate endogenous RNases present in tissues [25].
- Optimize Storage Conditions: For long-term storage, divide RNA into single-use aliquots to avoid repeated freeze-thaw cycles. Store aliquots at -70°C or in stabilization reagents that allow for room-temperature storage for limited periods [25].
In the context of MIQE-guided cancer biomarker research, the assessment of RNA integrity and contamination is a non-negotiable step that underpins all subsequent data. The failure to adequately quality-control starting material introduces an uncontrolled variable that can invalidate the entire experimental outcome. By systematically implementing the methodologies and controls outlined in this guide—employing sensitive integrity checks, verifying purity, utilizing essential reagents correctly, and adhering to rigorous handling protocols—researchers can ensure their qPCR data is a true reflection of the biomarker's expression, thereby contributing to robust, reproducible, and clinically translatable scientific findings.
The accurate quantification of gene expression biomarkers via quantitative PCR (qPCR) is a cornerstone of modern cancer research, enabling discoveries in oncogenesis, metastasis, and therapeutic response. However, the reliability of these findings is fundamentally dependent on the rigorous design and validation of the primer and probe sequences used for detection. Despite the established importance of the Minimum Information for Publication of Quantitative Real-Time PCR Experiments (MIQE) guidelines, compliance remains inconsistent, leading to a troubling prevalence of non-reproducible results in the literature [14]. This technical guide provides a comprehensive framework for the design and validation of primer/probe assays, specifically contextualized within the MIQE 2.0 guidelines for robust cancer biomarker validation. The core thesis is that methodological rigor in assay design is not optional but is a prerequisite for generating clinically translatable data in oncology.
Core Principles of Primer and Probe Design
Sequence Selection for Optimal Specificity and Efficiency
The initial step in assay design involves the careful selection of target sequences for the primers and probe. This process must prioritize transcript-specific detection to ensure that the measured fluorescent signal originates solely from the intended biomarker and not from homologous sequences, pseudogenes, or splice variants [26].
- Target Specificity: The key feature in assay design is the specificity of the assay for the transcript of interest. This is assured by comparing the designed probe and primer sequences against the entire transcriptome using tools like BLAST to verify sequence uniqueness [26].
- Avoiding Genomic DNA Amplification: To prevent false-positive signals from genomic DNA (gDNA) contamination, assays should be designed to span an exon-exon boundary. Ideally, the probe, rather than a primer, should be placed across the junction. This ensures the fluorescent signal is generated only from correctly spliced cDNA templates [26].
- Sequence Purity: The target region should be unambiguous, devoid of known single nucleotide polymorphisms (SNPs), repetitive sequences, or secondary structures that could impede primer binding or probe hybridization [26].
Primer and Probe Design Parameters
Once a unique target location is identified, the following parameters govern the design of efficient primers and probes.
Table 1: Optimal Design Parameters for TaqMan Primer and Probe Sequences
| Component | Parameter | Optimal Value/Range | Rationale |
|---|---|---|---|
| Amplicon | Length | 50–150 base pairs | Promotes efficient amplification and high sensitivity [26]. |
| Genomic Specificity | Span an exon-exon boundary | Prevents amplification of contaminating genomic DNA [26]. | |
| Primers | Length | ~20 bases | Balances specificity and binding efficiency [26]. |
| Melting Temperature (Tm) | 58–60°C | ~10°C lower than the probe Tm for universal cycling conditions [26]. | |
| 3' End Sequence | ≤2 G/C nucleotides in last 5 bases | Prevents non-specific product formation due to stable 3' ends [26]. | |
| GC Content | 30–80% | Ensures appropriate binding stability; avoids extreme values [26]. | |
| Probe | Melting Temperature (Tm) | 68–70°C | Higher than primers to ensure hybridization during primer extension. |
| GC Content | 30–80% | Prevents overly stable or unstable hybridization [26]. | |
| Special Considerations | Avoid runs of ≥4 G nucleotides | Prevents quenching issues and ensures efficient fluorescence [26]. |
- Spatial Arrangement: Forward and reverse primers should be placed as close as possible to the probe-binding site without overlapping the probe sequence. This proximity helps ensure efficient amplification [26].
- Concentration: For a standard TaqMan assay, a concentration of 900 nM for primers and 250 nM for the probe is typically optimal for a highly sensitive reaction [26].
Experimental Protocols for Specificity Testing and Validation
In Silico Specificity Analysis with Primer-BLAST
Before any wet-lab experiment, comprehensive in silico analysis is mandatory to confirm assay specificity.
Protocol: NCBI Primer-BLAST Analysis
- Access the Tool: Navigate to the NCBI Primer-BLAST submission form [27].
- Input Sequences: Enter the target cDNA sequence (in FASTA format or as an accession number) in the "PCR Template" section. Input the forward and reverse primer sequences in the "Primer Parameters" section [27].
- Set Specificity Parameters: In the "Primer Pair Specificity Checking Parameters" section, select the appropriate source organism (e.g., Homo sapiens). Choose the smallest relevant database (e.g., "RefSeq mRNA") to ensure precise results [27].
- Execute and Analyze: Click "Get Primers." The tool will return the predicted amplicon and a detailed report of its specificity, indicating any potential off-target binding to other transcripts or genomic sequences [27].
Empirical Validation and QC Experiments
In silico prediction must be followed by empirical validation to confirm assay performance under actual experimental conditions.
Table 2: Key Experimental Assays for Primer/Probe Validation
| Validation Assay | Experimental Protocol | Interpretation & Success Criteria |
|---|---|---|
| Standard Curve Analysis | Serially dilute (e.g., 1:10) a template with known concentration. Run qPCR in triplicate for each dilution. | Calculate PCR efficiency (E) from the slope: E = 10(-1/slope) - 1. Ideal efficiency is 90–105% (slope of -3.6 to -3.1). R² > 0.99 indicates a precise linear dynamic range [14]. |
| No-Template Control (NTC) | Include a well containing all reaction components except the template (replaced with nuclease-free water). | The absence of amplification or a Cq value >5 cycles later than the sample with the lowest target concentration indicates no reagent contamination. |
| No-Reverse Transcription Control (No-RT) | For RNA samples, perform a control reaction without the reverse transcriptase enzyme. | Confirms that the amplification signal is derived from cDNA and not from contaminating genomic DNA. A significantly delayed or absent Cq is required [26]. |
| Specificity Verification | Analyze the qPCR end-product by gel electrophoresis or, preferably, melt curve analysis. | A single, sharp band on a gel or a single, distinct peak in the melt curve confirms that a single, specific amplicon was generated. |
The Scientist's Toolkit: Essential Research Reagent Solutions
The following table details critical reagents and tools required for the development and execution of validated qPCR assays.
Table 3: Essential Research Reagent Solutions for qPCR Assay Development
| Item | Function/Application |
|---|---|
| Predesigned TaqMan Assays | Off-the-shelf, bioinformatically validated primer/probe sets for well-characterized targets; ensure reproducibility and save development time [26]. |
| Custom Assay Design Services | Bioinformatics-driven services (e.g., Thermo Fisher's Custom Plus) that perform in-silico QC, specificity checks, and optimize sequences for challenging targets [26]. |
| Primer Design Software | Tools like Primer Express software, which are optimized for TaqMan chemistry, automating design based on parameters like Tm and GC content [26]. |
| High-Quality Nucleic Acid Isolation Kits | Kits designed to yield pure, intact RNA/DNA free of contaminants (e.g., salts, phenol, or gDNA) that inhibit PCR, a critical factor often overlooked [14]. |
| DNase I, RNase-free | Enzyme used to remove contaminating genomic DNA from RNA samples prior to reverse transcription, crucial for accurate gene expression analysis [26]. |
| Highly Active Reverse Transcriptase | Enzyme for synthesizing cDNA from RNA templates; high efficiency and consistency are vital for quantitative accuracy [14]. |
Workflow for MIQE-Compliant Assay Design and Application
The following diagram illustrates the integrated workflow from initial assay design to final application in cancer biomarker validation, highlighting critical checkpoints aligned with MIQE 2.0 guidelines.
Adherence to MIQE 2.0 in Cancer Biomarker Research
The MIQE 2.0 guidelines provide an authoritative framework to remedy widespread deficiencies in qPCR-based research, which are particularly critical in the context of cancer biomarker validation [14]. Adherence to these guidelines is non-negotiable for generating clinically relevant data.
- Confronting Complacency: A persistent complacency surrounds qPCR, where techniques like high-throughput sequencing are subjected to intense scrutiny, while qPCR often escapes serious review. This leads to fundamental methodological failures, such as reporting small fold-changes (1.2- to 1.5-fold) as biologically meaningful without assessing measurement uncertainty, using unvalidated reference genes for normalization, and assuming rather than measuring assay efficiencies [14].
- Consequences in Diagnostics: In molecular diagnostics, a platform that cannot reliably distinguish small fold-changes in target concentration at clinically relevant levels is not fit for purpose. Flawed diagnostics underpinning decisions about disease containment or treatment have real-world consequences measured in lives, not p-values [14].
- A Call for Cultural Change: Ensuring robust, reproducible, and reliable qPCR results requires cultural change among researchers, reviewers, and journal editors. QC must be recognized as a shared responsibility. The purpose of scientific communication is not speed, but clarity, reliability, and truth. If data cannot be reproduced, they are not worth publishing [14].
Within the framework of cancer biomarker validation, reverse transcription-quantitative PCR (RT-qPCR) serves as a cornerstone technique for quantifying gene expression signatures. The reliability of this data is paramount, as it directly influences diagnostic, prognostic, and therapeutic decisions. The MIQE guidelines (Minimum Information for Publication of Quantitative Real-Time PCR Experiments) have been established to ensure the integrity, transparency, and reproducibility of RT-qPCR data [11] [28]. Adherence to these guidelines is non-negotiable in rigorous biomarker research, as they provide a blueprint for controlling technical variability and generating biologically meaningful results. This guide details the critical considerations for optimizing reverse transcription efficiency and implementing robust controls, specifically within the context of MIQE-compliant cancer biomarker research.
RNA Template Quality and Integrity
The fidelity of any RT-qPCR experiment is fundamentally dependent on the quality of the starting RNA material. For cancer biomarkers, which may be expressed at low levels or derived from suboptimal samples like formalin-fixed, paraffin-embedded (FFPE) tissues, uncompromised RNA quality is critical.
RNA Quality Assessment (QC)
A comprehensive QC protocol is the first step in a MIQE-compliant workflow. The table below summarizes the key methods and their target metrics [29].
Table 1: Methods for Assessing RNA Quality and Quantity
| Method | Parameter Measured | Target Values for High-Quality RNA | Notes |
|---|---|---|---|
| UV Spectrophotometry | Nucleic Acid Quantity (A260) | A260 ≈ 0.1–1.0 | Not specific to RNA; assesses total nucleic acids. |
| Purity Ratios | A260/A280 ≈ 2.0; A260/A230 > 1.8 | Low A260/A280 suggests protein contamination; low A260/A230 suggests organic compound contamination. | |
| Fluorometric Assay (e.g., Qubit) | RNA Quantity | N/A | More accurate than UV; uses dyes selective for RNA [29]. |
| Gel Electrophoresis | RNA Integrity | 28S:18S rRNA ratio ≈ 2:1 | Visual assessment of ribosomal RNA bands. |
| Microfluidics (e.g., Bioanalyzer) | RNA Integrity (RIN) | RIN 8–10 | Automated, digital output. A high RIN indicates intact RNA [29]. |
Genomic DNA Removal
Trace amounts of genomic DNA (gDNA) can cause false-positive signals and high background, severely compromising biomarker data. DNase I treatment is widely recommended to eliminate gDNA contamination [29]. However, traditional DNase I protocols require careful inactivation (e.g., with EDTA and heat), which can lead to RNA degradation or sample loss. A superior alternative is the use of double-strand-specific DNases (e.g., ezDNase Enzyme), which efficiently remove gDNA without damaging single-stranded RNA or cDNA. These enzymes can be inactivated with a brief, mild heat treatment (e.g., 55°C), streamlining the workflow and better preserving RNA integrity [29].
Optimizing Reverse Transcription Efficiency
The conversion of RNA to cDNA is a potential source of significant technical variation. Maximizing the efficiency and fidelity of this step is crucial for accurate biomarker quantification.
Reverse Transcriptase Selection
The choice of reverse transcriptase profoundly impacts the ability to synthesize cDNA from challenging targets, such as long transcripts, GC-rich regions, or RNAs with extensive secondary structure—common features in cancer transcriptomes.
Table 2: Properties of Common Reverse Transcriptases
| Property | AMV Reverse Transcriptase | MMLV Reverse Transcriptase | Engineered MMLV (e.g., SuperScript IV) |
|---|---|---|---|
| RNase H Activity | High | Medium | Low |
| Reaction Temperature | 42°C | 37°C | 55°C |
| Reaction Time | 60 min | 60 min | 10 min |
| Target Length | ≤5 kb | ≤7 kb | ≤12 kb |
| Yield with Challenging RNA | Medium | Low | High |
Engineered MMLV reverse transcriptases (e.g., SuperScript IV) are generally preferred for biomarker research. Their reduced RNase H activity increases cDNA yield and length, while their higher reaction temperature (up to 55°C) helps denature RNA secondary structure, leading to more efficient synthesis and a better representation of the entire RNA population [29].
Primer Selection Strategy
The primer used for reverse transcription dictates which RNA species are converted to cDNA and can introduce bias. The selection must align with the experimental goals and the nature of the target biomarkers.
- Oligo(dT) Primers: These primers anneal to the poly(A) tails of eukaryotic mRNA, making them ideal for synthesizing cDNA focused on protein-coding genes. They are suitable for constructing cDNA libraries and 3' RACE. However, they are not suitable for degraded RNA (e.g., from FFPE samples) or for RNAs lacking a poly(A) tail (e.g., some non-coding RNAs), and they can exhibit 3' end bias [29].
- Random Hexamers: These primers anneal to RNA at random sequences, enabling the reverse transcription of virtually all RNA species, including non-polyadenylated RNAs, ribosomal RNA, and degraded RNA. This makes them valuable for FFPE-derived samples. A drawback is that they can produce shorter cDNA fragments and may overestimate mRNA copy number [29].
- Gene-Specific Primers: These primers offer the highest specificity by targeting a particular RNA sequence of interest. They are highly efficient for quantifying a single or a few pre-defined biomarkers but are impractical for genome-wide expression studies [29].
For comprehensive biomarker panels, a mixture of oligo(dT) and random hexamers is often employed to balance specificity and genome-wide coverage while mitigating the limitations of each primer type used alone.
Figure 1: Reverse transcription primer selection workflow. The choice of primer directly determines the RNA species converted to cDNA and influences the optimal application for the resulting product.
Critical Controls for Reliable Data
Implementing a rigorous system of controls is essential to distinguish technical artifacts from true biological signal, a core requirement of the MIQE guidelines.
The Necessity of Multiple Reference Genes
Normalization to stable reference genes is the most common method to control for technical variation in RNA input, quality, and reverse transcription efficiency. The historical use of a single "housekeeping" gene is strongly discouraged by the MIQE guidelines, as no single gene is universally stable across all biological contexts, especially in dynamic environments like cancer [28]. Using an inappropriate reference gene can generate misleading results.
The MIQE guidelines mandate the use of multiple reference genes (at least two, but often three or more) whose expression stability has been validated under the specific experimental conditions of the study [11] [28]. A normalization factor (NF) should be calculated as the geometric mean of the expression levels of these validated reference genes [28].
Validation of Reference Genes
The process for selecting and validating reference genes is methodical and must be performed for each new experimental system or condition.
- Candidate Selection: Identify 8-10 candidate genes from literature, transcriptome databases, or different functional classes to avoid coregulation [28].
- Experimental Validation: Amplify these candidates from the same set of cDNA samples used for the genes of interest.
- Stability Analysis: Use specialized algorithms (e.g., geNorm, NormFinder, BestKeeper) to rank the candidates based on their expression stability. geNorm provides an M value, where a lower M value indicates greater stability. An M value below 1.0 is typically acceptable, but aiming for M < 0.5 is ideal for sensitive applications like biomarker validation [28].
- Determining the Number of Genes: The same software can determine the optimal number of reference genes. A pairwise variation (V) value below 0.15 indicates that adding another reference gene is not necessary.
- Revalidation: The selected reference genes must be revalidated in every subsequent experiment to ensure their stability holds.
Figure 2: Workflow for the validation of reference genes. This iterative process is critical for ensuring accurate normalization in RT-qPCR experiments, as mandated by MIQE guidelines.
Validation Checkpoints and Criteria
The table below outlines key checkpoints for validating reference gene performance, aligning with MIQE recommendations [28].
Table 3: Checkpoints and Criteria for Reference Gene Validation
| Checkpoint | Criteria | Implication of Failure |
|---|---|---|
| qPCR Efficiency | Efficiency (E) ≥ 1.8 with standard error ≤ 5%. Determined from a dilution curve. | Inaccurate quantification; data cannot be reliably compared between assays. |
| geNorm Analysis | M value < 1.0 (ideal: M < 0.5). Pairwise variation (V) < 0.15. | Chosen reference genes are not stable enough, introducing normalization errors. |
| Coefficient of Variation (CV) | CV of Normalized Relative Quantities (NRQs) < 0.25 (homogeneous panels) or < 0.5 (heterogeneous panels). | High variability indicates instability across sample groups. |
| Visualize Normalization Factors (NFs) | All sample NFs should be > 0.3 when the highest NF is set to 1. | Low NF for a sample suggests a technical problem (e.g., PCR inhibition). |
The Scientist's Toolkit: Essential Reagents and Materials
The following table details key reagents and their critical functions in establishing a robust reverse transcription workflow for biomarker validation.
Table 4: Essential Research Reagents for Reverse Transcription
| Reagent / Material | Function | Technical Considerations |
|---|---|---|
| RNase Inhibitors | Protects RNA templates from degradation by RNases during isolation and RT setup. | Essential for working with low-abundance targets or low-input samples. |
| High-Quality Reverse Transcriptase | Enzyme that catalyzes the synthesis of cDNA from an RNA template. | Select for high thermal stability, low RNase H activity, and high processivity (e.g., SuperScript IV) [29]. |
| DNase I (or dsDNase) | Removes contaminating genomic DNA to prevent false-positive results in subsequent qPCR. | Double-strand-specific DNases offer a faster, gentler workflow with less risk to RNA integrity [29]. |
| Nuclease-Free Water | Solvent for preparing reagents and reactions. | Guaranteed to be free of nucleases that could degrade RNA or DNA templates. |
| Validated Reference Genes | Set of genes used to normalize RT-qPCR data for technical variation. | Must be empirically validated for stability in the specific experimental system; never assume stability [28]. |
| Fluorometric QC Kits | Accurately quantifies RNA concentration and assesses integrity. | More specific for RNA than UV spectrophotometry (e.g., Qubit RNA IQ Assay) [29]. |
In the high-stakes field of cancer biomarker validation, the reliability of gene expression data generated by RT-qPCR is non-negotiable. This reliability is built upon a foundation of meticulous attention to reverse transcription efficiency and the stringent implementation of controls. This involves rigorous RNA QC, strategic selection of reverse transcriptase and primers, and, most critically, the MIQE-compliant use of validated reference genes for normalization. By adhering to these principles, researchers and drug development professionals can ensure their findings are accurate, reproducible, and capable of withstanding the scrutiny required to translate a potential biomarker from the laboratory to the clinic.
In the field of cancer research, quantitative real-time PCR (RT-qPCR) has established itself as a cornerstone technology for validating gene expression signatures, biomarker discovery, and molecular diagnostics. Its unparalleled sensitivity, specificity, and reproducibility make it indispensable for quantifying transcriptional biomarkers across diverse sample types, including tissue specimens, cell lines, and liquid biopsies [12]. However, the accuracy of this technique is profoundly dependent on appropriate normalization strategies to control for technical variations introduced during sample processing, RNA extraction, reverse transcription, and PCR amplification.
Normalization to endogenous reference genes, often called housekeeping genes, remains the most common method for relative quantification in RT-qPCR experiments. The fundamental assumption is that these genes are constitutively expressed at constant levels across all samples and experimental conditions. Yet, a substantial body of evidence now confirms that this assumption is frequently invalid, particularly in the context of cancer biology [30] [31]. Tumorigenesis involves widespread reprogramming of cellular metabolism and architecture, which can dramatically alter the expression of commonly used reference genes such as GAPDH and ACTB. Their expression variability can introduce significant bias, leading to inaccurate quantification, false conclusions, and ultimately, reduced reproducibility of cancer research findings.
Adherence to the MIQE (Minimum Information for Publication of Quantitative Real-Time PCR Experiments) guidelines is no longer merely a recommendation but a necessity for ensuring the validity of gene expression data in cancer studies [1] [12]. The recently published MIQE 2.0 guidelines reinforce the critical message that without methodological rigor, qPCR data cannot be trusted [1]. This technical guide outlines a framework for the validation of reference genes within the MIQE framework, providing cancer researchers with robust strategies to enhance the reliability of their gene expression data.
The MIQE Framework: Ensuring Analytical Validity
The MIQE guidelines provide a comprehensive set of recommendations covering every aspect of the RT-qPCR workflow, from sample handling and nucleic acid extraction to assay validation and data reporting. Their primary goal is to establish a standard for methodological transparency and analytical rigor that ensures the generation of reproducible and biologically meaningful data [1] [12].
A core principle of MIQE is that the reference genes used for normalization must be properly validated for the specific experimental context. This is not an optional step. As underscored by recent commentaries, widespread complacency surrounds qPCR, with many studies continuing to use reference genes that are neither stable nor validated, representing a fundamental methodological failure [1]. The consequences are measurable: exaggerated sensitivity claims in diagnostic assays and overinterpreted fold-changes in gene expression studies. In molecular diagnostics, where qPCR is used to infer pathogen load, expression status, or treatment response, such failures are unacceptable [1].
MIQE 2.0 emphasizes that normalization against a single reference gene is rarely sufficient unless clear evidence of its uniform expression is provided [30]. Instead, the use of multiple, stably expressed reference genes is strongly advocated. The guidelines also stress the need for full transparency in reporting, including primer sequences, RNA quality metrics (e.g., RIN or RQI values), reverse transcription conditions, amplification efficiencies, and the method used for stability analysis [1] [16] [12]. This level of detail is essential for other researchers to evaluate and replicate the work, thereby strengthening the entire field of cancer biomarker research.
Experimental Design for Reference Gene Validation
Selection of Candidate Reference Genes
The first step in a validation workflow is the selection of a panel of candidate reference genes. This panel should include both traditional housekeeping genes and genes previously identified as stable in similar biological systems.
Table 1: Common Candidate Reference Genes and Their Functions
| Gene Symbol | Official Full Name | Cellular Function | Reported Stability in Cancer |
|---|---|---|---|
| ACTB | β-actin | Cytoskeletal structural protein | Highly variable in many cancers and under drug treatment [32] [33] |
| GAPDH | Glyceraldehyde-3-phosphate dehydrogenase | Glycolytic enzyme | Often variable; stability is cell line and condition-dependent [30] [31] |
| B2M | β-2-microglobulin | Component of MHC class I complexes | Stable in some contexts (e.g., A549 under mTOR inhibition) [32] [34] |
| YWHAZ | Tyrosine 3-monooxygenase | Signaling protein adapter | Stable in A549 cells under mTOR inhibition [32] |
| TBP | TATA-box binding protein | Transcription initiation factor | Variable stability; requires validation [34] [35] |
| PPIA | Peptidylprolyl isomerase A | Protein folding | Stable in some breast cancer cell lines and tissues [34] [35] |
| RPLP0 | Ribosomal protein, large, P0 | Ribosomal protein | Variable; can be affected by cellular growth status [31] |
| 18S rRNA | 18S ribosomal RNA | Ribosomal RNA component | Often highly abundant but can be stable (e.g., in NSCLC) [31] |
| POLR2A | RNA polymerase II subunit A | DNA transcription | Identified as highly stable in NSCLC [31] |
| PUM1 | Pumilio RNA-binding family member 1 | Post-transcriptional regulator | Stable across diverse cancer and normal cell lines [33] |
| HNRNPL | Heterogeneous Nuclear Ribonucleoprotein L | mRNA processing | Stable across diverse cancer and normal cell lines [33] |
Sample Preparation and RNA Quality Control
Robust validation requires analyzing candidate genes across the entire spectrum of biological conditions that will be encountered in the subsequent study. This includes different cancer cell lines, tumor subtypes, treatment conditions, and time points. For instance, a study on non-small cell lung cancer (NSCLC) validated reference genes using 18 paired normal and tumor lung snap-frozen specimens [31].
RNA integrity is paramount. The quality of the starting RNA template is a major determinant of RT-qPCR performance. Key steps include:
- RNA Extraction: Use of standardized kits (e.g., RNeasy Kit, TRIzol reagent) with on-column DNase I treatment to eliminate genomic DNA contamination [34] [31].
- Quality Assessment: Quantification of RNA concentration and purity using spectrophotometry (A260/280 ratio ~2.0, A260/230 >2.0). Assessment of RNA integrity using automated electrophoresis systems (e.g., Agilent Bioanalyzer) to generate an RNA Integrity Number (RIN) or RQI is highly recommended [16] [12]. High-quality RNA should display distinct 18S and 28S ribosomal bands without signs of degradation.
- Reverse Transcription: Consistent cDNA synthesis is critical. The use of optimized reverse transcription kits (e.g., Maxima First Strand cDNA Synthesis Kit, High-Capacity cDNA Archive Kit) with random hexamers is common [33] [31]. The input RNA amount should be within the linear range of the RT reaction (typically 100-800 ng) [33].
qPCR Assay Optimization and Validation
Each primer pair used for amplifying candidate reference genes must be rigorously validated.
- Primer Design: Primers should be designed to be exon-spanning or exon-flanking to avoid amplification of genomic DNA. Amplicon lengths are typically kept between 70-200 bp for optimal efficiency [33].
- Specificity and Efficiency: PCR amplification efficiency should be determined using a standard curve of serial cDNA dilutions. The efficiency (E) should be between 90-110%, with a correlation coefficient (R²) >0.990 [12]. Specificity is confirmed by melt curve analysis, which should yield a single sharp peak [33].
- Experimental Replication: Experiments must include a minimum of three biological replicates per condition and technical replicates (e.g., triplicate reactions) to account for both biological and technical variance [30].
Stability Analysis: Algorithms and Data Interpretation
Once Cq (quantification cycle) values are obtained for all candidate genes across all samples, their expression stability is evaluated using dedicated algorithms. Relying on a single algorithm is not recommended; using multiple methods provides a more robust assessment.
- geNorm: This algorithm calculates a stability measure (M) for each gene based on the average pairwise variation with all other candidate genes. Genes with the lowest M values are the most stable. geNorm also determines the optimal number of reference genes by calculating the pairwise variation (V) between sequential normalization factors. A V-value below 0.15 indicates that no additional reference genes are needed [34] [35].
- NormFinder: This method estimates intra- and inter-group variation and provides a stability value, considering sample subgroups. It is particularly useful when comparing distinct groups, such as tumor vs. normal tissue [35] [31].
- BestKeeper: Based on the geometric mean of the Cq values, BestKeeper calculates standard deviation (SD) and coefficient of variation (CV). Genes with the lowest SD and CV values are considered the most stable [34] [35].
- Comparative ΔCq Method: This approach compares relative expression of all possible pairs of genes within each sample. The gene with the least variation in ΔCq across all samples is the most stable [33].
- RefFinder: This web-based tool integrates the results from geNorm, NormFinder, BestKeeper, and the comparative ΔCq method to generate a comprehensive final ranking [35].
The following workflow diagram summarizes the key steps in the reference gene validation process:
Cancer-Type Specific Reference Gene Recommendations
Stability analysis across numerous studies has consistently demonstrated that optimal reference genes are highly specific to the cancer type, cell line, and even experimental conditions. The tables below summarize findings from key cancer models.
Table 2: Validated Reference Genes by Cancer Type or Model
| Cancer Type / Model | Most Stable Reference Genes | Genes to Avoid | Key Experimental Condition |
|---|---|---|---|
| Non-Small Cell Lung Cancer (NSCLC) [31] | POLR2A, rRNA18S, YAP1, ESD | ACTB, GAPDH | Tumor vs. normal tissue profiling |
| Breast Cancer (MCF-7) [30] | GAPDH, CCSER2, PCBP1 | ACTB, PGK1 (as single controls) | Sub-clones over multiple passages & nutrient stress |
| Breast Cancer (Multiple Cell Lines) [35] | 18S rRNA-ACTB, HSPCB-ACTB | Varies by subtype | Across basal and ER+ cell lines; post-transfection |
| Dormant Cancer Cells [32] | B2M, YWHAZ (A549); TUBA1A, GAPDH (T98G) | ACTB, RPS23, RPS18, RPL13A | Treatment with mTOR inhibitor AZD8055 |
| Tongue Carcinoma [34] | ALAS1, GUSB, RPL29 (cell line + tissue) | Varies by sample type | Cell lines (Tca-8113, CAL-27) and tissue samples |
| Pan-Cancer & Normal Cell Lines [33] | IPO8, PUM1, HNRNPL, SNW1, CNOT4 | ACTB, GAPDH | 13 cancer & 7 normal cell lines; serum starvation |
Critical Findings from Cancer Studies
- Breast Cancer Heterogeneity: A comprehensive analysis of the MCF-7 breast cancer cell line revealed significant differential expression of reference genes within sub-clones cultured identically over multiple passages [30]. This highlights that even within a single cell line, genetic drift can alter gene expression stability, necessitating validation for each laboratory's specific culture.
- Impact of Transfection: In breast cancer cell lines, the stability ranking of reference genes fluctuated significantly after transient transfection with different reagents (Lipofectamine 2000 and X-tremeGENE HP) [35]. This underscores the necessity to validate reference genes under the exact experimental conditions of the study, including transfection.
- Dormancy and Metabolic Stress: Treatment of cancer cells with the dual mTOR inhibitor AZD8055 to induce dormancy caused dramatic changes in the expression of ACTB and ribosomal proteins (RPS23, RPS18, RPL13A), rendering them "categorically inappropriate" for normalization under these conditions [32]. This demonstrates how therapeutic interventions that rewire basic cellular functions can destabilize commonly used reference genes.
Table 3: Key Research Reagent Solutions for Reference Gene Validation
| Reagent / Resource | Function / Application | Example Products / Kits |
|---|---|---|
| RNA Extraction Kit | Isolation of high-quality, DNA-free total RNA | RNeasy Mini Kit (Qiagen), TRIzol Reagent (Invitrogen) |
| DNase I Treatment | Removal of genomic DNA contamination to prevent false positives | RNase-Free DNase Set (Qiagen) |
| cDNA Synthesis Kit | High-efficiency reverse transcription of RNA to cDNA | High-Capacity cDNA Reverse Transcription Kit (Applied Biosystems), Maxima First Strand cDNA Synthesis Kit (Thermo Fisher) |
| qPCR Master Mix | Optimized buffer, enzymes, and dyes for quantitative PCR | 2xSG Fast qPCR Master Mix (Sangon), TaqMan Universal PCR Master Mix (Applied Biosystems) |
| Pre-Designed Assays | Validated primer-probe sets for specific genes | TaqMan "Assay on Demand" (Applied Biosystems) |
| RNA Quality Analyzer | Assessment of RNA integrity and quantification | Agilent 2100 Bioanalyzer (Agilent Technologies) |
| qPCR Instrument | Real-time fluorescence detection and thermal cycling | Roche LightCycler 480 (Roche), ABI PRISM 7900HT (Applied Biosystems) |
| Stability Analysis Software | Algorithms for reference gene ranking | geNorm, NormFinder, BestKeeper, RefFinder (web tool) |
The validation of reference genes is not a peripheral activity but a foundational component of rigorous gene expression analysis in cancer research. As the field moves toward more complex models, including liquid biopsies and analysis of extracellular vesicles (EVs), the principles of MIQE-compliant normalization become even more critical [16] [12]. The integration of domain-specific guidelines, such as MISEV for EV research, with the general analytical rigor of MIQE, provides a scalable blueprint for improving reproducibility in molecular diagnostics [16].
The evidence is clear: commonly used reference genes like GAPDH and ACTB are often unstable in cancer contexts and their use without prior validation risks generating misleading data. By adopting a systematic workflow for reference gene selection, validation, and implementation—as outlined in this guide—researchers can significantly enhance the accuracy, reproducibility, and translational potential of their cancer gene expression studies.
Quantitative PCR (qPCR) is a cornerstone technique in molecular biology, playing a critical role in the validation of cancer biomarkers, particularly those derived from liquid biopsies such as circulating tumor DNA (ctDNA). The accuracy and reliability of these experiments are paramount, as they directly impact diagnostic and therapeutic decisions. The Minimum Information for Publication of Quantitative Real-Time PCR Experiments (MIQE) guidelines provide a standardized framework to ensure reproducibility and credibility of qPCR results [3]. These guidelines establish rigorous standards for experimental design, execution, and reporting, giving researchers the tools to comprehensively document all aspects of their qPCR experiments from sample preparation to data analysis.
Recent advancements have led to the development of MIQE 2.0, which reflects ongoing technological evolution in qPCR methodology [2]. These revised guidelines address new reagents, methods, and instruments, offering updated recommendations for sample handling, assay design, validation, and data analysis tailored to contemporary applications. For cancer biomarker research, adherence to these principles is especially crucial when working with challenging sample types like liquid biopsies, where target molecules may be present at extremely low concentrations amidst complex biological backgrounds [8]. This technical guide provides a comprehensive framework for transforming raw quantification cycle (Cq) values into biologically meaningful interpretations within the context of MIQE-compliant cancer biomarker validation.
Pre-Analysis Phase: Experimental Design and Assay Validation
Sample Considerations for Liquid Biopsies
The choice of liquid biopsy source significantly influences qPCR data quality and interpretation. Blood-based liquid biopsies, particularly plasma, are frequently used due to their systemic nature and minimal invasiveness [8]. However, the high dilution of tumor-derived signals within total blood volume presents substantial detection challenges. For urological cancers, urine often provides higher biomarker concentration and reduced background noise, while bile offers advantages for biliary tract cancers, and cerebrospinal fluid for central nervous system malignancies [8].
Key sample considerations:
- Sample Quality: DNA methylation biomarkers offer advantages in liquid biopsy analysis due to their enhanced resistance to degradation during sample collection, storage, and processing compared to more labile molecules like RNA [8].
- ctDNA Fraction: Biomarker sensitivity is limited not by total cell-free DNA (cfDNA) abundance but by the proportion of ctDNA present. Low ctDNA fractions, common in early-stage disease, decrease detection robustness [8].
- Sample Processing: Plasma is generally preferred over serum for blood-based analyses as it is enriched for ctDNA and has less contamination of genomic DNA from lysed cells [8].
MIQE-Compliant Assay Design
Proper assay design is fundamental to generating reliable qPCR data. For predesigned assays such as TaqMan assays, MIQE guidelines recommend providing either a unique assay identifier or the probe/amplicon context sequence [3]. Thermo Fisher Scientific provides a comprehensive Assay Information File (AIF) for each assay that contains the required context sequence, facilitating MIQE compliance [3].
Critical validation experiments:
- Efficiency Determination: Perform standard curves with at least 5 points (1:5 serial dilutions) in triplicate.
- Specificity Assessment: Verify single amplification products through melt curve analysis or gel electrophoresis.
- Dynamic Range Evaluation: Establish the range of template concentrations that yield precise and accurate results.
- Limit of Detection (LOD) and Limit of Quantification (LOQ): Determine the lowest concentration that can be reliably detected and quantified.
Table 1: Essential MIQE-Compliant Assay Information
| Parameter | Requirement | Example |
|---|---|---|
| Assay Identification | Unique assay ID or context sequence | TaqMan Assay ID or amplicon context sequence |
| Amplicon Length | Specific base pairs | 101 bp |
| Location | Probe/genomic coordinates | 1026-1048 |
| Efficiency | 90-110% with R² > 0.990 | 98% with R² = 0.998 |
| Dynamic Range | At least 5 orders of magnitude | 10⁵ - 10¹ copies |
| LOD/LOQ | Experimentally determined | LOD: 5 copies, LOQ: 20 copies |
From Raw Cq to Reliable Quantification
Understanding Cq Values and Quality Assessment
The quantification cycle (Cq) represents the PCR cycle at which the fluorescence signal exceeds the background threshold. According to MIQE 2.0 guidelines, Cq values should be converted into efficiency-corrected target quantities and reported with prediction intervals [2]. Before any analysis, rigorous quality assessment of raw Cq values is essential:
- Technical Replicates: Assess variability between replicate reactions (typically CV < 5%).
- Amplification Efficiency: Calculate from standard curves using the formula: Efficiency = [10^(-1/slope) - 1] × 100%.
- Amplification Curves: Inspect for abnormal shapes that may indicate inhibition or primer-dimer formation.
- Negative Controls: Confirm absence of amplification in no-template controls (NTCs).
Baseline and Threshold Determination
Proper setting of baseline and threshold significantly impacts Cq values. The baseline should encompass cycles where amplification remains at background levels, typically cycles 3-15. The threshold should be set in the exponential phase of amplification above background but within the linear dynamic range of the instrument. Consistent application of these parameters across all samples in an experiment is critical for valid comparisons.
Efficiency Correction and Outlier Management
A critical advancement in MIQE 2.0 is the emphasis on converting Cq values into efficiency-corrected target quantities [2]. The classic ΔΔCq method assumes perfect amplification efficiency (100%) for all assays, which rarely occurs in practice. Implement efficiency-corrected relative quantification using the formula:
Relative Quantity (RQ) = (Etarget)^(-ΔCqtarget) / (Eref)^(-ΔCqref)
Where E represents amplification efficiency (typically 1.8-2.0) and ΔCq represents the difference between sample and calibrator Cq values.
For outlier management, establish predefined criteria for excluding data points, such as:
- Technical replicates with CV > 5%
- Amplification efficiency outside 90-110%
- Samples with irregular amplification curves
- Contaminated negative controls
Normalization Strategies for Cancer Biomarkers
Reference Target Selection
Effective normalization is crucial for accurate biological interpretation, particularly in cancer biomarker studies where sample input and quality may vary significantly. The MIQE guidelines emphasize the importance of appropriate normalization to account for technical variability [3].
Reference target options:
- Reference Genes: Traditionally used endogenous controls (e.g., GAPDH, ACTB, B2M) must be validated for stability in each experimental system.
- DNA Quantification: Prior to amplification, particularly useful when working with limited samples like liquid biopsies.
- Spiked Synthetic Controls: Known quantities of non-native sequences added to samples during extraction, especially valuable for ctDNA analysis.
- Total DNA Mass: Measurement of total input DNA, though less precise for low-concentration targets.
Validation of Reference Targets
Reference targets must be rigorously validated for each experimental condition:
- Stability Analysis: Use algorithms like geNorm, NormFinder, or BestKeeper to assess expression stability across sample sets.
- Expression Level: Match expression abundance to target genes to avoid efficiency differences at different amplification stages.
- Biological Validation: Confirm that reference targets are unaffected by experimental conditions or pathological status.
Table 2: Comparison of Normalization Approaches for Liquid Biopsy qPCR
| Method | Advantages | Limitations | Best Applications |
|---|---|---|---|
| Reference Genes | No additional cost, easy implementation | Stability varies by sample type, may be affected by pathology | Samples with consistent cellular composition |
| Spiked Controls | Accounts for extraction/amplification efficiency, highly reproducible | Requires additional synthetic oligonucleotides, optimization needed | Liquid biopsies, low-input samples, ctDNA analysis |
| DNA Quantification | Direct measurement, simple interpretation | Does not account for amplification inhibitors, less precise | High-quality, high-quantity DNA samples |
| Total Mass | Simple, no additional assays | Insensitive to sample quality variations, least precise | Preliminary studies, high-abundance targets |
Advanced Analysis and Statistical Considerations
Statistical Framework for qPCR Data
qPCR data requires specialized statistical approaches due to its logarithmic nature and experimental variability. MIQE 2.0 recommends reporting detection limits and dynamic ranges for each target, along with prediction intervals for quantitative results [2].
Key statistical practices:
- Data Transformation: Apply logarithmic transformation to normalized quantities before parametric statistical tests.
- Error Propagation: Account for uncertainties in both target and reference gene measurements.
- Multiple Testing Corrections: Apply appropriate corrections (e.g., Bonferroni, Benjamini-Hochberg) when making multiple comparisons.
- Confidence Intervals: Report 95% confidence intervals for relative expression ratios rather than point estimates.
Experimental Design Considerations
Robust experimental design significantly enhances data reliability:
- Randomization: Process samples in random order to avoid batch effects.
- Blinding: When possible, perform sample processing and data analysis blinded to experimental groups.
- Replication: Include both technical replicates (same RNA/DNA) and biological replicates (different specimens).
- Power Analysis: Conduct prior to experimentation to determine appropriate sample sizes.
Biological Interpretation in Cancer Context
From Quantitative Data to Biological Meaning
Translating normalized qPCR data into meaningful biological insights requires contextualization within cancer biology. For DNA methylation biomarkers in liquid biopsies, consider:
- Clinical Correlations: Associate quantitative methylation levels with clinical parameters (tumor stage, grade, treatment response).
- Biological Pathways: Interpret results in context of affected pathways (tumor suppression, DNA repair, metastasis).
- Diagnostic Performance: Calculate sensitivity, specificity, and area under the curve (AUC) for classification accuracy.
- Threshold Determination: Establish clinically relevant cut-off values using ROC curve analysis or similar methods.
Integration with Complementary Data
Enhance biological interpretation by integrating qPCR findings with other data types:
- Genomic Data: Correlate with mutation status, copy number variations, or other genomic alterations.
- Clinical Data: Associate with patient demographics, treatment history, and outcomes.
- Imaging Findings: Correlate molecular biomarkers with radiological assessments.
- Histopathological Data: Connect liquid biopsy findings with tissue-based diagnostics.
MIQE-Compliant Reporting Framework
Essential Reporting Elements
Comprehensive reporting is fundamental to MIQE compliance and scientific transparency. Ensure publications include:
Sample Information:
- Sample type, origin, and processing details
- Storage conditions and duration
- Nucleic acid extraction method and quality assessment
Assay Details:
- Primer and probe sequences or assay identifiers
- Amplicon context sequences and genomic locations
- Validation data (efficiency, dynamic range, LOD/LOQ)
Experimental Protocol:
- Complete reaction conditions (volumes, concentrations)
- Instrument details and cycling conditions
- Data acquisition and analysis settings
Data Analysis Methods:
- Normalization strategy with justification
- Statistical methods and software used
- Outlier identification and handling procedures
The Scientist's Toolkit: Essential Reagents and Materials
Table 3: Research Reagent Solutions for qPCR Cancer Biomarker Studies
| Reagent/Material | Function | Considerations for Cancer Biomarkers |
|---|---|---|
| Nucleic Acid Extraction Kits | Isolation of high-quality DNA/RNA from various sample types | Optimized for low-input samples (liquid biopsies); preserve methylation status |
| Bisulfite Conversion Kits | Chemical conversion of unmethylated cytosines to uracils for methylation analysis | Conversion efficiency >95%; minimal DNA fragmentation |
| qPCR Master Mixes | Provide enzymes, buffers, nucleotides for amplification | Optimized for bisulfite-converted DNA; inhibitor-resistant |
| TaqMan Assays | Sequence-specific primers and probes for targeted detection | Predesigned assays with MIQE-compliant documentation |
| Reference Assays | Endogenous controls for normalization | Validated for stability in specific sample matrix |
| Synthetic Controls | External standards for quantification and process control | Non-homologous to any natural sequence |
| Methylation Standards | Controls with defined methylation status | Fully methylated and unmethylated DNA for standard curves |
| Quality Control Assays | Assess sample quality and potential inhibition | DNA quantification, degradation assessment |
The journey from raw Cq values to biological interpretation in cancer biomarker research requires meticulous attention to each analytical step, guided by MIQE principles. By implementing rigorous quality control, appropriate normalization strategies, efficiency-corrected calculations, and comprehensive reporting, researchers can transform quantitative PCR data into reliable, biologically meaningful insights. As qPCR technology continues to evolve, with emerging applications in liquid biopsy-based cancer detection and monitoring, adherence to these standardized approaches ensures the generation of robust, reproducible data that advances both scientific knowledge and clinical applications.
Liquid biopsy approaches, particularly those analyzing circulating microRNAs (miRNAs) and extracellular vesicle-derived RNAs (EV-RNAs), have emerged as powerful tools for minimally invasive cancer biomarker discovery. These nucleic acids, protected from degradation by their association with vesicles or protein complexes, offer a window into the physiological and pathological state of tissues throughout the body. However, the promise of these biomarkers is tempered by significant challenges in reproducibility and technical validation. Variability in pre-analytical sample processing, nucleic acid isolation, and analytical measurement can compromise data integrity, leading to inconsistent findings across studies [16] [36].
Within this context, the Minimum Information for Publication of Quantitative Real-Time PCR Experiments (MIQE) guidelines provide an essential framework for ensuring analytical validity in reverse transcription quantitative PCR (RT-qPCR), the primary technology for biomarker validation. This technical guide explores the application of MIQE principles to liquid biopsy research, with a specific focus on circulating miRNA and EV-RNA biomarkers in oncology. By integrating MIQE with domain-specific standards such as the Minimal Information for Studies of Extracellular Vesicles (MISEV), researchers can establish robust, reproducible workflows that strengthen the translational potential of liquid biopsy biomarkers [16] [22].
Fundamental Guidelines: MIQE and Its Intersection with Domain-Specific Standards
The MIQE Guidelines: Ensuring qPCR Rigor
The MIQE guidelines represent a comprehensive framework for designing, executing, and reporting qPCR experiments. Originally published in 2009 and updated to MIQE 2.0, these guidelines emphasize methodological transparency and technical robustness to ensure that qPCR results are biologically meaningful, reproducible, and comparable across laboratories [16] [3]. MIQE compliance requires detailed documentation of several critical aspects:
- Sample quality and provenance: Documentation of sample collection, storage conditions, and nucleic acid quality metrics [16]
- Assay validation: Primer and probe sequences, amplification efficiency, linear dynamic range, and specificity testing [3]
- Experimental run conditions: Inclusion of appropriate controls (no-template controls, minus reverse transcription controls), replication strategy, and data acquisition parameters [16]
- Data analysis and normalization: Transparent reporting of quantification cycle (Cq) values, normalization strategy, and statistical analysis methods [16] [6]
For liquid biopsy applications, MIQE compliance is particularly crucial due to the typically low abundance of target nucleic acids and the complex matrix effects of biofluids like plasma and serum.
Integration with MISEV for EV Research
For EV-RNA biomarkers, MIQE must be integrated with the MISEV guidelines, which provide domain-specific recommendations for EV isolation, characterization, and reporting. While MISEV addresses pre-analytical variables and EV authentication, it deliberately refrains from prescribing methods for molecular quantification of EV cargo [16] [22]. This creates a natural synergy where MIQE fills the methodological gap for nucleic acid quantification.
Table 1: Integration of MISEV and MIQE Guidelines Across the EV Workflow
| Workflow Stage | MISEV-Specific Focus | MIQE-Specific Focus | Shared Considerations |
|---|---|---|---|
| Pre-analytical | Biofluid description, isolation method, storage conditions | Not directly addressed | Sample provenance, handling, storage duration |
| Characterization | Particle concentration/size, EV-specific markers, imaging | Not directly addressed | Documentation alongside molecular assays |
| Molecular Assay Preparation | Quantification of total RNA | RNA quality/quantity, contamination checks | RNA input standardization |
| Assay Design & Validation | Recognition of validation needs | Primer/probe sequences, efficiency, specificity | Transparent reporting of validation parameters |
| Data Acquisition | Not directly addressed | Cq values, controls, melt curves | Use of appropriate controls and replicates |
| Data Analysis | EV identity/purity description | Normalization, statistics, error metrics | Reporting of raw data, replicate variability |
This integrated approach ensures that both the vesicular origin of the nucleic acids and the technical rigor of their quantification are adequately addressed [16].
MIQE-Compliant Workflow for Circulating miRNA Biomarker Validation
Experimental Design and Sample Preparation
The validation of candidate miRNA biomarkers identified through discovery approaches like small RNA sequencing requires a methodologically sound workflow. Initial study design should incorporate appropriate sample size calculations, matched case-control cohorts, and randomization to minimize bias. Pre-analytical variables including blood collection tubes, processing time, centrifugation protocols, and storage conditions must be standardized and documented, as these significantly impact miRNA profiles [36].
For serum or plasma preparation, standardized protocols for blood collection, clotting time (for serum), and centrifugation forces should be established. Documentation should include: time from collection to processing; centrifugation speed, time, and temperature; and storage temperature and duration [37]. These details are essential for MIQE compliance and experimental reproducibility.
RNA Isolation and Quality Assessment
RNA extraction from biofluids requires methods optimized for recovery of small RNAs. While phenol-chloroform extraction methods historically dominated, several commercial kits now provide improved recovery of miRNA species. The isolation method should be documented along with any carrier RNA used to improve yield. Critical quality control metrics include:
- RNA concentration measured by fluorescence-based methods (e.g., Qubit) rather than spectrophotometry
- Assessment of RNA integrity through metrics such as RNA Integrity Number (RIN) or microRNA quality control
- Documentation of potential contaminants (e.g., salts, phenol) that might inhibit downstream enzymatic reactions [37]
For EV-RNA, additional verification of EV association through gradient centrifugation or specific markers may be required, as recommended by MISEV guidelines [16] [38].
Reverse Transcription and qPCR Assay Optimization
The reverse transcription step requires particular attention for miRNA quantification due to the short length of miRNA targets. Whether using stem-loop or poly(A) tailing RT approaches, the specific method and reagents should be documented. MIQE requires validation of reverse transcription efficiency, though this is often challenging with low-input clinical samples where standard curves cannot be generated.
qPCR assay design for miRNAs must account for sequence similarity within miRNA families. MIQE-compliant validation includes:
- Demonstration of amplification efficiency (90-110%)
- Linear dynamic range over at least 3 orders of magnitude
- Specificity testing through melt curve analysis or probe verification
- Inclusion of no-template controls (NTCs) and minus reverse transcription controls (-RT) [3] [6]
For commercially available assays, such as TaqMan assays, the Assay ID along with amplicon context sequence should be provided to fulfill MIQE requirements [3].
Data Normalization and Analysis
Normalization represents one of the most critical and challenging aspects of circulating miRNA quantification. Unlike cellular RNA, no universal reference miRNAs exist for biofluids, requiring empirical determination of stable normalizers for each specific experimental context. Approaches include:
- Global mean normalization based on the geometric mean of multiple miRNAs
- Reference miRNA normalization using miRNAs stable across the study cohort
- Standard curve-based absolute quantification
- Spike-in normalization using exogenous synthetic miRNAs [6] [37]
Normalization strategies must be experimentally validated and clearly reported. Statistical analysis should distinguish between technical replicates (assessing assay precision) and biological replicates (assessing biological variation), with appropriate error metrics and confidence intervals reported for quantitative results [16].
MIQE-Compliant Workflow for EV-RNA Biomarker Validation
EV Isolation and Characterization
EV-RNA biomarker validation requires additional considerations beyond those for cell-free miRNAs. MISEV guidelines recommend using multiple complementary methods for EV characterization, including:
- Nanoparticle tracking analysis (NTA) for particle concentration and size distribution
- Electron microscopy for morphological assessment
- Western blot or flow cytometry for EV marker detection (e.g., tetraspanins CD9, CD63, CD81) [16] [39]
Documentation should include the isolation method (e.g., ultracentrifugation, size-exclusion chromatography, precipitation kits), storage conditions, and characterization data to demonstrate the vesicular origin of the RNA [38].
EV-RNA Quality Assessment and Reference Gene Selection
EV-RNA typically exhibits lower integrity than cellular RNA, with RNA Integrity Numbers (RIN) often ranging from 2.0-4.0 due to the enrichment of fragmented RNA species [39]. This does not necessarily preclude successful qPCR analysis, as miRNA and short mRNA targets may remain intact, but should be documented.
Reference gene selection for EV-RNA normalization requires special consideration. Recent research has identified several promising candidate reference transcripts for EV-mRNA normalization, including TMSB4X, ACTB, GAPDH, VIM, and FTL, which show relatively stable expression across EV sources [38]. However, stability should be verified in each experimental system using algorithms such as RefFinder [38].
Experimental Validation with Controls
EV-RNA analysis requires rigorous controls to confirm the vesicular origin of signals and rule out contamination from non-vesicular sources. These include:
- Comparison with ultracentrifugation supernatants to confirm particle-associated RNA
- Detergent treatment to disrupt vesicles and decrease RNA signals
- Assessment of potential co-isolating contaminants (e.g., lipoproteins) [16]
For functional studies involving EV uptake and recipient cell responses, additional controls addressing EV specificity are necessary.
Case Studies in MIQE-Compliant Biomarker Validation
miRNA Biomarker Validation in Amyotrophic Lateral Sclerosis
A recent meta-analysis of miRNA expression in amyotrophic lateral sclerosis (ALS) exemplifies MIQE-compliant validation. After identifying miR-146a-5p as the most significantly dysregulated miRNA through robust rank aggregation of 20 profiling studies, the researchers validated this finding in serum-derived exosomes from 22 sporadic ALS patients and 18 healthy controls [37]. The validation workflow included:
- Standardized serum processing and exosome isolation
- RNA extraction with quality assessment
- RT-qPCR with appropriate controls and replication
- Normalization using reference miRNAs validated for stability in the experimental system
- Statistical analysis demonstrating significant upregulation in ALS patients and correlation with clinical parameters (longer survival) [37]
This orthogonal validation of sequencing data by MIQE-compliant RT-qPCR strengthened the evidence for miR-146a-5p as a potential ALS biomarker.
EV-Associated Transcriptomic Biomarkers for Therapy Monitoring
In anaplastic thyroid cancer (ATC), researchers developed an EV-associated transcriptomic signature for monitoring vandetanib treatment. After identifying candidate biomarkers through RNA sequencing of treated ATC cells, they validated an 8-gene signature in EV-RNA using RT-qPCR [39]. Key aspects of their MIQE-compliant approach included:
- Characterization of EVs by NTA and flow cytometry for tetraspanin markers
- Documentation of RNA quality (RIN 2.4-3.3) consistent with expected EV-RNA profiles
- Demonstration of technical reproducibility in RT-qPCR measurements
- Normalization using validated reference genes
- Association of biomarker expression with treatment response [39]
This workflow illustrates how MIQE-compliant validation can support the development of liquid biopsy biomarkers for therapy monitoring.
Table 2: Research Reagent Solutions for MIQE-Compliant Liquid Biopsy Analysis
| Reagent/Resource | Function | MIQE Compliance Considerations |
|---|---|---|
| TaqMan Assays | Sequence-specific qPCR detection | Provide Assay ID and amplicon context sequence; validated amplification efficiency [3] |
| RNA Extraction Kits | Isolation of high-quality small RNA | Document recovery efficiency; avoid contaminants that inhibit RT or PCR [37] |
| Reference Genes | Normalization of qPCR data | Validate stability in specific experimental system; use multiple genes [38] |
| Spike-in Controls | Assessment of technical variability | Add synthetic non-human RNA sequences prior to extraction [16] |
| NTA Instruments | EV concentration and size distribution | Required for MISEV compliance; documents particle characteristics [39] |
| EV Characterization Antibodies | Detection of EV markers (CD9, CD63, CD81) | Confirm vesicular origin of RNA; MISEV requirement [16] |
Experimental Protocols for Key Methodologies
Protocol: RT-qPCR Validation of Candidate miRNA Biomarkers
This protocol outlines the validation of differentially expressed miRNAs identified through sequencing or array-based discovery studies.
Materials:
- Extracted RNA from serum/plasma or EV isolates
- Reverse transcription kit (stem-loop or poly(A) tailing specific for miRNAs)
- qPCR master mix
- Validated miRNA-specific primers and probes
- Quality-controlled water for dilutions
- MicroAmp optical plates or tubes compatible with qPCR instrument
Procedure:
- RNA Quality Assessment: Determine RNA concentration using fluorescence-based quantification (e.g., Qubit RNA HS Assay). Assess RNA integrity if sufficient material is available.
- Reverse Transcription: Dilute RNA to working concentration. Perform reverse transcription in accordance with manufacturer's protocol including:
- No-template controls (NTCs)
- Minus reverse transcription controls (-RT)
- Synthetic spike-in controls (if used)
- qPCR Plate Setup: Prepare primer-probe mix and qPCR master mix according to MIQE recommendations. Load reactions in technical triplicates including:
- Experimental samples
- NTCs from RT step
- -RT controls
- Standard curves for efficiency determination (if possible)
- qPCR Run: Execute amplification using manufacturer-recommended cycling conditions with data collection at appropriate step.
- Data Analysis: Calculate Cq values using consistent threshold setting. Check control reactions for contamination or genomic DNA amplification. Analyze data using validated normalization approach.
Troubleshooting Notes:
- If amplification efficiency falls outside 90-110%, re-optimize primer concentrations or redesign assays
- If NTCs show amplification, check for contamination in reagents or sample carryover
- If -RT controls amplify, indicate potential genomic DNA contamination; consider DNase treatment [6] [37]
Protocol: EV Isolation and RNA Characterization for Biomarker Studies
This protocol describes a standardized approach for EV isolation and subsequent RNA analysis compatible with MIQE and MISEV guidelines.
Materials:
- Cell culture supernatant or biofluid (e.g., plasma, serum)
- Ultracentrifuge or size-exclusion chromatography columns
- PBS (filtered and particle-free)
- RNA extraction kit optimized for small RNAs
- DNase I treatment kit
- Instruments for EV characterization (NTA, western blot, or flow cytometry)
Procedure:
- Sample Preparation: Centrifuge biofluid at 2,000 × g for 10 minutes to remove cells and debris. Filter through 0.22 μm filter if further clarification needed.
- EV Isolation: Isolate EVs using preferred method (e.g., ultracentrifugation at 100,000 × g for 70 minutes, or size-exclusion chromatography). Resuspend pellet in particle-free PBS if using ultracentrifugation.
- EV Characterization:
- NTA: Dilute EV preparation appropriately and analyze particle concentration and size distribution
- Protein marker analysis: Detect EV-positive markers (CD9, CD63, CD81) and negative markers (e.g., apolipoproteins) by western blot or flow cytometry
- Electron microscopy: For morphological assessment (optional)
- RNA Extraction: Isolve RNA using appropriate kit, spiking in synthetic RNA standards prior to extraction if absolute quantification desired. Include DNase treatment step.
- RNA Quality Assessment: Measure RNA concentration and integrity. For EV-RNA, expect low RIN values (2-4) due to fragmented RNA content.
- Downstream Analysis: Proceed with RT-qPCR as described in Section 7.1.
Validation Criteria:
- EV preparation should be enriched for particles of expected size (50-200 nm)
- Positive for at least two EV-associated protein markers
- Negative for appropriate non-EV associated proteins
- Demonstration of membrane integrity (e.g., protease protection assay) for functional studies [16] [38] [39]
Visualization of Integrated Workflows
miRNA Biomarker Discovery and Validation Workflow
MISEV-MIQE Integration for EV-RNA Biomarkers
The integration of MIQE guidelines with domain-specific standards like MISEV provides a robust framework for developing reliable circulating miRNA and EV-RNA biomarkers. As liquid biopsy technologies continue to evolve and enter clinical applications, adherence to these methodological standards becomes increasingly critical. The structured approaches outlined in this technical guide—from sample preparation through data analysis—offer researchers a pathway to enhance reproducibility, minimize technical artifacts, and strengthen the evidentiary basis for biomarker claims.
Future directions in this field will likely include the development of more standardized reference materials for EV-RNA quantification, consensus on normalization strategies for different biofluid types, and refined reporting guidelines that address the unique challenges of liquid biopsy biomarkers. By embracing the principles of methodological rigor and transparent reporting embodied in MIQE, the research community can accelerate the translation of promising liquid biopsy biomarkers into clinically useful tools for cancer diagnosis, prognosis, and treatment monitoring.
Solving Common Challenges in MIQE Implementation for Cancer Biomarkers
Addressing PCR Inhibitors in Clinical Sample Types
In the field of cancer biomarker validation research, the accuracy of quantitative PCR (qPCR) is paramount. The Minimum Information for Publication of Quantitative Real-Time PCR Experiments (MIQE) guidelines provide a critical framework to ensure the reproducibility and credibility of qPCR data, which forms the foundation for robust biomarker development [3]. A central challenge in adhering to these principles is the presence of PCR inhibitors in clinical samples, which can skew amplification efficiency, lead to inaccurate quantification, and ultimately compromise the validity of research findings [40] [41]. These inhibitors are diverse and ubiquitous across clinical sample types, and their effects violate the MIQE requirement for demonstrating that amplification efficiency is consistent and optimal [3].
Inhibitors exert their effects through multiple mechanisms, including direct inhibition of DNA polymerase activity, interference with primer binding, chelation of essential co-factors like magnesium ions, and degradation or sequestration of target nucleic acids [40] [41]. In the context of cancer biomarker research, particularly with liquid biopsies such as plasma, urine, or cerebrospinal fluid, the presence of inhibitors can obscure the detection of low-abundance targets like circulating tumor DNA (ctDNA), directly impacting the sensitivity and clinical utility of an assay [8]. This guide details evidence-based strategies for identifying, overcoming, and validating methods for PCR inhibition, aligning with the rigorous standards demanded by MIQE and the broader goal of translational cancer research.
Understanding PCR Inhibitors in Clinical Samples
PCR inhibitors originate from the sample itself, the collection materials, or reagents used during nucleic acid extraction. Their impact is especially pronounced in clinical and environmental matrices, where the sample composition is highly complex and variable.
Table 1: Common Sources and Effects of PCR Inhibitors in Clinical Samples
| Source | Example Inhibitors | Primary Effect on PCR |
|---|---|---|
| Blood/Plasma | Hemoglobin, heparin, immunoglobulin G (IgG), lactoferrin [42] | Polymerase inhibition, co-factor chelation [41] |
| Tissues & Cells | Complex polysaccharides, lipids, proteins, RNases [40] | DNA polymerase inhibition, template degradation [40] |
| Liquid Biopsies (e.g., Urine, Bile) | Urea, bile salts, metabolites [42] [8] | Fluorescence interference, enzyme inactivation |
| Nucleic Acid Extraction | Guanidine salts, SDS, ethanol, phenol [41] [42] | Template precipitation, primer binding disruption [41] |
Key Indicators of Inhibition
The MIQE guidelines emphasize the importance of reporting assay validation data, which must include an assessment of inhibition [3]. The following are key indicators of potential inhibition in a qPCR assay:
- Delayed Cq Values: A general increase in Cq values across samples and controls suggests the presence of inhibitors. The use of an Internal PCR Control (IPC) is crucial here. If the IPC's Cq is also delayed, inhibition is the likely cause [41].
- Poor Amplification Efficiency: MIQE guidelines recommend PCR efficiency between 90–110% (standard curve slope of -3.1 to -3.6). A slope outside this range can indicate inhibition affecting polymerase function or primer binding [41].
- Abnormal Amplification Curves: Flattened curves, a lack of a distinct exponential phase, or a failure to cross the detection threshold are all visual signs of interference [41].
A Systematic Approach to Overcoming PCR Inhibition
A multi-faceted strategy, from sample collection to data analysis, is required to ensure accurate quantification of clinical samples.
Sample Preparation and Nucleic Acid Extraction
The first line of defense against inhibitors is a robust nucleic acid extraction method.
- Enhanced Purification Kits: Use kits specifically designed for inhibitor removal. Many commercial kits incorporate silica membrane technology or other chemistries to efficiently remove a broad spectrum of inhibitors like humic acids, polyphenolics, and tannins [40] [43]. For example, one study reduced the PCR inhibition rate in challenging non-respiratory clinical samples from 18.6% to 1.6% by implementing a silica membrane-based DNA purification step [43].
- Automated Extraction Systems: Automated systems can improve reproducibility and reduce carryover of inhibitors, a key consideration for high-throughput clinical validation studies [44] [45].
- Sample Pre-processing: Simple steps like centrifuging samples to remove debris and washing pellets in saline prior to extraction can significantly reduce inhibitory compounds [45].
PCR Reaction Optimization and Enhancers
Optimizing the reaction chemistry is a simple and cost-effective way to mitigate the effects of inhibitors that persist after extraction.
- Inhibitor-Tolerant Master Mixes: Selecting a robust master mix is one of the most impactful decisions. Several commercially available mixes are now engineered with inhibitor-tolerant polymerases and buffers designed to withstand a wide range of inhibitors commonly found in clinical samples (e.g., hemin, heparin, humic acid) [41] [42].
- PCR Enhancers: Adding specific compounds to the reaction can stabilize the polymerase or bind to inhibitors. Their effectiveness can vary based on the sample type and inhibitor.
- Bovine Serum Albumin (BSA): Binds to inhibitors like humic acids and tannins, preventing them from interacting with the polymerase [40] [46].
- T4 Gene 32 Protein (gp32): A single-stranded DNA binding protein that can enhance amplification by stabilizing the DNA template [40].
- Dimethyl Sulfoxide (DMSO): Destabilizes DNA secondary structures, making the template more accessible [40].
- Non-Ionic Detergents (e.g., Tween-20): Can counteract inhibitory effects on the Taq DNA polymerase [40].
Table 2: Evaluation of Common PCR Enhancement Strategies
| Strategy | Mechanism of Action | Considerations & Effectiveness |
|---|---|---|
| Sample Dilution | Dilutes inhibitor concentration below an effective threshold. | Simple but reduces target concentration; may not be suitable for low-abundance targets [40] [41]. |
| BSA | Binds to inhibitors (e.g., humic acids), preventing polymerase inhibition. | Inexpensive and widely effective; a concentration of 0.1–0.5 μg/μL is often used [40] [46]. |
| Inhibitor-Tolerant Master Mix | Polymerase and buffer formulations resistant to a broad spectrum of inhibitors. | Highly effective and simple; recommended for routine use with challenging samples [42]. |
| Silica Membrane Purification | Physically separates inhibitors from nucleic acids during extraction. | Highly effective for a wide variety of inhibitors; can be integrated into automated workflows [43]. |
Assay Design and Platform Selection
- Assay Chemistry: TaqMan probe-based assays are generally more tolerant of inhibitors than intercalating dye-based methods (e.g., SYBR Green), as the probe provides an additional layer of specificity [46].
- Digital PCR (dPCR): For absolute quantification of critical low-abundance biomarkers, droplet digital PCR (ddPCR) can be advantageous. By partitioning the reaction into thousands of nanodroplets, the impact of inhibitors is localized, allowing for accurate quantification even in partially inhibited samples [40]. However, ddPCR has a higher associated cost and longer processing time [40].
Systematic troubleshooting workflow for PCR inhibition
Experimental Protocols for Inhibition Monitoring and Validation
Internal Controls for Inhibition Detection
Incorporating controls to detect inhibition is a core requirement for MIQE-compliant assay validation [3].
- Exogenous Internal Control (IPC): A known quantity of a non-target DNA or RNA sequence (e.g., a synthetic gene, or a virus not present in the sample) is spiked into the lysis buffer or the sample itself prior to nucleic acid extraction. A separate primer/probe set is used to detect this control. A significant delay in the IPC's Cq value compared to its Cq in a clean buffer indicates the presence of inhibitors in the sample [41] [46].
- Endogenous Internal Control: An abundantly expressed gene from the sample material (e.g., a human housekeeping gene like RNase P for human tissues) is co-amplified. While useful for assessing sample quality, a deviation in its Cq can be due to either inhibition or biological variation, making it less specific than an exogenous IPC for diagnosing inhibition [46].
Protocol: Evaluating PCR Enhancers
The following protocol, adapted from Zafeiriadou et al., provides a methodology for empirically testing the efficacy of different enhancers for a specific sample type [40].
- Prepare Inhibitory Sample: Use a clinical sample type known to be challenging (e.g., wastewater for environmental surveillance, stool, or certain tissue extracts).
- Create Enhancer Master Mixes: Prepare separate qPCR master mixes, each containing a different enhancer at various concentrations. Common enhancers to test include:
- BSA (0.1 - 0.5 μg/μL)
- DMSO (1-5%)
- Tween-20 (0.1-1%)
- Glycerol (1-5%)
- Formamide (1-5%)
- A commercially available inhibitor-resistant master mix.
- Run qPCR: Amplify the target and the IPC in each reaction mix. Include a no-enhancer control and a 10-fold diluted sample control.
- Analyze Data: Compare the Cq values, amplification efficiency, and IPC performance across the different conditions. The optimal enhancer is the one that returns the Cq value closest to that of an uninhibited control while maintaining robust amplification of the IPC.
The Scientist's Toolkit: Essential Reagents and Materials
Table 3: Key Research Reagent Solutions for Managing PCR Inhibition
| Item | Function | Example Use Case |
|---|---|---|
| Silica-Membrane Extraction Kits with IRT | Efficiently removes humic acids, polyphenolics, and other inhibitors during nucleic acid purification. | Extraction of PCR-ready DNA from soil-rich samples, stool, or tissues [43] [46]. |
| Inhibitor-Tolerant qPCR Master Mix | A ready-to-use mix containing specialized polymerases and buffers that resist a broad spectrum of inhibitors. | Reliable amplification directly from crude samples or samples with residual inhibitors (e.g., blood, saliva) [41] [42]. |
| Bovine Serum Albumin (BSA) | A cheap and effective protein that binds to inhibitors, neutralizing their effects. | Mitigating inhibition from complex plant or clinical samples when added to the PCR mix at 0.1–0.5 μg/μL [40] [46]. |
| Internal PCR Control (IPC) Assay | A synthetic DNA/RNA and corresponding primers/probe to co-amplify with the target, monitoring inhibition. | Essential for MIQE compliance; validates that each individual sample reaction was free of significant inhibition [3] [41]. |
Recommended workflow for handling clinical samples prone to inhibition
Effectively addressing PCR inhibitors is not merely a technical obstacle but a fundamental requirement for generating publication-quality, MIQE-compliant data in cancer biomarker research. The journey from a raw clinical sample to a reliable qPCR result demands a systematic approach that integrates vigilant sample preparation, strategic reagent selection, and rigorous validation protocols. By employing inhibitor-tolerant master mixes, incorporating internal controls, and understanding the portfolio of available enhancers and purification technologies, researchers can safeguard the integrity of their amplification assays. This diligence ensures that quantitative data on promising cancer biomarkers accurately reflects biological reality, thereby strengthening the translational pathway from research discovery to clinically actionable diagnostic tests.
Optimizing Assays for Low-Abundance Transcripts in Liquid Biopsies
The analysis of transcriptomic biomarkers in liquid biopsies represents a revolutionary approach for non-invasive cancer diagnosis, prognosis, and therapeutic monitoring. Unlike tissue biopsies, liquid biopsies reflect the entire tumor burden and molecular cancer heterogeneity through analysis of circulating tumor cells, extracellular vesicles (EVs), and cell-free nucleic acids shed into various body fluids [8]. However, the detection of low-abundance transcripts in these samples presents significant technical challenges due to the extremely low concentration of tumor-derived material diluted within the total sample volume and the complex background of nucleic acids from healthy tissues [8] [17].
The physiological dynamic range of biomarkers in biological fluids spans more than 10 orders of magnitude, while contemporary molecular detection methods typically offer a quantifiable range of only 3-4 orders of magnitude [47]. This mismatch necessitates sophisticated optimization strategies to detect low-abundance transcripts without saturating signals from more abundant molecules. Furthermore, the rapid clearance of cell-free DNA (with half-lives ranging from minutes to a few hours) and the labile nature of RNA molecules demand specialized handling and stabilization protocols to preserve analyte integrity [8]. This technical guide outlines comprehensive strategies for optimizing assays to overcome these challenges, with particular emphasis on adherence to MIQE (Minimum Information for Publication of Quantitative Real-Time PCR Experiments) guidelines for rigorous biomarker validation in cancer research.
Pre-Analytical Considerations: Laying the Foundation for Quality Data
The pre-analytical phase is arguably the most critical component in the workflow for analyzing low-abundance transcripts, as it directly impacts the quality, integrity, and quantity of recoverable nucleic acids. Standardization of this phase is essential for generating reliable, reproducible data that meets MIQE guidelines.
Liquid Biopsy Source Selection
The choice of liquid biopsy source should be guided by the cancer type and clinical application. Table 1 compares the advantages and limitations of different biofluids for transcriptomic analysis.
Table 1: Comparison of Liquid Biopsy Sources for Transcript Analysis
| Biofluid | Advantages | Limitations | Ideal Cancer Applications |
|---|---|---|---|
| Blood Plasma | Systemic circulation reaches all tissues; minimally invasive; rich source of ctDNA, CTCs, and EVs | High dilution of tumor material; complex background; rapid degradation of nucleic acids | Pan-cancer applications; monitoring metastatic disease |
| Urine | Completely non-invasive; higher biomarker concentration for urological cancers | Lower tumor DNA fraction for non-urological cancers; variable composition | Bladder, prostate, and renal cancers |
| Saliva | Non-invasive; convenient for repeated sampling | Primarily suitable for head and neck cancers | Oral, salivary gland cancers |
| CSF | Direct contact with CNS; low background interference | Invasive collection procedure | Brain tumors, leptomeningeal carcinomatosis |
| Bile | High local concentration for biliary cancers | Requires specialized collection during procedures | Cholangiocarcinoma, gallbladder cancer |
For blood-based analyses, plasma is preferred over serum as it exhibits less contamination from genomic DNA released by lysed blood cells and offers higher stability for circulating tumor DNA [8] [48]. For cancers in direct contact with specific body fluids, local sources often provide superior biomarker concentration and signal-to-noise ratio. For instance, urine demonstrates significantly higher sensitivity for detecting TERT mutations in bladder cancer (87% in urine versus 7% in plasma) [8].
Blood Collection and Processing Protocols
Standardized blood collection methods are essential to minimize pre-analytical variability. The International Society of Liquid Biopsy (ISLB) recommends using butterfly needles to reduce shear stress on blood cells during venipuncture [48]. Following collection, blood should be gently mixed by inversion to prevent clot formation while preserving cfDNA integrity. The choice of blood collection tubes must align with laboratory workflows:
- EDTA tubes: Cost-effective but require processing within 2-4 hours to prevent genomic DNA contamination from lysed cells [48].
- Stabilizing tubes (e.g., Streck Cell-Free DNA BCT, PAXgene Blood ccfDNA): Can preserve cfDNA for up to 14 days, ideal for transport or delayed processing but at higher cost [48].
A minimum of 10mL of blood is recommended for high-sensitivity assays, with larger volumes (8-20mL) required for minimal residual disease detection where tumor-derived ctDNA is present at extremely low fractions [48]. Plasma separation should follow a two-step centrifugation protocol: an initial low-speed spin (e.g., 800-1600×g for 10 minutes) to separate plasma from cellular components, followed by a high-speed centrifugation (e.g., 16,000×g for 10 minutes) to remove residual debris and platelets [48]. Plasma should be aliquoted into low-binding tubes and stored at -80°C immediately after processing to prevent nucleic acid degradation.
Extracellular Vesicle Enrichment and RNA Isolation
For transcriptomic analysis, extracellular vesicles represent a particularly promising source of stable RNA biomarkers, as the lipid bilayer protects contents from degradation [17]. EV purification methods include ultracentrifugation, size-exclusion chromatography, polymer-based precipitation, and immunoaffinity capture. Each method offers different tradeoffs in yield, purity, and throughput that must be considered based on application requirements.
RNA isolation from EVs or plasma requires specialized kits optimized for low-abundance nucleic acids. Silica-based membrane columns and magnetic beads are the most common technologies, with automated systems providing improved reproducibility for high-throughput applications [48]. The QIAamp Circulating Nucleic Acid Kit has demonstrated higher recovery rates and cfDNA quantities compared to other commercial kits in comparative studies [48]. For RNA, proper DNase treatment is essential to remove contaminating genomic DNA that could interfere with downstream analyses.
Methodological Approaches for Transcript Detection and Quantification
Technology Comparison for Low-Abundance Targets
Table 2 summarizes the key molecular technologies for detecting and quantifying low-abundance transcripts, with their respective strengths and limitations.
Table 2: Comparison of Technologies for Low-Abundance Transcript Detection
| Technology | Dynamic Range | Sensitivity | Multiplexing Capacity | Key Applications | MIQE Compliance Considerations |
|---|---|---|---|---|---|
| qRT-PCR | 4-5 logs | Moderate (down to ~10 copies) | Low to moderate (with multiplex assays) | Targeted validation; gene expression profiling | Requires documentation of primers, probes, efficiency, R², LOD, LOQ |
| Digital PCR (dPCR/ddPCR) | 4-5 logs | High (down to <1 copy/μL) | Moderate (3-6 plex with channel limitations) | Absolute quantification; rare mutation detection; MRD monitoring | Same as qPCR plus partition number, threshold setting, Poisson confidence intervals |
| Next-Generation Sequencing (Targeted) | 3-4 logs | Variable (depends on depth) | High (dozens to hundreds) | Discovery; variant detection; splicing analysis | Read depth, coverage uniformity, mapping rates, duplicate rates, base quality scores |
| Single-Cell RNA-Seq | 3-4 logs | Variable (dropout issues) | Genome-wide | Cellular heterogeneity; rare cell populations | Cell viability, UMIs, amplification efficiency, dropout rates |
| Nanopore Sequencing | 3-4 logs | Improving | Genome-wide | Full-length transcripts; direct RNA sequencing; isoform detection | Read length distribution, base calling accuracy, adapter ligation efficiency |
Ultra-Low Input RNA Sequencing (ulRNA-Seq) Optimization
For comprehensive transcriptome analysis from limited material, ulRNA-seq protocols require careful optimization. Systematic evaluation of experimental conditions has revealed that:
- Reverse transcriptase selection: Maxima H Minus reverse transcriptase demonstrates superior performance for low-input RNA samples (0.5pg-5pg), with higher cDNA yields and enhanced detection of low-abundance genes compared to other MMLV derivatives [49].
- Template-switching oligos (TSO): Incorporation of rN-modified TSOs significantly improves sequencing sensitivity and low-abundance gene detection capability [49].
- Template RNA structure: mRNAs capped with m7G are more efficiently captured and amplified [49].
With optimized protocols, RNA-seq libraries can be successfully prepared from total RNA samples as low as 0.5pg, identifying more than 2,000 genes even at this ultralow input level [49]. This sensitivity enables transcriptome characterization from subcellular compartments, circulating tumor cells, and other rare samples relevant to cancer diagnostics.
Targeted Enrichment Strategies
When analyzing viral transcripts or low-abundance human transcripts in complex samples, targeted enrichment of specific sequences significantly improves detection sensitivity. This approach hybridizes prepared sequencing libraries to biotinylated RNA or DNA probes complementary to targets of interest, followed by purification using streptavidin-coated magnetic beads [50]. While this method requires extensive PCR amplification and careful bioinformatic deduplication, it can enhance sensitivity for rare transcripts by several orders of magnitude, enabling discoveries that would be impossible with standard RNA-seq approaches [50].
Analytical Workflows and Quality Control
Comprehensive Quality Control Pipeline
A robust quality control pipeline with defined checkpoints is essential for reliable biomarker development. Figure 1 illustrates the key stages of this workflow.
Figure 1: End-to-End Workflow for Extracellular Vesicle Transcriptomic Biomarker Development with Quality Control Checkpoints
The Scientist's Toolkit: Essential Research Reagent Solutions
Table 3 catalogues critical reagents and their functions in optimizing assays for low-abundance transcripts.
Table 3: Essential Research Reagent Solutions for Low-Abundance Transcript Analysis
| Reagent Category | Specific Examples | Function | Optimization Considerations |
|---|---|---|---|
| Reverse Transcriptases | Maxima H Minus, SuperScript III, SMARTScribe | Converts RNA to cDNA; critical for sensitivity | Maxima H Minus shows superior performance for low-input samples [49] |
| Template-Switching Oligos (TSO) | rN-modified TSO | Enhances cDNA synthesis efficiency and coverage | rN modifications significantly improve detection sensitivity [49] |
| Unique Molecular Identifiers (UMIs) | Random nucleotide barcodes | Distinguishes biological duplicates from PCR duplicates | Essential for accurate quantification in NGS applications [50] |
| Blood Collection Tubes | Streck Cell-Free DNA BCT, PAXgene Blood ccfDNA | Preserves sample integrity during storage and transport | Enable processing delays up to 14 days without significant degradation [48] |
| Nucleic Acid Isolation Kits | QIAamp Circulating Nucleic Acid Kit, Maxwell RSC ccfDNA | Extracts high-quality nucleic acids from biofluids | QIAamp demonstrates higher recovery rates in comparative studies [48] |
| Proximity Assay Reagents | EVROS probe sets, depletion antibodies | Enables multiplexed quantification across wide dynamic range | Allow signal equalization for targets differing by 7+ orders of magnitude [47] |
Signal Equalization Strategies
The limited dynamic range of conventional detection methods presents particular challenges for multiplexed assays targeting transcripts with vastly different abundances. The EVROS (equalization) strategy addresses this through two tuning mechanisms that can be applied to proximity ligation assays and similar methods [47]:
- Probe Loading: Adjusting concentrations of detection antibodies (or probes) to shift the binding curve appropriately for each analyte's physiological abundance, increasing signal output for low-abundance targets [47].
- Epitope Depletion: Adding unlabeled "depletant" antibodies to control the fraction of probe pairs that generate a signal, thereby attenuating signals from high-abundance analytes to prevent saturation [47].
When combined, these techniques enable simultaneous quantification of analytes present at concentrations spanning from femtomolar to nanomolar levels (7 orders of magnitude) in a single 5μL sample without differential dilution, effectively overcoming the non-linear dilution effects that often confound multiplexed assays [47].
MIQE-Compliant Validation and Clinical Translation
Adherence to MIQE Guidelines
Robust validation of biomarkers for low-abundance transcripts requires strict adherence to MIQE guidelines, which establish minimum information for publishing quantitative real-time PCR experiments. Key requirements include:
- Complete primer/probe information: Sequences, concentrations, locations, and specificity documentation.
- RNA quality assessment: RNA integrity number (RIN), absence of DNA contamination, and accurate quantification.
- Reverse transcription conditions: Enzyme, temperature, priming strategy, and reaction composition.
- PCR efficiency: For each assay, with standard curves spanning at least 5 orders of magnitude.
- Normalization strategy: Multiple reference genes properly validated for the specific sample type.
- Data analysis protocols: Clearly defined Cq determination methods and statistical approaches.
For dPCR/ddPCR applications, additional parameters must be reported, including partition number, threshold settings, and Poisson confidence intervals [51].
Analytical Validation Requirements
Before clinical implementation, assays must undergo rigorous analytical validation to establish:
- Limit of Detection (LOD) and Limit of Quantification (LOQ): Particularly challenging for rare transcripts in complex backgrounds.
- Precision and reproducibility: Both intra-run and inter-run variability assessment.
- Linearity and dynamic range: Demonstrated across the clinically relevant concentration spectrum.
- Analytical specificity: Against closely related sequences and in the presence of potential interferents.
For ctDNA analysis, the ISLB recommends regular participation in external quality assessment (EQA)/proficiency testing (PT) schemes to validate performance compared to peer laboratories [48]. Tumor fraction estimation is also critical for interpreting negative results, as low tumor fraction may cause false negatives rather than true absence of the target [48].
Optimizing assays for low-abundance transcripts in liquid biopsies requires integrated optimization across the entire workflow, from sample collection to data analysis. The strategies outlined in this technical guide provide a roadmap for enhancing sensitivity, specificity, and reproducibility while maintaining compliance with MIQE guidelines. As technologies continue to evolve, particularly in the realms of single-molecule sequencing and advanced signal amplification, the detection limits for rare transcripts will further improve, expanding the clinical utility of liquid biopsy approaches for cancer management. By implementing these optimized protocols and validation frameworks, researchers can accelerate the translation of promising transcriptomic biomarkers from concept to clinical application, ultimately advancing personalized cancer care.
Within the framework of MIQE (Minimum Information for Publication of Quantitative Real-Time PCR Experiments) guidelines, the precise application of replication strategies is fundamental for ensuring the credibility and reproducibility of quantitative PCR (qPCR) experiments, particularly in the high-stakes field of cancer biomarker validation [11] [3]. The MIQE guidelines provide a standardized framework to help ensure the integrity of the scientific literature and promote consistency between laboratories [11]. A core component of this rigorous experimental design is the correct distinction between and use of technical versus biological replicates. Proper replication strategy is not merely a statistical formality; it directly answers critical questions about the reproducibility of an assay and the generalizability of a biological effect [52]. For cancer researchers, whose findings may eventually inform clinical decisions, a robust design that captures both technical noise and true biological variation is non-negotiable. This guide details how to integrate these principles into validation studies aligned with MIQE standards.
Defining Replicate Types: Purpose and Function
Technical and biological replicates serve distinct but complementary purposes in an experimental workflow. Understanding their unique functions is the first step in constructing a reliable study.
Biological Replicates are parallel measurements of biologically distinct samples that capture random biological variation [52] [53]. They are crucial because they address how widely your experimental results can be generalized [52].
Technical Replicates are repeated measurements of the same biological sample [52]. They demonstrate the variability introduced by the experimental protocol itself.
- Purpose: To assess the reproducibility, precision, and noise associated with the assay technique, including equipment and reagents [52]. They indicate whether your measurements are scientifically robust and how large an effect must be to stand out above this technical background noise.
- Examples in Cancer Research:
- Loading the same patient cDNA sample into multiple wells on the same qPCR plate.
- Repeatedly measuring a single protein lysate from a cell line on the same Western blot or across multiple blots.
The following table summarizes the key differences:
Table 1: Core Differences Between Biological and Technical Replicates
| Feature | Biological Replicates | Technical Replicates |
|---|---|---|
| Definition | Measurements from biologically distinct samples [52] | Repeated measurements of the same sample [52] |
| Source of Variation | Biological variation between individuals or samples [53] | Technical noise of the protocol and equipment [52] |
| Answers the Question | "Is the effect reproducible across a population?" [52] | "How precise is my measurement technique?" [52] |
| Generalizability | High (if properly implemented) | Low (specific to the sample and assay) |
| Example in qPCR | RNA extracted from multiple patient tumors | Same cDNA sample run in triplicate on a qPCR plate |
Replication Strategy within the MIQE Framework
Adherence to the MIQE guidelines is a critical step toward achieving reproducibility in qPCR-based cancer biomarker research [11] [3]. These guidelines explicitly state that researchers "must state the number of independent samples (biological replicates) and the number of replicate samples (technical replicates) and report how many times each experiment was replicated" [52]. This transparency is essential for reviewers and other scientists to critically evaluate the quality of the results and to repeat the experiments [11].
For research aimed at publication and clinical translation, the primary focus must be on securing an adequate number of biological replicates. While technical replicates are important for assessing assay precision and should be reported, they cannot substitute for biological replication when the goal is to make inferences about a biological population [53]. A study with a large number of technical replicates but only a single biological replicate (e.g., a qPCR experiment run in triplicate on a cDNA sample from one patient) only demonstrates that the assay works precisely for that one patient. It says nothing about the variation and consistency of the biomarker across the target cancer population.
Statistical Considerations and Hierarchical Models
In complex experimental setups, such as those involving multiple measurements from the same biological source (e.g., several arterial rings from one animal [53] or multiple tissue sections from one patient tumor), a standard t-test may not be appropriate. These subsamples are not fully independent biological replicates. Treating them as such can artificially inflate the statistical significance (a problem known as "pseudoreplication").
In such cases, hierarchical (or mixed-effects) models provide a superior alternative for data analysis [53]. This approach explicitly accounts for the clustered nature of the data (e.g., arteries nested within animals) by estimating the intraclass correlation (ICC). Research has demonstrated that a hierarchical approach can provide a better goodness of fit compared to regular statistical tests [53].
Table 2: Recommended Sample Sizes for Different Experimental Goals
| Experimental Goal | Minimum Replication Strategy | Rationale |
|---|---|---|
| Assay Validation | 3+ technical replicates per sample | To establish the baseline precision and standard error of the measurement technique itself [52]. |
| Biomarker Discovery (Pilot) | At least 3 independent biological replicates per group, with 2-3 technical replicates each [53]. | To obtain initial estimates of both technical variance and biological variance while adhering to the 3R principles (in animal studies) [53]. |
| Biomarker Validation (Robust) | 5-7 independent biological replicates per group, with 2-3 technical replicates each. | To achieve sufficient statistical power to detect a meaningful effect size amidst expected biological heterogeneity in human populations. |
| Complex Studies (e.g., tissues with sub-samples) | Use a hierarchical design. Example: at least 3 arterial rings from each of 3 animals, or at least 7 arterial rings from each of 2 animals per group [53]. | To ensure that the analysis correctly attributes variance to both the biological subject and the technical sub-sampling, preventing pseudoreplication [53]. |
Experimental Protocol for a qPCR Validation Study
This section provides a detailed, step-by-step protocol for a qPCR experiment designed to validate a candidate cancer biomarker, in full compliance with MIQE guidelines.
Stage 1: Experimental Design and Sample Preparation
- Define Cohort and Biological Replicates: Secure tumor and matched normal tissue samples from a well-characterized cohort of at least 10-15 patients (biological replicates). This number should be based on a power analysis from pilot data.
- RNA Extraction: Perform RNA extraction for each sample independently.
- Quality Control: Quantify and quality-check each RNA sample using methods like spectrophotometry (A260/A280) and bioanalysis (RIN > 7.0). Document all quality metrics as required by MIQE [11] [3].
- cDNA Synthesis: For each biological replicate, perform cDNA synthesis in a single reaction. To control for the synthesis step, use a standardized amount of RNA (e.g., 1 µg) and a master mix of reagents to minimize tube-to-tube variation.
Stage 2: qPCR Setup and Data Acquisition
- Assay Selection: Use pre-designed, validated assays (e.g., TaqMan Assays). Record the unique Assay ID and, for full MIQE compliance, provide the amplicon context sequence, which can be obtained from the manufacturer [3].
- Plate Layout (Randomization): Design the qPCR plate layout to include all samples and controls. Crucially, distribute biological replicates across the plate rather than grouping them together. This minimizes the confounding effects of plate-based technical errors.
- Technical Replication: Load each cDNA sample (representing one biological replicate) in triplicate (technical replicates) into the pre-defined wells.
- Controls: Include a no-template control (NTC) and positive controls on each plate.
- Run qPCR: Perform the qPCR run using standardized cycling conditions.
Stage 3: Data Analysis and Reporting
- Quality Assessment: Check the amplification curves and efficiency for each well. Confirm that Cq values for technical replicates are tightly clustered (low standard deviation).
- Data Normalization: Normalize the gene of interest to one or more validated reference genes (stably expressed across all samples). The choice of reference genes must be justified [52].
- Calculate Statistics: Calculate the mean and standard deviation for the technical replicates of each biological replicate. These means (one per patient) are then used for subsequent comparative statistics (e.g., t-test, ANOVA) between patient groups. If the study design involves sub-sampling, employ a hierarchical model [53].
- Reporting: In the manuscript, explicitly state:
- The number of biological replicates (e.g., n=15 patients per group).
- The number of technical replicates per biological sample (e.g., each sample run in triplicate).
- The assays used, with their IDs and context sequences.
- The statistical methods used, including any hierarchical analysis.
The following diagram illustrates the entire workflow, highlighting the points of biological and technical replication.
The Scientist's Toolkit: Essential Reagents and Materials
Table 3: Research Reagent Solutions for qPCR Biomarker Validation
| Item | Function | MIQE Compliance Consideration |
|---|---|---|
| RNase-free reagents & consumables | To prevent degradation of RNA samples, ensuring integrity from sample collection to analysis. | Critical for reporting sample quality metrics (e.g., RIN) [11]. |
| Validated RNA Extraction Kit | To isolate high-quality, pure total RNA from complex tissue samples (e.g., tumor biopsies). | The method of extraction should be documented [11] [3]. |
| Reverse Transcription Kit | To synthesize complementary DNA (cDNA) from RNA templates. | The kit, including enzyme and priming method (e.g., oligo-dT, random hexamers), and reaction conditions must be specified [11]. |
| Pre-Designed TaqMan Assays | Sequence-specific primers and probe sets for accurate and specific target amplification. | The Assay ID must be reported. For full compliance, the amplicon context sequence should be provided [3]. |
| Validated Reference Genes | Genes with stable expression used for normalization of target gene expression levels. | Must be demonstrated to be stable under the specific experimental conditions; the choice must be justified [52]. |
| qPCR Master Mix | A optimized cocktail containing DNA polymerase, dNTPs, buffer, and often a passive reference dye (ROX). | The source and catalog number of the master mix should be reported [11]. |
| qPCR Instrument | The thermocycler equipped with a optical detection system to monitor amplification in real-time. | The instrument model and software version should be documented [11]. |
In cancer biomarker validation research, the strategic deployment of both technical and biological replicates within the MIQE guideline framework is not optional—it is a scientific imperative. Technical replicates ensure your qPCR assay is precise, while biological replicates determine whether your findings are generalizable across a population, which is the ultimate goal of translational research. By designing studies with adequate biological replication, employing hierarchical statistical models where appropriate, and transparently reporting all experimental details as mandated by MIQE, researchers can significantly enhance the robustness, reproducibility, and clinical relevance of their findings, thereby strengthening the foundation upon which future cancer diagnostics and therapies will be built.
In the context of MIQE (Minimum Information for Publication of Quantitative Real-Time PCR Experiments) guidelines for cancer biomarker validation research, the management of pre-analytical variables is not merely a preliminary step but a fundamental determinant of experimental success. The pre-analytical phase encompasses all procedures from sample collection to processing, handling, and storage—critical stages where more than 60% of laboratory errors originate [54]. For DNA methylation biomarkers in liquid biopsies, which are central to modern cancer diagnostics, pre-analytical integrity is particularly crucial due to the low abundance and instability of circulating tumor DNA (ctDNA) [8]. The rapid clearance of cell-free DNA (cfDNA), with half-lives ranging from minutes to a few hours, presents a formidable challenge for blood-based biomarker analyses [8]. This technical guide provides researchers, scientists, and drug development professionals with a comprehensive framework for standardizing pre-analytical workflows to ensure data reproducibility, analytical validity, and clinical utility of cancer biomarker studies conducted under MIQE principles.
Critical Pre-analytical Variables and Their Impacts
Biospecimen Collection Considerations
The selection of appropriate biospecimen sources represents the first critical decision in the pre-analytical workflow. Blood-based liquid biopsies, particularly plasma rather than serum, are frequently used due to higher ctDNA enrichment and less contamination from genomic DNA of lysed cells [8]. However, for cancers with specific anatomical locations, local liquid biopsy sources often provide superior biomarker concentration and reduced background noise. For urological cancers, urine demonstrates significantly higher sensitivity for detecting tumor-derived material (87% in urine versus 7% in plasma for TERT mutations in bladder cancer) [8]. Similarly, for biliary tract cancers, bile outperforms plasma in detecting tumor-related somatic mutations [8]. The choice of collection tubes and anticoagulants further influences biomarker stability; EDTA tubes are preferred for DNA-based assays, while specialized tubes from manufacturers like Streck or PreAnalytiX offer extended stability profiles at higher costs [55].
Time and Temperature Factors
Temporal and thermal factors constitute perhaps the most variable components in the pre-analytical phase. Processing windows between biospecimen collection and processing demonstrate significant effects on biomarker stability, with delays leading to ctDNA degradation, changes in cell-free DNA concentrations due to ongoing cell lysis, and protein biomarker destabilization [55]. During transportation, samples may experience temperature fluctuations, vibration, and rough handling that compromise biomarker integrity. Room temperature shipping, while cost-effective, may be incompatible with many biomarker stability requirements, whereas refrigerated transport offers better temperature control with increased complexity and costs [55]. Storage conditions, including temperature fluctuations during frozen storage, freeze-thaw cycles due to equipment issues, and storage durations, all potentially compromise biospecimen integrity and introduce analytical artifacts [55].
Technical Processing Variables
Variations in biospecimen processing protocols introduce another dimension of pre-analytical variability. Clinical sites utilize different centrifuge models operating at varying speeds and durations, dramatically affecting sample quality and composition [55]. Sample volume requirements must be carefully considered during collection to ensure adequate material for analysis while accounting for potential repeat testing or additional validation studies [54]. The haemolysis status of samples and potential contamination from other sources represent additional factors that can interfere with downstream molecular analyses, particularly for sensitive applications like quantitative PCR [54]. Standardization of these technical variables is essential for maintaining consistency across multiple collection sites or longitudinal studies.
Table 1: Critical Pre-analytical Variables and Their Impacts on Cancer Biomarkers
| Variable Category | Specific Parameters | Potential Impact on Biomarkers | Recommended Documentation for MIQE Compliance |
|---|---|---|---|
| Collection Method | Tube type, anticoagulant, volume | ctDNA degradation, cellular contamination | Tube manufacturer/lot, fill volume, anticoagulant type |
| Temporal Factors | Processing delay, storage duration | DNA fragmentation, biomarker concentration changes | Exact time from collection to processing/freezing |
| Temperature Control | Transport conditions, storage temperature | Protein denaturation, nucleic acid degradation | Temperature logs, freeze-thaw cycle documentation |
| Processing Protocols | Centrifugation speed/duration, extraction method | cfDNA yield, genomic DNA contamination | Centrifuge parameters (RCF, time), extraction kit details |
| Sample Quality | Haemolysis, contamination, biomarker stability | PCR inhibition, false positives/negatives | Quality metrics, stability studies documentation |
Experimental Protocols for Pre-analytical Validation
Controlled Comparative Biospecimen Studies
To systematically evaluate pre-analytical variables, researchers should implement controlled comparative biospecimen studies that allow direct comparison of different specimen handling conditions. The fundamental approach involves collecting and handling biospecimens from the same patients under different conditions—immediate versus delayed processing, different storage temperatures, or varied collection tube types [55]. This A/B testing methodology enables quantitative assessment of each variable's impact on assay performance. For DNA methylation biomarkers in liquid biopsies, these studies should specifically evaluate variables affecting DNA methylation patterns, fragment size distribution, and ctDNA recovery rates. The experimental workflow should include paired samples from each donor subjected to different pre-analytical conditions, with sufficient sample size to achieve statistical power for detecting clinically relevant effect sizes. downstream analytical methods must remain consistent across comparisons to isolate pre-analytical effects.
Sample Quality Assessment Methodologies
Comprehensive quality assessment represents an essential component of pre-analytical validation. For DNA-based analyses, fragment analysis provides critical information about DNA integrity, with specific attention to the size distribution of cell-free DNA, which typically demonstrates a nucleosomal pattern around 166 base pairs. Quantification methods should distinguish between total DNA and specifically amplifiable DNA, with digital PCR offering absolute quantification for standardization purposes [8]. Contamination checks should include amplification of genomic DNA markers to assess the degree of cellular contamination in plasma samples. For DNA methylation-specific quality assessment, bisulfite conversion efficiency must be quantified using control sequences with known methylation status, as required by MIQE guidelines for publication of qPCR-based methylation data [3]. These quality metrics should be established as acceptance criteria for samples proceeding to downstream analysis.
Stability Studies for Biomarker Integrity
Determining biomarker stability under various pre-analytical conditions is essential for establishing validated protocols. Stability studies should evaluate temporal limits at different temperatures, documenting how long samples can be maintained at room temperature, refrigerated, or frozen before processing without significant biomarker degradation. For DNA methylation biomarkers, stability should be assessed using methylation-specific quantitative assays targeting loci with known methylation patterns, monitoring for both changes in overall methylation percentage and DNA degradation effects [8]. Freeze-thaw cycle experiments should establish the maximum tolerated cycles before biomarker integrity becomes compromised. These studies generate critical data for developing evidence-based standard operating procedures, defining processing windows, and establishing quality control procedures that ensure consistent performance across different clinical settings [55].
Table 2: Experimental Protocols for Pre-analytical Variable Assessment
| Experimental Approach | Methodological Details | Key Output Metrics | MIQE-Relevant Documentation |
|---|---|---|---|
| Comparative A/B Studies | Paired samples from same donor under different conditions | ΔCq values, methylation percentage changes, DNA yield | Sample pairing scheme, condition parameters, effect sizes |
| Time-Temperature Studies | Samples held at various temperatures for timed intervals | Degradation rates, stability thresholds | Stability curves, acceptance criteria for each timepoint |
| Centrifugation Protocol Comparison | Varied RCF forces, durations, and temperatures | cfDNA yield, genomic DNA contamination | Centrifuge specifications, calibration records, particle counts |
| Tube Type Evaluation | Different collection systems with identical samples | Recovery efficiency, additive interference | Tube manufacturer, lot numbers, fill volumes |
| Freeze-Thaw Stability | Repeated freezing/thawing cycles | DNA fragmentation, assay performance metrics | Temperature profiles, cycle limits, recovery percentages |
Visualizing Pre-analytical Workflows
Pre-analytical Variables in Biomarker Workflow
The Scientist's Toolkit: Essential Research Reagent Solutions
Table 3: Essential Research Reagents and Materials for Pre-analytical Studies
| Reagent/Material | Function in Pre-analytical Phase | Application Notes | MIQE Compliance Relevance |
|---|---|---|---|
| Cell-Free DNA Blood Collection Tubes | Stabilizes nucleated blood cells prevents genomic DNA contamination | Enables room temp transport; 3-7 day stability windows | Critical for accurate ctDNA quantification; must document tube lot |
| Plasma Preparation Tubes | Maintains sample integrity before processing | Contains EDTA or other anticoagulants; affects downstream PCR | Anticoagulant type must be specified in publications |
| DNA Extraction Kits | Isolves cell-free DNA from plasma/urine | Size-selective protocols enrich for ctDNA; impact yield | Method details required for reproducibility |
| Bisulfite Conversion Reagents | Converts unmethylated cytosines to uracils | Conversion efficiency must be quantified (>99% ideal) | Efficiency metrics required for publication |
| DNA Methylation Standards | Controls for conversion and amplification | Pre-methylated and unmethylated controls for standardization | Essential for assay validation and quality control |
| DNA Quantification Assays | Measures DNA concentration and quality | Fluorometric methods preferred over spectrophotometry | Method details must be reported per MIQE guidelines |
| PCR Inhibitor Removal Kits | Removes haemoglobin, heparin, other inhibitors | Critical for blood/urine samples with contaminants | Inhibition testing required for publication |
The successful implementation of MIQE guidelines in cancer biomarker research extends beyond analytical protocols to encompass comprehensive management of pre-analytical variables. As demonstrated throughout this guide, factors including biospecimen collection methods, processing windows, temperature control, and storage conditions significantly impact the quality and reproducibility of DNA methylation data from liquid biopsies. The experimental frameworks and validation methodologies presented provide researchers with structured approaches to quantify these effects and establish evidence-based standard operating procedures. By integrating rigorous pre-analytical validation into the biomarker development pipeline, researchers can enhance the translational potential of their discoveries, reduce clinical validation failures, and ultimately contribute to more reliable cancer diagnostics that benefit patients through earlier detection and improved monitoring capabilities. In an era of increasingly sensitive molecular analyses, attention to these foundational pre-analytical considerations will separate robust, clinically implementable biomarkers from those that fail to translate beyond controlled research settings.
Troubleshooting Amplification Efficiency and Dynamic Range Issues
In the context of cancer biomarker validation research, adherence to the Minimum Information for Publication of Quantitative Real-Time PCR Experiments (MIQE) guidelines is paramount for achieving reproducible and credible results [3]. Two critical parameters demanding rigorous optimization and reporting are amplification efficiency and dynamic range. Amplification efficiency (E) refers to the percentage of target templates duplicated in each cycle of the quantitative polymerase chain reaction (qPCR). The ideal efficiency is 100%, corresponding to a perfect doubling of amplicons every cycle [56]. The dynamic range defines the span of template concentrations over which the qPCR assay can detect and quantify the target with acceptable accuracy and precision. For reliable biomarker quantification, especially when detecting low-abundance transcripts, a wide dynamic range and near-optimal efficiency are non-negotiable. This guide provides an in-depth framework for troubleshooting these vital parameters within the rigorous framework of MIQE guidelines.
Understanding and Troubleshooting Amplification Efficiency
The Fundamentals of qPCR Efficiency
In an optimally functioning qPCR, the number of target molecules should double with each cycle, which equates to 100% efficiency. This is calculated from the slope of the standard curve generated from a serial dilution of the template, using the formula: E = -1 + 10(-1/slope) [56]. An ideal efficiency of 100% corresponds to a slope of -3.32. Typically, efficiencies between 90% and 110% are considered acceptable [56]. Deviations outside this range indicate potential issues that can compromise data integrity, leading to inaccurate fold-change calculations in gene expression studies of cancer biomarkers.
Common Causes and Solutions for Abnormal Efficiency
Abnormal amplification efficiency manifests as either low efficiency (<90%) or high efficiency (>110%), each with distinct causes and solutions.
Low Efficiency (<90%): This suggests the polymerase enzyme is not functioning at its maximum capacity, leading to incomplete duplication per cycle.
- Cause: Suboptimal primer design is a primary culprit. This includes primers with secondary structures (e.g., hairpins, self-dimers), inappropriate melting temperatures (Tm), or non-specific binding to unintended regions of the template DNA [57] [56].
- Solution: Redesign primers using specialized software to ensure specificity, minimal self-complementarity, and appropriate Tm. Furthermore, optimize reagent concentrations, particularly MgCl₂, which is a critical cofactor for polymerase activity [57]. Adjusting the annealing temperature can also enhance specificity and efficiency.
High Efficiency (>110%): Theoretically impossible, high efficiency is often an artifact caused by the presence of polymerase inhibitors in the more concentrated samples of a standard curve [56].
- Cause: Common inhibitors include carryover contaminants from the nucleic acid isolation step (e.g., ethanol, phenol, SDS, heparin, hemoglobin, or excessive amounts of the nucleic acid itself) [56]. These inhibitors flatten the standard curve slope because even with more template, the Cycle threshold (Ct) values do not shift to earlier cycles as expected.
- Solution: Purify the nucleic acid sample. Assess sample purity via spectrophotometry (A260/A280 ratios of ~1.8 for DNA and ~2.0 for RNA) and re-purify if necessary [56]. Using a qPCR master mix formulated to be more tolerant of inhibitors can also mitigate this issue. When generating a standard curve, exclude the most concentrated samples where inhibition is evident and the most diluted samples susceptible to stochastic effects.
Table 1: Troubleshooting Amplification Efficiency
| Problem | Theoretical Slope | Observed Signs | Common Causes | Recommended Solutions |
|---|---|---|---|---|
| Low Efficiency (<90%) | > -3.6 | Shallow standard curve slope | Poor primer design (dimers, secondary structures), low Mg²⁺ concentration, low annealing temperature [57] [56] | Redesign primers, optimize Mg²⁺ concentration and annealing temperature [57] |
| High Efficiency (>110%) | < -3.1 | Flattened standard curve slope; ΔCt between dilutions < 3.3 | Presence of polymerase inhibitors (e.g., heparin, ethanol, proteins) in concentrated samples [56] | Purify template DNA/RNA; use inhibitor-tolerant master mix; exclude inhibited concentrations from standard curve [56] |
Understanding and Troubleshooting Dynamic Range
Defining Dynamic Range in qPCR Assays
The dynamic range of a qPCR assay is the concentration interval over which a proportional and linear relationship exists between the starting quantity of the target nucleic acid and the Ct value. A broad dynamic range is essential for cancer biomarker validation, as it allows for the accurate quantification of genes expressed at both very high and very low levels within a single run. The dynamic range is empirically determined from the linear portion of the standard curve. A narrow dynamic range fails to quantify samples at the extremes of concentration, leading to non-detectable results or loss of accuracy.
Common Causes and Solutions for a Narrow Dynamic Range
A narrow dynamic range limits the assay's utility and is often linked to the same factors that cause abnormal efficiency and non-specific amplification.
- Cause: Non-specific amplification and primer-dimer formation are major contributors. When primers anneal to non-target sequences or to each other, they generate background noise and consume reagents, which disproportionately affects the quantification of low-concentration targets and compresses the upper limit of detection [57].
- Solution: Employ hot-start polymerases, which remain inactive until a high-temperature activation step, thereby preventing primer-dimer formation and non-specific extension during reaction setup [57]. Meticulous primer design is again critical to avoid regions of self-complementarity. Optimizing primer concentration and annealing time can further reduce these artifacts.
- Cause: Sample inhibition, as discussed for high efficiency, also truncates the dynamic range, particularly at high template concentrations.
- Solution: As with efficiency issues, nucleic acid purification is a key step. Furthermore, the use of PCR additives like bovine serum albumin (BSA) can help by binding to and neutralizing common inhibitors, thereby restoring the linear response across a wider concentration range [57].
Essential Experimental Protocols for Validation
Protocol 1: Determining Amplification Efficiency and Dynamic Range
This protocol outlines the generation of a standard curve, which is fundamental for validating any qPCR assay per MIQE guidelines [3].
Background: This procedure allows for the simultaneous determination of a qPCR assay's amplification efficiency and dynamic range. It is a prerequisite for reliable relative quantification in cancer biomarker studies.
Materials and Reagents:
- Purified target DNA or cDNA (for RNA targets)
- Nuclease-free water
- qPCR master mix (including buffer, dNTPs, hot-start polymerase, MgCl₂)
- Sequence-specific primers and probe (e.g., TaqMan)
- Optical plates or tubes compatible with the real-time PCR instrument
Procedure:
- Prepare a Serial Dilution: Create a minimum of 5-point serial dilution series (e.g., 1:10 or 1:5 dilutions) of the template, covering the expected concentration range in test samples.
- Run qPCR: Amplify each dilution in triplicate or more on the qPCR instrument.
- Data Analysis:
- Plot the log of the starting quantity of each dilution against its mean Ct value.
- Perform linear regression analysis to obtain the slope and correlation coefficient (R²) of the standard curve.
- Calculate amplification efficiency using the formula: E = -1 + 10(-1/slope).
- The dynamic range is defined by the highest and lowest concentrations that lie on the linear portion of the curve (typically with an R² > 0.99).
Validation: The protocol is validated if the efficiency falls between 90-110% and the R² value is >0.99. The negative template control (NTC) should show no amplification.
General Notes and Troubleshooting:
- If efficiency is low, re-assess primer design and reaction conditions.
- If the curve is non-linear at high concentrations, suspect inhibition and re-purify the stock template.
- If the curve is non-linear at low concentrations, consider stochastic effects and avoid over-diluting the template.
Protocol 2: Assessing Sample Quality and Purity
Background: Sample quality is a primary source of variation and inhibition. This protocol ensures that nucleic acid templates are of sufficient purity for robust qPCR [56].
Materials and Reagents:
- Isolated DNA or RNA samples
- Spectrophotometer (e.g., NanoDrop) or fluorometer (e.g., Qubit)
Procedure:
- Spectrophotometric Measurement:
- Measure the absorbance of the sample at 260nm and 280nm.
- Calculate the A260/A280 ratio. Acceptable purity ranges are ~1.8 for DNA and ~2.0 for RNA.
- A lower ratio indicates potential contamination with proteins or other impurities.
- Fluorometric Quantification (Optional but Recommended):
- Use a fluorometer with assays specific for dsDNA or RNA.
- This method is more accurate for quantifying nucleic acid concentration and is less affected by contaminants.
Validation: The protocol itself is standard. The results are validated if the purity ratios are within the expected ranges.
General Notes and Troubleshooting:
- If purity ratios are suboptimal, re-purify the samples using silica-column based methods or alcohol precipitations.
- For samples known to be challenging (e.g., from blood or formalin-fixed tissues), consider using specialized isolation kits designed for difficult samples.
Workflow Visualization and Reagent Solutions
Diagnostic and Optimization Workflow
The following diagram outlines a systematic approach to diagnosing and resolving issues with amplification efficiency and dynamic range.
The Scientist's Toolkit: Research Reagent Solutions
Table 2: Essential Reagents for Optimizing qPCR Assays
| Reagent / Tool | Function / Purpose | Key Considerations for Troubleshooting |
|---|---|---|
| Hot-Start Polymerase | Prevents non-specific amplification and primer-dimer formation by remaining inactive until a high-temperature step [57]. | Critical for improving specificity, which directly enhances dynamic range and ensures true amplification efficiency. |
| PCR Additives (e.g., BSA, Betaine) | BSA can bind inhibitors present in the sample; betaine can help destabilize secondary structures in the template [57]. | Use to overcome inhibition (addressing high efficiency) or to amplify difficult templates with high GC content. |
| MgCl₂ Solution | A critical cofactor for DNA polymerase activity; its concentration directly influences primer annealing and enzyme processivity [57]. | Optimize concentration (typically 1.5-5 mM) to address both low efficiency (increase) and non-specificity (decrease). |
| TaqMan Probes | Provide sequence-specific detection, dramatically increasing assay specificity compared to DNA-binding dyes [3]. | Preferred for complex backgrounds (e.g., genomic DNA) to minimize false positives and ensure accurate Cq values. |
| Nucleic Acid Purification Kits | Remove contaminants (proteins, salts, organics) that inhibit polymerase activity [56]. | The first line of defense against high efficiency and a narrow dynamic range caused by sample impurities. |
Within the framework of MIQE-compliant cancer biomarker research, rigorous attention to amplification efficiency and dynamic range is not optional—it is fundamental to data integrity. Successful troubleshooting is a systematic process that involves validating sample quality, optimizing primer and reaction components, and diligently using appropriate controls. By adhering to the protocols and strategies outlined in this guide, researchers can ensure their qPCR assays are robust, reproducible, and capable of generating the high-quality data necessary for reliable biomarker validation and drug development.
Software and Tools for MIQE-Compliant Data Analysis
The Minimum Information for Publication of Quantitative Real-Time PCR Experiments (MIQE) guidelines establish a standardized framework for the design, execution, and reporting of qPCR experiments, with the 2025 MIQE 2.0 revision reflecting advances in technology and emerging applications [2]. In cancer biomarker validation, compliance with these guidelines is not merely a publication formality but a fundamental requirement for generating clinically relevant, reproducible data. Transparent, clear, and comprehensive description of all experimental details is essential to ensure the repeatability and reproducibility of qPCR results, which is particularly critical when developing diagnostic or prognostic signatures [2] [4].
MIQE 2.0 emphasizes that quantification cycle (Cq) values should be converted into efficiency-corrected target quantities and reported with prediction intervals [2]. The guidelines provide updated recommendations for sample handling, assay design, validation, data analysis, and normalization specific to the complexities of contemporary qPCR applications, including cancer biomarker research.
Essential Software Ecosystem for MIQE Compliance
Data Acquisition and Instrument Control
MIQE-compliant analysis begins with proper data acquisition. Instrument manufacturers are specifically encouraged to enable the export of raw data to facilitate thorough analyses and re-evaluation by manuscript reviewers and interested researchers [2].
- Vendor-Specific Platforms: Most instrument manufacturers (e.g., Thermo Fisher Scientific, Bio-Rad, Roche) provide proprietary software for instrument control and initial data capture (e.g., QuantStudio Design and Analysis, CFX Maestro).
- Raw Data Export Functionality: A non-negotiable feature of any acquisition software is its ability to export raw fluorescence data in a universal format (e.g,. RDML). This allows for independent verification and re-analysis using third-party tools, a core MIQE principle [2].
Core Data Analysis Platforms
Specialized software is required to transform raw Cq data into efficiency-corrected target quantities as mandated by MIQE 2.0.
- qbase+: A commercial platform that automates many MIQE-compliant calculations, including amplification efficiency estimation, reference gene validation, and inter-run calibration.
- LinRegPCR: A robust, widely cited tool that performs per-amplification efficiency calculation from the raw fluorescence data, correcting for variations in individual assay performance that are critical for accurate biomarker quantification.
- R-based Frameworks (qPCR and HTqPCR packages): For researchers requiring maximum flexibility, these packages within the R/Bioconductor project provide comprehensive functions for rigorous data analysis, including stability analysis of reference genes and differential expression testing.
Assay Design and In Silico Validation Tools
Proper assay design is a prerequisite for MIQE compliance. These tools help ensure target specificity and amplification efficiency.
- Primer-BLAST: The NCBI's tool combines Primer3's design capabilities with BLAST search to ensure primers are specific to the intended transcript, crucial for avoiding false positives in complex samples like tumor biopsies.
- TaqMan Assay Search Tool (Thermo Fisher): For researchers using predesigned assays, this tool provides essential annotation information. To fully comply with MIQE on sequence disclosure, it allows users to generate the required amplicon context sequence using provided RefSeq numbers and locations [3].
MIQE-Compliant qPCR Data Analysis Workflow
The following diagram illustrates the core computational workflow for analyzing qPCR data in accordance with MIQE 2.0 guidelines, from raw data to validated results.
Workflow Phase Description
- Raw Fluorescence Data Export: The foundational step of the MIQE-compliant workflow is obtaining and exporting raw fluorescence data from the qPCR instrument [2]. This allows for independent re-analysis and verification.
- Technical Replicate Quality Control (QC): Initial assessment of the reproducibility between technical replicates. Data from outliers or failed reactions may be excluded at this stage.
- Amplification Efficiency Analysis: Using software like LinRegPCR to determine the per-run and per-assay PCR efficiency from the raw amplification curves. This is required for the subsequent efficiency-correction of Cq values [2].
- Cq Value Determination: Establishing the quantification cycle for each reaction. MIQE recommends against using fixed threshold approaches and suggests methods that consider the entire amplification curve.
- Efficiency-Corrected Normalization: The Cq values are converted into efficiency-corrected target quantities and normalized using validated reference genes [2]. This step is critical for accurate relative quantification.
- Final Quality Control: A final check that includes assessing the dynamic range and limits of detection for each target [2].
- Validated Target Quantity: The final output is a set of efficiency-corrected, normalized target quantities, ready for statistical analysis and biological interpretation, reported with their prediction intervals [2].
Integrating RNA-Seq and qPCR in Biomarker Validation
The discovery and validation of cancer biomarker signatures often involves an untargeted screening phase using next-generation sequencing (NGS), followed by targeted validation. The following workflow details this MIQE-compliant process.
From Sequencing to Validation
- Discovery via RNA-Seq: High-throughput screening of a subset of samples using RNA-Seq or small RNA-Seq is performed to identify differentially expressed transcripts [6] [4]. This holistic approach allows for the discovery of novel biomarker candidates not previously associated with the cancer type.
- Bioinformatic Analysis: Complex processing of sequencing data identifies a preliminary biomarker signature—a set of transcripts whose expression pattern can distinguish sample groups [6].
- MIQE-Compliant RT-qPCR Validation: The candidate biomarkers are quantified using RT-qPCR in the full cohort of available samples. This chapter outlines in detail the material and methods one can apply to reproducibly identify miRNA biomarker signatures from blood total RNA in compliance with the MIQE guidelines [6].
- Multivariate Data Analysis: Advanced biostatistical tools like Principal Component Analysis (PCA), Hierarchical Cluster Analysis (HCA), and heatmaps are employed to visualize and statistically confirm the classifier's ability to separate cancer and control cohorts based on the qPCR-validated expression profile [4].
Research Reagent Solutions for Validation Experiments
Table 1: Essential Materials for MIQE-Compliant Biomarker Validation
| Item Category | Specific Examples | Function in Workflow | MIQE Compliance Notes |
|---|---|---|---|
| RNA Stabilization Reagents | PAXgene blood/tissue tubes (PreAnalytiX), RNAlater (Ambion) | Preserves RNA integrity at collection, critical for accurate quantification [4]. | High RNA Integrity Number (RIN) directly correlates with reliable Cq values [4]. |
| qPCR Assays | TaqMan Assays (Thermo Fisher), Validated Primer Sets | Target-specific amplification. | Publication requires Assay ID and amplicon context sequence [3]. Assay location and RefSeq data available via manufacturer tools [3]. |
| Instrumentation | qPCR instruments with raw data export capability | Data acquisition. | Must enable export of raw fluorescence data for independent verification [2]. |
| RNA Quality Control | Agilent 2100 Bioanalyzer | Assesses RNA integrity (RIN) [4]. | Essential sample QC step; low RIN values can lead to misleading quantification [4]. |
Experimental Protocol: MIQE-Compliant Validation of a miRNA Biomarker Signature
This detailed protocol follows the workflow established by small RNA sequencing and subsequent MIQE-compliant validation [6].
Sample Preparation and Quality Control
- Sample Collection: Collect blood or tissue samples from defined patient cohorts (e.g., cancer vs. control). Immediately preserve using RNA stabilizers like PAXgene tubes for blood or RNAlater for tissues. Snap-freezing in liquid nitrogen is an alternative for tissues [4].
- RNA Extraction: Perform total RNA extraction using a phenol-guanidine based method (e.g., TRIzol) or silica-membrane columns, ensuring protocol is optimized for recovery of small RNAs.
- RNA Quality Assessment: Determine the RNA Integrity Number (RIN) using an Agilent 2100 Bioanalyzer. Acceptance Criterion: Proceed only with samples exhibiting RIN > 7.0, as degradation significantly impacts Cq values and assay specificity [4].
- RNA Quantification: Precisely quantify RNA using a fluorescence-based method (e.g., Qubit), which is more accurate for gene expression studies than absorbance (A260).
Reverse Transcription and qPCR Setup
- Reverse Transcription: For miRNA targets, use stem-loop primers specifically designed for the candidate miRNAs in the signature. Use a fixed amount of input total RNA (e.g., 10 ng) per reaction to ensure consistency.
- Assay Selection: Utilize TaqMan MicroRNA Assays or design custom assays with equivalent rigor. Record the unique Assay ID for each target.
- qPCR Plate Setup: Include the following controls on each plate:
- No-Template Controls (NTCs): To detect contamination.
- Inter-Run Calibrators (IRCs): A pooled sample included on every plate to correct for run-to-run variation.
- Technical Replicates: A minimum of three replicates per sample-assay combination.
- qPCR Run: Perform amplification on a calibrated instrument using the manufacturer's recommended cycling conditions.
Data Analysis and Statistical Validation
- Raw Data Export: Export raw fluorescence data from the qPCR instrument software for analysis in a specialized tool [2].
- Efficiency Calculation and Cq Determination: Import data into an analysis platform (e.g., LinRegPCR, qbase+) to calculate per-assay amplification efficiency and determine Cq values.
- Normalization: Convert Cq values into efficiency-corrected quantities. Normalize the data using the geometric mean of multiple, validated reference genes (e.g., miR-16-5p, U6 snRNA for miRNA studies) that have been stability-tested in your sample set.
- Multivariate Analysis: Input the finalized, normalized expression data into a statistical software package (e.g., R, SPSS). Perform Principal Component Analysis (PCA) and Hierarchical Clustering to visually and statistically confirm that the biomarker signature separates the cancer and control cohorts [4].
- Reporting: For publication, ensure the manuscript includes all details stipulated by the MIQE guidelines, including the context sequences for all assays and the dynamic range for each target [2] [3].
Validation Frameworks and Comparative Analysis of Biomarker Platforms
In the evolving landscape of cancer biomarker validation research, the integration of high-throughput discovery platforms with precise confirmation technologies represents a critical pathway toward clinical translation. Orthogonal validation—the practice of verifying results from one experimental method using a fundamentally different, independent technique—has emerged as an indispensable strategy for establishing scientific rigor. Within transcriptomics, this most commonly involves the transition from RNA sequencing (RNA-Seq) discovery to reverse transcription quantitative PCR (RT-qPCR) confirmation, a process that must be meticulously executed within the framework of the Minimum Information for Publication of Quantitative Real-Time PCR Experiments (MIQE) guidelines. This approach is particularly vital in cancer research, where clinically relevant gene expression differences are often subtle and must be distinguished from technical artifacts [58]. The convergence of next-generation sequencing with established quantitative methods, governed by standardized reporting guidelines, creates a robust foundation for developing reliable transcriptional biomarkers for cancer diagnosis, prognosis, and therapeutic prediction.
The Imperative for Validation: RNA-Seq Reliability and Limitations
RNA-Seq has rightfully become the gold standard for whole-transcriptome gene expression quantification, offering an unbiased view of the transcriptome with a broad dynamic range [59]. However, the question of how reliably it identifies differentially expressed genes, particularly for clinical application, is paramount. While RNA-Seq demonstrates high overall correlation with RT-qPCR data, specific limitations necessitate orthogonal confirmation in critical scenarios.
A comprehensive benchmarking study comparing five RNA-Seq analysis workflows against whole-transcriptome RT-qPCR data for over 18,000 protein-coding genes revealed that approximately 85% of genes showed consistent differential expression results between RNA-Seq and RT-qPCR. However, about 15-20% of genes were "non-concordant"—showing differential expression in opposing directions or detected by only one method. Importantly, the majority (approximately 93%) of these non-concordant genes had fold changes lower than 2, and approximately 80% had fold changes lower than 1.5. A very small fraction (approximately 1.8%) showed severe non-concordance with fold changes >2, and these problematic genes were typically lower expressed and shorter [60] [59].
Table 1: Scenarios Requiring Orthogonal Validation of RNA-Seq Data
| Scenario | Risk | Recommended Action |
|---|---|---|
| Story dependent on few genes | High false discovery rate if key genes are inaccurate | Mandatory orthogonal validation for all key genes [60] |
| Low expression genes | Higher potential for quantification inaccuracies | Prioritize for validation, especially if biologically relevant [60] [59] |
| Small fold changes (<1.5-2x) | Difficult to distinguish from technical variation | Confirm with highly precise method like RT-qPCR [60] |
| Extension to additional samples/conditions | RNA-Seq may not be feasible or cost-effective | Use RT-qPCR to confirm findings in new sample sets [60] |
| Clinical biomarker development | Clinical utility requires maximum reliability | Essential step in translational pipeline [4] [12] |
These technical considerations are especially relevant for cancer biomarker research, where the biological differences between sample groups can be intrinsically subtle. The recently developed Quartet RNA reference materials demonstrate that reference samples with small, clinically relevant differences enable more sensitive assessment of transcriptomic data quality than previous resources with larger biological differences [58].
The Orthogonal Validation Workflow: From Discovery to Confirmation
A structured, phased approach ensures efficient resource utilization while maximizing the reliability of final results. The following workflow diagram outlines the complete orthogonal validation pathway from initial discovery through final confirmation:
This workflow transitions from an initial discovery phase using RNA-Seq on a subset of samples to a validation phase using MIQE-compliant RT-qPCR across the entire sample cohort. This approach leverages the strengths of both technologies: the hypothesis-free, comprehensive nature of RNA-Seq for candidate identification, followed by the precision, sensitivity, and cost-effectiveness of RT-qPCR for targeted validation in larger sample sets [4] [12]. The critical decision point occurs after initial validation attempts, where unsuccessful validation requires troubleshooting and refinement of experimental conditions before proceeding.
Implementing MIQE-Compliant RT-qPCR Experiments
Adherence to the MIQE guidelines is fundamental for generating publication-quality, reliable qPCR data that can be trusted for biomarker confirmation [4] [3] [12]. These guidelines establish a standardized framework for experimental transparency and technical rigor. The detailed experimental protocol for the RT-qPCR validation phase is as follows:
Sample Quality Assessment and Reverse Transcription
- RNA Quality Control: Determine RNA concentration and purity (A260/A280 ratio ~2.0). Assess integrity using the RNA Integrity Number (RIN). High RIN values (>7-8) are crucial for reliable results, as degradation significantly impacts quantification accuracy [4] [12].
- Reverse Transcription: Use a defined amount of RNA (e.g., 100 ng-1 µg) for cDNA synthesis. The reverse transcription protocol must be clearly documented, including enzyme, priming strategy (oligo-dT, random hexamers, or gene-specific), temperature conditions, and reaction volumes [12].
qPCR Assay Design and Execution
- Assay Selection and Design: Predesigned assays (e.g., TaqMan) should be referenced by their unique Assay ID. For custom designs, the MIQE guidelines require full disclosure of primer and probe sequences, or at a minimum, the amplicon context sequence, to ensure reproducibility [3].
- Experimental Run: Each reaction should include a no-template control (NTC) to check for contamination. Use a minimum of three technical replicates per sample to assess technical variability. The cycling conditions must be fully reported, including instrument, reaction volumes, and thermal cycler profile [3] [12].
Data Analysis and Normalization
- Reference Gene Selection: Normalize target gene expression to multiple, stably expressed reference genes (e.g., GAPDH, ACTB, HPRT1). Reference gene stability must be verified across the specific sample set under study, as there is no universal reference gene [12].
- Quantification and Statistical Analysis: Use the Cq (quantification cycle) method for relative quantification. Report the statistical methods used for evaluating differential expression and the number of biological replicates, which are essential for assessing biological variation [4] [12].
Table 2: Key Elements of a MIQE-Compliant RT-qPCR Experiment
| Category | MIQE Requirement | Application in Biomarker Validation |
|---|---|---|
| Sample Quality | RNA integrity (RIN) and quantity | Ensures input material quality; critical for liquid biopsies with degraded RNA [12] |
| Assay Design | Primer/Probe sequences or Assay ID + Amplicon Context Sequence | Enables experiment reproducibility and troubleshooting [3] |
| Experimental Design | Number of biological and technical replicates | Provides power to detect biologically relevant effect sizes [4] |
| Reverse Transcription | Complete protocol details | Critical as efficiency varies by protocol and affects final quantification [12] |
| Data Analysis | Cq values, normalization method, reference gene validation | Prevents bias from using unstable reference genes [12] |
| Statistical Methods | Clear description of analysis pipeline | Ensures analytical transparency and robustness [4] |
The following diagram illustrates the core components of the RT-qPCR experimental process, highlighting critical MIQE checkpoints:
The Scientist's Toolkit: Essential Reagent Solutions
Successful execution of the orthogonal validation workflow depends on high-quality, well-validated reagents and resources at each stage.
Table 3: Essential Research Reagent Solutions for Orthogonal Validation
| Reagent/Resource | Function | Application Notes |
|---|---|---|
| RNA Stabilization Solutions (e.g., PAXgene, RNAlater) | Preserves RNA integrity at collection from tissue or liquid biopsies | Critical for obtaining high RIN values, especially for precious clinical samples [4] |
| Stranded RNA-Seq Kits | Library preparation for transcriptome discovery | Provides accurate strand information and comprehensive transcript coverage [58] |
| Reference RNAs (e.g., Quartet, MAQC) | Controls for technical variability in RNA-Seq and qPCR | Quartet materials enable detection of subtle differences relevant to cancer biomarkers [58] |
| TaqMan Assays | Sequence-specific detection for qPCR | Provide pre-validated, highly specific assays; must report Assay ID per MIQE [3] |
| Reverse Transcriptase Enzymes | Converts RNA to cDNA | Efficiency and fidelity impact final quantification; protocol must be documented [12] |
| Validated Reference Genes | Normalization of qPCR data | Must be validated for stability in the specific sample type under investigation [12] |
The orthogonal validation pathway from RNA-Seq discovery to MIQE-compliant RT-qPCR confirmation represents a robust, defensible framework for cancer biomarker development. By leveraging the comprehensive discovery power of RNA-Seq and following through with the precision and accessibility of rigorously controlled RT-qPCR, researchers can build a solid evidentiary foundation for their transcriptional biomarkers. This process, governed by the MIQE guidelines and mindful of the specific technical limitations of each technology, significantly enhances the reliability and translational potential of biomarker signatures. As the field moves toward increasingly subtle clinical distinctions—such as molecular subtyping of cancers and early detection—this disciplined approach to validation will become ever more critical for bridging the gap between promising research findings and clinically actionable diagnostic tools.
The selection of an appropriate analytical platform is a critical step in the verification of cancer biomarkers, directly influencing the reliability, accuracy, and eventual clinical utility of the results. Within the framework of MIQE (Minimum Information for Publication of Quantitative Real-Time PCR Experiments) guidelines, which mandate rigorous methodological transparency, this review provides a technical comparison of three cornerstone technologies: Real-Time Quantitative PCR (RT-qPCR), Digital PCR (dPCR), and Next-Generation Sequencing (NGS). The choice is not inherently one of superiority but of fitness-for-purpose, as these technologies often function in a complementary manner within a biomarker development workflow [61]. The following sections detail the operational principles, performance metrics, and specific applications of each platform to guide researchers and drug development professionals in making informed decisions.
Platform Fundamentals and Operational Principles
Real-Time Quantitative PCR (RT-qPCR)
RT-qPCR is a well-established workhorse for gene expression quantification and targeted biomarker analysis. It monitors the accumulation of PCR products in real-time using fluorescent dyes or target-specific probes. The quantification cycle (Cq), the point at which the fluorescence crosses a predefined threshold, is used for relative quantification against a standard curve [62]. Its benchtop workflow is familiar and straightforward, making it accessible for most molecular biology laboratories [61].
Digital PCR (dPCR)
dPCR represents the third generation of PCR technology. It operates by partitioning a PCR reaction into thousands to millions of individual nanoliter-scale reactions, so that each partition contains zero, one, or a few nucleic acid molecules. Following end-point PCR amplification, the fraction of positive partitions is counted, and the absolute concentration of the target sequence is calculated using Poisson statistics, without the need for a standard curve [62]. This partitioning confers powerful advantages including high sensitivity, absolute quantification, and high reproducibility [62] [63]. Two major partitioning methods have emerged:
- Droplet Digital PCR (ddPCR): The sample is dispersed into tiny droplets within an immiscible oil phase [62].
- Microchamber-based dPCR: Uses an array of thousands of microscopic wells embedded in a solid chip [62].
Next-Generation Sequencing (NGS)
NGS, or whole-transcriptome sequencing in the context of RNA analysis, allows for the unbiased, hypothesis-free discovery of biomarkers by sequencing all cellular RNA transcripts. There are two primary approaches:
- RNA-Seq: Recommended for detecting all RNA types (mRNA, miRNA, tRNA) and for novel discovery, such as identifying unknown differentially expressed genes or transcript isoforms [61].
- Targeted Transcriptome Sequencing: Focuses on a predefined set of known mRNA transcripts, typically around 20,000 targets, offering a more focused and cost-effective discovery effort [61].
Technical Performance Comparison
The following table summarizes the key performance characteristics of each platform, which are crucial for experimental design in biomarker verification.
Table 1: Technical Performance and Application Profile
| Feature | RT-qPCR | Digital PCR (dPCR) | NGS (Targeted Transcriptome) |
|---|---|---|---|
| Quantification Method | Relative (vs. standard curve) | Absolute (Poisson statistics) | Relative (read counting) |
| Sensitivity | Sufficient for most applications [61] | Superior for rare allele detection (e.g., <0.1%) and low viral loads [62] [63] | High; capable of detecting low-abundance transcripts |
| Dynamic Range | ~7 logs | Demonstrated superior accuracy across high to medium viral loads [63] | >5 logs |
| Precision & Reproducibility | High, but dependent on standard curve quality | High accuracy and reproducibility; less susceptible to PCR inhibitors [62] [63] | High |
| Multiplexing Capacity | Low to medium (typically 1-6 plex) | Medium | Very High (thousands of targets) |
| Throughput | High for targeted panels | Medium to High | High for discovery, lower for targeted |
| Primary Cost | Low cost-per-sample for low-plex | Higher cost-per-sample than qPCR [63] | Highest (instrumentation and sequencing) |
| Best Suited For | Targeted verification of known biomarkers; high-throughput screening | Absolute quantification; detection of rare mutations; liquid biopsy analysis [62] [8] | Novel biomarker discovery; transcript isoform analysis [61] |
Workflow Integration and Complementarity
A key insight is that these platforms are not mutually exclusive but are often integrated into a cohesive workflow. RT-qPCR is routinely used both upstream and downstream of NGS to ensure data integrity [61].
Diagram 1: Integrated Workflow for Biomarker Verification
Upstream of NGS, RT-qPCR can be used to check cDNA quality before committing valuable samples to a sequencing run [61]. Downstream of NGS, the list of candidate biomarkers identified requires verification. RT-qPCR remains the "go-to method for verification of results" and is the gold-standard for follow-up studies on a targeted panel of transcripts [61]. For applications demanding the highest sensitivity and absolute quantification—such as measuring minimal residual disease or specific mutations in liquid biopsies—dPCR is the preferred tool for validation and clinical application [62] [8].
The Critical Role of MIQE Guidelines in Platform Selection
The MIQE guidelines are a foundational framework for ensuring the reliability and reproducibility of qPCR experiments, a principle that extends to dPCR and informs rigorous NGS analysis. The recent MIQE 2.0 update reinforces that "no matter how powerful the technique, without methodological rigour, data cannot be trusted" [14].
Adherence to MIQE is crucial because qPCR and dPCR are not "black box" technologies. Common failures include:
- Using unvalidated reference genes for normalization [14].
- Reporting small fold-changes (e.g., 1.2- to 1.5-fold) as biologically meaningful without assessing measurement uncertainty [14].
- Assuming, rather than measuring, assay PCR efficiencies [14] [64].
- Failing to properly assess nucleic acid quality and integrity [14].
For publication and regulatory acceptance, researchers must provide comprehensive experimental details. For RT-qPCR and dPCR, this includes:
- Sample handling: Detailed collection, storage, and nucleic acid extraction protocols.
- Assay validation: Specificity, PCR efficiency, linear dynamic range, and limit of detection for each assay.
- Data analysis: Use of efficiency-corrected target quantities with appropriate statistical confidence intervals, not just raw Cq values [2] [64].
- Transparency: MIQE encourages the export and sharing of raw fluorescence data to allow independent re-evaluation [2] [64].
When using commercial assays like TaqMan, providing the unique Assay ID is typically sufficient for publication, as it corresponds to a fixed primer/probe sequence. For full MIQE compliance, the amplicon context sequence can also be provided using the manufacturer's tools [3].
The Scientist's Toolkit: Essential Reagents and Materials
Table 2: Key Research Reagent Solutions for Biomarker Verification
| Item | Function | Example Platforms/Assays |
|---|---|---|
| TaqMan Gene Expression Assays | Predesigned, highly specific probe-based assays for qPCR and dPCR. | Applied Biosystems [61] [3] |
| TaqMan Array Cards | 384-well microfluidic cards pre-spotted with assays for high-throughput, low-volume qPCR. | Applied Biosystems [61] |
| Ion AmpliSeq Transcriptome Kit | Targeted RNA-seq library preparation kit for analyzing >20,000 human RNA transcripts. | Ion Torrent NGS [61] |
| dPCR Partitioning Plates/Chips | Microfluidic chips for generating nanoliter-scale reactions for absolute quantification. | QIAcuity (Qiagen), ddPCR (Bio-Rad) [62] [63] |
| Nucleic Acid Preservation Media | Chemical solutions for stabilizing RNA/DNA in clinical samples during transport and storage. | BD BBL Port-A-Cul [65] |
| Automated Nucleic Acid Extractors | Instruments for standardized, high-throughput purification of RNA/DNA from complex samples. | KingFisher Flex, STARlet [63] [65] |
The verification of cancer biomarkers demands a platform strategy that aligns with the specific goals of the research phase. RT-qPCR remains the accessible, cost-effective, and reliable choice for high-throughput verification of a defined set of targets. dPCR excels where absolute quantification, superior sensitivity, and precision are non-negotiable, particularly in liquid biopsy and rare mutation detection applications. NGS is unparalleled for unbiased discovery and whole-transcriptome analysis. Ultimately, the most robust biomarker verification pipelines strategically employ these technologies in concert, underpinned by the rigorous, transparent practices mandated by the MIQE guidelines to ensure that resulting data are not merely published, but are truly robust, reproducible, and reliable [14].
The integration of biomarkers into cancer research and drug development has created an urgent need for rigorous analytical validation to ensure data credibility and reproducibility. For biomarkers measured using quantitative PCR (qPCR) and other sensitive techniques, adherence to established guidelines such as the Minimum Information for Publication of Quantitative Real-Time PCR Experiments (MIQE) is paramount for achieving reliable results [3]. Analytical validation provides the foundation for biomarker qualification, which is the evidentiary process linking a biomarker with biological processes and clinical endpoints [66]. Within the context of cancer biomarker validation research, establishing robust methods for determining sensitivity, specificity, and detection limits becomes critical for accurate disease detection, monitoring, and therapeutic assessment.
The validation process must be aligned with the intended use of the biomarker throughout the drug development continuum—from target discovery and validation to clinical trials [66]. As biomarkers transition from research tools to clinical endpoints, the stringency of analytical validation must increase accordingly [67]. This technical guide examines the core principles of sensitivity, specificity, and detection limits within the framework of MIQE guidelines and fit-for-purpose validation approaches for cancer biomarker research.
Core Analytical Performance Parameters
Fundamental Definitions and Relationships
In analytical chemistry and biomarker method validation, the terms sensitivity, specificity, and detection limits have precise definitions that are often misunderstood or used interchangeably.
Sensitivity is formally defined as the slope of the analytical calibration curve, representing the change in instrument response per unit change in analyte concentration [68]. In mathematical terms, for a calibration function y = f(x), sensitivity (S) is expressed as the differential quotient S = dy/dx. This distinguishes sensitivity from the detection limit, which represents the lowest concentration that can be reliably detected.
Specificity refers to the ability of an analytical method to unequivocally assess the analyte in the presence of other components, such as interferents, degradants, or matrix components [69]. In the context of qPCR assays, specificity ensures that the amplification signal originates exclusively from the target sequence.
Limit of Detection (LOD) is defined as the lowest concentration of an analyte that can be reliably distinguished from the analytical blank with a specified degree of statistical confidence [68]. The International Union of Pure and Applied Chemistry (IUPAC) defines LOD as "the lowest concentration of an analyte that an analytical process can reliably detect" [68]. For regulatory purposes, the U.S. Environmental Protection Agency (EPA) defines the Method Detection Limit (MDL) as "the minimum measured concentration of a substance that can be reported with 99% confidence that the measured concentration is distinguishable from method blank results" [70].
Limit of Quantification (LOQ) represents the lowest concentration at which the analyte can not only be detected but also quantified with acceptable precision and accuracy, typically defined as a relative standard deviation ≤20% [69].
Table 1: Key Performance Parameters in Analytical Method Validation
| Parameter | Definition | Typical Acceptance Criteria | Calculation Method |
|---|---|---|---|
| Sensitivity | Slope of the calibration curve | Consistent response across analytical range | S = dy/dx |
| Specificity | Ability to measure analyte unequivocally in presence of interferents | No interference at analyte retention/migration time | Chromatographic resolution ≥2.0 |
| LOD | Lowest detectable concentration with statistical confidence | Signal-to-noise ratio ≥3:1 or MDL with 99% confidence | 3.3 × σ/S (σ = standard deviation of blank, S = slope) |
| LOQ | Lowest quantifiable concentration with acceptable precision | Signal-to-noise ratio ≥10:1 or MQL with defined precision | 10 × σ/S |
Statistical Foundations of Detection Limits
The determination of detection limits must account for random measurement errors inherent in analytical methods. Statistical approaches differentiate between the decision limit and the detection limit itself. The decision limit (LC) is the critical value at which one can decide whether an analyte is present with a specified confidence level (typically 95-99%) [68]. This is calculated from the mean blank signal (μbl) and its standard deviation (σbl): LC = μbl + kσbl, where k is the confidence coefficient (typically 1.645 for 95% confidence or 2.33 for 99% confidence for a one-tailed test) [68].
The detection limit (LOD) represents the true concentration that will yield a signal exceeding the decision limit with a specified probability (β, typically 95%). For a symmetric distribution of errors around the blank, the detection limit is calculated as LOD = μbl + (k + k')σbl, where both k and k' correspond to the selected confidence levels [68]. In practice, when the standard deviations for blank and low-concentration samples are similar, this simplifies to LOD = μbl + 2kσbl [68].
Diagram 1: Statistical relationship between blank population, decision limit, and detection limit. The detection limit (LOD) ensures a specified probability that a true concentration will be detected above the decision limit (LC).
Regulatory and Guidelines Framework
MIQE Guidelines for qPCR Assays
The MIQE guidelines provide a standardized framework for ensuring the accuracy and reliability of qPCR experiments, which are commonly employed in cancer biomarker research [3]. These guidelines establish minimum information requirements for publishing qPCR experiments, covering experimental design, sample quality, assay validation, and data analysis. For researchers developing DNA methylation biomarkers in liquid biopsies, compliance with MIQE guidelines ensures that results are reproducible and credible [3] [8].
A critical aspect of MIQE compliance is proper disclosure of assay information. While TaqMan Assay IDs are widely accepted identifiers, full compliance requires providing either the probe or amplicon context sequence in addition to the Assay ID [3]. Thermo Fisher Scientific facilitates this compliance by providing comprehensive Assay Information Files (AIF) for each predesigned TaqMan assay, containing the required context sequences [3].
EPA Method Detection Limit Procedures
The EPA's Method Detection Limit procedure has evolved to address both spiked samples and method blanks. The current Revision 2 defines MDL as "the minimum measured concentration of a substance that can be reported with 99% confidence that the measured concentration is distinguishable from method blank results" [70]. This revision differs from previous versions in three significant ways: incorporation of method blanks in addition to spiked samples, requirement that MDL samples represent laboratory performance throughout the year, and option to pool data from multiple instruments [70].
The EPA procedure calculates two values: MDLS from spiked samples and MDLb from method blanks, with the final MDL being the higher of the two values [70]. This approach acknowledges that as detector sensitivity improves, background contamination from laboratory supplies and equipment can become more determinative of detection limits than instrumental sensitivity itself.
Fit-for-Purpose Validation Approach
The fit-for-purpose approach to biomarker method validation recognizes that validation stringency should correspond to the biomarker's position in the spectrum between research tool and clinical endpoint [67]. This framework classifies biomarker assays into five categories:
- Definitive quantitative assays use fully characterized calibrators to calculate absolute quantitative values.
- Relative quantitative assays employ response-concentration calibration with reference standards not fully representative of the biomarker.
- Quasi-quantitative assays lack calibration standards but have continuous responses expressed in terms of test sample characteristics.
- Qualitative ordinal assays rely on discrete scoring scales.
- Qualitative nominal assays determine simple presence or absence [67].
The fit-for-purpose approach proceeds through discrete stages: definition of purpose and assay selection, method validation planning, performance verification, in-study validation, and routine use with quality control monitoring [67].
Experimental Protocols for Detection Limit Determination
Sample Preparation and Experimental Design
The detection limit experiment requires careful preparation of two sample types: a blank sample with zero concentration of the target analyte, and spiked samples containing low concentrations of the analyte [71]. The blank solution should ideally have the same matrix as patient samples, though the "zero standard" from calibrator series is commonly used [71]. For spiked samples, the amount of analyte added should represent the detection concentration claimed by the manufacturer, or multiple samples may be prepared at concentrations spanning the expected detection limit range.
The EPA MDL procedure requires analysis of at least seven spiked samples and seven method blanks, with samples analyzed throughout the year rather than in a single batch to capture realistic laboratory performance variability [70]. This ongoing data collection captures instrument drift and variations in equipment conditions, leading to an MDL that represents actual laboratory practice rather than optimal conditions immediately after instrument servicing [70].
Table 2: EPA MDL Procedure Requirements (Revision 2)
| Component | Revision 1.11 | Revision 2 | Purpose |
|---|---|---|---|
| Spiked Samples | 7/year | 8/year (2/quarter) | Determine MDLS using clean reference matrix spiked with analyte |
| Method Blanks | 0 | Use routine method blanks | Calculate MDLb to account for background contamination |
| Calculation Basis | Single batch | Throughout the year | Capture realistic laboratory performance variability |
| Final MDL | MDLS | Higher of MDLS or MDLb | Accounts for both instrument sensitivity and background noise |
Data Analysis and Calculation Methods
For pharmaceutical analysis, LOD and LOQ are frequently calculated based on the standard deviation of the response and the slope of the calibration curve using the formulas: LOD = 3.3 × σ/S and LOQ = 10 × σ/S, where σ is the standard deviation of the response and S is the slope of the calibration curve [69].
The EPA MDL procedure employs a statistical calculation where the MDL is derived from the standard deviation of replicate measurements of spiked samples at concentrations 1-5 times the estimated detection limit, multiplied by the appropriate Student's t-value for the 99% confidence level with n-1 degrees of freedom [70]. If the calculated MDL exceeds the spike concentration, the MDL is set to the spike concentration, and the procedure may need to be repeated with a higher spike level.
For methods that generate hundreds or thousands of method blanks over a two-year period, laboratories have the option to use only the last six months of method blank data or the fifty most recent method blanks, whichever yields the greater number of method blanks, to reduce the computational burden [70].
Advanced Applications in Cancer Biomarker Research
DNA Methylation Biomarkers in Liquid Biopsies
DNA methylation biomarkers in liquid biopsies represent a promising application for sensitive detection methods in oncology [8]. The global rise in cancer incidence underscores the urgent need for improved diagnostics and management strategies. Liquid biopsies offer a minimally invasive source for cancer biomarkers, including markers for screening, diagnosis, prognosis assessment, residual disease detection, early recurrence identification, and treatment response prediction [8].
DNA methylation is particularly advantageous as a biomarker because alterations often emerge early in tumorigenesis and remain stable throughout tumor evolution [8]. The inherent stability of DNA methylation patterns, combined with the relative enrichment of methylated DNA fragments within cell-free DNA due to nuclease degradation resistance, makes them promising targets for sensitive detection [8]. However, the low abundance of tumor-derived material in liquid biopsies presents significant challenges for detection limit requirements.
For blood-based liquid biopsies, the limit of detection is constrained not by total cell-free DNA abundance but by the proportion of circulating tumor DNA (ctDNA) present in the sample [8]. At low ctDNA fractions, commonly seen in early-stage disease and cancers of the central nervous system, the robustness of DNA methylation-based detection decreases significantly [8]. This has driven the development of highly sensitive methods such as digital PCR and next-generation sequencing for biomarker validation.
Multiplex Biomarker Analysis
The coordinated changes in multiple biomarkers often provide more accurate clinical information than single biomarkers alone. For example, in malignant tumors, miRNA expression usually involves coordinated changes in multiple miRNAs [72]. However, multiplex detection within a single tube presents technical challenges for achieving high sensitivity and specificity simultaneously.
Advanced techniques such as non-gel sieving capillary electrophoresis (NGCE) with enzyme-free strand displacement amplification have been developed to address these challenges [72]. One such approach incorporates magnetic bead purification and drag tags to efficiently separate multiple amplification products, achieving detection limits ranging from 154.6 amol to 933.8 amol for seven miRNAs with high specificity, including the ability to distinguish single-nucleotide mismatches [72].
Diagram 2: Workflow for sensitive detection of cancer biomarkers in liquid biopsies. Each step must be optimized to maintain low detection limits while ensuring high specificity.
The Scientist's Toolkit: Research Reagent Solutions
Table 3: Essential Research Reagents and Materials for Sensitivity and Specificity Experiments
| Reagent/Material | Function | Application Example | Considerations for Sensitivity/Specificity |
|---|---|---|---|
| TaqMan Assays | Predesigned qPCR assays for specific targets | DNA methylation analysis, gene expression quantification | Provide assay ID and context sequences for MIQE compliance [3] |
| Bisulfite Conversion Reagents | Chemical conversion of unmethylated cytosines to uracils | DNA methylation biomarker discovery and validation | Conversion efficiency critical for detection limit; can degrade DNA [8] |
| Digital PCR Reagents | Partitioning samples for absolute quantification | Low-abundance ctDNA detection in liquid biopsies | Enables precise quantification without standard curves; high sensitivity [8] |
| Capillary Electrophoresis Systems | Separation of amplification products by size | Multiplex miRNA analysis with drag tags | Enables separation of multiple targets in single tube; high resolution [72] |
| Magnetic Beads | Solid-phase purification and separation | Entropy-driven circuit amplification products | Reduce background noise; improve specificity in complex mixtures [72] |
| Reference Standards | Calibrators for quantitative methods | Definitive quantitative biomarker assays | Must be fully characterized and representative of endogenous biomarker [67] |
Robust determination of sensitivity, specificity, and detection limits forms the foundation of reliable cancer biomarker research. As biomarkers become increasingly integrated into drug development and clinical trials, adherence to established guidelines such as MIQE and fit-for-purpose validation approaches ensures the credibility and reproducibility of research findings. The unique challenges of cancer biomarker detection—particularly the low abundance of tumor-derived material in liquid biopsies—demand continuous refinement of analytical methods to achieve the sensitivity and specificity required for clinical utility. By implementing rigorous experimental protocols, employing appropriate statistical analyses, and maintaining compliance with evolving regulatory frameworks, researchers can advance the development of biomarkers that ultimately improve cancer diagnosis, monitoring, and treatment.
The transition of quantitative PCR (qPCR)-based cancer biomarkers from research tools to clinically validated diagnostic assays hinges on methodological rigor. Adherence to the Minimum Information for Publication of Quantitative Real-Time PCR Experiments (MIQE) guidelines provides the foundational framework necessary to ensure the reliability, reproducibility, and diagnostic accuracy of these assays. This whitepaper delineates the critical pathway connecting strict MIQE compliance to enhanced biomarker performance, presenting quantitative evidence of current reporting shortcomings, detailed experimental protocols for validation, and visual workflows to guide researchers and drug development professionals in cancer biomarker validation.
The Imperative for MIQE Compliance in Cancer Diagnostics
In the realm of molecular diagnostics, particularly for cancer, the integrity of qPCR data is paramount. The MIQE guidelines establish a standardized framework for reporting qPCR experiments, designed to ensure the transparency and technical rigor required for independent verification of results [3]. For a biomarker to achieve clinical utility, it must not only be biologically relevant but also be measured with unwavering accuracy and precision. MIQE compliance addresses this need by enforcing comprehensive documentation of every experimental variable, from sample quality and nucleic acid integrity to assay validation and data analysis procedures [3].
The consequences of non-compliance are not merely academic. A critical appraisal of qPCR studies in colorectal cancer research revealed a disquieting reality: of 179 publications reviewed between 2006 and 2013, a staggering 97% could not be reliably assessed for validity due to inadequate reporting, primarily concerning reference gene validation and amplification efficiency [73]. This pervasive lack of transparency means the majority of published qPCR results in cancer research may or may not be valid, posing a significant risk to diagnostic development and subsequent patient care. This survey underscores that the existence of guidelines is necessary but insufficient; the scientific community must actively shoulder the responsibility of implementation [73].
Quantitative Landscape of MIQE Reporting in Cancer Research
The chasm between the existence of the MIQE guidelines and their application in published literature is vast. The evaluation of colorectal cancer publications serves as a stark quantitative indicator of this reporting crisis, which undermines the development of robust diagnostic assays.
Table 1: Critical Deficiencies in qPCR Reporting for Colorectal Cancer Studies (2006-2013, n=179)
| Evaluation Parameter | Finding | Percentage of Publications |
|---|---|---|
| Use of Single Reference Gene | Used only one endogenous control for normalization | 92% |
| Validation of Reference Genes | Did not report validation of reference gene stability | 87% |
| Reporting of PCR Efficiency | Did not report amplification efficiencies | 82% |
| Use of Efficiency-Dependent Analysis | Used methods like ΔΔCq that require known efficiency | 91% |
| Citation of MIQE Guidelines | Cited the MIQE guidelines in the publication | 1% |
| Provision of Supplemental Data | Did not provide online supplemental qPCR data | 92% |
This data reveals a systemic failure to adopt basic validation steps. The near-universal use of a single, unvalidated reference gene—most commonly ACTB (32%) and GAPDH (29%) for RNA studies, and RNU6B (44%) for miRNA studies—is particularly problematic, as it ignores the fundamental principle that gene expression is tissue-specific and context-dependent [73]. The simultaneous reliance on efficiency-dependent analysis methods without reporting amplification efficiencies further invalidates the quantitative claims of most studies. Alarmingly, no clear improvement in these parameters was observed even after the publication of the MIQE guidelines in 2009, indicating a deep-rooted resistance to change [73].
Experimental Protocols for MIQE-Compliant Assay Validation
To bridge the gap to diagnostic accuracy, researchers must implement and report a series of core validation experiments. The following protocols provide detailed methodologies for these critical steps.
Protocol for Reference Gene Stability Validation
Objective: To identify and validate a panel of endogenous control genes with stable expression in the specific sample set (e.g., tumor vs. normal tissues) under investigation.
Procedure:
- Gene Selection: Select a minimum of three candidate reference genes from different functional pathways. Common candidates include B2M, HPRT1, and RPLP0, but this must be tailored to the tissue and cancer type.
- qPCR Assay: Run all candidate genes for all samples in the study cohort using optimized, efficient qPCR assays.
- Data Analysis: Input the resulting Cq values into a dedicated algorithm such as geNorm, NormFinder, or BestKeeper.
- Stability Determination: The algorithm will calculate a stability measure (M-value in geNorm) for each gene and rank them. A lower M-value indicates greater stability.
- Gene Number Determination: Use the geNorm pairwise variation (V) analysis to determine the optimal number of reference genes required for reliable normalization. The default acceptance threshold is an M-value < 0.5.
Protocol for Amplification Efficiency Determination
Objective: To accurately determine the amplification efficiency (E) of each qPCR assay, which is essential for any relative quantification model.
Procedure:
- Standard Curve Preparation: Serially dilute (e.g., 1:5 or 1:10 dilutions) a known quantity of the target cDNA or synthetic template over at least 5 orders of magnitude. A minimum of five data points is required.
- qPCR Run: Amplify all standard curve dilutions in duplicate or triplicate on the same plate as the experimental samples.
- Data Analysis: Plot the mean Cq value against the logarithm of the template concentration for each dilution. Perform linear regression analysis.
- Efficiency Calculation: Calculate the amplification efficiency using the slope of the standard curve: E = 10^(-1/slope) - 1.
- Acceptance Criteria: An ideal assay has an efficiency of 100% (E=1.0), corresponding to a slope of -3.32. The MIQE guidelines recommend that assays used for relative quantification with the ΔΔCq method have efficiencies between 90% and 110% (slope between -3.1 and -3.6) and that the efficiencies of the target and reference genes differ by no more than 0.1 [3] [73].
Protocol for Assay Specificity Verification
Objective: To confirm that the qPCR assay amplifies only the intended target sequence.
Procedure:
- Melting Curve Analysis: After amplification, run a dissociation (melting) curve protocol by gradually increasing the temperature from 60°C to 95°C while continuously monitoring fluorescence.
- Data Interpretation: A single, sharp peak in the melting curve indicates specific amplification of a single product. Multiple or broad peaks suggest primer-dimer formation or amplification of non-specific products.
- Gel Electrophoresis (Optional but Recommended): Resolve the qPCR products on an agarose gel. A single band of the expected amplicon size confirms specificity.
Visualizing the MIQE-Compliant Validation Workflow
The following diagram illustrates the logical progression from core MIQE-compliant practices to their direct impact on key diagnostic accuracy metrics, demonstrating how methodological rigor translates into clinical reliability.
Figure 1: Pathway from MIQE Compliance to Diagnostic Accuracy
Successful implementation of a MIQE-compliant qPCR workflow requires specific, high-quality materials and reagents. The following table details key components and their critical functions in the validation process.
Table 2: Essential Research Reagent Solutions for MIQE-Compliant qPCR
| Reagent / Resource | Function | MIQE-Compliant Application |
|---|---|---|
| Predesigned TaqMan Assays | Sequence-specific primers and probe sets for target amplification and detection. | Provides a standardized, well-annotated assay with a unique Assay ID. The associated Amplicon Context Sequence fulfills MIQE sequence disclosure requirements [3]. |
| RNA Integrity Number (RIN) Kit | Microfluidics-based assay to quantitatively assess RNA quality. | Critical for sample quality control. MIQE recommends reporting RNA integrity, with a RIN >7 often being a benchmark for high-quality samples in gene expression studies. |
| Reverse Transcription Kit | Enzymatic conversion of RNA to complementary DNA (cDNA). | Must be used consistently. The kit, including enzyme and priming method (oligo-dT, random hexamers, or gene-specific), must be documented as per MIQE guidelines. |
| qPCR Master Mix | Optimized buffer containing DNA polymerase, dNTPs, and salts for efficient amplification. | The composition and manufacturer should be reported. Using a master mix reduces well-to-well variability, improving reproducibility. |
| Reference Gene Validation Software | Algorithms (e.g., geNorm, NormFinder) to analyze Cq data and determine expression stability. | Essential for objectively selecting the most stable reference genes for a specific sample set, moving beyond the use of unvalidated, single reference genes [73]. |
| Digital PCR System | Absolute nucleic acid quantification without a standard curve. | Can be used to create ultra-precise standard curves for qPCR efficiency determination or to orthogonally validate qPCR results. |
The connection between MIQE compliance and diagnostic accuracy is direct and non-negotiable. The quantitative data reveals a field at a crossroads, where widespread neglect of basic validation protocols undermines the translational potential of qPCR-based cancer biomarkers. By adopting the detailed experimental protocols and utilizing the essential tools outlined in this whitepaper, researchers can transform their qPCR workflows. This commitment to rigor, from sample preparation to data reporting, is the fundamental prerequisite for developing cancer diagnostics that are not only publication-worthy but also clinically trustworthy, ultimately ensuring that patient diagnostics are based on the most reliable scientific evidence.
The validation of cancer biomarkers is a critical step in translating molecular discoveries into clinically useful diagnostic and prognostic tools. Among the various analytical techniques, reverse transcription quantitative PCR (RT-qPCR) remains a cornerstone for biomarker validation due to its sensitivity, specificity, and relative ease of implementation. However, the reliability of RT-qPCR data heavily depends on rigorous experimental design and execution. The Minimum Information for Publication of Quantitative Real-Time PCR Experiments (MIQE) guidelines were established to standardize reporting and ensure the publication of reproducible, reliable data [74] [12]. For cancer research, where biomarker results can directly influence patient management, adherence to MIQE principles is not merely academic—it is a fundamental requirement for analytical validity.
This technical guide explores the successful implementation of MIQE guidelines in cancer biomarker development through detailed case studies. It highlights how structured experimental design, meticulous validation, and transparent reporting create a foundation for robust biomarkers that can withstand the challenges of translational research. By focusing on practical applications, this review provides researchers, scientists, and drug development professionals with actionable frameworks for implementing MIQE-compliant workflows in their own biomarker validation pipelines, thereby strengthening the path from discovery to clinical utility.
Core MIQE Principles for Cancer Biomarker Validation
The MIQE guidelines provide a comprehensive framework covering all phases of the qPCR assay lifecycle, from sample preparation to data analysis. For cancer biomarker research, several elements are particularly critical for ensuring data integrity and reproducibility.
- Assay Design and Validation: MIQE requires detailed information on primer and probe sequences, along with empirical validation of amplification efficiency and specificity [12] [75]. Proper design ensures the assay accurately measures its intended target, which is crucial when detecting low-abundance transcripts or subtle expression changes in heterogeneous tumor samples.
- Sample Quality Control: The guidelines mandate the reporting of RNA quality and quantity metrics [16]. In cancer research, where samples are often derived from formalin-fixed paraffin-embedded (FFPE) tissue or liquid biopsies, RNA integrity is a major variable that can significantly impact results.
- Normalization Strategy: MIQE emphasizes the use of validated reference genes for data normalization [16] [12]. This is especially important in cancer studies, where global transcriptional changes can destabilize commonly used reference genes, potentially leading to inaccurate conclusions.
- Transparent Reporting: Complete reporting of all experimental details, including raw quantification cycle (Cq) values, enables critical evaluation and independent verification of results [16].
The integration of MIQE with other domain-specific guidelines, such as the MISEV (Minimal Information for Studies of Extracellular Vesicles) guidelines for EV research, creates a powerful synergistic framework for standardizing complex workflows in liquid biopsy development [16].
Figure 1: The MIQE guidelines provide a foundational framework for key steps in the cancer biomarker validation workflow, ensuring robust and reliable results.
Case Study 1: MIQE-Compliant Copy Number Alteration Validation in Oral Cancer
A 2025 study directly compared two platforms for validating copy number alterations (CNAs) in oral squamous cell carcinoma (OSCC): the established gold standard of real-time PCR and the newer nCounter NanoString technology [76]. The primary objective was to conduct a cross-platform assessment to validate prognostic genomic biomarkers previously identified in OSCC. The real-time PCR workflow was explicitly designed and reported in accordance with MIQE guidelines, providing a robust model for compliant biomarker validation [76].
MIQE-Compliant Experimental Methodology
The researchers implemented several key MIQE principles in their experimental design, which are detailed in the table below.
Table 1: Key MIQE-Compliant Methodologies in Oral Cancer CNA Study [76]
| MIQE Component | Implementation in OSCC Study |
|---|---|
| Sample Characteristics | 119 treatment-naive OSCC patient samples clearly described. |
| Technical Replication | Real-time PCR reactions performed in quadruplicate, as per MIQE. |
| Assay Details | TaqMan assays used; primer/probe sequences provided. |
| Data Reporting | Spearman correlation and Cohen's Kappa calculated for cross-platform comparison. |
Key Findings and Impact
The study demonstrated that real-time PCR remains a robust method for validating genomic biomarkers, with a weak to moderate correlation between the two platforms [76]. Notably, the prognostic associations for specific genes like ISG15 differed between the platforms, highlighting how technical variations can influence biological interpretation [76]. This case underscores the value of a MIQE-compliant approach as a benchmark for evaluating emerging technologies, ensuring that validation studies yield reliable and biologically relevant conclusions for cancer prognosis.
Case Study 2: Integrating MIQE and MISEV for Extracellular Vesicle RNA Biomarkers
The Challenge of EV Biomarker Standardization
Extracellular vesicles are a promising source of RNA biomarkers for cancer, but their analysis is hampered by pre-analytical and analytical variability. The MISEV guidelines provide domain-specific standards for EV isolation and characterization but deliberately refrain from prescribing methods for molecular cargo quantification [16]. This creates a critical gap where the integration of MIQE guidelines becomes essential.
Synergistic Workflow Integration
A 2025 commentary proposed a model for harmonizing the general analytical standards of MIQE with the domain-specific expertise of MISEV [16]. The integration covers the entire EV analysis pipeline, as shown in the table below.
Table 2: Integration of MISEV and MIQE Guidelines in EV Biomarker Workflows [16]
| Stage in Workflow | MISEV Focus | MIQE Focus | Integrated Application |
|---|---|---|---|
| Pre-analytical | Biofluid source, isolation method, storage | Not directly addressed | Transparent reporting of sample provenance & handling |
| Characterization | Particle concentration, protein markers, imaging | Not directly addressed | Document EV purity alongside RNA integrity |
| Molecular Assay | Total RNA quantification | RNA quality, contamination checks | Rigorous QC of extracted EV RNA prior to RT-qPCR |
| Assay Validation | Recognition of validation needs | Primer specificity, amplification efficiency, Cq values | Full transparency in assay design & validation data |
Impact on Reproducibility
This integrated approach addresses major sources of variability. MIQE's requirements for reverse transcription efficiency, PCR efficiency, and use of validated reference genes are essential to avoid technical biases when quantifying EV-associated RNAs, which are often of low abundance [16]. Furthermore, MIQE's emphasis on controls, such as no-template and minus-reverse transcription controls, is vital for ensuring assay specificity in complex EV samples [16]. This model provides a scalable blueprint for improving the reproducibility of EV-based biomarker development.
Figure 2: A synergistic workflow for EV biomarker development, where MISEV guides the isolation of EVs and MIQE ensures the analytical validity of the subsequent RT-qPCR analysis of EV RNA.
The Scientist's Toolkit: Essential Reagents and Technologies
Successful MIQE-compliant biomarker validation relies on a suite of carefully selected and validated research reagents. The following table details key solutions and their critical functions in the experimental pipeline.
Table 3: Key Research Reagent Solutions for MIQE-Compliant Workflows
| Reagent / Solution | Function | MIQE Compliance Consideration |
|---|---|---|
| Nucleic Acid Extraction Kits | Isolate high-quality DNA/RNA from complex samples (tissue, biofluids). | Must be validated for specific sample type (e.g., FFPE, plasma). Document yield and purity (A260/A280). |
| RNA Integrity Number (RIN) Assay | Assess RNA quality and degradation (e.g., Bioanalyzer, TapeStation). | Critical for MIQE; RIN > 7 is often recommended for reliable RT-qPCR. |
| Reverse Transcription Kits | Synthesize cDNA from RNA templates. | Protocol (priming, enzyme, temperature) must be documented and consistent. |
| qPCR Master Mixes | Provide enzymes, dNTPs, buffers, and fluorescent detection chemistry (e.g., SYBR Green, TaqMan). | Must be suitable for platform and assay type. Lot-to-lot consistency is key. |
| Validated Primer/Probe Sets | Specifically amplify and detect the target sequence. | Sequences and locations must be reported. Efficiency (90-110%) and specificity must be validated. |
| Validated Reference Genes | Used for normalization of target gene expression data. | Must be stable across all experimental conditions. Requires prior validation. |
| Standard Curves & Controls | Quantify target abundance and monitor assay performance. | Essential for estimating PCR efficiency. Includes positive and negative (NTC) controls. |
The case studies presented herein demonstrate that MIQE compliance is not a bureaucratic hurdle but a fundamental enabler of reliability and reproducibility in cancer biomarker research. The oral cancer CNA study shows how MIQE provides a benchmark for evaluating new technologies [76], while the MISEV-MIQE integration model offers a blueprint for standardizing complex liquid biopsy workflows [16].
As the field moves toward increasingly complex multi-analyte signatures and liquid biopsy applications, the principles of rigorous validation, transparent reporting, and appropriate normalization championed by MIQE will only grow in importance. Adherence to these guidelines ensures that cancer biomarkers are built on a foundation of analytical rigor, accelerating their translation into clinically valuable tools that can ultimately improve patient outcomes.
Multivariate Data Analysis for Biomarker Signature Validation
The validation of biomarker signatures represents a critical step in the translation of cancer research into clinical practice. Unlike the assessment of single biomarkers, multivariate data analysis leverages the combined power of multiple biomarkers, often yielding superior predictive and prognostic accuracy. This approach is essential for capturing the complex biology of carcinogenesis and tumor progression. Framing this process within the context of the MIQE (Minimum Information for Publication of Quantitative Real-Time PCR Experiments) guidelines ensures that the validation is rigorous, reproducible, and meets the high standards required for clinical application. This guide provides an in-depth technical framework for the multivariate validation of biomarker signatures, tailored for researchers, scientists, and drug development professionals.
Core Concepts and Biomarker Performance
From Single to Multivariate Biomarkers
A fundamental shift in modern cancer diagnostics is the move from reliance on single biomarkers to multivariate biomarker signatures. A single biomarker, such as CA125 for ovarian cancer, while valuable, often lacks the sensitivity and specificity required for robust clinical decision-making. Multivariate analysis combines multiple biomarkers, which can include proteins, clinical parameters, and imaging data, to create a composite index with significantly improved diagnostic and prognostic power [77]. This is particularly important for cancers like ovarian and endometrial, where early and accurate detection is challenging.
Key Metrics for Validation
The validation of a multivariate biomarker signature requires assessing its performance against several key metrics, which should be clearly reported in line with MIQE-inspired principles for analytical validity. The following table summarizes these core metrics and their interpretations.
Table 1: Key Performance Metrics for Biomarker Signature Validation
| Metric | Description | Interpretation in Validation Context |
|---|---|---|
| Area Under the Curve (AUC) | Measures the overall ability of the signature to discriminate between groups (e.g., benign vs. malignant). | An AUC of 1.0 indicates perfect discrimination, while 0.5 indicates no discriminative power. An AUC >0.9 is generally considered excellent [77]. |
| Sensitivity | The proportion of true positives correctly identified by the signature. | High sensitivity is crucial for a rule-out test to minimize false negatives. |
| Specificity | The proportion of true negatives correctly identified by the signature. | High specificity is crucial for a rule-in test to minimize false positives. Cut-offs are often set at 90% specificity [77]. |
| Youden's J Index | A single statistic that captures the effectiveness of a diagnostic marker (Sensitivity + Specificity - 1). | Used to determine the optimal cut-off value for a test, maximizing its overall diagnostic effectiveness [77]. |
| Hazard Ratio (HR) | In survival studies, measures the effect of a biomarker on the risk of an event (e.g., death). | An HR >1.0 indicates a higher risk associated with an increase in the biomarker level. Used in Cox regression models [78]. |
Methodological Workflow for Signature Development and Validation
The process of developing and validating a multivariate biomarker signature is sequential and iterative. The diagram below outlines the key stages from initial patient cohort definition to the final clinical application of a validated signature.
Patient Cohort and Data Collection
A well-defined patient cohort is the foundation of any validation study. Patients should be prospectively enrolled and evaluated using a standardized protocol [77]. For endometrial or ovarian cancer studies, this involves women presenting with a pelvic or ovarian mass. Comprehensive data collection should include:
- Clinical data: Patient history, symptoms, and demographic information.
- Imaging data: Results from ultrasonography and CT scans of the abdomen and pelvis [77].
- Pathological data: Histopathological confirmation from biopsy or surgical specimens, which serves as the gold standard for diagnosis [78] [77].
Biomarker Assay and Measurement
Biomarker measurement must adhere to strict pre-analytical and analytical standards, as emphasized by MIQE guidelines. This ensures reproducibility and minimizes technical noise.
- Sample Collection: Peripheral blood samples should be collected preoperatively under standardized conditions [78].
- Biomarker Panels: A panel of biomarkers is measured. These can include:
- Laboratory Analysis: Use of automated immunoassay and chemistry analyzers (e.g., Roche Modular Analytics, Hitachi analyzers) with defined, quality-controlled protocols is essential [78].
Statistical Analysis and Model Construction
The statistical workflow progresses from understanding individual biomarkers to combining them into a powerful predictive model.
Univariate Analysis: Each biomarker is first assessed individually. For prognostic studies, the Kaplan-Meier method is used to construct survival curves, and the log-rank test determines if high versus low biomarker levels lead to significantly different outcomes [78] [79]. For diagnostic studies, Receiver Operating Characteristic (ROC) curve analysis is performed to evaluate the discriminatory power of each biomarker alone, determining AUC, sensitivity, and specificity at optimal cut-offs defined by Youden's J index [77].
Multivariate Analysis and Model Construction: Biomarkers showing significance in univariate analysis are entered into a multivariate model. Cox proportional hazards regression is commonly used for survival data to identify which biomarkers are independent prognostic factors after adjusting for others [78] [79]. This step is crucial for paring down the biomarker panel to the most informative components.
Algorithm Development and Validation
The independent prognostic or diagnostic biomarkers are then integrated into a multivariate algorithm.
- Index Generation: The selected biomarkers are combined using techniques like non-linear regression modeling to generate a single, continuous index value that predicts cancer risk or prognosis [77].
- Performance Comparison: The performance of this new index must be compared against existing standards, such as the Risk of Ovarian Malignancy Algorithm (ROMA) or single biomarkers like CA125, using ROC analysis, reclassification metrics, and concordance statistics [77].
- Independent Validation: The final and most critical step is to validate the performance of the algorithm in a separate, independent cohort of patients. This tests the generalizability and robustness of the signature and is a cornerstone of rigorous validation [77].
Case Study: A Prognostic Model in Endometrial Cancer
A study of 282 patients with surgically treated endometrial cancer provides a concrete example of this workflow in a prognostic setting [78] [79].
Experimental Protocol
- Objective: To identify serum biomarkers with prognostic value for overall survival.
- Patients: 282 patients treated surgically for endometrial cancer.
- Biomarkers: Preoperative levels of CA125, CA15-3, CRP, D-D, PLR, and NLR were measured.
- Statistical Methods: Kaplan-Meier survival analysis with log-rank test was used for univariate analysis. Multivariate analysis was performed using Cox proportional hazards regression to identify independent prognostic factors.
- Prognostic System: A novel grouping system was developed based on the combination of independent risk factors.
Key Findings and Data Presentation
The study successfully identified a multivariate signature and demonstrated its clinical utility.
Table 2: Prognostic Value of Serum Biomarkers in Endometrial Cancer (Univariate Analysis) [78]
| Biomarker | Cut-off Value | Prognostic Value (Log-rank test) |
|---|---|---|
| CA125 | ≥35 U/ml | Predictive of poor 5-year overall survival (P < 0.01) |
| CA15-3 | ≥25 U/ml | Predictive of poor 5-year overall survival (P < 0.01) |
| C-reactive Protein (CRP) | ≥8.2 mg/L | Predictive of poor 5-year overall survival (P < 0.01) |
| D-dimer (D-D) | ≥1.5 mg/L | Predictive of poor 5-year overall survival (P < 0.01) |
| Platelet-to-Lymphocyte Ratio (PLR) | ≥250 | Predictive of poor 5-year overall survival (P < 0.01) |
| Neutrophil-to-Lymphocyte Ratio (NLR) | ≥4.68 | Predictive of poor 5-year overall survival (P < 0.01) |
Table 3: Multivariate Cox Regression Analysis for Overall Survival [78]
| Biomarker | Hazard Ratio (HR) | 95% Confidence Interval | P-value |
|---|---|---|---|
| C-reactive Protein (CRP) | 0.215 | 0.084 - 0.549 | Significant |
| D-dimer (D-D) | 0.252 | 0.095 - 0.670 | Significant |
| CA125 | Not Provided | Not Provided | Not Significant |
| CA15-3 | Not Provided | Not Provided | Not Significant |
In the multivariate model, only CRP and D-D were statistically significant independent prognostic factors for survival [78] [79]. The resulting prognostic grouping system stratified patients into three distinct risk tiers with dramatically different 5-year overall survival rates:
- Low Risk: CRP <8.2 mg/L and D-D <1.5 mg/L → 5-year OS: 92.1%
- Medium Risk: CRP ≥8.2 mg/L or D-D ≥1.5 mg/L → 5-year OS: 78.4%
- High Risk: CRP ≥8.2 mg/L and D-D ≥1.5 mg/L → 5-year OS: 33.3% [78]
The Scientist's Toolkit: Essential Reagent Solutions
The following table details key reagents and materials essential for conducting the biomarker validation experiments described in this guide.
Table 4: Essential Research Reagent Solutions for Biomarker Validation
| Item | Function / Application | Example from Literature |
|---|---|---|
| Automated Immunoassay Analyzer | Quantitative measurement of serum tumor markers (e.g., CA125, HE4). | Modular Analytics E170 (Roche Diagnostics) [78] |
| Automated Chemistry Analyzer | Measurement of serum proteins and inflammatory markers (e.g., C-reactive protein). | Hitachi 7600 Automated Chemistry Analyzer [78] |
| Coagulation/Hematology Analyzer | Measurement of D-dimer and complete blood count for NLR/PLR calculation. | Latex agglutination assay for D-D; Sysmex XE-5000 for cell counts [78] |
| Specific ELISA Kits | Targeted, high-sensitivity quantification of specific biomarkers in validation phases. | Kits for CA125, HE4, CRP, etc., are used in algorithm development [77]. |
| Reference Standards & Controls | Calibration and quality control of all analytical equipment to ensure reproducibility and accuracy across assay runs. | Implied by adherence to laboratory standards and MIQE principles [78] [77]. |
Conclusion
The implementation of MIQE guidelines, particularly the updated MIQE 2.0 standards, is not merely a publication formality but a fundamental requirement for developing reliable, reproducible cancer biomarkers. By integrating MIQE principles throughout the biomarker development pipeline—from sample handling and assay design to data analysis and reporting—researchers can overcome the reproducibility challenges that have plagued qPCR-based studies. The future of cancer biomarker validation lies in harmonizing MIQE with domain-specific standards like MISEV for extracellular vesicle research and adopting a culture of methodological rigor. This approach will accelerate the translation of promising biomarker signatures from discovery into clinically applicable diagnostics, ultimately improving cancer detection, monitoring, and personalized treatment strategies. As qPCR technology continues to evolve, maintaining commitment to these foundational standards will ensure that cancer biomarker research produces clinically meaningful and trustworthy results.
References
- 1. MIQE 2.0 and the Urgent Need to Rethink qPCR Standards [https://www.mdpi.com/1422-0067/26/11/4975]
- 2. MIQE 2.0: Revision of the Minimum Information for ... [https://pubmed.ncbi.nlm.nih.gov/40272429/]
- 3. MIQE Guidelines | Thermo Fisher Scientific - US [https://www.thermofisher.com/us/en/home/life-science/pcr/real-time-pcr/real-time-pcr-assays/why-choose-taqman-assays/publish-real-time-pcr-results.html]
- 4. MIQE compliance in clinical biomarker discovery [https://www.europeanpharmaceuticalreview.com/article/37398/miqe-compliance-in-expression-profiling-and-clinical-biomarker-discovery/]
- 5. Consensus guidelines for the validation of qRT-PCR ... [https://www.sciencedirect.com/science/article/pii/S2329050122000018]
- 6. MIQE-Compliant Validation of MicroRNA Biomarker ... [https://pubmed.ncbi.nlm.nih.gov/31578685/]
- 7. Obtaining Reliable RT-qPCR Results in Molecular ... [https://www.mdpi.com/2075-1729/12/3/386]
- 8. a roadmap for DNA methylation biomarkers in liquid biopsies [https://www.nature.com/articles/s41388-025-03624-5]
- 9. MIQE 2.0: Revision of the Minimum Information for ... [https://www.foodauthenticity.global/blog/miqe-2-0-revision-of-the-minimum-information-for-publication-of-q]
- 10. MIQE précis: Practical implementation of minimum standard ... [https://bmcmolbiol.biomedcentral.com/articles/10.1186/1471-2199-11-74]
- 11. The MIQE guidelines: minimum information for publication ... [https://pubmed.ncbi.nlm.nih.gov/19246619/]
- 12. Obtaining Reliable RT-qPCR Results in Molecular ... [https://pmc.ncbi.nlm.nih.gov/articles/PMC8953338/]
- 13. MIQE: Real-Time PCR Experiment Standards [https://www.sigmaaldrich.com/US/en/technical-documents/technical-article/genomics/qpcr/minimum-information-for-publication-of-quantitative-real-time-pcr-experiments?srsltid=AfmBOoqYl1pXC2qZGz3dEYQAjlxmTxNfrfxeExM16tu4qEW2HimQpbOW]
- 14. MIQE 2.0 and the Urgent Need to Rethink qPCR Standards [https://pmc.ncbi.nlm.nih.gov/articles/PMC12154065/]
- 15. MIQE Guidelines for Digital PCR [https://bitesizebio.com/20356/miqe-guidelines-for-digital-pcr/]
- 16. MISEV and MIQE: integrating domain-specific and general ... [https://www.oaepublish.com/articles/evcna.2025.68]
- 17. A pipeline for the development and analysis of extracellular ... [https://www.sciencedirect.com/science/article/pii/S0098299724000281]
- 18. Novel DNA methylation biomarkers show high sensitivity and ... [https://clinicalepigeneticsjournal.biomedcentral.com/articles/10.1186/s13148-019-0757-3]
- 19. Extracellular vesicles as biomarkers for endometrial cancer [https://pmc.ncbi.nlm.nih.gov/articles/PMC12493225/]
- 20. Exosomal biomarkers in cancer: Insights from Multi-OMIC ... [https://www.sciencedirect.com/science/article/abs/pii/S0009898125004851]
- 21. Extracellular Vesicles as Diagnostic Biomarkers in Cancer [https://www.trillium.de/en/journals/trillium-extracellular-vesicles/archive/2025/trillium-extracellular-vesicles-2025/review/ev-diagnostics-extracellular-vesicles-as-diagnostic-biomarkers-in-cancer-from-technological-advances-to-clinical-translation.html]
- 22. How to integrate MISEV and MIQE standards for EV ... [https://www.linkedin.com/posts/vesiculab_extracellularvesicles-exosomes-misev-activity-7387729660002009088-G9sa]
- 23. Is Your RNA Intact? Methods to Check RNA Integrity [https://www.thermofisher.com/us/en/home/references/ambion-tech-support/rna-isolation/tech-notes/is-your-rna-intact.html]
- 24. Methods of RNA Quality Assessment [https://www.promega.com/resources/pubhub/methods-of-rna-quality-assessment/]
- 25. Best practices for RNA storage and sample handling [https://www.qiagen.com/us/knowledge-and-support/knowledge-hub/bench-guide/rna/introduction/general-remarks-on-rna-handling-storage-and-stabilization]
- 26. Designing a TaqMan Gene Expression Assay [https://www.thermofisher.com/us/en/home/life-science/pcr/real-time-pcr/real-time-pcr-learning-center/gene-expression-analysis-real-time-pcr-information/designing-taqman-gene-expression-assay.html]
- 27. Design PCR primers and check them for specificity - NCBI - NIH [https://www.ncbi.nlm.nih.gov/guide/howto/design-pcr-primers]
- 28. Reliable Gene Expression Analysis by Reverse ... [https://pmc.ncbi.nlm.nih.gov/articles/PMC4247583/]
- 29. Reverse Transcription Reaction Setup [https://www.thermofisher.com/us/en/home/life-science/cloning/cloning-learning-center/invitrogen-school-of-molecular-biology/rt-education/reverse-transcription-setup.html]
- 30. a comprehensive analysis in MCF-7 breast cancer cell line [https://bmcmolcellbiol.biomedcentral.com/articles/10.1186/s12860-020-00313-x]
- 31. Selection of suitable reference genes for accurate ... - PMC [https://pmc.ncbi.nlm.nih.gov/articles/PMC1557528/]
- 32. Selection and validation of reference genes for RT-qPCR ... [https://pubmed.ncbi.nlm.nih.gov/40450038/]
- 33. Identification of new reference genes with stable ... [https://www.nature.com/articles/s41598-021-98869-x]
- 34. Validation of reference genes for the normalization of RT ... [https://pmc.ncbi.nlm.nih.gov/articles/PMC5431254/]
- 35. Identification of Valid Reference Genes for the Normalization ... [https://journals.plos.org/plosone/article?id=10.1371/journal.pone.0117058]
- 36. The validity of circulating microRNAs in oncology [https://www.sciencedirect.com/science/article/pii/S1574789114000489]
- 37. Insights from meta-analysis and experimental validation ... [https://www.nature.com/articles/s41598-025-04322-8]
- 38. Identification of robust and abundant reference transcripts for ... [https://pmc.ncbi.nlm.nih.gov/articles/PMC12199199/]
- 39. Extracellular vesicle-associated transcriptomic and ... [https://www.nature.com/articles/s41598-025-18319-w]
- 40. Evaluation of PCR-enhancing approaches to reduce ... [https://www.sciencedirect.com/science/article/abs/pii/S0048969724069250]
- 41. Overcoming qPCR Inhibitors: Strategies for Reliable ... [https://www.promegaconnections.com/overcoming-qpcr-inhibitors-strategies-for-reliable-quantification/]
- 42. PCR Biosystems Introduces Advanced Inhibitor-Tolerant ... [https://pcrbio.com/blog/2024/07/23/pcr-biosystems-introduces-advanced-inhibitor-tolerant-qpcr-mixes-for-superior-detection-on-challenging-samples/]
- 43. Removal of PCR Inhibitors by Silica Membranes [https://pmc.ncbi.nlm.nih.gov/articles/PMC88425/]
- 44. Validation of a Real-Time PCR Assay for Fully Automated ... [https://pmc.ncbi.nlm.nih.gov/articles/PMC12299169/]
- 45. Development and clinical validation of a novel multiplex ... [https://www.nature.com/articles/s41598-025-16434-2]
- 46. Tips for coping with PCR inhibitors [https://www.npdn.org/newsletter/2020/12/article/3]
- 47. Extending the dynamic range of biomarker quantification ... [https://www.nature.com/articles/s41467-023-39772-z]
- 48. International society of liquid biopsy (ISLB) perspective on ... [https://pmc.ncbi.nlm.nih.gov/articles/PMC12164225/]
- 49. Optimization of library preparation based on SMART for ... [https://bmcgenomics.biomedcentral.com/articles/10.1186/s12864-021-08132-w]
- 50. Optimizing RNA-Seq Strategies for Transcriptomic Analysis ... [https://pmc.ncbi.nlm.nih.gov/articles/PMC6288342/]
- 51. Introductory Chapter: Molecular Diagnostics in the Era of ... [https://www.intechopen.com/chapters/1236960]
- 52. Types of Replicates: Technical vs. Biological [https://www.licorbio.com/blog/technical-and-biological-replicates]
- 53. Distinguishing Between Biological and Technical ... [https://pmc.ncbi.nlm.nih.gov/articles/PMC6595250/]
- 54. Preparation for blood tests: what can go wrong before the ... [https://pubmed.ncbi.nlm.nih.gov/40861406/]
- 55. Why Pre-Analytical Variables Can Make or Break Your Assay [https://mtgroupbio.com/the-hidden-challenge-in-assay-development-why-pre-analytical-variables-can-make-or-break-your-assay/]
- 56. Understanding qPCR Efficiency and Why It Exceeds 100% [https://biosistemika.com/blog/qpcr-efficiency-over-100/]
- 57. PCR Troubleshooting: Common Problems and Solutions [https://www.mybiosource.com/learn/pcr-troubleshooting-common-problems-and-solutions/]
- 58. Quartet RNA reference materials improve the quality of ... [https://www.nature.com/articles/s41587-023-01867-9]
- 59. Benchmarking of RNA-sequencing analysis workflows ... [https://www.nature.com/articles/s41598-017-01617-3]
- 60. Do results obtained with RNA-sequencing require ... [https://pmc.ncbi.nlm.nih.gov/articles/PMC7823214/]
- 61. Real-Time PCR (qPCR) and Whole-Transcriptome NGS [https://www.thermofisher.com/us/en/home/life-science/pcr/real-time-pcr/ngs-comparison.html]
- 62. Digital PCR: from early developments to its future application ... [https://pubs.rsc.org/en/content/articlehtml/2025/lc/d5lc00055f]
- 63. Comparative Performance of Digital PCR and Real-Time RT ... [https://pmc.ncbi.nlm.nih.gov/articles/PMC12474457/]
- 64. Analyzing qPCR data: Better practices to facilitate rigor and ... [https://www.sciencedirect.com/science/article/pii/S2405580825004431]
- 65. Comparison of Next-Generation Sequencing, Real-Time ... [https://www.mdpi.com/2076-2607/13/10/2344]
- 66. Validation of Analytical Methods for Biomarkers Employed ... [https://pmc.ncbi.nlm.nih.gov/articles/PMC2744124/]
- 67. Fit-for-purpose biomarker method validation for application ... [https://www.nature.com/articles/6605910]
- 68. Sensitivity and Limit of Detection [https://www.sciencedirect.com/science/article/abs/pii/S092234870870220X]
- 69. A review on specific and sensitive analytical method ... [https://ijpca.org/archive/volume/10/issue/1/article/22024]
- 70. Method Detection Limit - Frequent Questions [https://www.epa.gov/cwa-methods/method-detection-limit-frequent-questions]
- 71. Method Validation - The Detection Limit Experiment [https://www.westgard.com/lessons/basic-method-validation/lesson29.html]
- 72. High sensitivity and specificity analysis of multiple miRNAs [https://pubmed.ncbi.nlm.nih.gov/40701713/]
- 73. Critical appraisal of quantitative PCR results in colorectal ... [https://pmc.ncbi.nlm.nih.gov/articles/PMC5528534/]
- 74. The MIQE Guidelines' tenth anniversary: The good and bad ... [https://www.sciencedirect.com/science/article/abs/pii/S2452014420300443]
- 75. Recommendations for Method Development and ... [https://link.springer.com/article/10.1208/s12248-023-00880-9]
- 76. Comparison of real-time PCR and nCounter NanoString ... [https://pmc.ncbi.nlm.nih.gov/articles/PMC12217074/]
- 77. Exploring Biomarker -Based Multivariate Index Algorithm as a Tool in... [https://link.springer.com/article/10.1007/s12291-025-01362-9]
- 78. of Prognostic Multivariate in... | PLOS One Analysis Biomarkers [https://journals.plos.org/plosone/article?id=10.1371/journal.pone.0130640]
- 79. of Prognostic Multivariate in Surgically Treated... Analysis Biomarkers [https://pubmed.ncbi.nlm.nih.gov/26107255/]