Managing Variants of Uncertain Significance in NGS: Strategies for Researchers and Drug Developers
The management of Variants of Uncertain Significance (VUS) is a central challenge in next-generation sequencing (NGS), directly impacting diagnostic clarity, drug development pipelines, and clinical trial design.
Managing Variants of Uncertain Significance in NGS: Strategies for Researchers and Drug Developers
Abstract
The management of Variants of Uncertain Significance (VUS) is a central challenge in next-generation sequencing (NGS), directly impacting diagnostic clarity, drug development pipelines, and clinical trial design. This article provides a comprehensive guide for researchers and drug development professionals, exploring the foundational principles behind VUS and the technical limitations that create them. It delves into advanced methodological approaches, including machine learning and explainable AI, for variant prioritization and interpretation. The content further addresses practical troubleshooting and optimization strategies to minimize VUS rates and concludes with a critical evaluation of validation frameworks and comparative analyses of computational tools, offering a roadmap for integrating robust VUS management into precision medicine.
Understanding VUS: Origins, Impact, and the Scale of the Challenge in Modern Genomics
A Variant of Uncertain Significance (VUS) is a genetic variant identified through genomic testing where it is unclear whether it is connected to a health condition [1]. In clinical reporting, a VUS is a distinct classification, separate from "benign," "likely benign," "likely pathogenic," or "pathogenic" [2] [3]. This result occurs when there is insufficient or conflicting evidence regarding the variant's role in disease [2] [4].
The prevalence of VUS is a direct consequence of high-throughput sequencing technologies. They substantially outnumber pathogenic findings in many testing scenarios, and the frequency of VUS detection increases with the amount of DNA sequenced [5]. For example, in a meta-analysis of genetic testing for breast cancer predisposition, the ratio of VUS to pathogenic variants was 2.5 [5].
VUS Classification Spectrum
The following diagram illustrates the standard five-tier variant classification system and the evidence threshold required for a VUS classification.
Frequently Asked Questions (FAQs)
1. What does a VUS result mean for my research or patient's diagnosis? A VUS result is inconclusive. It means that the genetic variant cannot be definitively classified as disease-causing or harmless based on current evidence [1] [4]. Clinical decision-making should not be based on the presence of a VUS alone but on personal and family history and other clinical findings [4].
2. Why are VUS so common in Next-Generation Sequencing (NGS) results? VUS are common because NGS technologies (like whole exome or whole genome sequencing) can analyze millions of DNA fragments simultaneously, revealing vast numbers of rare genetic variations [1] [3]. For many of these rare variants, there is simply not enough population data, functional study results, or family segregation data available for a definitive classification [1] [6].
3. How often are VUS reclassified, and what is the outcome? Reclassification is an ongoing process. Current data suggests that about 10-15% of reclassified VUS are upgraded to "Likely Pathogenic" or "Pathogenic," while the remaining 85-90% are downgraded to "Likely Benign" or "Benign" [5]. However, resolution can be slow; one study noted only 7.7% of unique VUS were resolved over a 10-year period in a major laboratory [5].
4. Does a VUS increase cancer or disease risk? By definition, the risk associated with a VUS is unknown. While the majority of VUS are ultimately reclassified as benign, a minority will be reclassified as pathogenic [5]. It is critical to avoid basing risk assessments or treatment decisions, such as opting for unnecessary surgery, solely on a VUS finding [5] [4].
5. How can I contribute to VUS reclassification? Researchers and clinicians can contribute significantly by:
- Performing Family Segregation Studies: Tracing the variant in other affected and unaffected family members to see if it co-segregates with the disease [1] [4].
- Conducting Functional Studies: Using laboratory assays to determine the biochemical and cellular effects of the variant [1] [3] [6].
- Sharing Data: Submitting findings to public databases like ClinVar, which helps accumulate global evidence for variant interpretation [7] [3].
6. Are some populations more likely to receive a VUS result? Yes, individuals of non-European ancestry are more likely to receive a VUS result. This is due to a severe imbalance in genomic datasets, which are overwhelmingly composed of data from people of European descent. The lack of diverse population data makes it harder to distinguish between common benign variants and disease-causing mutations in underrepresented groups [1] [5].
Troubleshooting Common VUS Challenges
Challenge 1: Interpreting a VUS in a Clinical Report
Problem: A clinical report lists a VUS, and there is pressure to use this information for patient management.
Solution:
- Do not change clinical management based on a VUS [4]. Patient care should be guided by personal and family history.
- Do review the laboratory's interpretation, which should outline all evidence used for the VUS classification [4].
- Do consult with a geneticist or genetic counselor to ensure the result is communicated and understood correctly [2] [7].
Challenge 2: Designing a Study to Minimize VUS
Problem: A research study using large gene panels or whole exome sequencing is generating an unmanageably high number of VUS.
Solution:
- Use Targeted Gene Panels: Well-designed, focused panels that include only genes with strong, definitive evidence for disease association can reduce the identification of VUS without substantial loss of clinical utility [5] [8].
- Implement Rigorous Gene Curation: Before designing a panel, critically evaluate the evidence for each gene's association with the disease of interest to avoid including genes with disputed or refuted evidence [5].
Challenge 3: Functionally Characterizing a VUS in the Lab
Problem: There is a need to determine the functional impact of a specific VUS to resolve its clinical significance.
Solution: Implement a workflow for functional characterization, from initial bioinformatic analysis to complex functional assays.
Detailed Experimental Protocol for Functional Characterization:
In-silico Prediction Analysis:
- Purpose: To computationally predict the potential impact of a missense VUS on protein function.
- Methodology: Run the variant sequence through multiple validated prediction algorithms.
- Key Tools: SIFT (predicts whether an amino acid substitution affects protein function) [9], CADD (Combined Annotation Dependent Depletion; scores the deleteriousness of variants) [9], and GERP (Genomic Evolutionary Rate Profiling; scores constrained elements in multiple alignments) [9].
Family Segregation Analysis:
- Purpose: To determine if the VUS co-occurs with the disease phenotype within a family.
- Methodology: Test other affected and unaffected family members for the presence of the VUS. Strong evidence for pathogenicity is obtained if all affected individuals carry the variant and it is absent in unaffected relatives [5] [4].
- Considerations: The age of onset is critical; testing young, unaffected family members for a late-onset disease may not provide informative evidence [4].
Functional Studies (Cell-Based or Biochemical):
- Purpose: To experimentally measure the direct effect of the VUS on a specific molecular function of the gene.
- Methodology: The assay is chosen based on the known function of the gene (e.g., tumor suppressor, kinase, transcription factor).
- Example Assays:
- Protein Truncation Test: For genes where pathogenic variants are known to cause loss-of-function via premature stop codons.
- Transcript Analysis: To assess if the variant affects RNA splicing or expression levels.
- Cell Growth or Viability Assays: For tumor suppressors or oncogenes, using overexpression or knock-down models.
- Enzyme Activity Assays: If the gene encodes an enzyme with a measurable catalytic function.
Multiplexed Assays of Variant Effect (MAVE):
- Purpose: To systematically measure the functional impact of thousands of variants in a single gene simultaneously [6].
- Methodology: Techniques like deep mutational scanning (DMS) are used to create a library of all possible missense variants in a gene, introduce them into a functional cellular assay, and use high-throughput sequencing to quantify the effect of each variant [6].
- Advantage: This approach can generate functional data for rare VUS that would be impractical to study individually and can help train better in-silico prediction tools [6].
Research Reagent Solutions for VUS Investigation
| Research Reagent | Function in VUS Analysis |
|---|---|
| Targeted Gene Panels | Focused sequencing of genes with strong disease associations to reduce VUS yield [5] [8]. |
| Hybrid-Capture Probes | Single-stranded DNA or RNA baits used in library preparation to enrich for genomic regions of interest prior to sequencing [10] [8]. |
| CLIA-Certified Laboratory | A clinically certified laboratory environment required for performing validated diagnostic genetic tests and interpreting variants [7]. |
| ClinVar Database | A public archive that aggregates reports of the relationships between genetic variants and phenotypes, used as a key resource for variant interpretation [9] [7] [3]. |
| MAVE/DMS Platforms | High-throughput experimental systems for functionally characterizing thousands of genetic variants in parallel within a single gene [6]. |
Quantitative Data on VUS
VUS Prevalence and Reclassification Rates
| Metric | Observed Rate | Context / Source |
|---|---|---|
| General Prevalence in NGS | ~20-40% of patients [6] | Broad range across different genetic tests |
| Hereditary Breast Cancer Testing | VUS to Pathogenic ratio of 2.5 [5] | Metanalysis of breast cancer predisposition studies |
| 80-Gene Panels in Unselected Cancer Patients | 47.4% of patients had a VUS [5] | Study of 2984 cancer patients |
| VUS Reclassification Rate | ~10-15% upgraded to Pathogenic/Likely Pathogenic [5] | Current data on reclassified VUS |
| VUS Resolution Over 10 Years | 7.7% of unique VUS resolved [5] | Data from a major laboratory |
Key Takeaways for Researchers
- VUS are Inherent to NGS: The problem of VUS is a direct consequence of our ability to detect genetic variation far outpacing our knowledge of its biological consequences [3] [6].
- Management over Elimination: The goal is not to eliminate VUS but to manage them responsibly through careful test selection, rigorous interpretation, and active contribution to reclassification efforts.
- Collaboration is Key: Solving the VUS problem requires collaboration between researchers, clinicians, testing laboratories, and patients to share data and generate the evidence needed for definitive classification [4].
In the context of next-generation sequencing (NGS), a variant of uncertain significance (VUS) is a genetic change for which there is not enough evidence to classify it as clearly disease-causing (pathogenic) or harmless (benign) [11] [7]. This uncertainty adds complexity to clinical decision-making and research, as a VUS result fails to resolve the clinical or biological question for which testing was done [5].
VUS are a common finding in genetic testing. For instance, approximately 20% of genetic tests and up to 35% of NGS tests for hereditary breast cancer-related genes identify one or more VUS [11] [7] [12]. The frequency of VUS detections increases with the number of genes analyzed; larger multi-gene panels and exome sequencing generate more VUS findings than smaller, targeted tests [5].
Technical Limitations of NGS Leading to VUS
Inherent Assay Limitations
While NGS is a powerful technology, it has inherent technical limitations that can prevent definitive variant classification. Standard NGS assays can struggle to reliably detect certain types of genetic variations due to limitations in chemistry, sample variability, or bioinformatic processes [13]. These challenging variants include:
- Large insertions/deletions
- Small copy number variants
- Variations in repetitive regions
- Mosaicism (where a variant is present in only a subset of cells) [13]
Furthermore, the reportable range of a standard NGS test is often limited. For example, one laboratory describes its reportable range for DNA panel testing as being tuned to identify variants within an intron up to 20 base pairs from a coding exon and selected known pathogenic intronic regions [13]. Variants outside these regions may not be thoroughly assessed, contributing to uncertainty.
Insufficient Data Quality and Coverage
The quality of NGS data is crucial for confident variant calling. Key metrics like depth of coverage (the number of times a specific nucleotide is read during sequencing) directly impact sensitivity. While some clinical labs strive for an average coverage of 300x to 500x and a minimum of 50x at any position to detect a variant, reduced coverage can lead to ambiguous results [13]. Regions with consistently low or uneven coverage may fail to meet stringent quality metrics, forcing laboratories to report findings as VUS or use orthogonal methods for confirmation [13].
Table 1: NGS Technical Limitations and Their Impact on VUS Classification
| Technical Limitation | Specific Challenge | Consequence for Variant Interpretation |
|---|---|---|
| Assay Chemistry | Difficulty detecting large indels, CNVs, repetitive sequences, and mosaic variants [13]. | Incomplete picture of the genomic variation, potentially missing key pathogenic alterations or leaving uncertainty about the true sequence. |
| Bioinformatic Pipeline | Limitations in algorithms for aligning sequences and calling variants in complex genomic regions [13]. | Potential for false positives or false negatives, requiring manual review and often resulting in a VUS classification when evidence is conflicting. |
| Coverage Uniformity | Gaps in coverage due to sequence-specific biases (e.g., high or low GC content) [14]. | Inability to call variants in regions with poor coverage, or low confidence in variants that are called, leading to uncertainty. |
| Reportable Range | Analysis often limited to coding exons, flanking intronic regions, and selected known non-coding variants [13]. | Inability to assess the impact of variants in deep intronic or regulatory regions, which are often left unanalyzed or reported as VUS. |
Biological and Population Factors Contributing to VUS
The Challenge of Population Diversity in Genomic Databases
A significant biological driver of VUS classification is the severe underrepresentation of non-European ancestries in major public genomic databases like gnomAD [5] [15]. This lack of diversity skews our understanding of normal human genetic variation.
A variant that is genuinely rare and potentially pathogenic in a well-studied population might be a common, benign polymorphism in an underrepresented one. Without adequate population frequency data, computational algorithms may incorrectly flag these common, benign variants as potentially disease-causing, leading to a VUS classification [15]. Research has shown that individuals not of European ancestry are more likely to receive a VUS result due to this disparity [5].
In Silico Prediction and the Evidence Gap
Variant classification relies heavily on in silico prediction tools (e.g., REVEL, SpliceAI) that use computational models to predict the functional impact of a variant [16]. However, these tools are trained on existing datasets, which are biased toward European populations. When a variant is novel or extremely rare in global databases, these predictive tools may provide conflicting or low-confidence results, which is a primary driver of VUS classification [16] [7]. The evidence needed for a definitive classification is often missing, requiring more data from functional studies or observations in multiple families.
Table 2: Biological and Population Factors Leading to VUS
| Biological Factor | Mechanism | Impact on VUS Rates |
|---|---|---|
| Underrepresented Populations | Lack of diverse allele frequency data in public databases (e.g., gnomAD) [15]. | Higher prevalence of VUS in individuals of non-European ancestry [5]. |
| In Silico Prediction Ambiguity | Computational tools provide conflicting or low-confidence predictions for novel missense and non-coding variants [16] [7]. | Variants with moderate or conflicting computational evidence default to VUS. |
| Insufficient Segregation Data | Lack of family studies to track whether a variant co-occurs with disease in multiple relatives (PP1 criterion) [5] [16]. | Inability to use familial patterns to upgrade variant classification from VUS to pathogenic. |
| Phenotype Mismatch or Lack of Specificity | The patient's clinical features do not perfectly match the classic disease associated with the gene (PP4 criterion) [16]. | Reduces the strength of evidence linking the variant to the disease, resulting in VUS. |
Researcher FAQs and Troubleshooting Guide
Q: What is the first thing I should do when my analysis yields a VUS? A: First, confirm the quality of the NGS data at the variant position, including the depth and uniformity of coverage [13]. Then, interrogate multiple population and clinical databases (e.g., gnomAD, ClinVar) to review the variant's frequency and any existing classifications [7] [12].
Q: How can I proactively reduce VUS findings in my study design? A: Use rigorously curated, phenotype-focused gene panels rather than large, indiscriminate panels. The American College of Medical Genetics and Genomics (ACMG) recommends including only genes with strong evidence of a clinical association to reduce the identification of VUS without appreciable loss of clinical utility [5].
Q: A VUS was reclassified in my project. What is the protocol? A: When a VUS is reclassified, the laboratory that performed the test typically issues a revised report [11]. It is critical to have a system for tracking participants' contact information and a protocol for notifying them and their clinical team of the updated result, especially if it is upgraded to pathogenic [11].
Q: What are the key strategies for resolving a VUS? A: Key strategies include [7] [12]:
- Segregation Analysis: Testing other family members to see if the variant tracks with the disease.
- Functional Studies: Conducting lab experiments to assess the variant's effect on protein function.
- Data Sharing: Submitting findings to public databases like ClinVar to contribute to global knowledge.
- Leveraging Diverse Cohorts: Utilizing population-specific data from underrepresented groups to establish accurate allele frequencies [15].
Q: Should clinical management be changed based on a VUS finding? A: No. ACMG guidelines specify that "a variant of uncertain significance should not be used in clinical decision-making" [11]. Clinical management should be based on personal and family history, not on the VUS result.
The Scientist's Toolkit: Research Reagent Solutions
Table 3: Essential Resources for VUS Investigation and Reclassification
| Tool or Resource | Primary Function | Utility in VUS Resolution |
|---|---|---|
| Orthogonal Confirmation Assays (Sanger sequencing, MLPA, PacBio) [13] | To validate the presence of a variant detected by NGS using an independent method. | Confirms the variant is not a technical artifact, providing a solid foundation for further investigation. |
| Population Databases (gnomAD, Korea Variant Archive (KOVA2), ToMMo JPN) [15] | Provides allele frequency data across diverse populations to filter out common polymorphisms. | Critical for determining if a variant is too common to be pathogenic, especially in non-European populations. |
| Variant Interpretation Databases (ClinVar, Deafness Variation Database) [16] [15] | Aggregates classifications and evidence for variants from multiple laboratories and researchers. | Allows researchers to see how other groups have classified the same variant, providing supporting evidence. |
| In Silico Prediction Tools (REVEL, SpliceAI) [16] | Computationally predicts the functional impact of missense and splice-site variants. | Provides supporting evidence for pathogenicity (PP3) or benignity (BP4); conflicting results often lead to VUS. |
| Functional Study Assays (e.g., Sanger RNA sequencing) [16] [7] | Experimentally determines the molecular consequence of a variant, such as its impact on splicing or protein function. | Generates strong (PS3) evidence for reclassifying a VUS, as it directly demonstrates a deleterious effect. |
| Gene-Disease Validity Frameworks (ClinGen) [5] | Systematically evaluates the strength of evidence supporting a gene's association with a disease. | Helps researchers decide whether a VUS in a less-validated gene is a priority for further investigation. |
Experimental Protocols for VUS Resolution
Protocol: Segregation Analysis in Families
Purpose: To determine if a VUS co-segregates with the disease phenotype in a family, providing evidence for pathogenicity (PP1 criterion) [5] [16].
Methodology:
- Family Recruitment: Identify and obtain informed consent from multiple family members, both affected and unaffected by the disease.
- Genotyping: Perform genetic testing (e.g., targeted genotyping or sequencing) for the specific VUS in all recruited family members.
- Analysis: Construct a pedigree and document the genotype of each individual. Analyze whether the VUS is present in all affected individuals and absent in unaffected individuals, which would support a pathogenic role. The strength of evidence increases with the number of informative meiosis studied [16].
Protocol: RNA Sequencing to Assess Splicing Impact
Purpose: To experimentally determine if a VUS (particularly an intronic or synonymous variant) disrupts normal RNA splicing [13] [16].
Methodology:
- Sample Collection: Obtain fresh blood or tissue samples from the patient carrying the VUS and from control individuals.
- RNA Extraction: Isolate total RNA from the samples.
- cDNA Synthesis: Create complementary DNA (cDNA) using reverse transcription.
- Sequencing and Analysis: Sequence the cDNA (via Sanger or NGS) and analyze the data for abnormal splicing patterns, such as exon skipping, intron retention, or the use of cryptic splice sites, compared to controls. This method can extend the reportable range for disease-causing variants deep into introns [13].
FAQs: Understanding Variants of Uncertain Significance (VUS)
What is a Variant of Uncertain Significance (VUS)? A VUS is a genetic variant for which the association with a disease risk is unclear. It is not yet classified as pathogenic (disease-causing) or benign. This classification occurs when there is insufficient genetic data or evidence to determine the variant's clinical impact [17].
Why is VUS reclassification critical for ending the diagnostic odyssey? A precise genetic diagnosis is a gateway to clarity, community, and care. When a VUS is reclassified to pathogenic, it becomes clinically actionable. This can end a patient's diagnostic odyssey by informing treatment options, clinical trial eligibility, and prognosis [18] [17]. Reclassification rates are significant; one study found that 4.8% of VUSs had conflicting interpretations (reported as a VUS by one lab and as pathogenic/likely pathogenic by another), representing a 235% increase in such conflicts over a three-year period [17].
How do VUS findings impact clinical trial design and drug development? VUS findings create challenges for clinical trial design, particularly in patient recruitment and eligibility. The presence of a VUS can make it difficult to select patients with a high probability of treatment response. Literature-derived real-world evidence (RWE) is increasingly used to support the reclassification of VUS to pathogenic, which helps ensure the selection of the right patients for trials. This evidence can expand eligibility criteria without sacrificing precision, potentially accelerating recruitment for rare indications [19].
What are the key ethical and legal challenges associated with VUS reinterpretation? There is an ongoing ethical debate about the responsibility for reanalyzing and recontacting patients about reclassified VUS. While there is a recognized ethical duty to update patients with new information that could impact their care, there is currently no legal obligation for laboratories or clinicians to routinely reassess genetic test results. This creates uncertainty, and practices vary across institutions. A shared-responsibility framework is often proposed, where laboratories monitor new evidence, and clinicians manage patient recontact [20].
Quantitative Impact of VUS
Table 1: Documented Rates of VUS and Reclassification
| Metric | Reported Statistic | Context and Source |
|---|---|---|
| VUS Reclassification Rate (Conflict) | 4.8% (2022) | Percentage of VUSs in an ACMG 113-gene panel with conflicting interpretations (classified as VUS by one lab, pathogenic/likely pathogenic by another); up from 2.9% in 2019 [17]. |
| Increase in VUS Conflicts | 235% | Increase in the number of VUSs in conflict from 2019 to 2022 for the ACMG pre-conception panel [17]. |
| Carrier Frequency with VUS | Up to 50% | Proportion of healthy individuals found to carry a VUS in a study of 118 ciliopathy genes, highlighting the negative predictive value challenge in carrier screening [21]. |
| Overall VUS Reclassification | ~20% (wide range) | In routine clinical practice, approximately 20% of variants are reclassified over time, with most affecting VUSs [20]. |
Table 2: Impact on Drug Development Timelines
| Factor | Impact on Timeline | Notes |
|---|---|---|
| Typical Clinical Development | 9.1 years (95% CI: 8.2-10.0 years) | Baseline for innovative drugs from first-in-human studies to marketing authorization [22]. |
| Orphan Designation | +1.5 years (approx.) | Despite smaller trial sizes, challenges in patient recruitment and natural history understanding can prolong development [22]. |
| Expedited Programs (e.g., Accelerated Approval) | -3.0 years (approx.) | FDA programs can significantly shorten the clinical development path for eligible products [22]. |
Experimental Protocols for VUS Management
Protocol 1: Systematic Reanalysis of Genomic Data
Objective: To periodically re-evaluate VUS classifications using updated genomic databases and literature evidence to provide updated diagnoses.
Methodology:
- Data Extraction: Compile a list of previously identified VUSs from patient exome or genome sequencing data.
- Evidence Synthesis: Systematically query the following resources for new information on each VUS:
- Variant Databases: ClinVar, HGMD.
- Population Frequency Databases: gnomAD.
- Literature Search: Use AI-powered tools like Mastermind to accelerate comprehensive searching of the full text of scientific articles [19].
- Variant Re-classification: Re-assess the variant according to the latest ACMG/AMP guidelines, incorporating new evidence from functional studies, population data, and computational predictions [14] [21].
- Clinical Correlation: Integrate updated patient phenotype information to support or refute the potential pathogenicity of the re-evaluated variant.
Expected Outcome: A systematic review can provide new diagnoses for an additional 13%–22% of previously unsolved cases [20].
Protocol 2: Utilizing Literature-Derived Real-World Evidence (RWE) for Trial Design
Objective: To leverage published patient data to inform clinical trial eligibility and endpoints, especially for rare diseases where VUSs are common.
Methodology:
- Cohort Identification: Systematically curate published case reports, cohort studies, and observational studies from the scientific literature to build a comprehensive dataset of patient experiences [19].
- Variant Curation: Identify and reclassify VUSs within the literature-based cohort using current evidence, effectively expanding the pool of patients with actionable genetic variants [19].
- Endpoint Selection: Analyze the aggregated literature to understand the natural history of the disease, including disease burden, unmet needs, and treatment responses. This helps in selecting clinically meaningful endpoints that matter to patients and regulators [19].
- Control Group Design: Use systematically curated published cohorts to form the basis of external or historical control arms for trials where randomized controls are impractical or unethical [19].
Expected Outcome: More robust and feasible trial designs that are aligned with regulatory expectations and patient experiences, potentially accelerating drug development.
The Scientist's Toolkit: Research Reagent Solutions
Table 3: Essential Resources for VUS Interpretation and Management
| Tool / Resource | Type | Primary Function in VUS Management |
|---|---|---|
| ClinVar | Public Database | Archive of reports of the relationships among human variations and phenotypes, with supporting evidence; used to check for conflicting interpretations [17]. |
| ClinVar Miner | Web Platform | A platform for mining and analyzing data from the ClinVar archive, useful for tracking VUS reporting trends over time [17]. |
| Mastermind | AI-Powered Search | Accelerates variant interpretation by providing immediate insight into the full text of millions of scientific articles, helping to find evidence for reclassification 5-10 times faster [19]. |
| ACMG/AMP Guidelines | Classification Framework | Standardized guidelines for the interpretation of sequence variants, providing the criteria for classifying variants as Pathogenic, VUS, or Benign [17] [21]. |
| gnomAD | Population Database | Database of aggregate population allele frequencies; used to filter out common polymorphisms unlikely to cause rare, penetrant disease (PM2 criterion) [21]. |
| Genome Medical | Telehealth Service | Provides telehealth-based genetic counseling and testing services, which can be crucial for patient recontact and counseling regarding VUS reinterpretations [18]. |
VUS Management and Diagnostic Pathway
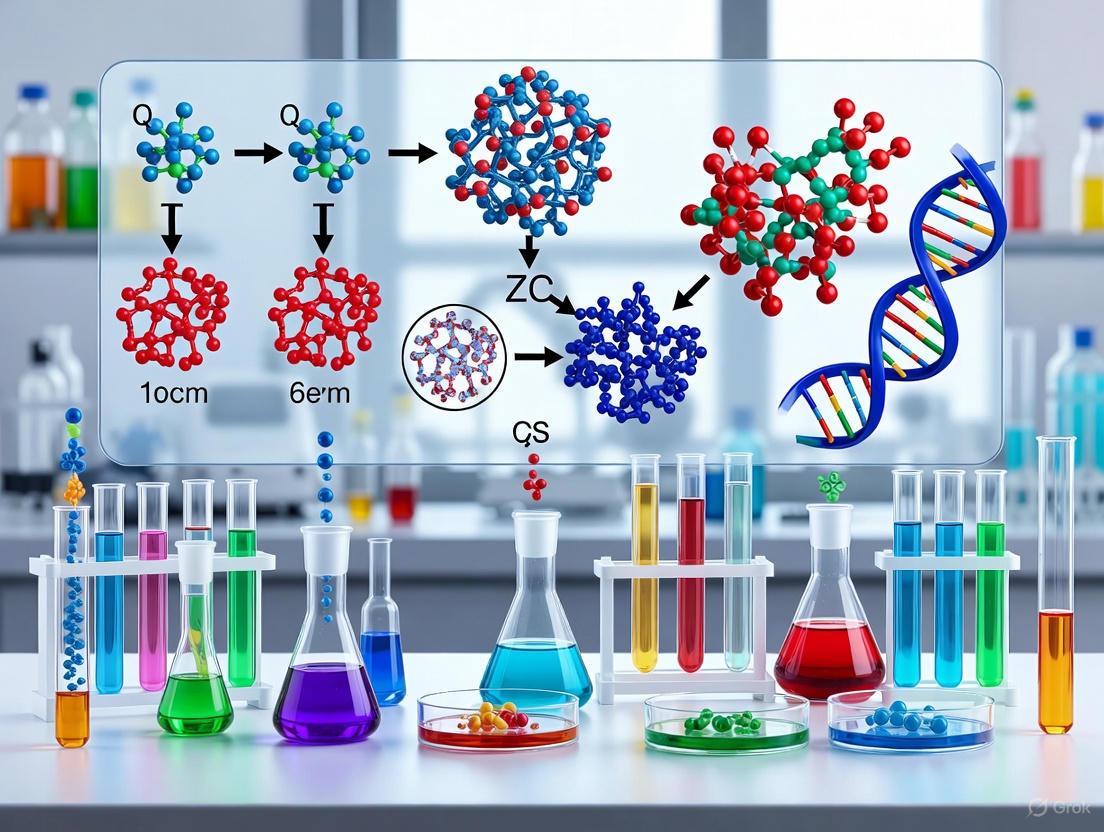
The diagram below outlines the clinical and research pathway for managing a VUS, from initial identification to its potential impact on drug development.
NGS Workflow and VUS Interpretation
The following diagram illustrates the key steps in a Next-Generation Sequencing (NGS) diagnostic workflow where a VUS can be identified and the critical factors influencing its interpretation.
FAQs: Understanding VUS Prevalence Data
How frequently are Variants of Uncertain Significance (VUS) identified in genetic testing?
A VUS is a common finding in clinical genetic testing. In multi-gene panel testing, especially for cardiogenetic conditions, receiving a VUS result is not uncommon [2]. Overall, approximately 20% of all genetic tests identify a variant of uncertain significance [11]. The frequency can be even higher in specific testing scenarios; for example, roughly 35% of individuals undergoing next-generation sequencing (NGS) for hereditary breast cancer-related genes encounter one or more VUS [7]. The probability of finding a VUS increases with the number of genes analyzed, as larger panels cast a wider net for variations [2] [11].
What is the prevalence of VUS in carrier screening, and what incidental findings can occur?
Expanded carrier screening (ECS) assesses the risk of having offspring with autosomal recessive or X-linked conditions. A large-scale, government-funded Australian study (Mackenzie's Mission) that screened over 9,000 couples for more than 1,000 genetic conditions found that 1.9% of screened couples were both carriers of the same condition [23].
Importantly, ECS can also incidentally identify asymptomatic individuals who are potentially affected by a genetic condition. A 2025 retrospective study of 3,001 individuals undergoing ECS found that 0.43% (13 individuals) fell into this category. Of these, five were homozygous or compound heterozygous for autosomal recessive diseases, and eight were heterozygous for X-linked diseases. The vast majority (85%, 11 of 13) were asymptomatic at the time of assessment [24].
How does VUS prevalence impact research on rare diseases?
VUS pose a significant challenge in the diagnosis and research of rare diseases. A descriptive analysis of the ClinVar database for variants associated with the term "rare diseases" (yielding 94,287 variants) found that the majority of variants were categorized as VUS [9]. This highlights that determining the clinical consequences of genetic variants is a central task in genomics, and VUS represent a critical bottleneck in the diagnostic odyssey for millions of patients affected by rare diseases worldwide.
Experimental Protocols for VUS Classification and Resolution
Protocol 1: Clinical VUS Classification Workflow
This protocol outlines the standard method for classifying variants based on American College of Medical Genetics and Genomics (ACMG) guidelines [2] [9].
1. DNA Sequencing & Variant Calling:
- Perform Next-Generation Sequencing (NGS) using Whole Genome Sequencing (WGS), Whole Exome Sequencing (WES), or a targeted multi-gene panel [9].
- Align sequences to a reference genome and call variants.
2. Evidence Collection & Curation: Collect and weigh different lines of evidence using the following key resources:
- Population Frequency Databases: Query databases like the Genome Aggregation Database (gnomAD) to assess the frequency of the variant in the general population. A frequency too high for the disease in question is evidence for benign classification [2].
- Variant Annotation Databases: Use clinical repositories like ClinVar and dbSNP to review existing classifications and evidence from other laboratories [7] [9].
- Computational Prediction Tools: Run in-silico algorithms to predict the functional impact of the variant (e.g., SIFT, PolyPhen-2, CADD, GERP) [9].
- Literature Review: Search published scientific literature for any functional or clinical data associated with the variant.
3. ACMG Criteria Scoring & Classification:
- Integrate all collected evidence using the ACMG/AMP scoring rubric, which combines differently weighted pathogenic and benign criteria [2].
- Assign a final classification: Benign (B), Likely Benign (LB), Variant of Uncertain Significance (VUS), Likely Pathogenic (LP), or Pathogenic (P) [2] [11].
4. Reclassification Over Time:
- A VUS is not a permanent label. As new evidence emerges, variants are reclassified.
- One study found that 91% of reclassified VUS were downgraded to "benign," while only 9% were upgraded to "pathogenic" [11].
- Laboratories should have processes for periodic re-evaluation and issue revised reports [7] [11].
Protocol 2: Family Segregation Studies for VUS Resolution
This protocol is used to gather additional evidence on a VUS by testing its co-segregation with the disease within a family.
1. Proband Identification:
- Identify the original patient (proband) in whom the VUS was found and who has a confirmed clinical diagnosis and/or a strong family history.
2. Family Member Recruitment & Sample Collection:
- Recruit biologically related family members, prioritizing those with and without the clinical phenotype.
- Obtain informed consent and collect DNA samples (e.g., via saliva or blood) from participating relatives.
3. Targeted Genotyping:
- Perform targeted genetic testing on the recruited family members specifically for the VUS in question.
4. Co-segregation Analysis:
- Analyze whether the presence of the VUS tracks with the presence of the disease across generations.
- Interpretation: If the VUS is found in all affected relatives and is absent in unaffected relatives, this provides evidence supporting pathogenicity. A lack of co-segregation is evidence for a benign variant [11].
Table 1: VUS Prevalence Across Different Testing Contexts
| Testing Context | Key Prevalence Finding | Study / Citation Details |
|---|---|---|
| General Genetic Testing | ~20% of tests identify a VUS | [11] |
| Hereditary Cancer Panels (NGS) | ~35% of tests identify one or more VUS | Based on hereditary breast cancer gene testing [7] |
| Carrier Screening (Couple Risk) | 1.9% of couples were found to be at-risk carriers | Mackenzie's Mission study (n>9,000 couples) [23] |
| Carrier Screening (Self Risk) | 0.43% of individuals were potentially affected | Incidental finding; 85% were asymptomatic [24] |
| Rare Disease Variants | Majority of variants in ClinVar are VUS | Based on 94,287 variants tagged with "rare diseases" [9] |
Table 2: VUS Reclassification Outcomes
| Reclassification Direction | Frequency | Implication for Clinical Care |
|---|---|---|
| VUS to Benign/Likely Benign | 91% of reclassified VUS | Prevents unnecessary medical interventions and patient anxiety [11] |
| VUS to Pathogenic/Likely Pathogenic | 9% of reclassified VUS | Enables targeted screening, prevention, and management for patients and families [11] |
The Scientist's Toolkit: Research Reagent Solutions
| Research Reagent / Resource | Function in VUS Analysis |
|---|---|
| ClinVar Database | Public archive of reports on the relationships between human variants and phenotypes, with supporting evidence; used to view existing classifications [7] [9]. |
| Genome Aggregation Database (gnomAD) | Catalog of population frequency data from large-scale sequencing projects; used to assess if a variant is too common to be causative for a rare disease [9]. |
| In-silico Prediction Tools (SIFT, CADD) | Computational algorithms that predict the potential functional impact of a genetic variant on the resulting protein, informing pathogenicity assessments [9]. |
| American College of Medical Genetics and Genomics (ACMG) Guidelines | The standard framework for variant interpretation, providing rules for combining evidence to assign a clinical classification (Pathogenic, VUS, Benign) [2] [9]. |
| CLIA-approved Laboratory | A clinical laboratory meeting the Clinical Laboratory Improvement Amendments (CLIA) quality standards; essential for validating and reporting patient results [7]. |
Visualizing VUS Management Workflows
VUS Interpretation Pathway
VUS Resolution Strategies
What is the ACMG/AMP framework and why is it important?
The American College of Medical Genetics and Genomics and the Association for Molecular Pathology (ACMG/AMP) guidelines provide an internationally accepted standard for interpreting sequence variants in clinical genetics [25]. Established in 2015, this framework classifies variants into five categories—Pathogenic (P), Likely Pathogenic (LP), Variant of Uncertain Significance (VUS), Likely Benign (LB), and Benign (B)—based on 28 evidence criteria that span population data, computational predictions, functional data, and segregation evidence [9] [26] [25]. This standardization is crucial because next-generation sequencing (NGS) technologies like Whole Exome Sequencing (WES) and Whole Genome Sequencing (WGS) can identify 80,000-100,000 genetic variants per individual, requiring systematic prioritization to pinpoint the one or two disease-causing variants relevant to rare diseases [25].
How does the quantitative framework for ACMG/AMP criteria work?
The ACMG/AMP framework is compatible with Bayesian statistical reasoning, allowing for quantitative specification of evidence strength [26]. The Sequence Variant Interpretation (SVI) Working Group has estimated the odds of pathogenicity for different evidence levels, which scale by an approximate power of 2.0 [26]. The table below summarizes these quantitative relationships:
Table: Quantitative Evidence Strength in the ACMG/AMP Framework
| Evidence Level | Odds of Pathogenicity | Approximate Probability of Pathogenicity |
|---|---|---|
| Supporting (P) | 2.08:1 | 67.5% |
| Moderate (M) | 4.33:1 | 81.2% |
| Strong (S) | 18.7:1 | 94.9% |
| Very Strong (VS) | 350:1 | 99.7% |
Troubleshooting VUS Classifications
Why do VUS pose such a significant challenge in clinical diagnostics?
Variants of Uncertain Significance (VUS) represent genetic changes whose impact on health and disease risk cannot be determined with current evidence [9] [5]. They substantially outnumber pathogenic findings—for example, in an 80-gene cancer panel, 47.4% of patients had a VUS compared to 13.3% with pathogenic/likely pathogenic findings [5]. The challenge is compounded by several factors:
- Interpretation complexity: VUS include diverse mutation types (missense, nonsense, in-frame indels) with different potential impacts on protein function [9]
- Reclassification delays: Only about 7.7% of unique VUS were resolved over a 10-year period in cancer-related testing [5]
- Clinical consequences: Patients and clinicians may find it difficult to ignore VUS results, potentially leading to unnecessary procedures, adverse psychological effects, and complex clinical decision-making [5]
Why does the generic ACMG/AMP framework struggle with VUS resolution?
The standard ACMG/AMP guidelines have several limitations that hinder consistent VUS classification:
- Lack of specificity: The original 28 criteria lack specificity and are subject to varied interpretations, failing to capture relevant aspects of clinical molecular genetics [27]
- Overly generic application: The "one-size-fits-all" approach doesn't account for gene- and disease-specific mechanisms [28]
- Subjective implementation: Differences in how criteria are applied, particularly for functional evidence (PS3/BS3 codes), contribute to variant interpretation discordance between laboratories [29]
- Insufficient guidance: The original guidelines didn't provide detailed guidance on how functional evidence should be evaluated [29]
Advanced Refinements & Solutions
What refined frameworks address ACMG/AMP limitations?
Several systematic refinements have been developed to enhance the specificity and consistency of variant classification:
- Sherloc: A comprehensive refinement that introduces 108 detailed specifications to the original 33 ACMG-AMP rules, separating ambiguous criteria into discrete rules with refined weights and replacing the "clinical criteria" style with additive, semiquantitative criteria [27]
- Gene-specific specifications: ClinGen Variant Curation Expert Panels (VCEPs) develop disease- and gene-specific adaptations, such as those for RASopathies and BRCA1/2 genes, which dramatically improve classification accuracy [30] [31]
- acmgscaler: An R package and Google Colab notebook that provides standardized gene-level variant effect score calibration within the ACMG/AMP framework, preventing selective adjustments or overfitting [28]
Table: Comparison of ACMG/AMP Framework Implementations
| Framework | Key Features | VUS Reduction Impact | Best Application Context |
|---|---|---|---|
| Standard ACMG/AMP | 28 generic criteria, 5-tier classification | Limited (≈20% VUS reclassification) | Broad initial screening |
| Sherloc | 108 refined rules, discrete evidence weighting, prevents overcounting | Significant improvement over standard | General clinical diagnostics |
| Disease-specific VCEP specs | Gene-disease specific thresholds, calibrated evidence | Dramatic (83.5% VUS reduction in BRCA1/2) | Defined genetic disorders |
| acmgscaler | Computational calibration, converts functional scores to ACMG strengths | Enables standardized reanalysis | Research and batch processing |
How can functional evidence be consistently applied to resolve VUS?
The ClinGen SVI Working Group developed a structured framework for applying functional evidence (PS3/BS3 codes) that includes four critical steps [29]:
- Define the disease mechanism - Understand the molecular pathway and protein function
- Evaluate applicability of assay classes - Determine which assay types are appropriate for the gene and disease
- Assess specific assay validity - Validate the technical performance with control variants
- Apply to variant interpretation - Determine appropriate evidence strength based on validation
The framework specifies that a minimum of 11 total pathogenic and benign variant controls are required to reach moderate-level evidence in the absence of rigorous statistical analysis [29].
Functional Evidence Evaluation Workflow
Research Reagent Solutions
Table: Essential Research Reagents for VUS Functional Characterization
| Reagent / Tool Category | Specific Examples | Primary Function in VUS Resolution |
|---|---|---|
| Splicing Assay Systems | Mini-gene constructs, RT-PCR protocols | Validate impact on mRNA splicing for intronic and exonic variants [32] |
| Functional Domain Assays | Protein truncation tests, enzyme activity assays | Assess effect on protein function and stability [32] [29] |
| Population Databases | gnomAD, dbSNP, dbVar, genome aggregation databases | Determine variant frequency across populations [9] [26] |
| Variant Effect Predictors | CADD, SIFT, GERP, REVEL | Computational prediction of variant impact [9] |
| Disease-Specific Models | iPSCs, animal models, cellular systems | Context-specific functional validation [32] [29] |
| Variant Curation Platforms | ClinGen specifications, ClinVar, UCSC Genome Browser tracks | Standardized interpretation and classification [30] [31] |
Experimental Protocols for VUS Resolution
Protocol: Functional Validation of Missense VUS Using Splicing Assays
Background: Approximately 20% of missense mutations are pathogenic, but elucidating their precise mechanism can be challenging, particularly when they affect splicing regulation [32].
Methodology:
- Construct Design: Clone genomic fragments containing the VUS into exon-trapping vectors with flanking intronic sequences [32]
- Transfection: Transfer constructs into appropriate cell lines (HEK293T, HeLa) using standardized protocols
- RNA Analysis: Extract total RNA 48h post-transfection, perform RT-PCR with vector-specific and endogenous primers
- Product Characterization: Separate PCR products by electrophoresis, sequence aberrant bands to identify splicing defects
- Validation: Compare with wild-type controls and known pathogenic variants; repeat with three biological replicates
Troubleshooting Tips:
- Include positive controls (known splicing variants) and negative controls (wild-type sequence)
- For genes with long coding sequences, consider alternative approaches like minigene assays with selected exons [32]
- Use multiple computational prediction tools (CADD, SIFT, SpliceAI) to prioritize variants for functional testing [9]
Protocol: Applying Quantitative ACMG/AMP Criteria with Bayesian Framework
Background: The Bayesian statistical framework enables more precise evidence weighting for variant classification [26].
Implementation Steps:
- Establish Prior Probability: Determine baseline pathogenicity probability based on gene and mutation type
- Calculate Evidence Odds: Apply quantitative odds ratios for each evidence type (Supporting=2.08:1, Moderate=4.33:1, etc.)
- Combine Evidence: Multiply odds ratios from multiple evidence sources
- Determine Posterior Probability: Convert combined odds to posterior probability using standard Bayesian methods
- Assign Final Classification: Map posterior probability to ACMG/AMP categories using established thresholds
Example Application: For a variant with one Strong (18.7:1) and one Moderate (4.33:1) evidence: Combined odds = 18.7 × 4.33 = 81:1; Posterior probability = 81/(81+1) = 98.8%, supporting "Pathogenic" classification [26].
VUS Resolution Decision Pathway
Advanced Methodologies for VUS Interpretation and Prioritization
Leveraging Machine Learning and Explainable AI (X-AI) for Variant Prioritization
Core Concepts: ML and XAI in Genomics
Frequently Asked Questions
What is the primary challenge in variant prioritization that ML aims to solve? Next-generation sequencing (NGS) generates a vast number of variants per sample, and traditional computational tools often struggle with the sheer volume, complexity of biological signals, and technical artifacts. Machine learning (ML) models, particularly deep learning, can model nonlinear patterns, automate feature extraction, and improve interpretability across these large-scale datasets, helping to identify the clinically relevant variants among thousands of candidates [33].
Why is Explainable AI (XAI) crucial for clinical variant prioritization? Successful ML models are often so complex that their reasoning is opaque, making them "black boxes." In biomedical contexts, trust and understanding are paramount. Explainable AI (XAI) techniques make the predictions of these models intelligible to end-users, such as clinical geneticists. This transparency allows clinicians to understand the evidence behind a variant's prioritization, which is essential for building clinical trust, verifying biological plausibility, and making informed diagnostic decisions [34] [35] [36].
What is a Variant of Uncertain Significance (VUS) and how can ML help? A Variant of Uncertain Significance (VUS) is a genetic variant identified in a patient's genome where it is unclear whether it is connected to a health condition. This often occurs because the variant is very rare. ML and XAI can help by systematically integrating diverse evidence—such as population frequency, functional predictions, and phenotype data—to provide a more data-driven assessment of the variant's potential pathogenicity, thereby aiding in the reclassification of VUS [1] [37].
What are the common types of features or evidence used by ML prioritization tools? Modern ML-based variant prioritization systems integrate multiple types of features:
- Variant Pathogenicity Predictions: In-silico scores predicting the deleteriousness of a variant (e.g., from PolyPhen-2, SIFT) and more advanced universal pathogenicity predictors [35] [36].
- ACMG/AMP Guidelines: Evidence codes from the standard guidelines for variant interpretation, such as population frequency, segregation data, and functional data [35].
- Phenotype-Gene Matching: Semantic similarity scores between a patient's clinical symptoms (encoded as HPO terms) and known gene-disease associations [38] [35] [36].
- Inheritance Patterns & Quality Metrics: Family history, segregation patterns, and technical quality control metrics to reduce false positives [38] [35].
Implementation and Workflow
The following diagram illustrates a generalized, high-level workflow for integrating ML and XAI into a variant prioritization pipeline, from raw data to an explainable candidate list.
Experimental Protocol: Optimizing an Exomiser/Genomiser Run
Objective: To implement a data-driven, optimized parameter set for the Exomiser/Genomiser tools to maximize the diagnostic yield for rare diseases from exome (ES) and genome sequencing (GS) data.
Background: While Exomiser is a widely used open-source tool for phenotype-driven variant prioritization, limited guidelines exist for optimizing its many parameters. Systematic optimization can significantly improve its performance [38].
Methodology:
Input Data Preparation:
- VCF File: Use a multi-sample VCF file (GRCh38) from the proband and relevant family members, generated by a validated bioinformatics pipeline (e.g., Sentieon) [38].
- Phenotype Data: Provide a comprehensive list of the proband's clinical features as HPO terms. The quality and quantity of HPO terms directly impact performance. These should be curated from medical records and clinical evaluations using tools like PhenoTips [38].
- Pedigree File: Supply a PED-formatted file detailing family relationships.
Parameter Optimization: Based on a benchmark of diagnosed cases, the following optimizations are recommended over default settings [38]:
- Gene-Phenotype Association: Prioritize algorithms that leverage high-quality gene-disease associations.
- Variant Pathicity Predictors: Use an updated, optimized set of in-silico predictors.
- Frequency Filters: Apply gene-specific or disease-specific allele frequency filters.
- Inheritance Mode: Ensure the analysis is configured for the correct mode of inheritance (e.g., autosomal recessive, de novo).
Execution:
- Run Exomiser for protein-coding variants and Genomiser for non-coding regulatory variants. It is recommended to use Genomiser as a complementary tool to Exomiser due to the high noise in non-coding regions [38].
- Process the data using the optimized parameters detailed above.
Output Analysis:
- Review the top-ranked candidate variants and genes from the Exomiser/Genomiser output.
- For complex cases, apply secondary refinement strategies to the results, such as using p-value thresholds or flagging genes that are frequently top-ranked but rarely associated with true diagnoses [38].
Expected Results: This optimized process has been shown to significantly improve diagnostic variant ranking. For GS data, the percentage of coding diagnostic variants ranked in the top 10 increased from 49.7% (default) to 85.5% (optimized). For ES, the top 10 ranking improved from 67.3% to 88.2% [38].
Troubleshooting Guides
FAQ: Addressing Common Experimental Issues
We have a candidate variant ranked highly by our ML tool, but the clinical team is skeptical of the "black box" prediction. How can we build trust? Leverage the explainability (XAI) features of your prioritization tool. For instance, use systems like SeqOne's DiagAI dashboard or the 3ASC platform, which break down the final score into contributing components [35] [36]. Present the clinical team with:
- The specific ACMG/AMP evidence codes that were automatically annotated for the variant (e.g., PVS1 for a null variant in a loss-of-function gene) [35].
- A visualization of phenotype-match, showing how the patient's HPO terms align with known phenotypes of the candidate gene [36].
- A feature contribution breakdown from a method like SHAP, which quantifies how much each data point (e.g., allele frequency, conservation score) contributed to the high ranking [35] [36]. This transforms a blind prediction into an evidence-based argument.
Our prioritization pipeline keeps missing known diagnostic variants in validation. What could be going wrong? This is a common issue often related to over-stringent filtering or suboptimal model parameters. Consider the following steps:
- Audit your pre-filtering steps: Highly sensitive pipelines should avoid filtering out variants based solely on factors like low call quality or higher-than-expected population frequency, as these can sometimes be characteristics of true diagnostic variants (e.g., due to incomplete penetrance or technical artifacts) [35].
- Optimize tool parameters: As demonstrated with Exomiser, moving from default to optimized parameters can dramatically recover missed diagnoses. Systematically benchmark your tool's performance on a set of known solved cases to find the best settings for your lab [38].
- Incorporate features for false-positive reduction: Instead of hard filtering, train or use an ML model that incorporates features related to false-positive risk (e.g., sequencing quality metrics, inheritance pattern mismatches) as part of its scoring. This allows the model to down-weight, rather than exclude, potentially problematic variants [35].
We are overwhelmed by the number of VUS in our results. How can we triage them for further investigation? An ML-based approach can systematically triage VUS. Focus on tools that provide:
- Integrated Evidence Scoring: Prioritize VUS that have accumulating evidence from multiple independent sources, such as a high pathogenicity prediction score and a strong match to the patient's phenotype [35] [37].
- ACMG/AMP Criterion Pre-annotation: Use a system like 3ASC that pre-annotates VUS with relevant ACMG/AMP criteria. A VUS with several supporting (PP) pieces of evidence is a stronger candidate for reclassification than one with no evidence [35].
- Cross-Referencing with Functional Data: In research settings, integrate functional genomic data where available. For example, in one study, decreased gene expression profiles from transcriptome data were used as key evidence to support the pathogenicity of VUS in genes like HDAC8 and CASK [35].
Performance and Benchmarking
The table below summarizes the performance of various ML-based variant prioritization tools as reported in recent studies.
Table 1: Performance Comparison of Selected Variant Prioritization Tools
| Tool / Model Name | Core Methodology | Reported Performance (Recall) | Key Strengths |
|---|---|---|---|
| 3ASC (Random Forest) [35] | Integrates ACMG/AMP criteria, phenotype similarity, & deep learning pathogenicity scores. | Top 1 Recall: 85.6%Top 3 Recall: 94.4% | High sensitivity; explainable via annotated evidence & feature contribution (SHAP). |
| Exomiser (Optimized) [38] | Phenotype-driven (HPO) prioritization combining variant and gene-based scores. | Top 10 Recall (ES): 88.2%Top 10 Recall (GS): 85.5% | Widely adopted open-source tool; significant performance gain with parameter optimization. |
| LIRICAL [35] | Statistical framework calculating posterior probability of diagnoses using likelihood ratios. | Top 10 Recall: 57.1% (in external validation study) | Provides a probabilistic interpretation for each candidate diagnosis. |
Research Reagent Solutions
The following table lists key software tools and resources essential for setting up an ML-based variant prioritization pipeline.
Table 2: Key Resources for ML-based Variant Prioritization
| Resource Name | Type | Function in the Workflow |
|---|---|---|
| Exomiser/Genomiser [38] | Open-Source Software | A core prioritization tool for coding (Exomiser) and non-coding (Genomiser) variants, integrating frequency, pathogenicity, and phenotype (HPO) data. |
| Human Phenotype Ontology (HPO) [38] | Controlled Vocabulary | Provides standardized terms for describing patient phenotypes, which is crucial for the phenotype-driven prioritization used by most modern tools. |
| 3ASC [35] | Prioritization Algorithm | An explainable algorithm that annotates variants with ACMG/AMP criteria and uses a random forest classifier for ranking. |
| SHAP (SHapley Additive exPlanations) [35] | Explainable AI (XAI) Library | A model-agnostic method to explain the output of any ML model by quantifying the contribution of each feature to the final prediction. |
| DiagAI Score (SeqOne) [36] | Commercial Platform | An example of a commercial AI-driven variant ranking system with a transparent dashboard explaining the score via pathogenicity, phenotype, and inheritance rules. |
FAQs: Core Concepts and Tool Fundamentals
What are the key upcoming changes in the ACMG/AMP V4 guidelines, and how should I prepare? The forthcoming ACMG V4 update introduces a points-based system for more nuanced variant interpretation, replacing the static rules of the current version. Key changes include the integration of Gene-Disease Validity assessments, refined evidence types, and the introduction of decision trees. To prepare, you should standardize the use of in-silico prediction tools (like REVEL), develop systems for proband counting for PS4 evidence, and implement structured tracking for segregation analysis (PP1) and in-trans observations (PM3) [39].
Which newly calibrated computational tools can now provide Strong (PP3) evidence for pathogenicity? A 2025 calibration study by the ClinGen Sequence Variant Interpretation Working Group determined that three new computational predictors—AlphaMissense, ESM1b, and VARITY—can provide evidence for variant pathogenicity at a Strong level when used at their calibrated thresholds. This expands the scope of tools available for clinical variant classification, offering evidence strength comparable to some functional assays for certain variants [40] [41].
How does the new 'Reflex to Full Curation' workflow in QCI Interpret operate? In the QCI Interpret 2025 release, cases processed using the pre-curation service can now be seamlessly submitted for full manual curation without creating a new test. This requires an add-on Reflex license and ensures that uncurated variants identified during automated analysis can efficiently receive full expert review, bridging the gap between automated filtering and deep manual assessment [42].
Our lab specializes in PALB2 testing. Are there gene-specific guidelines for interpreting PALB2 variants? Yes. The Hereditary Breast, Ovarian, and Pancreatic Cancer (HBOP) Variant Curation Expert Panel (VCEP) has published gene-specific specifications for PALB2. These specifications advise against using 13 standard ACMG/AMP codes, limit the use of six codes, and tailor nine others to create a conservative approach for PALB2 variant interpretation, leading to improved concordance compared to existing ClinVar entries [43].
FAQs: Implementation and Troubleshooting
How can I resolve inconsistencies when applying PP3/BP4 criteria across different in-silico tools? Inconsistent PP3/BP4 application is often due to a lack of standardized score thresholds. The Calibrated Classification Package in OpenCRAVAT directly addresses this by implementing the ClinGen SVI Working Group's standardized procedure. This open-source tool provides calibrated, evidence-strength classifications for multiple predictors (like REVEL, BayesDel, and CADD), mapping their scores directly to ACMG/AMP categories for more reproducible interpretation [44].
What is the best way to handle a variant where computational predictions conflict with other evidence types? First, ensure you are using the most recently calibrated thresholds for your computational tools to maximize their reliability. The updated ClinGen recommendations state that at calibrated thresholds, tools like AlphaMissense provide evidence comparable to functional assays. When conflict remains, consult gene-specific guidelines from the relevant ClinGen VCEP (e.g., for RASopathies or PALB2), which often provide tailored guidance for weighing conflicting evidence. Furthermore, preview the upcoming ACMG V4 points-based system in platforms like QCI Interpret, as it is designed to better handle the balancing of pathogenic and benign evidence [40] [43] [30].
Our automated pipeline needs to comply with IVDR. What quality control and documentation steps are critical? For IVDR compliance, your automated pipeline must ensure strict documentation and traceability. Implement automated liquid handling systems with integrated Laboratory Information Management Systems (LIMS) for real-time tracking of samples and reagents. Use quality control tools (e.g., omnomicsQ) for real-time genomic sample monitoring to flag low-quality samples before analysis. Participation in External Quality Assessment (EQA) programs like those from EMQN and GenQA is also crucial for cross-laboratory standardization [45].
How can we efficiently phase variants to apply the PM3 (recessive, in trans) criterion in our automated workflow? Phasing is critical for confirming in-trans status for PM3. Updated RASopathy specifications from the ClinGen VCEP, which may serve as a baseline for other Mendelian disorders, provide refined criteria for applying PM3 based on confirmed phasing data. To support this in your workflow, leverage the enhanced support for long-read sequencing data in analysis platforms (e.g., Golden Helix), which allows for the use of variant phase information to explore potential compound heterozygous variants [30] [46].
Essential Experimental Protocols
Protocol 1: Calibrating a Computational Tool for PP3/BP4 Evidence Using ClinGen's Method
Purpose: To determine evidence strength thresholds (Supporting, Moderate, Strong, Very Strong) for a computational predictor's scores, enabling its standardized use for PP3 (pathogenic) and BP4 (benign) evidence in ACMG/AMP variant classification.
Methodology (as implemented in the OpenCRAVAT Calibrated Classification Package and detailed in ClinGen studies) [44] [41]:
- Variant Dataset Curation: Assemble a benchmark dataset of known pathogenic and benign variants. The established method uses high-confidence variants from ClinVar, carefully excluding any variants that were part of the training sets for the tools being calibrated to prevent bias.
- Tool Prediction: Run the benchmark variant set through the computational tool to obtain prediction scores for every variant.
- Posterior Probability Calculation: For a series of potential score thresholds, calculate the posterior probability of pathogenicity. This involves determining the proportion of variants above a threshold that are pathogenic and the proportion below that are benign.
- Evidence Strength Threshold Mapping: Map the posterior probabilities to the defined evidence strength levels based on the ACMG/AMP framework. The calibration procedure establishes specific score thresholds for the tool that correspond to Supporting, Moderate, Strong, and Very Strong levels of evidence for both pathogenicity (PP3) and benignity (BP4).
Protocol 2: Implementing a Gene-Specific ACMG/AMP Guideline
Purpose: To accurately apply a gene-disease-specific modification to the general ACMG/AMP guidelines, as developed by a ClinGen Variant Curation Expert Panel (VCEP).
Methodology (based on the process for PALB2 and RASopathy genes) [43] [30]:
- Acquire Specification Document: Obtain the official gene-specific specification document from the ClinGen website or peer-reviewed literature (e.g., "Specifications of the ACMG/AMP variant curation guidelines for germline PALB2 sequence variants").
- Integrate into Curation Platform: Ensure your variant interpretation software (e.g., QCI Interpret) supports the integration of these custom rules. This may involve configuring the system to disable certain ACMG/AMP codes, limit the use of others, or modify the evidence strength of specific criteria as directed by the VCEP.
- Pilot with Test Variants: Before full implementation, test the updated guidelines on a set of pilot variants with known classifications to ensure the new rules produce expected and consistent results. The PALB2 VCEP, for example, tested 39 pilot variants [43].
- Full Implementation and Training: Roll out the gene-specific guidelines to the curation team. Conduct training sessions to ensure all curators understand the modifications, such as adjusted population frequency cutoffs or the non-use of certain evidence codes.
Research Reagent Solutions
Table: Key Computational Tools and Resources for ACMG/AMP Implementation
| Tool/Resource Name | Type | Primary Function in Variant Interpretation |
|---|---|---|
| REVEL [42] [39] | In-Silico Predictor | An ensemble method for predicting the pathogenicity of missense variants; increasingly recommended as a standard tool. |
| SpliceAI [42] | In-Silico Predictor | An AI-based tool that annotates variants with their predicted impact on splicing. |
| AlphaMissense [40] [41] | In-Silico Predictor | A new deep learning-based tool for missense variant pathogenicity prediction, calibrated to provide Strong (PP3) evidence. |
| OpenCRAVAT Calibrated Package [44] | Calibration Resource | An open-source tool that provides pre-calibrated evidence strength classifications for multiple computational predictors. |
| ClinGen CSpec Registry [47] | Guideline Repository | A centralized database storing the gene-specific ACMG/AMP criteria specifications defined by Variant Curation Expert Panels. |
| CancerKB [46] | Knowledge Base | A curated knowledgebase for somatic variants in cancer, supporting variant interpretation and reporting. |
Workflow and Pathway Diagrams
Automated VUS Resolution Workflow
Variant Interpretation Process Evolution
Next-generation sequencing (NGS) has revolutionized rare disease diagnosis and cancer genomics, but has simultaneously created a massive interpretive challenge: the variant of uncertain significance (VUS). A VUS is a genetic variant where available evidence is insufficient to classify it as either pathogenic or benign [1]. The scale of this problem is substantial—clinical genetic testing identifies VUS results in approximately 41% of cases using multi-gene panels, and they can be found in up to 50% of pediatric genetic disease cases involving rare structural variants [48].
The fundamental challenge lies in the biological interpretation of these variants. While NGS technologies excel at detecting genetic variations, determining their functional consequences on gene expression, protein function, and ultimately cellular processes requires integration of evidence across multiple biological layers [48]. This technical support center provides frameworks and methodologies for researchers to address this challenge through integrated multi-omics approaches, particularly focusing on transcriptomics and structural biology to resolve VUS classification.
FAQs: Core Concepts for Researchers
Q1: What exactly constitutes a VUS, and why is resolving them so critical for genomic medicine?
A VUS represents an ambiguous genetic finding where existing evidence cannot determine whether the variant contributes to disease [1]. The clinical significance is unknown, creating substantial challenges for patient management. Resolving VUS is critical because:
- They represent a major bottleneck in diagnostic yield—successful reclassification can significantly improve diagnostic rates [48]
- Current data indicates only 7.7% of unique VUS were resolved over a 10-year period in one major laboratory's cancer-related testing [5]
- In rare disease diagnostics, multi-omics approaches have demonstrated potential to increase diagnostic yield from 47% to 54% [49]
- Misinterpretation can lead to inappropriate clinical management, including unnecessary surgeries and surveillance [5]
Q2: How can transcriptomics specifically help resolve VUS classification?
RNA sequencing (RNA-seq) provides functional evidence by capturing how variants affect gene expression and splicing:
- Detects aberrant splicing patterns caused by non-coding variants that might otherwise be classified as VUS [49]
- Identifies allele-specific expression imbalances suggesting functional impact [49]
- Reveals quantitative expression outliers that may indicate haploinsufficiency or dominant-negative effects [49]
- Provides evidence for reclassification through demonstrated molecular effects on transcription [50]
In one study, integration of RNA-seq data enabled diagnoses in patients who remained undiagnosed after whole-genome sequencing alone [49].
Q3: What experimental design considerations are crucial for transcriptomics in VUS resolution?
- Tissue relevance: RNA should ideally come from tissue relevant to the disease phenotype [49]
- Sequencing depth: Sufficient coverage is needed to detect splicing defects and allele-specific expression
- Control comparisons: Matched control samples are essential for establishing normal expression ranges
- Multi-modal integration: Transcriptomics is most powerful when combined with genomic and epigenomic data [51]
Q4: What role does structural biology play in VUS interpretation?
Structural biology approaches provide mechanistic insights by:
- Predicting how amino acid substitutions affect protein folding, stability, and binding interfaces
- Identifying disruptive variants in critical functional domains or active sites
- Supporting molecular dynamics simulations to quantify structural perturbations
- Informing functional assays by highlighting potentially disruptive changes
Troubleshooting Guides: Addressing Common Experimental Challenges
RNA-Seq Quality Control and Technical Issues
Table 1: Troubleshooting RNA-Seq Data Quality for VUS Resolution
| Problem | Potential Causes | Solutions |
|---|---|---|
| Poor sample quality | Degraded RNA, improper storage | Use RNA Integrity Number (RIN) >8; implement strict RNA handling protocols; use preservative solutions |
| Low sequencing depth | Insufficient sequencing, library preparation issues | Target 50-100 million reads per sample; optimize library quantification; verify library quality |
| High technical variability | Batch effects, different processing | Randomize processing order; include control samples in each batch; use batch correction algorithms |
| Inability to detect splicing defects | Limited junction reads, poor coverage | Use strand-specific protocols; increase sequencing depth; employ targeted RNA-seq approaches |
| Discordant RNA-DNA correlations | Tissue mismatch, regulatory mechanisms | Ensure tissue-matched samples; consider epigenetic influences; validate with orthogonal methods |
Functional Validation Challenges
Table 2: Addressing Functional Validation Hurdles in VUS Resolution
| Challenge | Impact on VUS Resolution | Mitigation Strategies |
|---|---|---|
| Lack of phenotype data | Major barrier establishing genotype-phenotype correlations [48] | Implement structured phenotyping ontologies (HPO); collaborate clinically for deeper phenotyping |
| Limited functional assay scalability | Slow throughput for rare variants | Develop high-throughput screening platforms; use multiplexed assays; implement CRISPR-based screens |
| Tissue-specific effects | Difficult to model context-specific impacts | Utilize iPSC-derived cell types; employ organoid models; leverage single-cell technologies |
| Computational prediction limitations | Inaccurate variant effect predictions | Ensemble multiple algorithms; integrate evolutionary and structural constraints; use machine learning approaches |
Experimental Protocols: Methodologies for VUS Resolution
Integrated Multi-Omics Workflow for VUS Annotation
The following diagram illustrates the comprehensive multi-omics workflow for systematic VUS resolution:
Transcriptomic Analysis Pipeline for Splicing Validation
Protocol: Detecting Splicing Defects from RNA-Seq Data
This protocol specifically addresses how to validate putative splice-altering VUS using transcriptomic data:
Step-by-Step Methodology:
Library Preparation and Sequencing
- Use ribosomal RNA depletion rather than poly-A selection to preserve non-coding RNAs and detect more splicing events
- Target 50-100 million paired-end reads (2x150bp) for adequate junction coverage [50]
- Include positive and negative control samples when possible
Splice-Aware Alignment
- Use STAR or HISAT2 aligners with genome annotation guide (GTF file)
- Ensure high mapping rates (>85%) and junction saturation
- Retrieve unmapped reads for potential novel junction discovery
Splicing Quantification
- Quantify junction reads supporting canonical and non-canonical splicing events
- Calculate Percent Spliced In (PSI) metrics for alternative exons
- Compare against matched controls or large normative datasets (GTEx)
Statistical Analysis and Visualization
- Implement differential splicing analysis using rMATS or LeafCutter
- Apply multiple testing correction (FDR < 0.05)
- Visually validate findings using IGV with Sashimi plots
Case Example: In a study of episodic ataxia, RNA-seq validated a pathogenic splice variant in ELOVL4 (c.541+5G>A) that was initially classified as VUS. Long-read sequencing confirmed the splicing defect, enabling definitive reclassification [50].
Structural Impact Prediction Protocol
Protocol: Computational Assessment of Protein Structural Consequences
This protocol details how to predict the structural impacts of missense VUS:
Template Identification
- Retrieve homologous structures from PDB or use AlphaFold2 predictions
- Prioritize structures with high sequence identity (>30%) and coverage (>80%)
Structural Modeling
- Generate mutant protein models using Rosetta, FoldX, or similar tools
- Compare electrostatic surfaces, residue burial, and interaction networks
Stability and Dynamics Prediction
- Calculate ΔΔG folding energy changes
- Perform molecular dynamics simulations to assess conformational flexibility
- Identify potential allosteric effects or interaction interface disruptions
Functional Domain Mapping
- Map variants to known functional domains and active sites
- Assess conservation across orthologs using ConSurf
The Scientist's Toolkit: Essential Research Reagents and Platforms
Table 3: Research Reagent Solutions for Multi-Omics VUS Resolution
| Category | Specific Solutions | Function in VUS Resolution |
|---|---|---|
| Sequencing Technologies | Illumina NovaSeq X Series [51] | Production-scale WGS and RNA-seq for comprehensive variant detection |
| PacBio Revio, Oxford Nanopore | Long-read sequencing for phasing, structural variants, and isoform resolution [49] | |
| Single-Cell Multi-Omics | 10x Genomics Multiome (ATAC + GEX) | Simultaneous chromatin accessibility and gene expression profiling |
| CITE-seq (Cellular Indexing of Transcriptomes and Epitopes by Sequencing) [51] | Combined protein and transcriptome measurement in single cells | |
| Spatial Transcriptomics | Vizgen MERSCOPE Ultra [52] | Subcellular resolution spatial mapping of RNA distribution in tissue context |
| 10x Genomics Visium | Spatial gene expression profiling maintaining tissue architecture | |
| Functional Validation | CRISPR-based screening libraries | High-throughput functional assessment of variant effects |
| Prime editing systems | Precise introduction of VUS into model systems for functional testing | |
| Analysis Platforms | Illumina Connected Multiomics [51] | Integrated analysis environment for multi-omic data interpretation |
| DRAGEN Secondary Analysis [51] | Accelerated secondary analysis of NGS data | |
| Partek Flow software [51] | User-friendly bioinformatics for multi-omic data visualization |
Advanced Applications: Connectivity Mapping and Drug Discovery
The integration of transcriptomics with connectivity mapping approaches enables not only VUS resolution but also therapeutic discovery. Connectivity mapping measures similarity between transcriptomic profiles and gene signatures related to cellular targets using the "universal language" of genes [53]. This approach can:
- Link chemical treatments to biological mechanisms through transcriptomic fingerprints [53]
- Identify potential normalizing compounds for disease-associated gene expression patterns [54]
- Support drug repurposing by connecting established drugs to novel molecular mechanisms
In Parkinson's disease research, this approach identified six genetic driver elements (2 genes and 4 miRNAs) and suggested normalizing small molecules that could counteract disease-associated transcriptional changes [54].
Resolving VUS requires moving beyond single-omics approaches to integrated multi-omics strategies. By systematically combining genomic, transcriptomic, and structural evidence, researchers can transform ambiguous variants into classified variants with clear clinical implications. The protocols, troubleshooting guides, and resource tables provided here offer a roadmap for implementing these approaches in both research and clinical settings.
The future of VUS resolution lies in continued technological advancements, expanded functional datasets, and collaborative data sharing—ultimately enabling more precise genetic diagnosis and expanding the therapeutic opportunities for patients with rare diseases and cancer.
The 3ASC (Explainable Algorithm for variant prioritization) is a machine learning system designed to address the critical challenge of identifying disease-causing genetic variants among the tens of thousands found in an individual's genome. In the context of managing Variants of Uncertain Significance (VUS) in Next-Generation Sequencing (NGS) research, 3ASC provides a framework for prioritizing variants with higher sensitivity and interpretability compared to previous methods [55]. The system integrates various features related to clinical interpretation, including those related to false-positive risk such as quality control and disease inheritance pattern, allowing researchers to move beyond dependence solely on in-silico pathogenicity predictions, which often result in low sensitivity and difficulty interpreting prioritization results [55].
Key Experimental Protocols and Methodologies
Core Architecture and Workflow
The 3ASC system employs a multi-faceted approach to variant prioritization, integrating four primary types of features and evidence [55]:
- ACMG/AMP Evidence Annotation: Each variant is annotated with the 28 criteria defined by the ACMG/AMP (American College of Medical Genetics and Genomics/Association for Molecular Pathology) genome interpretation guidelines.
- Symptom Similarity Scoring: A quantitative score measures the semantic similarity between the known symptoms of a specific disorder and those observed in the patient.
- 3Cnet Functional Impact Prediction: A deep-learning model provides the likelihood that a given amino acid change will impact protein function.
- False-Positive Risk Features: The model incorporates features like quality control metrics and disease inheritance patterns to mitigate false-positive risks.
In its second version (3ASC v2), the system utilizes a Multiple Instance Learning (MIL) framework and Learning to Rank (LTR) techniques. This allows it to simultaneously prioritize different variant types, including single nucleotide variants (SNVs), small insertions and deletions (INDELs), and copy number variants (CNVs), which is a significant advancement over tools that handle only one variant type [56]. The model treats all variants from a patient as a "bag" of instances and predicts the overall genomic test result (the bag label), while using an attention mechanism to identify the causal variant(s) (instance labels) [56].
Model Training and Performance Assessment
In the foundational study, various machine learning algorithms were trained using in-house data from 5,055 patients with rare diseases [55]. The best-performing model was a Random Forest classifier, which achieved a top 1 recall of 85.6% and a top 3 recall of 94.4% in identifying causative variants [55]. Performance was assessed using the recall rate of identifying causative variants in the top-ranked variants. When compared to other tools like Exomiser and LIRICAL on the same datasets, 3ASC demonstrated superior sensitivity, achieving a top 10 recall of 93.7%, compared to 81.4% for Exomiser and 57.1% for LIRICAL [55].
The following table summarizes the key performance metrics of the 3ASC algorithm from the cited studies:
Table 1: 3ASC Algorithm Performance Metrics
| Metric | Performance | Context / Comparison |
|---|---|---|
| Top 1 Recall | 85.6% | Random Forest model on in-house cohort [55] |
| Top 3 Recall | 94.4% | Random Forest model on in-house cohort [55] |
| Top 10 Recall | 93.7% | Superior to Exomiser (81.4%) and LIRICAL (57.1%) [55] |
| Hit Rate @5 (SNV/INDEL+CNV) | 96.8% | 3ASC v2 model prioritizing multiple variant types together [56] |
| Hit Rate @5 (CNV only) | 95.0% | 3ASC v2 model prioritizing CNVs alone [56] |
| CAGI6 SickKids Challenge | 10/14 cases | Causal genes identified, with evidence of decreased gene expression for 6 cases [55] |
Figure 1: The 3ASC variant prioritization workflow, integrating multiple data types and evidence sources for explainable results.
Technical Support Center: FAQs & Troubleshooting
Frequently Asked Questions (FAQs)
Q1: What types of genetic variants can 3ASC prioritize? A1: The initial version (3ASC v1) focused on single nucleotide variants (SNVs) and small insertions/deletions (INDELs). The advanced version (3ASC v2) can simultaneously prioritize multiple variant types, including SNVs, INDELs, and Copy Number Variants (CNVs), within a unified model, which is a distinct advantage over many other publicly available tools [56].
Q2: How does 3ASC improve the interpretability of its predictions for clinical geneticists? A2: 3ASC is designed with explainable AI (X-AI) principles. It annotates each variant with the ACMG/AMP criteria used for interpretation. Furthermore, using techniques like mean decrease in accuracy (MDA) and Shapley Additive Explanations (SHAP), the system can explain how each feature contributed to the final prioritization of a variant, making the results interpretable and actionable for clinicians [55].
Q3: In a research setting focused on VUS, how can 3ASC aid in reclassification? A3: By providing a continuous, evidence-based prioritization score and explicitly linking variants to supporting evidence (ACMG/AMP criteria, phenotype match, etc.), 3ASC helps researchers triage VUS more effectively. Variants ranked highly by 3ASC, especially those with strong feature contributions from multiple domains (e.g., high functional impact and strong phenotype similarity), become prime candidates for further investigative work and potential reclassification [55] [56].
Q4: What input data is required to run the 3ASC algorithm effectively? A4: Effective operation requires:
- Genetic Data: A VCF (Variant Call Format) file from patient NGS (Whole Exome or Whole Genome Sequencing).
- Phenotypic Data: Patient symptoms coded using the Human Phenotype Ontology (HPO) terms, which are crucial for calculating the symptom similarity score [55] [57].
- Reference Data: Access to population frequency databases (e.g., gnomAD), disease-gene-variant knowledgebases (e.g., OMIM, ClinVar), and protein functional databases to compute the necessary features [55] [58].
Troubleshooting Guides
Issue 1: Low Prioritization of a Known Pathogenic Variant
- Potential Cause: Inaccurate or incomplete HPO term annotation for the patient.
- Solution: Manually review and refine the HPO terms describing the patient's clinical presentation. Ensure terms are specific and comprehensive. The symptom similarity score heavily relies on this input [55] [57].
- Investigation Step: Use the model's explainability output to check the feature contribution for the variant in question. If the "symptom similarity" contribution is low, it confirms the issue lies with phenotypic data.
Issue 2: High Ranking of a Putative False Positive Variant
- Potential Cause: Inadequate quality control (QC) metrics or the variant falling in a low-complexity genomic region.
- Solution: 3ASC incorporates features to handle false-positive risks. Review the quality metrics of the sequencing data (e.g., read depth, allele balance, mapping quality) for that specific variant. Cross-check if the variant is in a segmental duplication or other hard-to-map region, which might require orthogonal confirmation [55] [59].
- Investigation Step: The explainable AI output can show if the variant was downgraded by any QC-related features. If not, it may indicate a need for model retraining or additional guardrail metrics in your pipeline.
Issue 3: Inconsistent Performance Across Different Patient Ancestries
- Potential Cause: Underrepresentation of certain ancestral groups in the training data, a common issue in genomic studies.
- Solution: When deploying 3ASC, ensure the training data is as diverse as possible. Benchmark the model's performance stratified by genetic ancestry. Newer models like popEVE, which also uses evolutionary and population data, have been reported to show no significant ancestry bias, highlighting the importance of this consideration [60] [61].
- Investigation Step: Validate the model's prioritization results on an internal cohort with diverse backgrounds to identify any potential performance gaps.
The Scientist's Toolkit: Research Reagent Solutions
Table 2: Essential Resources for Variant Prioritization and Interpretation
| Resource / Tool | Type | Primary Function in Variant Analysis |
|---|---|---|
| Human Phenotype Ontology (HPO) | Phenotype Ontology | Standardized vocabulary for describing patient phenotypic abnormalities; essential for calculating symptom similarity [55] [58]. |
| ACMG/AMP Guidelines | Interpretation Framework | Standardized set of 28 criteria for classifying variant pathogenicity; forms the basis for one of 3ASC's scoring systems [55]. |
| Genome Aggregation Database (gnomAD) | Population Frequency Database | Provides allele frequency data across diverse populations used to filter out common polymorphisms [58] [62]. |
| Online Mendelian Inheritance in Man (OMIM) | Knowledgebase | Comprehensive database of human genes and genetic phenotypes and disorders [58]. |
| Exomiser | Variant Prioritization Tool | A tool for comparison; uses HPO terms and variant data to prioritize variants [55]. |
| SHAP (Shapley Additive Explanations) | Explainable AI Library | Provides post-hoc interpretability for machine learning models, showing the contribution of each feature to a prediction [55]. |
Figure 2: Logical workflow for VUS reclassification using 3ASC outputs, showing how high-ranking VUS become candidates for reclassification.
In the era of high-throughput genome sequencing, the management of Variants of Uncertain Significance (VUS) represents one of the most significant challenges in clinical bioinformatics. Next-Generation Sequencing (NGS) has revolutionized genetic testing but simultaneously creates a "paradoxical relative shortage of answers in the face of massive information" [3]. VUS are genetic variants for which available evidence is insufficient to classify them as clearly pathogenic or benign. Current data indicates they constitute approximately 40% of all variants identified in high-risk cancer genes like BRCA1 and BRCA2, substantially outnumbering pathogenic findings with ratios as high as 2.5:1 in some cancer studies [5] [3]. This article establishes a technical support framework to help researchers navigate the computational complexities of VUS annotation and filtration within their NGS workflows.
FAQs: Addressing Common VUS Workflow Questions
1. What defines a VUS and why are they so problematic in clinical reporting?
A VUS is classified when evidence about its disease association is contradictory, insufficient, or poorly replicated. Following the American College of Medical Genetics and Genomics (ACMG) and Association for Molecular Pathology (AMP) guidelines, variants are categorized into five tiers: Pathogenic, Likely Pathogenic, VUS, Likely Benign, and Benign [3]. The clinical challenge arises because VUS results "fail to resolve the clinical question for which testing was done" and may lead to unnecessary procedures, adverse psychological effects, or uninformative family member testing [5]. Only about 10-15% of reclassified VUS are eventually upgraded to pathogenic, with the majority being downgraded to benign, but this reclassification process is often too slow to benefit most patients [5].
2. Which variant annotation tools provide the most accurate results?
Performance evaluations benchmark annotation tools by their accuracy in generating proper Human Genome Variation Society (HGVS) nomenclature. One study manually curated 298 variants as ground truth and found Ensembl Variant Effect Predictor (VEP) correctly annotated 297 variants (99.7%), followed by Alamut Batch (296 variants, 99.3%), and ANNOVAR (278 variants, 93.3% concordance) [63]. VEP's superior performance was attributed to its usage of updated gene transcript versions. For clinical settings, selecting tools with high accuracy and regular updates is critical for reliable VUS annotation.
3. Can automated tools replace expert interpretation for VUS classification?
While automation shows promise, recent evidence suggests significant limitations. A 2025 evaluation of automated interpretation tools against ClinGen Expert Panel classifications for 256 variants found these tools demonstrated "high accuracy for clearly pathogenic/benign variants" but showed "significant limitations with variants of uncertain significance (VUS)" [64]. The study concluded that "expert oversight is still needed when using these tools in a clinical context, particularly for VUS interpretation" [64]. This indicates automated tools should augment, not replace, human expertise, especially for difficult VUS cases.
4. What strategies can reduce VUS identification in NGS testing?
Two primary approaches can minimize VUS burden:
- Utilize smaller, evidence-based gene panels: Large panels often include genes with "doubtful claims to disease association," increasing VUS detection without clinical utility. Rigorous standards for panel construction focusing on genes with strong clinical evidence can reduce VUS identification [5].
- Implement population-specific databases: VUS rates are higher for patients of non-European ancestry due to limited diversity in genomic datasets. Enhancing diversity in reference populations helps resolve this disparity [5].
5. How are emerging AI technologies impacting VUS interpretation?
Large Language Models (LLMs) show potential but require careful implementation. A 2025 study evaluating GPT-4o, Llama 3.1, and Qwen 2.5 found GPT-4o achieved the highest accuracy (0.7318) in distinguishing clinically relevant variants from VUS, but all models showed tendencies for "overclassification" [65]. Prompt engineering and retrieval-augmented generation (RAG) significantly improved performance, suggesting that optimized AI approaches may soon assist with VUS prioritization and literature curation [65].
Troubleshooting Guides: Addressing VUS Workflow Challenges
Problem 1: Excessive VUS in Multi-Gene Panel Results
Symptoms: Your targeted sequencing panel returns an unexpectedly high percentage (>40%) of VUS, complicating clinical interpretation and reporting.
Diagnosis: This commonly occurs when using excessively large gene panels that include genes with limited or disputed disease associations [5]. Additionally, panels lacking population-specific variant frequency data for your patient demographic will increase VUS rates.
Solution:
- Validate panel design: Regularly review gene-disease associations using resources like ClinGen's Clinical Validity Framework to remove genes with disputed or limited evidence.
- Implement frequency filtering: Utilize population databases (gnomAD, UK Biobank) with adequate representation of your patient's ancestral background.
- Adopt VUS subclassification: Categorize VUS according to likelihood of pathogenicity (e.g., "VUS-favor pathogenic") to guide clinical decision-making despite uncertainty [5].
Prevention: Establish rigorous gene inclusion criteria during test design, prioritizing genes with definitive evidence and established clinical utility. Participate in consortia like ClinGen to access expert-curated gene-disease validity assessments.
Problem 2: Inconsistent VUS Classifications Across Tools
Symptoms: The same variant receives different classifications when processed through different annotation pipelines or interpretation platforms.
Diagnosis: Variant interpretation requires judgment in evaluating evidence, and "laboratories may differ in the classification of a given variant" due to differing implementations of ACMG-AMP guidelines, distinct evidence thresholds, or varying data sources [5] [64].
Solution:
- Standardize evidence application: Implement calibrated interpretation systems that specify evidence strength for specific genes or diseases.
- Utilize consensus approaches: Employ multiple annotation tools and resolve discrepancies through manual review.
- Leverage expert-curated resources: Consult ClinVar, ClinGen, and disease-specific databases (CIViC for cancer) to identify classification consensus.
Prevention: Establish standardized operating procedures documenting specific criteria and evidence sources for variant classification. Participate in external quality assessment programs like those offered by EMQN and GenQA [66].
Problem 3: Low Annotation Tool Performance
Symptoms: Your annotation pipeline produces incorrect HGVS nomenclature or functional predictions that don't match manual curation.
Diagnosis: Using outdated transcript versions, infrequently updated tools, or algorithms with known limitations for specific variant types.
Solution:
- Benchmark tool performance: Conduct regular accuracy assessments against manually curated variant sets specific to your disease focus.
- Prioritize regularly updated tools: Select tools with committed maintenance schedules and transparent versioning.
- Implement ensemble approaches: Combine multiple annotation sources to improve accuracy, acknowledging that even top-performing tools like VEP achieve 99.7% but not 100% accuracy [63].
Prevention: Establish a validation protocol for any new annotation tool or version update before implementing in clinical workflows.
Experimental Protocols for VUS Resolution
Protocol 1: Functional Annotation and In Silico Prediction Pipeline
Purpose: Systematically annotate VUS with functional predictions and population frequency data to prioritize variants for further investigation.
Materials:
- VCF file containing variant calls
- High-performance computing cluster or cloud environment
- Curated database resources (ClinVar, gnomAD, COSMIC)
Methodology:
- Variant Effect Prediction: Process VCF through Ensembl VEP with LOFTEE plugin for loss-of-function annotation, using latest RefSeq transcript set.
- Population Frequency Annotation: Annotate with gnomAD v4.0 population frequencies, focusing on sub-populations relevant to your cohort.
- Pathogenicity Prediction: Apply suite of in silico predictors (REVEL, MetaLR, CADD) to missense variants.
- Clinical Database Integration: Cross-reference with ClinVar, CIViC (for oncology), and disease-specific databases.
- ACMG-AMP Criteria Application: Implement automated ACMG-AMP classification using tools like InterVar or Moon.
Troubleshooting: If computational resources are limited, consider cloud-based solutions (DNAnexus, Terra) that provide pre-configured annotation pipelines. For rare disease applications, tools like AnFiSA offer open-source platforms for variant curation with decision-tree based classification [67].
Protocol 2: VUS Filtration and Prioritization Workflow
Purpose: Filter thousands of variants to identify a manageable number of high-priority VUS for further analysis.
Materials:
- Annotated variant file (VCF or custom format)
- Patient phenotype data (HPO terms preferred)
- Family segregation data (if available)
Methodology:
- Variant Quality Filtering: Apply quality thresholds (DP ≥ 10, GQ ≥ 20, VAF ≥ 0.2 for heterozygotes).
- Population Frequency Filter: Remove variants with population frequency >0.01 in gnomAD or internal databases, adjusted for disease prevalence.
- Impact-Based Prioritization: Prioritize loss-of-function, splice-affecting, and missense variants with high pathogenicity predictions.
- Phenotype Matching: For rare diseases, utilize Exomiser or similar tools to rank genes by phenotype match.
- Segregation Analysis: For familial cases, assess co-segregation with disease in affected relatives.
Troubleshooting: If too few variants remain after filtration, gradually relax population frequency thresholds. If too many variants remain, incorporate additional functional predictions or require multiple lines of supporting evidence.
Workflow Visualization: VUS Analysis Pipeline
Research Reagent Solutions for VUS Analysis
Table: Essential Computational Tools for VUS Workflows
| Tool Category | Representative Tools | Primary Function | Considerations for VUS |
|---|---|---|---|
| Variant Annotation | Ensembl VEP, ANNOVAR, SnpEff | Functional consequence prediction | VEP shows highest accuracy (99.7%); critical for proper HGVS nomenclature [63] |
| Variant Interpretation | InterVar, PathoMAN, VirBot | ACMG-AMP guideline implementation | Performance varies for VUS; expert oversight recommended [64] |
| Clinical Databases | ClinVar, CIViC, ClinGen | Evidence-based classifications | Essential for identifying previously classified variants and evidence sources |
| Population Databases | gnomAD, UK Biobank, TOPMed | Allele frequency across populations | Critical for filtering common polymorphisms; diversity limitations can increase VUS [5] |
| In Silico Predictors | REVEL, CADD, SIFT | Pathogenicity likelihood scores | Combine multiple tools; high false positive rate for rare variants |
| Workflow Platforms | AnFiSA, omnomicsNGS | End-to-end analysis pipeline | AnFiSA offers open-source solution with decision trees for traceable classification [67] |
Advanced VUS Management Strategies
Utilizing Artificial Intelligence in VUS Interpretation
Emerging evidence suggests that AI and machine learning approaches can enhance VUS interpretation, though with important limitations. Deep learning methods are being applied to "boost variant calling precision" and "refine variant prediction" in NGS-based diagnostics [68]. For complex VUS cases, AI systems can process "vast quantities of unstructured data" from medical literature and clinical reports to identify potentially relevant evidence [65]. However, current implementations show that LLMs tend to "assign variants to higher evidence levels, suggesting a propensity for overclassification" [65]. This indicates that while AI can efficiently triage and prioritize VUS for expert review, human oversight remains essential, particularly for final classification decisions.
Regulatory and Quality Assurance Considerations
For laboratories developing VUS interpretation workflows, adherence to regulatory standards ensures result reliability. ISO 13485:2016 defines "requirements for quality management systems specific to medical devices" and is particularly crucial for gaining CE marking under the European Union's In Vitro Diagnostic Regulation (IVDR) [66]. These standards emphasize "documented design and development processes" and "risk management integrated throughout the product lifecycle" [66]. Implementation of automated validation tools like omnomicsV supports laboratories in confirming variant calls and ensuring genomic findings are both accurate and actionable within regulated environments [66].
The bioinformatics workflow for VUS annotation and filtration represents a dynamic frontier in clinical genomics. While current tools like Ensembl VEP provide robust annotation capabilities, and emerging AI technologies offer promising assistance, the complex nature of VUS necessitates multidisciplinary expertise and careful workflow design. By implementing the troubleshooting strategies, experimental protocols, and tool evaluations outlined in this technical support framework, researchers can navigate the challenges of VUS interpretation while contributing to the collective effort to resolve these variants of uncertain significance. The field continues to evolve rapidly, with advances in population genomics, functional assays, and computational methods progressively reducing the burden of VUS in clinical practice.
Optimizing NGS Workflows and Analytical Strategies to Minimize VUS
Pre-Analytical Phase: Sample & Nucleic Acid Handling
FAQ: Why is the pre-analytical phase so critical for minimizing Variants of Uncertain Significance (VUS)?
The quality of the starting material is the foundational step upon which all subsequent data rests. Poor sample quality, degradation, or contamination introduces biases and artifacts during sequencing. These technical artifacts can manifest as false positive variants in the final data, directly contributing to the burden of VUS that clinicians and researchers must grapple with [69]. Ensuring fidelity at this stage is the first and most crucial defense against uninterpretable results.
Troubleshooting Guide: Pre-Analytical Challenges
| Challenge | Root Cause | Impact on Data & VUS Risk | Corrective & Preventive Actions |
|---|---|---|---|
| Low DNA/RNA Yield | - Small biopsy sample- Improper storage- Inefficient extraction kit | - Inadequate library complexity- Uneven coverage- False negatives | - Use DNA binding dyes for accurate quantification [69]- Optimize extraction protocol for sample type- Use whole-genome amplification kits for low-input samples (with caution for bias) [70] |
| Sample Degradation | - Delay in processing- Improper storage conditions (temperature, buffer)- Multiple freeze-thaw cycles | - High pre-library fragmentation- Loss of long fragments- False structural variant calls | - Use gel electrophoresis or Bioanalyzer to check for intact bands [69]- Establish SOPs for immediate processing or flash-freezing- Use fresh samples whenever possible [70] |
| Contamination | - Cross-contamination between samples- Presence of RNase (for RNA)- Foreign DNA/RNA (e.g., microbial) | - Ambiguous variant calls- Chimeric reads- Off-target alignment | - Use dedicated pre-PCR workspace and equipment [70]- Implement UV irradiation and bleach decontamination- Use unique dual indices (UDIs) to identify and remove cross-sample reads [71] |
| Inaccurate Quantification | - Use of non-specific dyes (e.g., spectrophotometry) that detect protein/organic solvent residue | - Failed library prep- Over- or under-clustering on sequencer- Uneven coverage | - Use fluorometric methods (e.g., Qubit) for specific nucleic acid quantification [69]- Check purity via A260/A280 and A260/A230 ratios on NanoDrop [69] |
Research Reagent Solutions: Pre-Analytical Phase
| Item | Function & Importance |
|---|---|
| Fluorometric Quantitation Kits (e.g., Qubit) | Accurately measures concentration of double-stranded DNA or RNA using DNA-binding dyes, critical for normalizing input material. |
| Automated Electrophoresis System (e.g., Bioanalyzer, TapeStation) | Assesses nucleic acid integrity and size distribution, confirming sample quality is suitable for library preparation. |
| Nuclease-Free Water | Ensures no enzymatic degradation of samples during dilution or resuspension. |
| UV Spectrophotometer (e.g., NanoDrop) | Rapidly assesses sample concentration and purity, detecting contaminants from organic compounds or proteins. |
Library Preparation: Building a High-Quality Library
FAQ: How can library preparation artifacts lead to VUS?
Library preparation involves enzymatic and mechanical processes that, if inefficient, create sequencing artifacts. A key issue is PCR duplicates, where the same original DNA fragment is amplified and sequenced multiple times. This can lead to over-representation of a random variant present in that single fragment, making it appear as a recurrent variant in the data [70]. Similarly, inefficient adapter ligation or chimera formation can generate reads that do not accurately represent the original genome, creating false structural variants or SNVs that are classified as VUS [70].
Troubleshooting Guide: Library Preparation
| Challenge | Root Cause | Impact on Data & VUS Risk | Corrective & Preventive Actions |
|---|---|---|---|
| High PCR Duplication Rate | - Insufficient starting material- Excessive PCR cycles- Poor library complexity | - False positive variant calls from a single amplified molecule- Wasted sequencing depth | - Maximize input DNA within kit specifications [70]- Use PCR enzymes designed to minimize bias [70]- Utilize bioinformatics tools (e.g., Picard MarkDuplicates) to identify/remove duplicates [70] |
| Chimeric Reads | - Inefficient enzymatic steps during end-repair or A-tailing- Transposition artifacts in tagmentation-based kits | - Misinterpretation of structural rearrangements- False gene fusions | - Optimize A-tailing procedures to prevent chimera formation [70]- Use validated, robust library prep kits- Employ chimera detection filters in bioinformatic pipelines |
| Low Library Complexity | - Degraded or low-input DNA- Over-amplification | - Incomplete representation of the genome- Gaps in coverage that miss true variants | - Use fluorometry to accurately quantify the final library before sequencing [69]- Check library profile (size and distribution) on an automated electrophoresis device [69] |
| Variable Insert Size | - Over- or under-fragmentation- Inefficient size selection | - Inconsistent coverage- Biases in GC-rich or repetitive regions | - Standardize fragmentation conditions (time, energy, enzyme concentration)- Perform rigorous size selection using magnetic beads or gel electrophoresis |
Library Preparation and Troubleshooting Workflow
Research Reagent Solutions: Library Preparation
| Item | Function & Importance |
|---|---|
| Library Prep Kit (e.g., Hybridization Capture or Amplicon-Based) | Prepares DNA fragments for sequencing by adding platform-specific adapters and sample indexes for multiplexing. |
| Magnetic Beads (Size Selection) | Preferentially binds DNA fragments of desired sizes for clean-up and precise size selection, improving library uniformity. |
| High-Fidelity DNA Polymerase | Reduces errors introduced during PCR amplification, minimizing the creation of false positive variants. |
| Unique Dual Indices (UDIs) | Molecular barcodes that uniquely tag each sample and both ends of each fragment, enabling accurate multiplexing and identification of PCR duplicates. |
Quality Control: Metrics and Validation
FAQ: What are the key QC metrics I should monitor at every stage, and why?
Rigorous QC is non-negotiable for clinical-grade NGS and is a core recommendation of bodies like ACMG, CAP, and CLIA [72]. Monitoring these metrics allows for the proactive identification of issues that would otherwise manifest as VUS or false negatives in the final data. Key metrics are summarized in the table below.
NGS Quality Control Metrics Table
| QC Stage | Key Metric | Target & Interpretation | Association with VUS |
|---|---|---|---|
| Nucleic Acid QC | DNA Integrity Number (DIN) or RIN | DIN > 7 for genomic DNA [69]. Indicates intact, high-molecular-weight DNA. | Degraded DNA causes uneven coverage and false positives in damaged regions. |
| Library QC | Average Fragment Size | As expected for protocol (e.g., 350-430 bp) [69]. Tight distribution is best. | Incorrect size leads to biased sequencing and mapping errors. |
| Library QC | Library Concentration (qPCR) | Sufficient for cluster generation (e.g., >50 ng/μL) [69]. qPCR is most accurate. | Underloading causes low cluster density; overloading causes overlapping clusters. |
| Sequencing QC | Q30 Score (% bases > Q30) | >80% indicates 99.9% base call accuracy [10]. | Low Q30 scores increase the probability of base-calling errors being misinterpreted as SNVs. |
| Sequencing QC | Cluster Density | Within platform's optimal range (e.g., 170-220 K/mm² for Illumina). | Off-target density leads to low data yield or poor quality. |
| Post-Sequencing QC | Mean Depth of Coverage | Varies by application (e.g., >100x for WGS) [71]. | Low coverage fails to detect real variants or provide enough data to confidently call a VUS. |
| Post-Sequencing QC | Duplication Rate | Low as possible, indicates high library complexity. | High rates suggest low input or amplification bias, increasing risk of false positives [70]. |
NGS Quality Control Gatekeeping Process
Data Generation and Analysis Handoff
FAQ: How do wet-lab practices influence the bioinformatic filtering of VUS?
The wet-lab provides the raw data (FASTQ files) and critical metadata that bioinformatic pipelines use to distinguish true biological variants from technical artifacts. For example, knowing the expected insert size of the library helps the pipeline identify potential structural variants. Batch effects from different library prep kits or sequencing runs can create systematic biases that, if unaccounted for, may be misinterpreted. Furthermore, high-quality DNA and library prep result in more uniform coverage, meaning the bioinformatic pipeline has sufficient data to make a confident call at any given genomic position, reducing uncertainty [71]. Consistent wet-lab practices provide a clean, reliable signal for the dry-lab to analyze.
Frequently Asked Questions (FAQs) on VUS in Carrier Screening
1. What is a Variant of Uncertain Significance (VUS) and why is it a challenge in carrier screening? A Variant of Uncertain Significance (VUS) is a genetic variant for which there is insufficient evidence to classify it as either pathogenic (disease-causing) or benign [73]. In carrier screening, a VUS presents a significant challenge because it cannot be used for clinical decision-making [73]. Reporting a VUS to a healthy couple creates uncertainty about their actual risk of having a child with a genetic disorder, complicating reproductive planning and causing potential psychological distress [5].
2. How common are VUS results in expanded carrier screening (ECS)? VUS are frequently detected in genetic testing and often outnumber definitive pathogenic findings [5]. In genomic testing, the frequency of VUS increases with the number of genes sequenced [5]. This makes VUS a common consideration in ECS panels, which screen for hundreds of genes simultaneously.
3. Should a VUS result change a patient's clinical management or reproductive choices? No. A VUS is not considered clinically actionable [73]. Clinical management, including reproductive decisions and cascade testing of family members, should not be based on a VUS result alone [73]. Decisions should be made on the basis of personal and family history, and clearly pathogenic or likely pathogenic variants identified in the parents.
4. What strategies can be used to resolve a VUS? Several investigative paths can help gather evidence to reclassify a VUS:
- Segregation Analysis: Testing other family members to see if the variant co-occurs with the disease in affected relatives [5] [73].
- Phenotypic Correlation: Reviewing whether the patient's clinical features align with the disease associated with the gene [73].
- Functional Studies: Performing specialized tests (e.g., mRNA studies) to assess the variant's biological impact [73].
- Consulting Multidisciplinary Teams: Discussing the finding in a genomics MDT to pool expertise [73].
5. Can a VUS result change over time? Yes. As more scientific and population data become available, VUS are periodically re-evaluated by testing laboratories. A VUS may be reclassified as Likely Pathogenic, Pathogenic, Likely Benign, or Benign [5]. However, laboratories do not automatically monitor the status of every VUS, so patients may be advised to check back after a few years for updates [73].
Troubleshooting Guide: Addressing VUS in Your Screening Program
Problem 1: High Rate of VUS Findings
- Symptoms: Your ECS program identifies a large number of VUS, overwhelming genetic counseling resources and creating uncertainty for participants.
- Root Causes:
- Use of an ECS panel that includes genes with limited or disputed evidence for disease association [5].
- Lack of population-specific data for accurate variant interpretation, especially for under-represented groups [5].
- Testing methodologies that generate a high number of rare, novel variants that are difficult to interpret.
- Solutions:
- Curate Gene Panels Rigorously: Adopt ECS panels that include only genes with strong, definitive evidence of association with clinically significant disorders [5].
- Leverage Population Databases: Utilize large, diverse population frequency databases (like gnomAD) to filter out common polymorphisms.
- Implement AI and Computational Tools: Use machine learning models and in-silico prediction tools (like SIFT, CADD) to help prioritize variants for review, though these should not be the sole evidence for classification [9] [74].
Problem 2: Inconsistent Variant Interpretation
- Symptoms: Different laboratories or analysts within the same lab classify the same variant differently (e.g., as VUS vs. Likely Pathogenic).
- Root Causes:
- Solutions:
- Standardize Internal Protocols: Use standardized variant interpretation frameworks like the ACMG/AMP guidelines and consider more granular systems like the "ABC" system or GAVIN for challenging cases [9].
- Promote Data Sharing: Contribute anonymized variant data to public repositories like ClinVar to build a global evidence base [5] [9].
- Regular Team Review: Hold regular multidisciplinary team (MDT) meetings to discuss and reach consensus on difficult variant classifications [73].
Problem 3: Communicating VUS Results Effectively
- Symptoms: Patients and even referring physicians misinterpret VUS results, leading to unnecessary anxiety or inappropriate clinical actions (e.g., opting for invasive procedures) [5].
- Root Causes:
- The term "uncertain significance" is inherently difficult to communicate.
- Lack of pre-test counseling to set appropriate expectations.
- Solutions:
- Enhanced Genetic Counseling: Implement thorough pre-test and post-test genetic counseling to ensure participants understand the possibility and meaning of a VUS result [75].
- Clear Reporting: Draft patient-friendly reports that explicitly state that a VUS is not a positive result and should not alter medical management [73].
Quantitative Benchmarks in Carrier Screening
The table below summarizes key metrics from recent large-scale ECS studies, illustrating carrier frequencies and at-risk couple detection rates.
Table 1: Performance Metrics from Recent Expanded Carrier Screening (ECS) Studies
| Study Cohort | Cohort Size | Carrier Rate (≥1 P/LP variant) | Most Common AR Conditions Identified | At-Risk Couple (ARC) Detection Rate | Citation |
|---|---|---|---|---|---|
| Anhui Province, China | 2,530 individuals | 38.50% (974/2,530) | DFNB4 (3.08%), DFNB1A (2.81%), Wilson disease (2.57%) | 4.12% (20/486 couples) | [76] |
| Jiangxi Province, China | 6,308 individuals | 38.43% (2,424/6,308) | α-thalassemia, GJB2-hearing loss, Krabbe disease, Wilson's disease | 2.65% (36/1,357 couples) | [77] |
Table 2: Variant Classification and Reclassification Dynamics
| Variant Category | Probability of Pathogenicity | Clinical Actionability | Typical Reclassification Outcome | Citation |
|---|---|---|---|---|
| Pathogenic | >99% | Yes, guides clinical decisions | N/A | [73] |
| Likely Pathogenic | >90% | Yes, guides clinical decisions | N/A | [73] |
| VUS (Uncertain Significance) | 10% - 90% | No, not clinically actionable | ~10-15% are upgraded to (Likely) Pathogenic; the rest are downgraded to Benign [5] | [5] [73] |
| Likely Benign | <10% | No | N/A | [73] |
| Benign | <0.1% | No | N/A | [73] |
Experimental Protocol: A Framework for VUS Investigation in a Carrier Screening Context
The following workflow provides a systematic approach for investigating a VUS identified in a healthy carrier screening participant.
Title: VUS Investigation Workflow
Methodology:
Database Interrogation:
- Purpose: To gather existing evidence on the variant from global and population-specific databases.
- Procedure: Query the variant in public repositories like ClinVar, gnomAD, and locus-specific databases (LSDBs). Look for existing classifications, allele frequencies, and any previously published functional or clinical data [9] [73].
In-silico Analysis:
- Purpose: To computationally predict the potential functional impact of the variant.
- Procedure: Run the variant through multiple bioinformatics prediction tools such as SIFT, PolyPhen-2, CADD, and REVEL. Consistency across multiple tools can strengthen the evidence for or against pathogenicity [9].
Familial Segregation Analysis:
- Purpose: To determine if the variant tracks with the disease phenotype in a family.
- Procedure: If possible, test biologically related family members for the presence of the VUS. In a carrier screening context for a recessive condition, finding the VUS in trans with a known pathogenic variant in an affected child would be strong evidence for pathogenicity. Finding it in a healthy adult, especially one who is homozygous, supports a benign interpretation [5] [73].
Functional Studies:
- Purpose: To provide experimental evidence of the variant's effect on gene function.
- Procedure: For variants suspected to affect splicing, perform RT-PCR or minigene splicing assays on RNA from the participant or a cell model. For missense variants, consider protein expression studies or specialized enzymatic assays if available and clinically validated [73].
Multidisciplinary Team (MDT) Review:
- Purpose: To synthesize all available evidence and reach a consensus classification.
- Procedure: Present the compiled evidence from steps 1-4 to a panel including clinical geneticists, molecular geneticists, genetic counselors, and bioinformaticians. The team will collectively apply ACMG/AMP guidelines to determine if reclassification is warranted [73].
Table 3: Key Research Reagent Solutions for VUS Interpretation
| Tool / Resource | Category | Primary Function in VUS Interpretation | Example |
|---|---|---|---|
| Variant Classification Guidelines | Framework | Provides a standardized evidence-based framework for interpreting variants. | ACMG/AMP/ACGS Guidelines [9] [73] |
| Population Frequency Databases | Database | Filters out common polymorphisms; provides allele frequency data across diverse populations. | gnomAD, dbSNP, 1000 Genomes [5] [9] |
| Clinical Variant Databases | Database | Repository of crowd-sourced variant interpretations and supporting evidence. | ClinVar [9] |
| In-silico Prediction Tools | Software | Computationally predicts the functional impact of amino acid or nucleotide changes. | SIFT, CADD, GERP, REVEL [9] |
| Functional Study Assays | Wet-lab Reagent | Provides experimental validation of a variant's effect on RNA splicing, protein function, or protein expression. | RT-PCR kits, minigene constructs, antibodies for Western Blot |
In the analysis of Next-Generation Sequencing (NGS) data, managing variants of uncertain significance (VUS) presents a major challenge for researchers and clinicians. The foundation for reliable VUS interpretation rests upon the integrity of the initial call set. Flawed data, characterized by high rates of false positives, can lead to wasted resources, erroneous biological conclusions, and compromised clinical decisions. This guide details established techniques for data integration and quality control, providing a framework to minimize false positives and refine variant call sets for more robust and interpretable results.
Troubleshooting Guides & FAQs
Data Preprocessing & QC
1. My initial variant call set is overwhelmingly large. How can I quickly identify low-quality variants for removal? A large, noisy call set often stems from inadequate pre-alignment quality control. Begin by scrutinizing your raw sequencing data.
- Actionable Protocol:
- Assess Raw Read Quality: Use FastQC to generate a quality report on your raw FASTQ files. Focus on the "Per base sequence quality" plot. A significant drop in quality (Q-score below 20) at the 3' ends of reads is a common issue [78].
- Trim and Filter: Use a tool like CutAdapt or Trimmomatic to trim low-quality bases from the ends of reads and remove adapter sequences. A common threshold is to trim bases with a Q-score below 20 and discard resulting reads shorter than 20-25 bases [78].
- Validate File Integrity: Before and after processing, validate your FASTQ file format using a validator like
fastq-utilsto rule out file corruption or formatting errors that can cause downstream issues [79] [80].
2. What key metrics should I check after read alignment to assess the quality of my sequencing experiment? After aligning reads to a reference genome, several mapping statistics provide a direct reflection of data quality. Poor metrics here often correlate with high false-positive variant calls.
Diagnostic Metrics & Benchmarks: The table below summarizes critical post-alignment quality metrics and their desirable values, derived from large-scale studies like ENCODE [81].
Table 1: Key Post-Alignment Quality Control Metrics
Metric Description General Guideline Uniquely Mapped Reads Percentage of reads mapped to a single location in the genome. Varies by assay; >70-80% is often desirable. Critically low values suggest contamination or poor library complexity [81]. Duplication Rate Percentage of PCR or optical duplicates. Should be as low as possible. High rates (>50%) can indicate low input material or over-amplification, inflating coverage estimates [81]. Insert Size Size of the original DNA fragments. Should match the expected library preparation size. Abnormal distributions can indicate systematic errors. Coverage Uniformity Evenness of read coverage across the genome or target regions. Prefer a uniform profile. High variability can lead to gaps in variant calling. FRiP (Fraction of Reads in Peaks) For functional genomics (ChIP-seq, ATAC-seq), the fraction of reads falling within peak regions. A higher FRiP score (>1% for broad marks, >5% for narrow marks) indicates a successful experiment [81].
Variant Refinement & Interpretation
3. After basic filtering, my call set still has many potential false positives. What advanced strategies can I use? Basic filtering (e.g., on depth and quality) is essential but insufficient. Refining a call set requires a multi-faceted approach that integrates technical and biological context.
- Actionable Protocol:
- Leverage Annotation: Annotate your VCF file using a tool like Ensembl VEP or ANNOVAR. This adds functional context (e.g., missense, intergenic) and population frequency data [82].
- Filter by Population Frequency: Use databases like gnomAD to filter out variants with high allele frequencies above the expected threshold for your disease of interest. This is highly effective for removing common polymorphisms.
- Apply Functional Predictions: Use in-silico prediction scores (e.g., SIFT, PolyPhen) to prioritize non-synonymous variants that are predicted to be damaging. Be aware that these tools can have their own false positive rates [82].
- Cross-Check with Orthogonal Methods: For a small set of critical variants, consider validating with an orthogonal technology like Sanger sequencing to confirm their presence.
4. How can I assess the quality of my multiple sequence alignment before variant calling, especially for non-model organisms? Alignment quality is paramount. For non-model organisms without a curated gold standard, you can use consistency-based methods to estimate reliability.
- Actionable Protocol:
- Generate Multiple Alignments: Run the same set of sequences through multiple alignment programs (e.g., MUSCLE, MAFFT, ClustalW) using their default parameters [83].
- Compare Alignment Consistency: Use a tool like MUMSA to compare the resulting alignments. MUMSA calculates an Average Overlap Score (AOS) for the entire alignment case and a Multiple Overlap Score (MOS) for individual alignments [83].
- Interpret Scores: A low AOS indicates a "difficult" alignment region where programs disagree, flagging it as potentially unreliable. The alignment with the highest MOS is considered the most biologically accurate of the set generated, providing a data-driven quality assessment [83].
5. How can functional annotation improve the specificity of my findings, particularly for non-coding VUS? Focusing on functionally relevant regions of the genome can dramatically improve the signal-to-noise ratio, especially for non-coding variants implicated in regulatory functions.
- Actionable Protocol:
- Integrate Functional Genomic Annotations: Annotate your non-coding variants with data from repositories like ENCODE. Prioritize variants that fall within functional elements such as promoter regions, enhancers, transcription factor binding sites (TFBS), and regions of open chromatin (e.g., from DNase-seq or ATAC-seq data) [82].
- Leverage Chromatin Interaction Data: Use Hi-C or ChIA-PET data to determine if your non-coding variant, even if millions of bases away, physically interacts with a gene promoter in the relevant cell type. This links non-coding VUS to potential target genes [82].
- Build a Regulatory Score: Combine multiple lines of functional evidence into a prioritized list. A non-coding VUS that overlaps a cell-type-specific enhancer, alters a transcription factor motif, and loops to a gene involved in your disease pathway is a high-confidence candidate for further study.
Workflow Visualization
NGS Data QC and Variant Refinement Workflow
The following diagram outlines the core process for minimizing false positives, from raw data to a refined variant list, highlighting key quality checkpoints.
Variant Refinement and Functional Prioritization
This diagram details the integrated process of refining a raw variant call set by incorporating technical and biological evidence.
VUS Assessment Framework
This framework shows how a refined call set feeds into the specific challenge of interpreting Variants of Uncertain Significance.
The Scientist's Toolkit
Table 2: Essential Research Reagents & Computational Tools for NGS QC
| Tool/Resource Name | Type | Primary Function |
|---|---|---|
| FastQC [78] [81] | Software | Provides a quick overview of raw sequencing data quality, highlighting potential issues like adapter contamination, low-quality bases, and biased sequence content. |
| CutAdapt/Trimmomatic [78] | Software | Removes adapter sequences, primers, and other unwanted oligonucleotides, and trims low-quality bases from reads. |
| Fastq-utils [79] [80] | Software | Validates the integrity and format of FASTQ files, ensuring they are not corrupted and conform to standards before analysis. |
| MUMSA [83] | Software | Assesses the quality and consistency of multiple sequence alignments by comparing outputs from different programs, identifying reliable alignment regions. |
| Ensembl VEP [82] | Software | Annotates variants with their functional consequences (e.g., missense, stop-gain), known population frequencies, and pathogenicity predictions. |
| ANNOVAR [82] | Software | A powerful tool for functional annotation of genetic variants from high-throughput sequencing data. |
| ENCODE Guidelines & Data [81] | Database/Protocol | Provides assay-specific quality metrics and thresholds (e.g., FRiP score, unique mapped reads) derived from large-scale reference data. |
| gnomAD | Database | A public catalog of human genetic variation used to filter out common polymorphisms and identify rare variants. |
Utilizing Gene-Specific Variation Patterns and Protein Domains to Prioritize Functional Assays
The widespread adoption of Next-Generation Sequencing (NGS) in research and clinical diagnostics has unearthed a vast landscape of genetic variation, with Variants of Uncertain Significance (VUS) representing a critical bottleneck. A VUS is a genetic variant for which there is insufficient information to classify it as pathogenic or benign [7]. In clinical genetic testing for conditions like breast cancer, VUS can be identified in up to 35% of individuals undergoing NGS, vastly outnumbering definitive pathogenic findings [5] [7]. This creates a fundamental challenge for precision medicine and functional genomics, as these enigmatic variants leave researchers and clinicians with more questions than answers.
The resolution of this challenge lies in developing intelligent strategies to prioritize which VUS warrant costly and time-consuming functional assays. This article outlines a technical framework that leverages gene-specific variation patterns and protein domain information to systematically triage VUS for functional characterization, thereby accelerating variant interpretation and gene discovery.
Conceptual Framework: From Gene-Level to Region-Aware Analysis
Traditional gene-based collapsing methods, which treat all qualifying variants within a gene as equivalent, have been powerful for gene discovery but are limited in power when pathogenic mutations cluster in specific genic regions [84]. This is a common phenomenon in many disease-associated genes.
The Power of Domain-Based Collapsing
A powerful approach to overcome this limitation is to shift the unit of analysis from the entire gene to specific functional protein domains. This "domain-based collapsing" method identifies case-enriched burdens of rare variants within defined protein domains, even when the gene-level signal is not significant [84].
- Real-World Evidence: In Amyotrophic Lateral Sclerosis (ALS) research, a standard gene-based analysis found a weak, non-significant enrichment for FUS (OR=1.43, P=0.23). However, when analysis was focused on the Arg-Gly rich domain (exons 13-15), the signal strengthened dramatically (OR=8.6, P=3.6x10⁻⁵), successfully pinpointing a key risk region [84].
- Implementation: Domains can be defined using homology-based databases like the Conserved Domain Database (CDD), and the analysis can also include unaligned regions between CDD alignments that are known mutation hotspots, such as the glycine-rich domain in TARDBP [84].
Leveraging Regional Intolerance Metrics
Another strategy is a gene-based approach that incorporates evidence of purifying selection against missense variation in specific gene regions. This method uses sub-regional intolerance scores (sub-RVIS) to determine which missense variants are sufficiently damaging to qualify in a burden test, increasing the power to identify haploinsufficient genes [84].
Technical Guide & FAQs: Implementing a Domain-Centric Workflow
This section provides a practical, question-and-answer style guide for researchers implementing these prioritization strategies.
FAQ 1: How do I obtain protein domain information for my gene of interest?
- Solution: Utilize publicly available bioinformatics databases.
- Conserved Domain Database (CDD): A primary resource for identifying functional domains through protein sequence alignements [84].
- UniProt: Provides expertly curated information on protein domains, regions, and known pathogenic mutation sites.
- Protocol: Access these databases via their web interfaces or programmatically through their APIs. Input your gene or protein identifier to retrieve a list of annotated domains and their genomic coordinates.
FAQ 2: My NGS data shows a VUS in a gene-intolerant domain. What are the next steps?
- Solution: This VUS becomes a high-priority candidate for functional validation. The following workflow is recommended:
- Co-localization Check: Verify if the VUS falls within a known functional domain or a previously identified mutation hotspot from the literature.
- Conservation Analysis: Use tools like GERP to assess evolutionary conservation of the specific amino acid residue.
- In silico Prediction: Run computational predictors (e.g., SIFT, CADD) to gauge potential functional impact.
- Functional Assay Design: Proceed to a targeted functional assay based on the gene's known biology (e.g., enzyme activity assay, protein-protein interaction study, splicing assay) [7].
FAQ 3: What are the key quantitative metrics for identifying gene and domain constraint?
- Solution: Large-scale population datasets provide metrics to quantify intolerance to variation. The table below summarizes key metrics from the Regeneron Genetics Center Million Exome (RGC-ME) dataset, a resource of 983,578 individuals [85].
Table 1: Key Gene Constraint Metrics from Large-Scale Datasets (e.g., RGC-ME)
| Metric | Description | Interpretation | Dataset Example |
|---|---|---|---|
| shet (Selection Coefficient) | Quantifies fitness loss due to heterozygous pLOF variation [85]. | Higher shet = less tolerant of pLOF variants. Mean shet ~0.073 in RGC-ME [85]. | RGC-ME (n=822K unrelated) |
| LOEUF (LOF Observed/Expected Upper Bound Fraction) | Estimates depletion of pLOF variants in a gene [85]. | LOEUF < 0.35 = highly constrained; LOEUF > 0.7 = tolerant [85]. | gnomAD |
| pLOF Depletion | Direct observation of rare pLOF variants (AAF < 0.1%) vs. expectation [85]. | Significant depletion indicates intolerance to LOF variation. | RGC-ME, gnomAD |
| Missense Depletion Regions | Genomic regions within a gene that are tolerant of pLOF but depleted for missense variation [85]. | Pinpoints critical functional domains; 1,482 genes have such regions [85]. | RGC-ME |
FAQ 4: The wet-lab functional assay is my bottleneck. How can I prioritize assays based on domain information?
- Solution: Create a tiered prioritization system for your VUS list. The following diagram illustrates a logical decision workflow for triaging VUS based on genomic data, from initial identification to functional assay prioritization.
The Scientist's Toolkit: Essential Research Reagents & Materials
Successfully implementing this workflow requires a suite of trusted reagents and resources. The table below lists key solutions for critical experimental stages.
Table 2: Research Reagent Solutions for Domain-Guided Functional Analysis
| Research Stage | Essential Material / Solution | Function / Application |
|---|---|---|
| NGS Library Prep | Fragmentation Enzymes / Beads | Shears DNA/RNA into optimal fragment sizes for sequencing [86]. |
| Platform-Specific Adapter Kits | Adds sequencing adapters and sample barcodes for multiplexing [86]. | |
| Functional Validation | Site-Directed Mutagenesis Kits | Introduces the VUS into expression constructs for functional testing. |
| Antibodies for Protein Domains | Detects expression, localization, and stability of wild-type vs. mutant protein. | |
| Cell-Based Assays | Reporter Assay Systems | Tests the impact of a VUS on transcriptional activity or signaling pathways. |
| CRISPR-Cas9 Editing Tools | Creates isogenic cell lines with the VUS for phenotypic comparison. | |
| Data Analysis | CLIA-Certified Bioinformatics Pipelines | Ensures robust, clinical-grade variant calling and annotation [7]. |
| Public Databases (ClinVar, gnomAD) | Critical for annotating variants and assessing frequency [5] [7] [85]. |
Managing the deluge of VUS in the NGS era demands a move beyond generic, gene-level analysis. By integrating gene-specific constraint metrics and protein domain intelligence, researchers can create a powerful, biologically informed filter to prioritize functional assays. This domain-centric approach efficiently allocates resources to the most promising candidates, directly addressing the core challenge of VUS interpretation. As population genetic datasets grow larger and more diverse, and as functional maps of the genome become more refined, these strategies will become increasingly precise, ultimately shortening the diagnostic odyssey for patients and accelerating the development of novel therapeutics.
Frequently Asked Questions (FAQs)
FAQ 1: What does a Variant of Uncertain Significance (VUS) result mean for my research? A VUS indicates that the available evidence is insufficient to classify the genetic variant as either pathogenic or benign. It does not confirm a genetic diagnosis, and clinical decision-making must rely on other clinical correlations [87]. This classification exists on a spectrum; some VUS have substantial evidence and are close to being reclassified, while others have very little supporting data [87].
FAQ 2: Why is my NGS data so sparse, and how does it impact variant analysis? Sparse data is a fundamental challenge in single-cell sequencing. The minute amount of genetic material in a single cell leads to high levels of technical noise and missing data. This sparsity increases the uncertainty of observations, making tasks like variant calling and interpretation substantially more difficult than with bulk sequencing data [88]. This can directly contribute to a variant being labeled a VUS.
FAQ 3: What does "inapplicability of phenotypic criteria" mean in the context of genetic variants? This challenge arises from genetic heterogeneity (the "one-phenotype-many-genes" paradigm), where a single, distinct clinical phenotype can be caused by mutations in many different genes [89]. This makes it difficult to use the phenotype alone to pinpoint the causative gene or variant. Furthermore, a lack of diagnostic gold standards and overlap in symptoms between different movement disorders can make consistent and accurate phenotyping a major problem [89].
FAQ 4: What practical steps can I take to resolve a VUS finding? Engage in a close collaboration with your clinical laboratory and consider the following actions to gather additional evidence [87]:
- Provide the laboratory with the patient's detailed clinical and biochemical findings.
- Consider additional functional testing for the patient.
- Test biological parents or other family members to see if the variant segregates with the disease.
- Provide detailed family medical history.
- Research literature and databases for other reported cases with the same variant and a similar phenotype.
Troubleshooting Guides
Problem: Low Diagnostic Yield Due to Genetic Heterogeneity
- The Challenge: You are facing a known phenotype but genetic testing reveals no clear causative variant among hundreds of potential candidate genes [89].
- The Solution:
- Implement Deep Phenotyping: Move beyond basic labels. Incorporate detailed medical history, advanced physical examination, electrophysiology, neuroimaging, and metabolite sampling to create a finer-grained, multi-dimensional patient profile [89].
- Adhere to Diagnostic Algorithms: Follow phenotype-specific diagnostic algorithms that help rule out acquired causes and guide the choice of the most appropriate genetic test (e.g., multi-gene panels vs. exome sequencing) [89].
- Utilize Genotype-Phenotype Databases: Leverage resources like MDSGene, which systematically extract and standardize genetic and phenotypic data from the literature to strengthen variant associations [89].
Problem: High Uncertainty from Sparse Single-Cell Data
- The Challenge: Your single-cell DNA or RNA sequencing data suffers from high allelic dropout rates, technical noise, and missing data, making it difficult to confidently determine variant zygosity or its functional impact [90] [88].
- The Solution:
- Employ Multi-Omic Profiling: Use emerging technologies like single-cell DNA–RNA sequencing (SDR-seq), which simultaneously profiles genomic DNA loci and RNA transcripts in thousands of single cells. This allows you to directly link a variant's genotype to its functional effect on gene expression within the same cell, even for noncoding variants [90].
- Adopt Automated Workflows: Integrate automated sample preparation systems to reduce human error, inter-user variation, and cross-contamination risks during library preparation. This enhances the reproducibility, accuracy, and precision of your NGS data [91].
- Apply Advanced Computational Tools: Use analysis methods that are specifically designed to quantify and account for the high levels of uncertainty and missing data inherent in single-cell datasets [88].
Experimental Protocols & Data
Table 1: Strategies for VUS Re-Evaluation and Evidence Gathering
| Strategy | Description | Key Actionable Steps |
|---|---|---|
| Deep Phenotyping [89] | A fine-grained, multi-dimensional characterization of the disease manifestations. | Perform detailed patient history, specialized physical exams, neuroimaging, and biochemical metabolite sampling. |
| Segregation Analysis [87] | Testing biological family members to see if the variant co-occurs with the disease in the family. | Perform genetic testing on parents (trio analysis) and other affected or unaffected family members. |
| Functional Phenotyping [90] | Experimentally determining the impact of a variant on gene function and expression. | Use single-cell DNA–RNA sequencing (SDR-seq) to link variant zygosity to gene expression changes in the same cell. |
| Data Integration [87] | Aggregating evidence from multiple independent sources. | Search population databases, clinical literature, and utilize computational predictive algorithms. |
Table 2: Common NGS Library Preparation Issues and Fixes
| Problem | Potential Cause | Expert Recommendation |
|---|---|---|
| Adapter Dimers (~70-90 bp peak) [92] | Adapter ligation during library prep; inefficient size selection. | Perform an additional clean-up and size selection step. Ensure nucleic acid binding beads are mixed well and size selection protocols are followed closely. |
| Low Library Yield [92] | Insufficient input DNA/RNA or suboptimal amplification. | Accurately quantify input DNA. Add 1-3 cycles to the initial target amplification (not the final PCR) if yield is low. Avoid overamplification to prevent bias. |
| Uneven Coverage [92] | Bias introduced during amplification cycles ("AMP" bias). | Limit the number of amplification cycles to prevent exponential amplification of smaller fragments, which introduces bias. |
| Cross-Contamination [91] | Improper manual handling during sample and library prep. | Implement automated, closed-system sample preparation to minimize human intervention and environmental exposure. |
The Scientist's Toolkit: Research Reagent Solutions
Table 3: Key Reagents and Materials for Advanced Single-Cell Analysis
| Item | Function in the Experiment |
|---|---|
| Custom Poly(dT) Primers [90] | Used for in situ reverse transcription (RT) to initiate cDNA synthesis from mRNA templates in fixed cells. |
| Cell Barcoding Beads [90] | Beads containing unique cell barcode oligonucleotides that label all nucleic acids from a single cell, allowing for sample multiplexing and cell identification. |
| Unique Molecular Identifiers (UMIs) [90] | Short random nucleotide sequences added to each cDNA molecule during RT to accurately quantify original transcript abundance and correct for amplification bias. |
| Multiplex PCR Primers [90] | A pool of forward and reverse primers designed to simultaneously amplify hundreds of targeted genomic DNA and cDNA regions in a single reaction. |
Workflow and Relationship Diagrams
Diagram 1: Integrated VUS Resolution Strategy
Diagram 2: SDR-seq Functional Phenotyping Workflow
Validating VUS Classifications and Comparing Predictive Tools
FAQ: Tool Performance and Selection
Q: What are the key sensitivity metrics when comparing variant prioritization tools?
A: The most informative metrics are the Top 1 recall (the percentage of cases where the causative variant is the very top candidate) and the Top 3 recall (where the true variant is found within the top three candidates). These metrics directly show a tool's ability to narrow down the search in a clinical setting, reducing the time and effort required for final confirmation [55] [93].
Q: In a head-to-head comparison, which tool demonstrates the highest sensitivity?
A: A 2024 study benchmarked these tools on a cohort of in-house patient data. The results showed that 3ASC achieved the highest sensitivity, with a top 1 recall of 85.6% and a top 3 recall of 94.4%. This performance was notably higher than that of Exomiser and LIRICAL in the same evaluation [55]. The table below provides a detailed comparison.
Table 1: Benchmarking Sensitivity of Variant Prioritization Tools
| Tool | Top 1 Recall (%) | Top 3 Recall (%) | Top 10 Recall (%) |
|---|---|---|---|
| 3ASC | 85.6 | 94.4 | 93.7 |
| Exomiser | Information Missing | Information Missing | 81.4 |
| LIRICAL | Information Missing | Information Missing | 57.1 |
Source: Data adapted from Kim et al., 2024 [55].
Q: Why does 3ASC show higher sensitivity compared to other tools?
A: 3ASC's architecture integrates multiple types of evidence, which contributes to its robust performance [55] [93]:
- ACMG/AMP Guidelines: It automatically annotates variants against the 28 criteria from the official ACMG/AMP guidelines, providing a standardized, clinical evidence-based assessment.
- Phenotype Integration: It uses a symptom similarity score to quantify the match between a patient's observed phenotypes (using HPO terms) and known gene-disease associations.
- Machine Learning: It employs a random forest classifier trained on real patient data, which learns to prioritize variants based on complex patterns, including features that help reduce false positives.
In contrast, previous tools often depend more heavily on in-silico pathogenicity predictions alone, which can result in lower sensitivity and less interpretable results [55].
Q: How does LIRICAL's approach to variant prioritization differ?
A: LIRICAL uses a likelihood ratio (LR) framework, a statistical method familiar to clinical diagnostics. It calculates a post-test probability for each candidate diagnosis by combining the likelihood of the observed genotype with the likelihood of the patient's phenotype profile. This provides a clinically interpretable probability for each result, rather than just a rank [94]. While its overall sensitivity in the mentioned benchmark was lower, its interpretability is a key strength.
Q: What is the role of an "explainable" algorithm in managing Variants of Uncertain Significance (VUS)?
A: Explainable AI (X-AI) is crucial for VUS interpretation. A tool like 3ASC doesn't just provide a ranked list; it annotates the specific evidence used for prioritization [55]. For a VUS, a clinician can see exactly which ACMG/AMP criteria were met (e.g., PM1 for location in a mutational hotspot, PP3 for computational prediction scores) and how much the patient's phenotype contributed to the ranking. This transparency makes the prioritization result interpretable and auditable, turning a black-box computation into a decision-support tool with clear evidence trails [55] [93].
Troubleshooting Guide: Addressing Common Scenarios
Problem: The causative variant is not ranked highly by the tool.
- Potential Cause 1: Incomplete or imprecise phenotype information.
- Potential Cause 2: Misconfigured inheritance pattern.
- Potential Cause 3: The variant or gene-disease association is not yet in public knowledge bases.
- Solution: For tools that allow it, ensure you are using the most up-to-date versions of databases like OMIM, ClinVar, and HPO. Consider that some novel associations may require literature review beyond automated tools [58].
Problem: The tool's results are difficult to interpret for clinical reporting.
- Potential Cause: The tool functions as a "black box" without revealing evidence.
Experimental Protocol: Benchmarking Variant Prioritization Tools
The following workflow outlines the key steps for a robust benchmarking experiment, as implemented in the cited study [55].
Title: Benchmarking Tool Performance Workflow
Methodology Details:
Cohort Curation:
- Patient Cohort: Utilize a well-characterized retrospective cohort with confirmed molecular diagnoses. The benchmark study used data from 5,055 patients [55].
- Ground Truth: The list of known causative variants for these patients serves as the "ground truth" for calculating accuracy.
- Phenotype Data: Collect and standardize patient phenotypes using Human Phenotype Ontology (HPO) terms [55] [58].
Tool Execution:
- Standardized Input: Process the same set of variant call format (VCF) files and corresponding HPO term lists through each tool (3ASC, Exomiser, LIRICAL) using their default or recommended parameters [55].
- Computational Environment: Ensure all tools are run in a controlled environment with sufficient computational resources to avoid performance bottlenecks.
Performance Calculation:
- Recall Analysis: For each patient case, record the rank assigned by each tool to the known causative variant. The primary metrics are:
- Top 1 Recall: (Number of cases where causative variant is rank 1 / Total cases) * 100
- Top 3 Recall: (Number of cases where causative variant is in top 3 / Total cases) * 100
- Top 10 Recall: (Number of cases where causative variant is in top 10 / Total cases) * 100 [55]
- Recall Analysis: For each patient case, record the rank assigned by each tool to the known causative variant. The primary metrics are:
Result Interpretation:
- Statistical Comparison: Compare the recall rates between tools to determine which has the highest sensitivity for the given dataset.
- Additional Factors: Consider other factors like ease of use, interpretability of results, and computational runtime, which are critical for clinical integration [55] [71].
The Scientist's Toolkit: Research Reagent Solutions
Table 2: Essential Resources for Variant Prioritization and Interpretation
| Resource Name | Type | Primary Function in Interpretation |
|---|---|---|
| Human Phenotype Ontology (HPO) | Phenotype Ontology | Provides standardized vocabulary for describing patient abnormalities, enabling computational phenotype analysis [58] [94]. |
| ACMG/AMP Guidelines | Clinical Framework | Provides a standardized, evidence-based system for classifying variants as Pathogenic, Benign, or VUS [55] [95]. |
| ClinVar | Public Database | A repository of crowd-sourced reports on the relationships between variants and phenotypes, with supporting evidence [95] [58]. |
| gnomAD | Population Database | Provides allele frequency data across diverse populations, used to filter out common variants unlikely to cause rare disease [95] [58]. |
| OMIM | Knowledge Base | A comprehensive, authoritative compendium of human genes and genetic phenotypes [58]. |
FAQ: Core Concepts and Definitions
What is the primary goal of a validation framework in NGS? The primary goal is to systematically evaluate and ensure the accuracy, precision, and reliability of Next-Generation Sequencing assays and platforms. This process involves thorough testing to guarantee that the results produced by NGS technologies are both consistent and reproducible, forming a foundation for clinically actionable findings [96].
Why is confirming NGS results with an orthogonal method like Sanger sequencing necessary? Despite the power of NGS, the multi-step process is susceptible to errors from factors like personnel proficiency, laboratory conditions, reagent quality, and bioinformatics analysis. Sanger sequencing, known for its longer read length and extreme accuracy, serves as an international gold standard for validating genetic variants identified by NGS, effectively monitoring data quality and providing technical corroboration [96].
What constitutes a Variant of Uncertain Significance (VUS)? A Variant of Uncertain Significance is a genetic variant for which the clinical significance is currently unclear based on available evidence. The classification of variants is a known challenge, and reporting practices for VUS can vary across laboratories. Some labs report VUS found in genes related to the clinical question, while others may limit reporting to pathogenic variants thought to be causative of the phenotype [97].
What are the key regulatory and quality standards for diagnostic NGS workflows? For clinical NGS, adherence to rigorous regulatory frameworks is critical. A foundational benchmark is ISO 13485:2016, which defines requirements for quality management systems for medical devices and In Vitro Diagnostic (IVD) products. Compliance ensures documented processes, risk management, and traceability. Furthermore, the European Union’s In Vitro Diagnostic Regulation (IVDR) introduces strict requirements for clinical evidence and performance evaluation to ensure products are safe and effective for clinical use [66].
Troubleshooting Guide: Common NGS Validation Challenges
Problem 1: Low Library Yield
Low final library yield is a frequent and frustrating issue that can compromise sequencing depth.
- Failure Signals: Final library concentration falls well below expectations (e.g., <10-20% of predicted); broad or faint peaks on electropherogram; dominance of adapter peaks.
- Common Root Causes & Corrective Actions [98]:
| Root Cause | Mechanism of Yield Loss | Corrective Action |
|---|---|---|
| Poor Input Quality | Enzyme inhibition from contaminants (phenol, salts, EDTA). | Re-purify input sample; ensure high purity (260/230 > 1.8, 260/280 ~1.8); use fresh wash buffers. |
| Inaccurate Quantification | Under-estimating input leads to suboptimal enzyme stoichiometry. | Use fluorometric methods (Qubit) over UV absorbance; calibrate pipettes; use master mixes. |
| Fragmentation Issues | Over- or under-fragmentation reduces adapter ligation efficiency. | Optimize fragmentation parameters (time, energy); verify fragmentation profile before proceeding. |
| Suboptimal Adapter Ligation | Poor ligase performance or wrong molar ratios reduce yield. | Titrate adapter-to-insert molar ratios; ensure fresh ligase and buffer; maintain optimal temperature. |
Problem 2: High False Positive Variant Calls
This occurs when variants are reported that are not present in the sample, potentially leading to incorrect conclusions.
- Failure Signals: High number of variants in regions with known technical challenges (e.g., homopolymer stretches, high GC-content); variants present at very low allele frequencies without biological justification; high number of calls flagged as VUS.
- Common Root Causes & Corrective Actions:
- Sequencing Artifacts: Errors can arise from the sequencing instrument's optics or base calling [96]. Action: Review base quality scores; ensure proper platform maintenance and calibration.
- Inadequate Bioinformatic Filtering: Raw variant calls may include technical artifacts. Action: Implement and tune filtering parameters, including quality (e.g., Q-score), read depth, and population allele frequency thresholds based on established guidelines like ACMG [99].
- Sample Contamination: Cross-contamination during automated extraction or library prep can introduce foreign variants [96]. Action: Include negative controls in the workflow; use unique sample indices and check for cross-sample barcode mixing.
Problem 3: Inconsistent Results Across Technicians or Runs
Sporadic failures that correlate with the operator, day, or reagent batch indicate a problem with procedural consistency.
- Failure Signals: Some samples produce no measurable library; strong adapter-dimer peaks appear inconsistently; different technicians have subtly different success rates.
- Common Root Causes & Corrective Actions [98]:
- Protocol Deviations: Subtle differences in technique (e.g., vortexing vs. pipetting, timing) between operators. Action: Introduce emphasized, detailed Standard Operating Procedures (SOPs); use operator checklists; implement "waste plates" to allow retrieval in case of pipetting errors.
- Reagent Degradation: Ethanol wash solutions can lose concentration over time. Action: Enforce strict reagent logging and expiry date tracking.
- Pipetting Errors: In manual preps, operators may accidentally discard beads instead of supernatant. Action: Switch to master mixes to reduce pipetting steps; provide redundant logging of critical steps.
Experimental Protocols for Key Validation Experiments
Protocol 1: Orthogonal Confirmation of NGS Variants using Sanger Sequencing
This protocol outlines the workflow for validating variants detected by NGS using the gold-standard Sanger method [96].
1. Variant Identification by NGS:
- Perform high-throughput sequencing on genomic DNA samples.
- Use bioinformatics tools to align sequences to a reference genome and identify genetic variants (SNVs, insertions, deletions).
2. Selection of Variants for Confirmation:
- Not all variants require validation. Prioritize variants that:
- Fail predefined quality metrics (e.g., low depth of coverage, low variant allele frequency).
- Have known clinical relevance.
- Are located in technically challenging genomic regions (e.g., AT-rich, GC-rich).
- Are classified as VUS and require further verification.
3. Sanger Sequencing Confirmation:
- PCR Amplification: Design and validate primers that flank the targeted variant. Amplify the specific region from the original DNA sample.
- Sequencing Reaction: Perform Sanger sequencing using chain-terminating dideoxynucleotides.
- Data Analysis: Analyze the resulting chromatograms to decipher the nucleotide sequence and confirm the presence or absence of the variant.
4. Data Analysis and Interpretation:
- Compare Sanger sequencing results with the original NGS data.
- Concordance increases confidence in the NGS result.
- Discrepancies require investigation to determine if the source was an NGS error (e.g., alignment issue) or a Sanger issue (e.g., primer failure).
The following workflow diagram illustrates the key decision points in this validation process:
Protocol 2: Implementing a VUS Management and Re-analysis Pipeline
This protocol provides a structured approach for handling the inevitable VUS findings in clinical NGS, as highlighted by the "ultimate VUS reevaluation pipeline" concept [99].
1. Initial Curation and Reporting Decision:
- Classify variants according to established guidelines (e.g., ACMG/AMP) [99] [47].
- Based on laboratory policy, decide whether to report the VUS. Practices vary, with some labs reporting VUS in genes related to the clinical question and others not [97].
2. Evidence Gathering and Periodic Re-analysis:
- Bank the Genomic Data: A key advantage of Whole Genome Sequencing (WGS) is that the complete genome can form the basis for a patient's genomic health care record for reanalysis throughout their lifetime [100].
- Leverage Updated Databases: Periodically re-interpret VUS by querying new and updated clinical (e.g., ClinVar, CIViC) and population (e.g., gnomAD) databases [66].
- Utilize Prediction Tools: Employ software tools that aggregate protein, disease-specific, and population information to assist in variant classification [100].
3. Functional Assay Consideration (If Required):
- For high-priority VUS that remain unresolved, consider developing or utilizing existing functional assays to provide direct biological evidence of the variant's impact (e.g., on protein function, gene expression).
The following diagram outlines the continuous cycle of VUS management:
The Scientist's Toolkit: Essential Research Reagent Solutions
The following table details key materials and resources used in establishing robust NGS validation frameworks.
| Item / Solution | Function in Validation | Key Considerations |
|---|---|---|
| Reference Standards (e.g., Horizon Molecular) | Controls with known variants to test pipeline accuracy, variant classification, and for benchmarking [99]. | Use for initial validation; may not be sufficient for final clinical assay validation. |
| Sanger Sequencing Reagents | Provides orthogonal, gold-standard confirmation for variants identified by NGS [96]. | Critical for validating clinically relevant variants, those with low quality scores, or VUS. |
| ISO 13485:2016 Certified Tools | Software and tools certified to this standard ensure a documented quality management system, traceability, and risk management [66]. | Essential for laboratories operating under IVDR or other regulatory frameworks. |
| Automated Annotation Tools (e.g., ANNOVAR, VEP) | Integrate multi-source data (ClinVar, COSMIC, gnomAD) for comprehensive, up-to-date variant annotation [66]. | Reduces manual curation workload and ensures interpretations reflect latest knowledge. |
| Cloud-Based Platforms (e.g., DNAnexus, Terra) | Provide scalable computational resources for running validated somatic or germline analysis pipelines without local hardware [66]. | Supports automated execution, data security, and collaboration. |
| External Quality Assessment (EQA) (e.g., EMQN, GenQA) | Programs for cross-laboratory benchmarking to identify discrepancies and improve performance [66]. | Provides an external check on the entire NGS and interpretation process. |
Regulatory and Quality Assurance Frameworks
Navigating the regulatory landscape is mandatory for clinical NGS applications. Key frameworks include:
- ISO 13485:2016: This is the quality management system standard for medical devices. For manufacturers, compliance ensures documented design processes and integrated risk management. For laboratories, using certified tools ensures analytical validity and reproducibility [66].
- In Vitro Diagnostic Regulation (IVDR): This EU regulation imposes strict requirements for clinical evidence, performance evaluation, and post-market surveillance. Manufacturers must provide detailed technical documentation, and laboratories using IVDR-compliant products ensure their diagnostic services are aligned with regulations [66].
- Professional Guidelines (ACMG/AMP/ASCO/CAP): Adherence to joint guidelines from professional bodies is critical for standardizing variant interpretation and reporting. These provide a tiered system for classifying somatic variants and recommendations for reporting germline findings, including secondary findings [66] [99]. The ClinGen Sequence Variant Interpretation Working Group has been instrumental in refining these criteria [47].
In next-generation sequencing (NGS) research, the accurate classification of genetic variants is paramount. A significant challenge in clinical genomics is the management of Variants of Uncertain Significance (VUS), which are genetic alterations with unknown effects on health [5]. These VUS substantially outnumber pathogenic findings and complicate clinical decision-making, potentially leading to unnecessary procedures, adverse psychological effects, and increased demands on healthcare resources [5]. Computational in-silico prediction tools have become indispensable in addressing this challenge, providing evidence for classifying variants as pathogenic or benign. This technical support center provides a comprehensive framework for evaluating and applying these tools within the context of a broader thesis on managing VUS in NGS research.
Understanding Variants of Uncertain Significance (VUS)
What is a VUS and why is it a problem in NGS research?
When a person undergoes genetic testing, they often expect definitive answers about their genes. However, approximately 20% of genetic tests identify variants of uncertain significance (VUS) [7]. These are enigmatic genetic mutations for which researchers lack sufficient information to determine their association with any condition, falling somewhere between "benign" and "likely pathogenic" on the classification spectrum [7].
Key Problems Posed by VUS:
- Clinical Ambiguity: VUS results fail to resolve the clinical question for which testing was initiated, leaving patients and family members without clear guidance for management or preventive care [5].
- Resource Intensity: Variant interpretation is time-consuming, and VUS incur an obligation for ongoing re-evaluation, diverting significant bioinformatics and clinical resources [5].
- Potential for Harm: Instances of unnecessary surgery and clinical surveillance have been reported following a VUS result. Patients may also experience worry, anxiety, frustration, and decisional regret [5].
- Re-classification Delays: Resolution of uncertainty is unlikely to occur quickly. Current data suggest only about 7.7% of unique VUS were resolved over a 10-year period in cancer-related testing in one major laboratory, and only 10-15% of re-classified VUS are ultimately upgraded to pathogenic [5].
What is the underlying rationale for using in-silico tools to address VUS?
In-silico tools are computational algorithms that predict the functional impact of genetic variants. They are a critical component of the evidence framework used to classify variants, as outlined by standards from the American College of Medical Genetics and Genomics (ACMG) [7] [101]. These tools analyze various features to predict pathogenicity:
- Evolutionary Conservation: Assessing how well a specific amino acid or nucleotide is conserved across species, under the premise that important functional domains are less tolerant to variation [102].
- Biochemical Properties: Predicting the impact of an amino acid substitution based on differences in size, charge, and hydrophobicity [102].
- Structural Impacts: Estimating disruptions to protein folding, stability, or critical functional domains [5].
- Machine Learning: Newer tools utilize innovative machine learning techniques, incorporating additional features like allele frequency, gene-specific variant clustering, and scores from other classifiers to form more accurate metapredictors [102].
Performance Constraints and Benchmarking of In-Silico Tools
The performance of in-silico tools can vary significantly based on the specific disease context, gene function, and inheritance pattern. It is crucial for researchers to understand these constraints to select the most appropriate tools for their experiments.
How do in-silico tools perform on variants from Inherited Retinal Diseases (IRDs)?
A 2024 benchmark study of 39 classifiers on IRD genes from ClinVar revealed that tool performance differs when analyzing autosomal dominant (AD) versus autosomal recessive (AR) variants [102]. The following table summarizes the top-performing tools for different categories within AD IRDs, measured by Area-Under-the-Curve (AUC), where a higher score (closer to 1.0) indicates better performance.
Table 1: Top-Performing In-Silico Tools for Autosomal Dominant Inherited Retinal Diseases (IRDs)
| Variant Category | Top-Performing Tools (in order of performance) | AUC Score |
|---|---|---|
| All AD Variants | MutScore, MetaRNN, ClinPred | 0.969 - 0.968 [102] |
| AD Haploinsufficiency (Loss-of-Function) | BayesDel_addAF, MutScore, ClinPred | 0.972 - 0.968 [102] |
| AD GOF & Dominant Negative | BayesDel_addAF, MetaRNN, ClinPred | 0.997 - 0.991 [102] |
| All AR Variants | ClinPred, MetaRNN, BayesDel_addAF | 0.984 - 0.976 [102] |
Experimental Protocol for IRD Benchmarking [102]:
- Data Curation: 3,322 IRD variants were extracted from ClinVar and filtered to include only those classified as Pathogenic/Likely Pathogenic (PLP) or Benign/Likely Benign (BLB).
- Annotation: Variants were grouped by inheritance pattern using data from the Retinal Information Network (RetNet).
- Tool Benchmarking: 39 variant classifier tools were run on the annotated dataset.
- Performance Analysis: The Area-Under-the-Curve (AUC) of the Receiver Operating Characteristic (ROC) curve was calculated for each tool, using ClinVar annotations as the ground truth.
- Threshold Definition: Upper and lower threshold scores for pathogenicity were defined for the top tools as the points where 95% of the ClinVar data was accurately confirmed as PLP or BLB, respectively.
How do in-silico tools perform on variants from Acute Myeloid Leukemia (AML)?
A 2025 study evaluating 34 tools on the ClinVar dataset and an in-house AML exome dataset also identified a set of high-performing tools, highlighting that the best-performing tools can be consistent across different diseases [101].
Table 2: Top-Performing In-Silico Tools for General and AML-Specific Variant Classification
| Tool Name | Reported Sensitivity | Reported Specificity | Key Application Context |
|---|---|---|---|
| BayesDel_addAF | 0.9337 - 0.9627 [101] | 0.9245 - 0.9513 [101] | AML exome data; high balanced accuracy [101] |
| MetaRNN | 0.9337 - 0.9627 [101] | 0.9245 - 0.9513 [101] | AML exome data; high balanced accuracy [101] |
| ClinPred | 0.9337 - 0.9627 [101] | 0.9245 - 0.9513 [101] | AML exome data; high balanced accuracy [101] |
| REVEL | 0.943 (AUC) [102] | — | Ranked highly in IRD study [102] |
| MutScore | 0.969 (AUC) [102] | — | Top performer for all AD IRD variants [102] |
Experimental Protocol for AML Benchmarking [101]:
- Dataset Download: The latest ClinVar VCF file was downloaded from the NCBI repository (Nov 2024).
- Annotation: The ClinVar data was annotated using the ANNOVAR tool to generate prediction scores for the 34 in-silico tools.
- Variant Categorization: Variants were classified by genomic region (exonic, intronic, etc.) and functional category (synonymous, nonsynonymous, etc.).
- Performance Calculation: Sensitivity and specificity were calculated for each tool against the ClinVar ground truth.
- Application to Cohort: The top shortlisted tools were applied to a whole-exome sequencing dataset from 40 AML patients to identify potential deleterious variants.
Troubleshooting Guides and FAQs for Researchers
FAQ: Which in-silico tools should I select for my NGS study on VUS?
Answer: There is no single "best" tool. Selection should be guided by:
- Inheritance Pattern: For autosomal dominant conditions, especially those involving gain-of-function or dominant negative effects, BayesDel_addAF and MetaRNN have shown exceptional performance. For recessive conditions, ClinPred and MetaRNN are top contenders [102].
- Balanced Performance: For a general-purpose approach where the inheritance pattern is complex or unknown, tools that balance high sensitivity and specificity are recommended. BayesDel_addAF, MetaRNN, and ClinPred consistently demonstrate this balance across studies [102] [101].
- Multi-Tool Consensus: Do not rely on a single tool. Use a panel of at least 3 top-performing tools and consider variants as higher-confidence candidates when multiple tools agree on the classification [102].
FAQ: How can I manage the high number of VUS reported from my large gene panel or exome study?
Answer: Implement strategies to mitigate the VUS challenge at the testing and analysis level:
- Rigorous Panel Design: Use multi-gene panels that include only genes with strong, definitive evidence of disease association. This reduces the identification of VUS in genes with doubtful clinical utility [5].
- Family-Based Segregation Analysis: When a VUS is identified, testing family members to see if the variant segregates with the disease in affected relatives can provide powerful evidence for or against pathogenicity [5].
- Functional Studies: Conduct functional experiments to assess the biochemical consequences of the VUS. This provides direct evidence of impact, though it can be time-consuming and costly [7].
- Data Sharing: Contribute anonymized VUS findings to public databases like ClinVar. This collective effort is essential for accumulating evidence that leads to definitive re-classification [5] [7].
Troubleshooting: My analysis pipeline has classified a variant as a VUS, but I suspect it is pathogenic. What are the next steps?
Answer: Follow a structured re-evaluation protocol:
- Database Re-interrogation: Check for recent updates in ClinVar, gnomAD, and gene-specific databases (LSDBs). New evidence may have been submitted since your initial analysis.
- Multi-Tool Check: Run the variant through a broader set of high-performing in-silico tools, including the latest machine learning-based metapredictors (e.g., MutScore, BayesDel).
- Literature Review: Search for recent functional studies or case reports involving the specific variant or amino acid position.
- Conservation & Domain Analysis: Manually inspect the variant's location within critical protein domains and its conservation across many species.
- Collaborate: Engage with a clinical molecular geneticist or a specialized diagnostic laboratory for expert curation.
Visualizing the VUS Management Workflow
The following diagram illustrates a logical workflow for managing and interpreting VUS in NGS research, integrating in-silico tools and other evidence types.
The Scientist's Toolkit: Essential Research Reagent Solutions
The following table details key resources and computational tools essential for experiments focused on VUS interpretation.
Table 3: Essential Research Reagents and Resources for VUS Analysis
| Item/Resource | Function/Description | Example/Provider |
|---|---|---|
| High-Performance In-Silico Tools | Computational algorithms to predict variant pathogenicity. | MutScore, BayesDel_addAF, ClinPred, MetaRNN [102] [101] |
| Variant Annotation Suite | Software to functionally annotate variants from VCF files and generate scores from multiple prediction tools. | ANNOVAR [101] |
| Public Variant Databases | Repositories of aggregated human genetic variations and phenotypic interpretations. | ClinVar, gnomAD [102] [101] |
| Disease-Specific Gene Database | Curated resource of genes and mutations associated with a specific disease. | Retinal Information Network (RetNet) for IRDs [102] |
| CLIA-Certified Laboratory | For validation of clinically significant findings in a regulated environment, as recommended by ACMG [7]. | Various commercial providers |
| Ion AmpliSeq Custom Panels | Customizable targeted sequencing panels for focused NGS studies. | Thermo Fisher Scientific [103] |
Frequently Asked Questions (FAQs)
Q1: What are the primary purposes of ClinVar, gnomAD, and HGMD in variant interpretation? These databases serve distinct but complementary roles. ClinVar is a public archive of reports on the relationships between human variations and phenotypes, with submissions from clinical and research laboratories. It provides interpretations of clinical significance (e.g., Pathogenic, VUS, Benign) [104] [105]. gnomAD (the Genome Aggregation Database) is a population frequency database that catalogs genetic variation from large-scale sequencing projects. It is primarily used to assess variant rarity; a high allele frequency in gnomAD is strong evidence for a benign classification for rare diseases [95]. The Human Gene Mutation Database (HGMD) is a commercial database that compiles disease-causing mutations (categorized as DM) and likely disease-causing mutations (DM?) from the scientific literature [105].
Q2: A variant I found has a "VUS" classification in ClinVar but is listed as "Disease-causing" (DM) in HGMD. How should I resolve this conflict? This is a common scenario. A study found that HGMD variants can imply disease prevalence "two orders of magnitude higher" than known rates in healthy populations, suggesting a significant false-positive rate for some entries [105]. Your resolution strategy should involve:
- Check the Evidence: In ClinVar, review the submitter details and the review status (e.g., multiple submitters with no conflicts). For HGMD, check the underlying primary literature cited for the DM classification [105].
- Prioritize Clinical Classifications: Favor the clinical-laboratory-derived classification in ClinVar over the literature-derived HGMD classification, especially if the ClinVar entry has multiple concordant submitters [105].
- Utilize Population Frequency: Query gnomAD. If the variant is present at a frequency too high for the rare disease you are investigating, this is powerful evidence to support the VUS or a benign classification, and to discount the HGMD DM classification [105] [95].
Q3: How reliable is fully automated variant classification compared to manual curation? While automation improves efficiency, standalone automated interpretation still requires manual review. One study found that 22.6% of variants classified as positive (Pathogenic/Likely Pathogenic) based on high-confidence ClinVar entries were classified as negative (VUS/Likely Benign/Benign) by an automated method. On a per-case basis, 63.4% of cases with a high-confidence positive variant were misclassified as negative by the automated software [106]. Automation is excellent for data aggregation, but expert review is critical for synthesizing complex, conflicting, or nuanced evidence [106] [95].
Q4: What steps can I take to minimize the incidence of VUS results in my research?
- Utilize Diverse Population Data: Always filter against population databases like gnomAD. Variants that are too common in any population group are unlikely to cause rare childhood-onset disorders [105] [5].
- Leverage Family Studies: If possible, perform segregation analysis. Co-segregation of a variant with a disease in a family provides strong evidence for pathogenicity [5] [95].
- Implement Rigorous Gene-Disease Validity Checks: Before testing, ensure the genes on your panel have a definitive or strong association with the disease. Including genes with weak evidence increases the likelihood of finding VUS [5].
Q5: How often are VUS reclassified, and what is the typical outcome? Reclassification is an ongoing process. Data suggests that about 10-15% of VUS are eventually reclassified. Of those, the majority (approximately 85-90%) are downgraded to Likely Benign or Benign, while a minority (10-15%) are upgraded to Likely Pathogenic or Pathogenic [5]. This highlights that most VUS are ultimately found to be benign.
Troubleshooting Guides
Problem: Interpreting a VUS with Conflicting Database Evidence You have a variant that is classified as a VUS in ClinVar, is absent from gnomAD, but is listed as a disease-causing mutation (DM) in HGMD.
| Investigation Step | Action | Rationale |
|---|---|---|
| 1. Assess ClinVar Evidence | Check the number of submitters and review status. A VUS with only one submitter is less confident than one reviewed by an expert panel. | ClinVar's "review status" indicates consensus level; multiple submitters reduce conflict chance [104] [105]. |
| 2. Interrogate gnomAD | Verify the variant is truly absent. Check specific sub-populations for very rare variants. | Confirms variant rarity, supporting potential pathogenicity if the disease is rare [95]. |
| 3. Critically Appraise HGMD | Find the original paper cited in HGMD. Assess experimental evidence and check if later studies contradict it. | HGMD's DM tag may be based on old or insufficient functional data; literature may be outdated [105]. |
| 4. Computational Prediction | Run in-silico tools to predict variant impact on protein function. | Provides supporting evidence, though not definitive [95]. |
| 5. Gather Functional Data | Search for recent functional studies in publications or specialized databases. | Functional assay results provide strong evidence for pathogenicity or benign impact [95]. |
Problem: A Previously Classified Pathogenic Variant is Now a VUS in ClinVar A variant you have relied on in your research has been demoted from Pathogenic to VUS in the latest ClinVar update.
| Investigation Step | Action | Rationale |
|---|---|---|
| 1. Check Version History | Use ClinVar's history feature to see the date and reason for the change. Look for new submissions or updated classifications from submitters. | Reclassification is common as evidence accumulates; sixfold more common in ClinVar than HGMD [105]. |
| 2. Identify New Evidence | The reclassification likely stems from new population frequency data or a revised functional interpretation. Check if the variant is now found at high frequency in gnomAD. | A high allele frequency is a strong benign criterion, often triggering reclassification [105] [95]. |
| 3. Update Internal Records | Document the new classification, the date, and the evidence supporting the change in your own records. | Maintains research integrity and ensures future work is based on current knowledge [95]. |
Experimental Protocols for Evidence Gathering
Protocol 1: A Step-by-Step Workflow for VUS Interpretation
This protocol outlines a systematic approach for interpreting a Variant of Uncertain Significance using public databases and ACMG/AMP guidelines [95].
Workflow for VUS Interpretation
Procedure:
- Initial Assessment: Begin with the VUS notation from your sequencing pipeline.
- Population Frequency Filter:
- Query the variant in gnomAD.
- Analysis: If the allele frequency is greater than the disease prevalence in any population, this is strong evidence (BS1 ACMG criterion) to classify the variant as Likely Benign [95].
- Clinical Database Query:
- Literature and Disease Database Check:
- Query HGMD and PubMed for the primary literature associated with the variant.
- Analysis: Critically evaluate the experimental evidence from original publications. Be aware that HGMD's DM classification may not reflect current understanding [105].
- Computational Prediction:
- Utilize in-silico prediction tools (e.g., SIFT, PolyPhen-2, CADD) to assess the variant's potential impact on protein function.
- Analysis: Consistent predictions across multiple tools can provide supporting evidence (PP3 for pathogenic, BP4 for benign) but are not definitive on their own [95].
- Evidence Integration and Classification:
- Weigh all collected evidence according to the ACMG/AMP guideline criteria.
- Analysis: Combine criteria to reach a final classification (Pathogenic, Likely Pathogenic, VUS, Likely Benign, or Benign) [95].
Protocol 2: Validating Automated Variant Classification with Manual Curation
This protocol is for verifying the output of an automated variant interpretation pipeline, which is crucial given the documented discrepancy rates [106].
Procedure:
- Run Automated Classification: Process your variant set through the automated software (e.g., QCI Interpret).
- Extract Raw Data: For a subset of variants (especially all positive calls and a random sample of VUS), extract the raw data and evidence the automated system used to make its classification.
- Manual Database Review:
- Independently query ClinVar, gnomAD, and HGMD as described in Protocol 1.
- Critical Comparison: Compare the evidence found manually with the evidence cited by the automated software. Pay particular attention to:
- Missed Evidence: Does the automation fail to invoke key criteria like PM3 (in trans with a pathogenic variant) or BS2 (observed in healthy individuals)? This was a major cause of false negatives in one study [106].
- Frequency Misapplication: Does the automation correctly handle variants with high population frequency? Misclassification of "high-frequency pathogenic variants" is a known error category [106].
- Adjudicate Discrepancies: For any differences in final classification, determine the root cause. The manual curation, which incorporates expert judgment and a more nuanced review of complex evidence, should be considered the gold standard.
- Documentation: Maintain a log of discrepancies to understand the systematic weaknesses of your automated pipeline and to refine its use.
Research Reagent Solutions
The following table details key databases and tools essential for evidence gathering in clinical variant interpretation.
| Item Name | Type (Database/Tool) | Primary Function in Evidence Gathering |
|---|---|---|
| ClinVar [104] | Public Database | Archives and aggregates clinical interpretations of genetic variants from submitting laboratories, providing insight into consensus and conflicts. |
| gnomAD [95] | Public Database | Provides allele frequency spectra from a large collection of exome and genome sequences, used to assess variant rarity and filter common polymorphisms. |
| HGMD [105] | Commercial Database | Catalogs known published disease-associated mutations and polymorphisms, useful for locating primary literature on variant pathogenicity. |
| ACMG/AMP Guidelines [95] | Classification Framework | A standardized system for classifying variants by combining evidence types (population, functional, computational, etc.) into a final pathogenicity call. |
| In-Silico Prediction Tools [95] | Computational Tools | Software that predicts the functional impact of amino acid substitutions (e.g., on protein structure or function), providing supporting evidence for classification. |
| Qiagen Clinical Insights (QCI) [106] | Automated Interpretation SW | Automates data collection from public sources and applies ACMG/AMP rules to suggest a variant classification; requires manual review. |
The widespread adoption of Next-Generation Sequencing (NGS) has revolutionized genetic testing but simultaneously created a significant interpretive challenge: the overwhelming number of variants of uncertain significance (VUS). These are genetic variants for which available evidence is insufficient to classify them as clearly pathogenic or benign. Current data indicate that VUS substantially outnumber pathogenic findings, with a VUS to pathogenic variant ratio of 2.5 observed in genetic testing for breast cancer predisposition [5]. In clinical practice, more than 70% of all unique variants in the ClinVar database are labeled as VUS, creating a substantial bottleneck for clinical decision-making [107].
The traditional approach to variant classification relies on the American College of Medical Genetics and Genomics and Association for Molecular Pathology (ACMG/AMP) guidelines, which provide a structured framework for evaluating different types of evidence [108]. However, this framework often results in uncertain classifications when evidence is conflicting or missing. The ACMG/AMP-based classification workflow can be viewed as a two-step procedure: first, each variant is characterized by a set of criteria, then the number of criteria across different levels of evidence is evaluated by IF-THEN rules to output the classification [109]. This process frequently fails to provide definitive answers, particularly for rare variants or those in genes with limited functional data.
Machine learning (ML) approaches offer a promising solution to this challenge by leveraging patterns learned from large datasets of previously classified variants. These data-driven methods can integrate diverse evidence types and provide quantitative pathogenicity scores, enabling more nuanced variant prioritization and helping to resolve VUS cases that remain uncertain under conventional ACMG/AMP guidelines [109]. By moving beyond rigid classification rules, ML models can uncover complex relationships between variant characteristics and pathogenicity that might be missed by human experts or traditional rule-based systems.
Technical Support Center
Frequently Asked Questions (FAQs)
Q1: What specific limitations of the ACMG/AMP framework does machine learning address in VUS reclassification?
Machine learning primarily addresses the evidence sparsity and rule rigidity inherent in the ACMG/AMP framework. The ACMG/AMP system relies on 28 criteria covering population data, computational predictions, functional data, and segregation evidence [109]. However, in practice, many variants lack sufficient evidence across these categories, leading to VUS classifications. ML models can handle sparse evidence more effectively by learning from patterns across thousands of variants and features. Furthermore, while the ACMG/AMP workflow follows strict IF-THEN rules, ML approaches provide continuous pathogenicity scores that enable finer stratification of VUS, identifying those more likely to be pathogenic for prioritization in reassessment [109]. This is particularly valuable for rare variants and in genes where specific types of evidence (e.g., functional studies) are unavailable.
Q2: What types of input features are most informative for ML models in variant classification?
ML models for variant classification typically utilize diverse feature categories that mirror the evidence considered in ACMG/AMP guidelines but in a structured, quantitative format. The most comprehensive approaches incorporate multiple feature categories [110]:
- Computational predictions of functional impact: Features from tools like GERP++ (nucleotide conservation), phastCons, SIFT, PolyPhen-2, and MutationTaster2 that predict variant deleteriousness.
- Splicing impact predictions: Scores from algorithms like Human Splicing Finder, MaxEnt, and NNSplice that assess potential effects on RNA splicing.
- Population frequency data: Minor allele frequencies from databases like gnomAD, which provide information about variant prevalence in populations.
- Evolutionary conservation data: Metrics quantifying evolutionary constraint across species.
- Protein structural information: Features indicating location within protein domains, active sites, or conserved regions.
- Clinical and co-occurrence data: Personal and family history information, and data on co-occurrence with known pathogenic variants.
The LEAP model, for instance, utilizes 245 total features spanning these categories to mimic the evidence review performed by expert variant scientists [110].
Q3: How do we validate ML-based VUS reclassifications before clinical implementation?
Robust validation is crucial before implementing ML-based reclassifications in clinical practice. Key strategies include [109]:
- Cross-validation on independent datasets: Using hold-out datasets not used during model training to assess performance. High-performing models should achieve Area Under the Receiver Operating Characteristic Curve (AUROC) values above 97% [110].
- Generalizability testing: Validating model predictions on genes completely withheld from training. For example, the LEAP model maintained 96.8% AUROC on withheld genes, demonstrating broad applicability [110].
- Benchmarking against existing methods: Comparing ML model performance against traditional in silico prediction tools (like CADD or REVEL) and guidelines-based scoring methodologies.
- Blind prediction challenges: Participating in independent assessments like the Critical Assessment of Genome Interpretation (CAGI), where variations of the LEAP model performed competitively against other published and newly developed models [110].
Q4: Our ML model consistently misclassifies variants in specific genomic regions. What troubleshooting steps should we take?
Consistent misclassification in specific genomic regions suggests potential data or feature bias. Consider these troubleshooting steps:
- Analyze training data representation: Examine whether variants from these regions are underrepresented in your training set. If so, augment training data with more examples from these regions or apply techniques to address class imbalance.
- Investigate feature performance: Identify which features have the highest importance scores for these problematic classifications and validate whether these features are accurately calculated for the regions in question.
- Review gene-specific variation patterns: Normal variation patterns differ significantly across genes. Ensure your model accounts for gene-specific tolerance to variation, potentially by incorporating gene-specific features or using gene-aware models.
- Check for technical artifacts: Verify that sequencing quality metrics and variant calling confidence are consistent across these regions, as technical artifacts can be misinterpreted by ML models as biological signals.
Troubleshooting Guides
Problem: High Rate of VUS in Healthy Control Cohorts
Issue: When applying NGS-based screening to healthy populations, an unexpectedly high rate of VUS is observed—up to 50% of individuals carrying rare "strong" VUS in certain gene sets [21].
Solution:
- Implement stringent variant prioritization: Focus reporting on strictly pathogenic variants initially, acknowledging that this reduces the negative predictive value of the test [21].
- Incorporate gene-specific variation patterns: Use gene-specific knowledge about variation tolerance from the literature to prioritize variants most likely to be disease-causing.
- Utilize structural protein information: Leverage protein structure data to identify variants affecting critical functional domains or residues.
- Apply homopolymer context filters: Consider sequence context, such as homopolymer length, which can help identify technical artifacts [110].
Problem: Discrepant Classifications Between ML Models and Traditional ACMG/AMP
Issue: Your ML model assigns high pathogenicity scores to variants classified as VUS by traditional ACMG/AMP guidelines, creating interpretation conflicts.
Solution:
- Conduct evidence gap analysis: Systematically identify which specific ACMG/AMP criteria are not met for these variants and determine if the ML model is leveraging alternative evidence sources.
- Perform feature importance analysis: Use model interpretation tools to identify which features are driving the high pathogenicity scores and validate their reliability.
- Implement reconciliation framework: Develop a decision matrix for how to handle discrepancies (e.g., requiring additional evidence for reclassification when ML predictions contradict ACMG/AMP rules).
- Seek external validation: Check if similar variants have been reclassified in public databases or published literature, and use functional studies to resolve persistent discrepancies.
Problem: Poor Model Performance on Non-European Populations
Issue: ML model shows degraded performance and higher VUS rates for populations of non-European ancestry, reflecting known disparities in genomic databases [5] [111].
Solution:
- Diversify training data: Actively incorporate variants from diverse populations into training sets, including populations of African, Asian, and admixed ancestry.
- Implement population-stratified features: Use population-specific allele frequency data rather than aggregated frequencies.
- Apply fairness-aware ML techniques: Use algorithms that explicitly account for and mitigate bias against underrepresented groups.
- Collaborate with diverse cohorts: Establish partnerships with research institutions serving diverse populations to improve data representation.
Experimental Protocols & Workflows
Machine Learning Model Training for Variant Classification
This protocol outlines the methodology for training an ML model for variant classification, based on approaches described in Nicora et al. and LEAP [109] [110].
Materials:
- Curated dataset of variants with known classifications (pathogenic/benign)
- Variant annotation pipeline
- Machine learning framework (e.g., Python scikit-learn)
- High-performance computing resources
Procedure:
- Data Collection and Curation:
- Collect variants from public databases (ClinVar, Clinvitae) with expert-reviewed classifications.
- Apply strict quality filters: remove variants with conflicting interpretations and those from submitters with potential conflicts of interest.
- Split data into training (60%), probability threshold tuning (30%), and testing (10%) sets while maintaining class proportions [109].
Feature Engineering:
- Annotate variants with features spanning multiple categories (see Table 1).
- Calculate population genetics metrics (allele frequencies, constraint metrics).
- Compute computational predictions (functional impact, splicing effect).
- Encode structural and conservation features (protein domains, evolutionary conservation).
- Normalize and scale continuous features.
Model Training:
- Implement multiple algorithm types: Penalized Logistic Regression, Random Forest, Support Vector Machines.
- Apply regularization techniques to prevent overfitting.
- Use cross-validation to optimize hyperparameters.
- For Logistic Regression: Apply L2 regularization and optimize the regularization strength [109].
Model Validation:
- Evaluate performance on held-out test set using AUROC, precision-recall curves.
- Assess generalizability on completely independent datasets.
- Compare against baseline methods (traditional in silico predictors, guideline-based scores).
Interpretation and Deployment:
- Implement feature importance analysis to explain model predictions.
- Establish pathogenicity score thresholds for classification categories.
- Deploy model with continuous monitoring and periodic retraining.
VUS Reclassification Validation Framework
This protocol provides a systematic approach for validating ML-predicted VUS reclassifications.
Materials:
- ML-prioritized VUS list
- Access to clinical and population data
- Functional validation capabilities (if available)
- Literature mining tools
Procedure:
- Computational Evidence Consolidation:
- Perform comprehensive literature review for similar variants.
- Query updated population databases for frequency information.
- Check for new functional predictions or conservation data.
Clinical Correlation Analysis:
- Examine phenotype-match between patient clinical features and gene-associated conditions.
- Analyze segregation in affected families when available.
- Review for occurrence de novo in sporadic cases.
Experimental Validation (if resources allow):
- Design functional assays based on gene function (e.g., enzyme activity, protein localization).
- Implement multiplexed functional assays for high-throughput validation [107].
- Consider model organism studies for high-impact potential reclassifications.
Expert Review and Classification:
- Present consolidated evidence to multidisciplinary review team.
- Apply ACMG/AMP criteria to updated evidence.
- Document classification decision and supporting evidence.
Reporting and Database Updates:
- Report reclassifications to clinicians and patients as appropriate.
- Submit updated classifications to public databases (ClinVar).
- Update internal databases and trigger patient re-contact procedures when indicated.
The Scientist's Toolkit: Research Reagent Solutions
Table 1: Essential Research Reagents and Computational Tools for ML-Based VUS Reclassification
| Item | Function/Application | Examples/Specifications |
|---|---|---|
| Variant Annotation Tools | Comprehensive variant functional annotation and effect prediction | ANNOVAR, SnpEff, VEP (Variant Effect Predictor) |
| In Silico Prediction Algorithms | Computational prediction of variant deleteriousness and functional impact | SIFT, PolyPhen-2, CADD, REVEL, MutationTaster |
| Conservation Scores | Quantification of evolutionary constraint at variant position | GERP++, phastCons, phyloP |
| Population Frequency Databases | Reference datasets for allele frequency across populations | gnomAD, 1000 Genomes, dbSNP |
| Machine Learning Frameworks | Implementation and training of ML classification models | Python scikit-learn, TensorFlow, PyTorch |
| Variant Classification Databases | Curated databases of classified variants for model training | ClinVar, HGMD (licensed), Clinvitae (historical) |
| Functional Prediction Features | Splicing impact and regulatory element predictions | Human Splicing Finder, MaxEntScan, Skippy |
| Protein Domain Databases | Structural and functional protein domain information | InterPro, Pfam, SMART |
Workflow Visualizations
VUS ML Reclassification Workflow - This diagram illustrates the end-to-end process for machine learning-assisted VUS reclassification, from data collection through final classification and reporting.
ML Model Validation Framework - This visualization outlines the comprehensive validation process required for ML models in VUS classification before clinical implementation, including performance targets.
Conclusion
Effectively managing Variants of Uncertain Significance is not a single-step process but requires a multifaceted strategy that integrates technological advancements, sophisticated bioinformatics, and continuous data curation. The journey from a VUS to a definitive classification hinges on the synergistic application of evolving guidelines, explainable AI models, and functional validation. For the field of drug development, robust VUS management is becoming indispensable for defining clean patient cohorts, discovering biomarkers, and developing targeted therapies. Future progress will rely on larger, more diverse population datasets, the standardization of computational pipelines, and the deeper integration of multi-omics and functional genomics to illuminate the clinical significance of the vast genomic terra incognita that VUS currently represent.
References
- 1. Variant of Uncertain Significance (VUS) [https://www.genome.gov/genetics-glossary/Variant-of-Uncertain-Significance-VUS]
- 2. Variants of Uncertain Significance: Should We Revisit How ... [https://pmc.ncbi.nlm.nih.gov/articles/PMC5999032/]
- 3. Variants of uncertain significance in the era of high-throughput ... [https://jeccr.biomedcentral.com/articles/10.1186/s13046-020-01554-6]
- 4. VUS – The Most Maligned Result in Genetic Testing [https://www.blueprintgenetics.com/resources/vus-the-most-maligned-result-in-genetic-testing/]
- 5. The challenge of genetic variants of uncertain clinical ... [https://pmc.ncbi.nlm.nih.gov/articles/PMC10555957/]
- 6. Solving the Problem of Uncertain Significance - by Stetson [https://stetson.substack.com/p/solving-the-problem-of-uncertain]
- 7. Handling variants of uncertain significance (VUS) in clinical ... [https://sanogenetics.com/resources/blog/handling-variants-of-uncertain-significance-vus-in-clinical-trials]
- 8. Targeted Gene Panels: Revolutionizing Genomic Testing ... [https://blog.crownbio.com/targeted-gene-panels-genomic-testing-oncology]
- 9. Variants of uncertain significance: At the crux of diagnostic ... [https://www.sciencedirect.com/science/article/abs/pii/S0378111925003762]
- 10. Next Generation Sequence Testing: Essential 2025 Guide [https://lifebit.ai/blog/next-generation-sequence-testing/]
- 11. Genetic testing found a variant of uncertain significance. ... [https://www.mdanderson.org/cancerwise/genetic-testing-found-a-variant-of-uncertain-significance--now-what.h00-159464001.html]
- 12. Help Patients Understand Genomic Variants of Unknown ... [https://www.ons.org/publications-research/voice/news-views/07-2020/help-patients-understand-genomic-variants-unknown]
- 13. Provider FAQs: Technology, quality, & scientific contribution [https://www.invitae.com/us/provider-faqs/tech-and-quality]
- 14. NGS Approaches in Clinical Diagnostics: From Workflow to ... [https://pmc.ncbi.nlm.nih.gov/articles/PMC12524640/]
- 15. Leveraging underrepresented population data improves ... [https://www.nature.com/articles/s41598-025-18852-8]
- 16. Reassessment of variants of uncertain significance in ... [https://www.nature.com/articles/s41431-025-01911-z]
- 17. The impact of VUS reclassification on reproductive decision ... [https://pmc.ncbi.nlm.nih.gov/articles/PMC12111534/]
- 18. RARE Advocacy Exchange Session 7, Getting a Precise ... [https://globalgenes.org/blog/rare-advocacy-exchange-session-7-getting-a-precise-genetic-diagnosis/]
- 19. How Literature-Derived Real-World Evidence Is Reshaping ... [https://www.genomenon.com/blog/literature-derived-real-world-evidence-reshaping-trial-design]
- 20. Ethical, legal, and policy dimensions and contentions for ... [https://www.frontiersin.org/journals/genetics/articles/10.3389/fgene.2025.1685854/full]
- 21. Challenges for the implementation of next generation ... [https://www.nature.com/articles/s41431-022-01267-8]
- 22. Clinical development times for innovative drugs - PMC [https://pmc.ncbi.nlm.nih.gov/articles/PMC9869766/]
- 23. Preconception carrier screening in 2025: what's next? [https://link.springer.com/article/10.1007/s12687-025-00778-3]
- 24. Incidental Identification of Potentially Affected Individuals ... [https://pubmed.ncbi.nlm.nih.gov/40682177/]
- 25. Understanding ACMG Guidelines: Standards for Genetic ... [https://3billion.io/blog/what-are-the-acmg-standards-and-guidelines-and-how-do-they-work]
- 26. Overview of specifications to the ACMG/AMP variant ... [https://pmc.ncbi.nlm.nih.gov/articles/PMC6885382/]
- 27. Sherloc: a comprehensive refinement of the ACMG - AMP variant... [https://pubmed.ncbi.nlm.nih.gov/28492532/]
- 28. acmgscaler: An R package and Colab for standardised gene-level... [https://www.research.ed.ac.uk/en/publications/acmgscaler-an-r-package-and-colab-for-standardised-gene-level-var]
- 29. Recommendations for application of the functional evidence... [https://genomemedicine.biomedcentral.com/articles/10.1186/s13073-019-0690-2]
- 30. Article Updated ACMG/AMP specifications for variant ... [https://www.sciencedirect.com/science/article/pii/S2949774425014694]
- 31. Reclassification of VUS in BRCA1 and BRCA2 using the ... [https://pmc.ncbi.nlm.nih.gov/articles/PMC11869971/]
- 32. Editorial: Functional Study of Novel VUS (Variant ... [https://www.frontiersin.org/journals/genetics/articles/10.3389/fgene.2025.1578736/abstract]
- 33. Integrating Artificial Intelligence in Next-Generation Sequencing [https://pmc.ncbi.nlm.nih.gov/articles/PMC12191491/]
- 34. Interpretable machine learning for genomics - PMC [https://pmc.ncbi.nlm.nih.gov/articles/PMC8527313/]
- 35. Explicable prioritization of genetic variants by integration of ... [https://humgenomics.biomedcentral.com/articles/10.1186/s40246-024-00595-8]
- 36. SeqOne's DiagAI Score Brings Transparency to Genomic ... [https://www.seqone.com/news-insights/seqone-diagai-explainable-ai]
- 37. Understanding variants of unknown significance and ... [https://pmc.ncbi.nlm.nih.gov/articles/PMC11299939/]
- 38. An optimized variant prioritization process for rare disease ... [https://pmc.ncbi.nlm.nih.gov/articles/PMC12539062/]
- 39. Anticipating ACMG Guideline Changes [https://www.genomenon.com/blog/anticipating-acmg-guideline-changes-genomenons-path-v4-readiness]
- 40. Calibration of additional computational tools expands ... [https://www.sciencedirect.com/science/article/pii/S1098360025000498]
- 41. Calibration of additional computational tools expands ClinGen ... [https://pubmed.ncbi.nlm.nih.gov/40084623/]
- 42. New QCI Interpret 2025 Release enhances variant filtering, ... [https://digitalinsights.qiagen.com/news/blog/clinical/qci-interpret-2025-release/]
- 43. Specifications of the ACMG/AMP variant curation guidelines ... [https://pubmed.ncbi.nlm.nih.gov/40967221/]
- 44. Calibrated Classification Package: Applying ACMG/AMP ... [https://www.opencravat.org/calibrated-classification-package-applying-acmg-amp-guidelines-to-computational-predictors-in-opencravat/]
- 45. How NGS Automation Improves Library Preparation ... [https://www.euformatics.com/blog-post/how-ngs-automation-improves-library-preparation-efficiency-and-accuracy]
- 46. Golden Helix: Charting Our 2025 Strategy [https://www.goldenhelix.com/blog/golden-helix-charting-our-2025-strategy/]
- 47. Sequence Variant Interpretation [https://clinicalgenome.org/working-groups/sequence-variant-interpretation/]
- 48. Horizon's Quest on Resolving Variant of Uncertain ... [https://genomearc.com/blog-show/MjA6OlRhbnZpclNS]
- 49. Integrated multi-omics for rapid rare disease diagnosis on ... [https://www.nature.com/articles/s41591-023-02401-9]
- 50. Integration of multi-omics technologies for molecular ... [https://pmc.ncbi.nlm.nih.gov/articles/PMC10794629/]
- 51. Multiomics | A holistic view of human health [https://www.illumina.com/techniques/multiomics.html]
- 52. How Does Spatial Transcriptomics Work? [https://vizgen.com/how-does-spatial-transcriptomics-work/]
- 53. Navigating transcriptomic connectivity mapping workflows to ... [https://pmc.ncbi.nlm.nih.gov/articles/PMC10483698/]
- 54. A workflow for the integrative transcriptomic description of ... [https://www.nature.com/articles/s41598-018-25754-5]
- 55. Explicable prioritization of genetic variants by integration ... [https://pmc.ncbi.nlm.nih.gov/articles/PMC10956189/]
- 56. A variant prioritization tool leveraging multiple instance ... [https://www.medrxiv.org/content/10.1101/2024.04.18.24305632v1.full-text]
- 57. Best practices for the interpretation and reporting of clinical ... [https://www.nature.com/articles/s41525-022-00295-z]
- 58. Resources and tools for rare disease variant interpretation [https://pmc.ncbi.nlm.nih.gov/articles/PMC10206239/]
- 59. Determination of high-confidence germline genetic variants ... [https://pmc.ncbi.nlm.nih.gov/articles/PMC12326712/]
- 60. New AI model could speed rare disease diagnosis [https://www.broadinstitute.org/news/new-ai-model-could-speed-rare-disease-diagnosis]
- 61. AI Model Identifies Genetic Variants in Rare Diseases [https://www.azorobotics.com/News.aspx?newsID=16265]
- 62. Proteome-Wide AI Model Supports Rare Disease ... [https://www.genengnews.com/topics/artificial-intelligence/proteome-wide-ai-model-supports-rare-disease-diagnosis-using-evolution/]
- 63. A performance evaluation study: Variant annotation tools [https://www.sciencedirect.com/science/article/pii/S2153353922007246]
- 64. The promises and pitfalls of automated variant interpretation [https://pmc.ncbi.nlm.nih.gov/articles/PMC12513165/]
- 65. Benchmarking large language models GPT-4o, llama 3.1, ... [https://www.nature.com/articles/s41698-025-00935-4]
- 66. A Simplified Approach to Somatic Analysis in NGS [https://www.euformatics.com/blog-post/a-simplified-approach-to-somatic-analysis-in-ngs]
- 67. AnFiSA: An open-source computational platform for the ... [https://www.sciencedirect.com/science/article/pii/S153204642200185X]
- 68. Artificial intelligence and database for NGS-based diagnosis ... [https://pmc.ncbi.nlm.nih.gov/articles/PMC10870236/]
- 69. Why quality control (QC) is performed for NGS testing [https://3billion.io/blog/why-quality-control-qc-is-performed-for-ngs-testing]
- 70. Sample Preparation for NGS – A Comprehensive Guide [https://frontlinegenomics.com/sample-preparation-for-ngs-a-comprehensive-guide/]
- 71. Recommendations for bioinformatics in clinical practice [https://genomemedicine.biomedcentral.com/articles/10.1186/s13073-025-01543-4]
- 72. Evolving Standards in Clinical NGS (updated) [https://www.euformatics.com/blog-post/evolving-standards-in-clinical-ngs]
- 73. Variant of uncertain significance (VUS) — Knowledge Hub [https://www.genomicseducation.hee.nhs.uk/genotes/knowledge-hub/variant-of-uncertain-significance-vus/]
- 74. Rare Disease Screening: How NGS and AI Are Transforming ... [https://compassbioinfo.com/blog/rare-disease-screening-how-ngs-and-ai-are-transforming-diagnosis/]
- 75. Expanded carrier screening: counseling and considerations [https://pmc.ncbi.nlm.nih.gov/articles/PMC7195224/]
- 76. Clinical application of expanded carrier screening based ... [https://pmc.ncbi.nlm.nih.gov/articles/PMC12374860/]
- 77. Clinical experience of the expanded carrier screening for ... [https://www.nature.com/articles/s41598-025-99253-9]
- 78. How-to: NGS Quality Control [https://frontlinegenomics.com/how-to-ngs-quality-control/]
- 79. File format validation, an example with FASTQ files [https://hackmd.io/@FAIRcookbook/HJoMxQcC8]
- 80. 13. File format validation, FASTQ example [https://fairplus.github.io/the-fair-cookbook/content/recipes/interoperability/fastq-file-format-validators.html]
- 81. Statistical guidelines for quality control of next-generation ... [https://pmc.ncbi.nlm.nih.gov/articles/PMC8408346/]
- 82. Genome-wide functional annotation of variants [https://www.frontiersin.org/journals/pharmacology/articles/10.3389/fphar.2025.1474026/full]
- 83. Automatic assessment of alignment quality - PMC [https://pmc.ncbi.nlm.nih.gov/articles/PMC1316116/]
- 84. A new approach for rare variation collapsing on functional ... [https://pmc.ncbi.nlm.nih.gov/articles/PMC6499321/]
- 85. A deep catalogue of protein-coding variation in ... [https://www.nature.com/articles/s41586-024-07556-0]
- 86. NGS for Beginners | Learn the basics of NGS [https://www.illumina.com/science/technology/next-generation-sequencing/beginners.html]
- 87. Considerations for Variants of Uncertain Significance (VUS) [https://www.rarediseasegenes.com/variants-of-uncertain-significance/]
- 88. Eleven grand challenges in single-cell data science [https://genomebiology.biomedcentral.com/articles/10.1186/s13059-020-1926-6]
- 89. Challenges in Clinicogenetic Correlations: One Phenotype [https://pmc.ncbi.nlm.nih.gov/articles/PMC8015914/]
- 90. Functional phenotyping of genomic variants using joint ... [https://www.nature.com/articles/s41592-025-02805-0]
- 91. Overcoming Challenges in NGS Workflows with Automated ... [https://dispendix.com/blog/overcoming-challenges-in-ngs-workflows-with-automated-sample-prep]
- 92. NGS Library Preparation Support—Troubleshooting [https://www.thermofisher.com/us/en/home/technical-resources/technical-reference-library/next-generation-sequencing-support-center/ngs-library-preparation-support/ngs-library-preparation-support-troubleshooting.html]
- 93. Explicable prioritization of genetic variants by integration of ... [https://pubmed.ncbi.nlm.nih.gov/38509596/]
- 94. Interpretable Clinical Genomics with a Likelihood Ratio ... [https://pubmed.ncbi.nlm.nih.gov/32755546/]
- 95. A Practical Guide to Clinical Variant Interpretation [https://www.euformatics.com/blog-post/a-practical-guide-to-clinical-variant-interpretation]
- 96. Sanger Sequencing for Validation of Next - Generation Sequencing [https://www.cd-genomics.com/resource-sanger-sequencing-for-next-generation-sequencing-validation.html]
- 97. Reporting practices for variants from of ... uncertain significance next [https://pubmed.ncbi.nlm.nih.gov/28774848/]
- 98. How to Troubleshoot Sequencing Preparation Errors (NGS ... [https://www.cd-genomics.com/resource-sequencing-preparation-troubleshooting.html]
- 99. Webcast Recap: Validating a Next -Gen Sequencing Workflow [https://www.goldenhelix.com/blog/webcast-recap-best-practices-for-validating-a-next-gen-sequencing-workflow/]
- 100. Design and validation of a clinical whole genome ... [https://pmc.ncbi.nlm.nih.gov/articles/PMC12554564/]
- 101. Evaluation of different in silico tools for the assessment of ... [https://jmhg.springeropen.com/articles/10.1186/s43042-025-00734-3]
- 102. Comparative analysis of in-silico tools in identifying ... [https://pmc.ncbi.nlm.nih.gov/articles/PMC11102593/]
- 103. NGS Sequencing Support | Thermo Fisher Scientific - US [https://www.thermofisher.com/us/en/home/technical-resources/technical-reference-library/next-generation-sequencing-support-center/ngs-support.html]
- 104. VCV000199689.55 - ClinVar - NCBI - NIH [https://www.ncbi.nlm.nih.gov/clinvar/variation/199689]
- 105. ClinVar and HGMD genomic variant classification accuracy ... [https://genomemedicine.biomedcentral.com/articles/10.1186/s13073-023-01199-y]
- 106. Assessment of an automated approach for variant ... [https://pmc.ncbi.nlm.nih.gov/articles/PMC9747559/]
- 107. Systematic gaps in reporting variants of uncertain ... [https://www.sciencedirect.com/science/article/pii/S1098360025001480]
- 108. Standards and Guidelines for the Interpretation of Sequence ... [https://pmc.ncbi.nlm.nih.gov/articles/PMC4544753/]
- 109. A machine learning approach based on ACMG/AMP ... [https://www.nature.com/articles/s41598-022-06547-3]
- 110. LEAP: Using machine learning to support variant ... [https://pmc.ncbi.nlm.nih.gov/articles/PMC7317941/]
- 111. Reclassification of variants of uncertain significance by ... [https://www.frontiersin.org/journals/oncology/articles/10.3389/fonc.2025.1455509/full]