Hydrogen Bond Acceptor, Donor, and Hydrophobic Features: The Essential Guide to Pharmacophore Modeling in Drug Discovery
This article provides a comprehensive overview of the core pharmacophore features—hydrogen bond acceptors, donors, and hydrophobic groups—which are fundamental to molecular recognition in drug design.
Hydrogen Bond Acceptor, Donor, and Hydrophobic Features: The Essential Guide to Pharmacophore Modeling in Drug Discovery
Abstract
This article provides a comprehensive overview of the core pharmacophore features—hydrogen bond acceptors, donors, and hydrophobic groups—which are fundamental to molecular recognition in drug design. Tailored for researchers and drug development professionals, it explores the foundational concepts, generation methodologies, and practical applications of these features in virtual screening and lead optimization. The content further addresses common challenges in model development, outlines robust validation techniques, and compares different computational approaches, serving as a complete resource for integrating pharmacophore modeling into modern drug discovery workflows.
Defining the Core Triad: Understanding Hydrogen Bond Acceptor, Donor, and Hydrophobic Pharmacophore Features
The IUPAC Definition and Historical Context of the Pharmacophore Concept
In the field of computer-aided drug design, the pharmacophore concept serves as an indispensable abstract bridge connecting molecular structure to biological activity. It is a foundational model that distills the essential, three-dimensional features of a ligand responsible for its recognition by a biological target. For researchers and drug development professionals, understanding the precise definition and historical evolution of this concept is critical for its effective application in modern workflows, from virtual screening to lead optimization. This whitepaper delineates the official IUPAC definition of the pharmacophore, traces its contentious historical origins, and contextualizes its practical application within ongoing research concerning key feature types like hydrogen bond acceptors, donors, and hydrophobic regions.
The official definition, as established by the International Union of Pure and Applied Chemistry (IUPAC), states that a pharmacophore is "an ensemble of steric and electronic features that is necessary to ensure the optimal supramolecular interactions with a specific biological target structure and to trigger (or to block) its biological response" [1] [2]. This definition emphasizes that a pharmacophore is not a real molecule or a specific scaffold, but rather an abstract concept that captures the common molecular interaction capacities of a group of compounds towards their target structure [2]. It is the largest common denominator shared by active molecules, independent of their underlying chemical architecture [3].
The IUPAC Definition and Core Principles
Deconstruction of the Formal Definition
The IUPAC definition can be deconstructed into three core principles that are vital for its correct application in research:
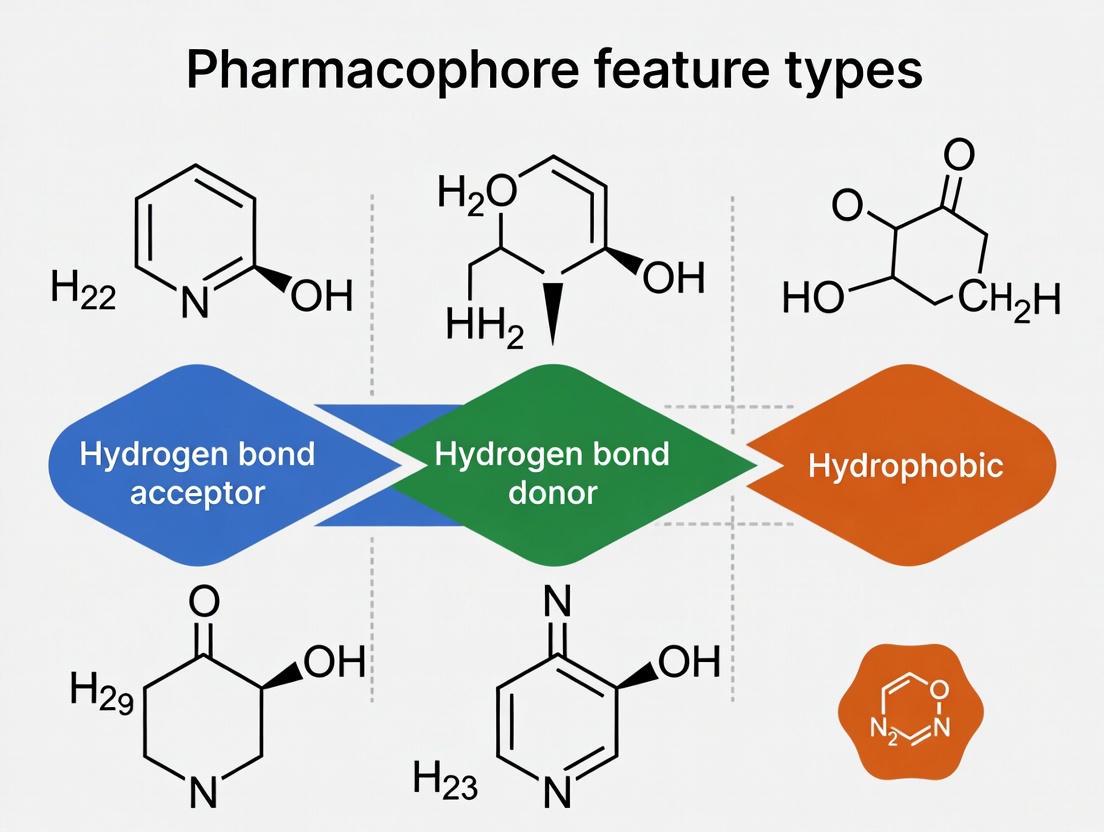
- Ensemble of Steric and Electronic Features: A pharmacophore is defined by a set of features, not specific chemical groups. These features represent molecular interaction capacities such as hydrogen bond donation/acceptance, charge, and hydrophobicity [4] [2].
- Optimal Supramolecular Interactions: The model describes the ideal spatial arrangement of features required for a ligand to interact with its target. This involves specific geometries, distances, and angles between features to enable key interactions like hydrogen bonding, ionic bonding, and π-stacking [3].
- Biological Response: The ultimate purpose of the pharmacophore is to explain or predict the biological activity—either triggering or blocking a response—that arises from successful molecular recognition [1].
A critical common misunderstanding in medicinal chemistry literature, which the IUPAC note explicitly discards, is the misuse of the term "pharmacophore" to refer to simple chemical functionalities (e.g., guanidines, sulphonamides) or typical structural skeletons (e.g., flavones, steroids) [2]. The pharmacophore is an abstract pattern of features, not a specific molecular fragment.
Essential Pharmacophore Features and Their Characteristics
The table below summarizes the key pharmacophore features, their geometric representations, and the primary interaction types they mediate, which are central to research on hydrogen bond acceptors, donors, and hydrophobic domains.
Table 1: Core Pharmacophore Features and Their Interaction Characteristics
| Feature Type | Geometric Representation | Primary Interaction Types | Common Structural Examples |
|---|---|---|---|
| Hydrogen-Bond Acceptor (HBA) | Vector or Sphere [4] | Hydrogen-Bonding [4] | Amines, Carboxylates, Ketones, Alcoholes [4] |
| Hydrogen-Bond Donor (HBD) | Vector or Sphere [4] | Hydrogen-Bonding [4] | Amines, Amides, Alcoholes [4] |
| Aromatic (AR) | Plane or Sphere [4] | π-Stacking, Cation-π [4] | Any aromatic ring system [4] |
| Positive Ionizable (PI) | Sphere [4] | Ionic, Cation-π [4] | Ammonium Ions, Metal Cations [4] |
| Negative Ionizable (NI) | Sphere [4] | Ionic [4] | Carboxylates, Phosphates [4] |
| Hydrophobic (H) | Sphere [4] | Hydrophobic Contact [4] | Alkyl Groups, Alicycles, non-polar aromatic rings [4] |
Historical Evolution of the Pharmacophore Concept
The origin of the pharmacophore concept has been a subject of historical debate, which has been clarified by modern research. The timeline of its evolution shows a clear transition from concrete chemical groups to abstract feature patterns.
Table 2: Historical Milestones in the Development of the Pharmacophore Concept
| Date | Key Figure/Entity | Contribution | Interpretation of "Pharmacophore" |
|---|---|---|---|
| 1898 | Paul Ehrlich [5] | Identified peripheral chemical groups responsible for binding and biological effects in his 1898 paper [5]. | Referred to these groups as "toxophores" and "haptophores"; the concept existed without the term [5]. |
| Early 1900s | Ehrlich's Contemporaries [5] | Used the term "pharmacophore" for the features Ehrlich described as "toxophores" [5]. | The term entered usage, but attributed to the same concept Ehrlich pioneered [5]. |
| 1960 | F.W. Schueler [5] [1] | Redefined the term in his book "Chemobiodynamics and Drug Design," using "pharmacophoric moiety" [1]. | Shifted the meaning towards spatial patterns of abstract features, forming the basis of the modern definition [5]. |
| 1967-1971 | Lemont B. Kier [5] [1] | Popularized the modern concept in a 1967 paper and used the term in a 1971 publication [1]. | Embraced the abstract, modern definition, aligning with Schueler's redefinition [5]. |
| 1998 | IUPAC [1] [2] | Formalized the official definition in its recommendations [1] [2]. | Defined as "an ensemble of steric and electronic features..." cementing the abstract model [1]. |
For decades, Paul Ehrlich was credited with originating the concept in the early 1900s. However, this was challenged by John Van Drie in 2007, who noted that Ehrlich never actually used the word "pharmacophore" in his writings, instead referring to "toxophores" for the groups responsible for toxic effects [5] [1]. Van Drie argued that the erroneous attribution to Ehrlich stemmed from a citation in a 1966 paper by Ariëns, and credited Kier with developing the modern concept [5].
Recent historical research by Güner et al. has resolved this conflict. Their investigation confirms that while Ehrlich did not use the specific term, he indeed originated the core concept in his 1898 paper, which described "peripheral chemical groups in molecules responsible for binding that leads to the subsequent biological effect" [5]. The term "pharmacophore" was used by his contemporaries for these same features. The modern shift in meaning, from "chemical groups" to "patterns of abstract features," is credited to Schueler (1960), with Kier later popularizing this refined concept [5] [1]. Therefore, Ehrlich is the originator of the concept, while Schueler and Kier are the architects of its modern definition.
Methodological Approaches and Experimental Protocols
The generation of a pharmacophore model is a systematic process that can be achieved through several computational approaches, depending on the available data. The following workflow generalizes the key steps involved in ligand-based and structure-based pharmacophore modeling.
Detailed Experimental Protocol for Structure-Based Modeling
The following protocol, inspired by a study to discover novel Akt2 inhibitors, details the steps for structure-based pharmacophore generation [6].
- Objective: To generate a structure-based pharmacophore model for a target protein with a known 3D structure.
- Software Requirements: A molecular modeling suite with structure-based pharmacophore generation capabilities (e.g., Discovery Studio, Schrödinger Suite) [6] [2].
- Input Data: A high-resolution crystal structure of the target protein, preferably in complex with a ligand (e.g., from the Protein Data Bank, PDB) [6].
Step-by-Step Methodology:
Structure Preparation:
- Retrieve the protein structure (e.g., PDB ID: 3E8D for Akt2) [6].
- Use a protein preparation wizard to add hydrogen atoms, correct protonation states of residues (e.g., His, Asp, Glu), and optimize hydrogen bonding networks [7].
- Perform a restrained energy minimization to relieve steric clashes, typically until the average root-mean-square deviation (RMSD) of the non-hydrogen atoms reaches a threshold like 0.3 Å [7].
Binding Site Definition:
- Define the spatial coordinates of the binding site. This is often done by selecting all amino acid residues within a specified radius (e.g., 7.0 Å) from the co-crystallized ligand [6].
Interaction Generation and Feature Extraction:
- Use an "Interaction Generation" protocol to analyze the binding site and identify all potential interaction points (pharmacophore features) with a hypothetical ligand [6].
- The algorithm will map the site for regions that can act as hydrogen bond acceptors, donors, hydrophobic interaction areas, etc., based on the protein's amino acid chemistry [4] [6].
Feature Clustering and Model Editing:
- The initial set of features is often redundant. Use an "Edit and Cluster" tool to group similar features and select only the representative features with critical catalytic or binding importance [6].
- Manually review and curate the features to retain those most likely to contribute significantly to ligand binding affinity.
Inclusion of Exclusion Volumes:
Model Validation:
- Test Set Validation: Screen a database of known active and inactive compounds. A valid model should retrieve most active compounds and reject inactives [6].
- Decoy Set Validation: Use a set of molecules containing a small number of known actives and many presumed inactives (decoys). Calculate the Enrichment Factor (EF) to quantify the model's ability to prioritize active compounds over decoys [6]. A high EF indicates a robust and selective model.
The Scientist's Toolkit: Essential Reagents and Software
The following table lists key computational tools and resources essential for conducting pharmacophore modeling research.
Table 3: Essential Research Tools for Pharmacophore Modeling
| Tool/Resource Name | Type/Category | Primary Function in Research |
|---|---|---|
| PDB (Protein Data Bank) [2] | Database | Repository for 3D structural data of proteins and nucleic acids, used as input for structure-based modeling. |
| PHASE [8] [7] | Software Module | Used for generating both ligand-based and structure-based pharmacophore models, and for virtual screening. |
| DS (Discovery Studio) [6] | Software Suite | A comprehensive environment for molecular modeling that includes tools for structure-based pharmacophore generation, 3D-QSAR, and model validation. |
| Decoy Set [6] | Validation Resource | A carefully curated set of molecules used to validate the discriminatory power of a pharmacophore model by calculating enrichment factors. |
| ConfGen [7] | Software Algorithm | Generates a set of low-energy conformations for each ligand in a database, which is a critical pre-processing step for pharmacophore screening. |
Applications in Modern Drug Discovery
Pharmacophore modeling is deeply integrated into contemporary computer-aided drug design workflows, playing several key roles.
Virtual Screening: One of the primary applications is the rapid in-silico screening of large chemical databases (e.g., ZINC, commercial libraries) to identify novel compounds that match the pharmacophore query [4] [9]. This allows researchers to prioritize a manageable number of high-probability hits for experimental testing, significantly reducing time and cost [6].
Lead Optimization: Pharmacophore models guide medicinal chemists in modifying lead compounds. By understanding the essential features (e.g., a critical hydrogen bond donor) and their spatial relationships, chemists can make informed decisions to improve potency, selectivity, and ADMET (Absorption, Distribution, Metabolism, Excretion, Toxicity) properties [6] [9].
Scaffold Hopping: The abstract nature of pharmacophores enables the identification of structurally diverse compounds that share the same essential interaction features. This "scaffold hopping" is crucial for discovering novel chemical series and circumventing existing patents [4].
Drug Repurposing: Pharmacophore models can be used to screen known drugs against a new target's pharmacophore. This can rapidly identify existing compounds with potential for new therapeutic applications, a process known as drug repurposing [2] [9].
Understanding Mechanisms of Action: By elucidating the key interactions between a ligand and its biological target, pharmacophore models provide insights into the mechanism of action at a molecular level, which can inform the design of more effective and safer drugs [9].
The pharmacophore concept, originating from Ehrlich's foundational ideas and refined through the work of Schueler and Kier into its modern IUPAC definition, remains a cornerstone of rational drug design. It provides a powerful abstract framework for understanding and exploiting molecular recognition. For researchers focused on specific feature types like hydrogen bond acceptors, donors, and hydrophobic regions, the pharmacophore model offers a quantitative and spatial context to hypothesize and test the critical interactions driving biological activity. As computational methods continue to advance, the integration of pharmacophore modeling with techniques like molecular dynamics and machine learning will further solidify its role as an indispensable tool in the scientist's arsenal, accelerating the discovery of new therapeutics for complex diseases.
In the realm of structure-based drug design, the pharmacophore model serves as an essential framework for understanding and predicting the molecular interactions that underpin biological activity. A pharmacophore is formally defined as "an ensemble of steric and electronic features that is necessary to ensure the optimal supramolecular interactions with a specific biological target and to trigger (or block) its biological response" [10]. Among these features, the hydrogen bond acceptor (HBA) represents a critically important element for molecular recognition. Hydrogen bonding is a specific type of molecular interaction that exhibits partial covalent character and cannot be described as a purely electrostatic force [11]. This technical guide examines the geometric representation of hydrogen bond acceptors, presents key structural examples with relevance to medicinal chemistry, and details experimental and computational methodologies for their quantification within the broader context of pharmacophore-based research.
Fundamental Concepts and Geometric Representation
Definition and Components of a Hydrogen Bond
A hydrogen bond (H-bond) is an attractive interaction between a hydrogen atom from a molecule or a molecular fragment X−H (where X is more electronegative than H), and an atom or group of atoms in the same or different molecule, in which there is evidence of bond formation [11]. The standard configuration is denoted as Dn−H···Ac, where:
- Dn represents the donor atom (a highly electronegative atom such as N, O, or F covalently bonded to hydrogen)
- H is the hydrogen atom with a partial positive charge
- Ac is the acceptor atom (an electronegative atom bearing a lone pair of electrons) [11] [12]
The solid line represents a polar covalent bond, while the dotted or dashed line indicates the hydrogen bond itself [11].
Key Geometric Parameters
The geometry of hydrogen bonding is characterized by several critical parameters that collectively determine the strength and stability of the interaction:
Table 1: Key Geometric Parameters for Hydrogen Bonds
| Parameter | Description | Typical Range |
|---|---|---|
| H···Ac Distance | Distance between hydrogen and acceptor atoms | 160–200 pm [11] |
| Dn−H Distance | Covalent bond length between donor and hydrogen | ≈110 pm [11] |
| Dn···Ac Distance | Total distance between donor and acceptor atoms | 270–300 pm |
| Angle (Dn-H···Ac) | Bond angle at the hydrogen atom | Ideally 180° (linear) but varies [11] |
The ideal bond angle depends on the nature of the hydrogen bond donor. Experimental measurements with hydrofluoric acid donors demonstrate significant variation: linear (180°) with HCN, trigonal planar (120°) with H₂CO, pyramidal (46°) with H₂O, and trigonal (145°) with SO₂ [11].
Electronic Requirements
For an effective hydrogen bond acceptor, the acceptor atom must possess:
- High electronegativity (N, O, F, and occasionally S, Cl, or π-systems)
- Lone pair of electrons available for interaction
- Proper orbital orientation for optimal overlap with the hydrogen atom
The interaction arises from a combination of electrostatics (multipole-multipole interactions), covalency (charge transfer by orbital overlap), and dispersion forces [11]. This multifaceted nature distinguishes hydrogen bonds from simple dipole-dipole interactions, as hydrogen bonding involves charge transfer (nB → σ*AH) and orbital interactions, making it a resonance-assisted interaction rather than a mere electrostatic attraction [11].
Structural Examples in Medicinal Chemistry
Common Hydrogen Bond Acceptor Groups
Hydrogen bond acceptors are ubiquitous in medicinal chemistry and drug design. The strength of different acceptors varies significantly based on their electronic properties and steric accessibility.
Table 2: Hydrogen Bond Acceptor Strength (pKBHX) for Common Functional Groups
| Functional Group | Representative Strength (pKBHX) | Notes |
|---|---|---|
| Alkenes | -1 to 0 | Weak acceptors |
| Amides | 2.0–2.5 | Strong acceptors, crucial in protein binding |
| N-oxides | >3.0 | Very strong acceptors |
| Amines | Variable (-1 to 2) | Highly dependent on substitution |
| Carbonyls | 1.5–2.5 | Key backbone interactions in proteins |
| Ethers/Hydroxyl | 1.0–2.0 | Moderate strength |
| Fluorine | 0–1.0 | Weak but strategically important [13] |
Case Studies in Drug Optimization
Improving Permeability in mPTP Inhibitors
In a program to develop brain-penetrant mPTP inhibitors, researchers optimized a lead compound by strategically modifying hydrogen bond acceptor strength. The introduction of fluorine to an acrylamide moiety reduced the hydrogen bond acceptor strength (pKBHX) of the amide oxygen from 1.75 to 1.28. This subtle change, while maintaining similar logD values, tripled permeability and improved the efflux ratio by a factor of 4, ultimately enabling the nomination of a clinical candidate (NRG1271) with required brain penetration properties [14].
Carbamate versus Amide Replacements
In Takeda's OX2R (orexin 2 receptor) agonist program leading to danavorexton, researchers replaced an acetyl piperidine (efflux ratio = 3.5) with a methyl carbamate (efflux ratio = 0.8). This modification improved the compound's ability to cross the blood-brain barrier by reducing hydrogen bond acceptor strength (pKBHX) and slightly increasing logD. The carbamine moiety has since become a valuable design element for optimizing permeability and reducing efflux when N-acyl piperidines, morpholines, or piperazines suffer from poor permeability [14].
Non-Traditional Hydrogen Bond Acceptors
While nitrogen and oxygen represent the most common hydrogen bond acceptors, other atoms can function in this capacity under specific circumstances:
- Sulfur atoms in thioethers and thiocarbonyls
- Halogens (particularly fluorine and chlorine)
- π-systems in aromatic rings and double bonds
- Carbon atoms in highly polarized C-H bonds (e.g., chloroform, aldehydes, terminal acetylenes) [11]
These "non-traditional" hydrogen bonding interactions, while typically weak (≈1 kcal/mol), are ubiquitous and can significantly influence the structures and properties of pharmaceutical materials [11].
Computational Assessment Methods
Workflow for Predicting Hydrogen Bond Acceptor Strength
Recent advances in computational chemistry have enabled robust prediction of hydrogen bond acceptor strength through efficient black-box workflows:
Figure 1: Computational workflow for predicting hydrogen bond acceptor strength using electrostatic potential calculations. This efficient approach uses neural network potentials to accelerate geometry optimization and requires only a single DFT calculation per molecule [13].
Electrostatic Potential (Vmin) Methodology
The minimum electrostatic potential (Vmin) in the region of lone pairs has been established as a reliable predictor of hydrogen bond acceptor strength [13]. The methodology involves:
- Conformer generation using the ETKDG algorithm as implemented in RDKit
- Conformer filtering using the CREST screening protocol with GFN2-xTB energies
- Geometry optimization with the AIMNet2 neural network potential
- Electrostatic potential calculation using the r2SCAN-3c method
- Numerical minimization of the electrostatic potential with the BFGS algorithm
- Linear scaling of Vmin values to experimental pKBHX using functional-group-specific parameters
This approach achieves a mean absolute error of approximately 0.19 pKBHX units across diverse molecular scaffolds, making it suitable for medicinal chemistry optimization [13].
Research Reagent Solutions for HBA Assessment
Table 3: Essential Research Tools for Hydrogen Bond Acceptor Characterization
| Tool/Reagent | Function | Application Notes |
|---|---|---|
| Pyrazinone Sensor | Colorimetric hydrogen bond donor strength assessment | Undergoes measurable shift upon complexation with H-bond donors [15] |
| 4-Fluorophenol | Standard hydrogen bond donor for pKBHX measurements | Reference donor for consistent experimental conditions [13] |
| Carbon Tetrachloride | Solvent for experimental pKBHX determination | Minimizes competing solvent interactions [13] |
| UV-Vis Spectrophotometer | Quantification of binding constants | Enables measurement of association constants via titration [15] |
| DFT Software (Psi4) | Electrostatic potential calculations | Open-source platform for Vmin computation [13] |
| Neural Network Potentials (AIMNet2) | Accelerated geometry optimization | Reduces computational cost of conformational analysis [13] |
Experimental Quantification Protocols
UV-Vis Titration with Pyrazinone Sensor
Purpose: To experimentally determine hydrogen bond donor strength, which provides complementary data for understanding acceptor characteristics through known donor-acceptor pairs.
Materials:
- Pyrazinone sensor solution in dichloromethane (typically 10-100 µM)
- Analyte compound (dissolved in DCM at appropriate concentration)
- UV-Vis spectrophotometer with temperature control
- Quartz cuvette with 1 cm path length
Procedure:
- Prepare a stock solution of the pyrazinone sensor in dried, spectroscopic-grade DCM.
- Record the baseline UV-Vis spectrum of the sensor solution (300-500 nm range).
- Add incremental volumes of analyte solution to the sensor solution while maintaining constant total volume.
- After each addition, mix thoroughly and record the UV-Vis spectrum after equilibration (typically 2-5 minutes).
- Continue additions until no further spectral changes are observed (saturation).
- Measure the wavelength shift of the absorption maximum and plot against analyte concentration.
- Calculate the binding constant (Keq) by fitting the titration data to an appropriate binding model.
- Report the hydrogen bond donor strength as lnKeq, with larger values indicating stronger donors [15].
Interpretation: This method allows direct comparison of hydrogen bonding strengths across different functional groups. The solvation environment (DCM) limits confounding effects from other noncovalent interactions and amplifies hydrogen bonding contributions [15].
pKBHX Determination Protocol
Purpose: To quantitatively measure hydrogen bond acceptor strength under standardized conditions.
Materials:
- 4-Fluorophenol (standard hydrogen bond donor) in carbon tetrachloride
- Test compound (acceptor) in carbon tetrachloride
- IR or UV-Vis spectrophotometer
- Temperature-controlled cell compartment
Procedure:
- Prepare a series of solutions with constant 4-fluorophenol concentration and varying acceptor concentrations.
- Measure the association through IR spectroscopy (O-H stretching frequency shift) or UV-Vis (absorption changes).
- Determine the association constant (K) from the concentration dependence of the spectral changes.
- Calculate pKBHX as log10(K).
- Compare against reference compounds with known pKBHX values for validation [13].
Integration with Pharmacophore Modeling
Structure-Based Pharmacophore Development
Structure-based pharmacophore generation directly extracts hydrogen bond acceptor features from protein structures, providing critical insights for drug design:
Figure 2: Structure-based pharmacophore generation workflow. This approach identifies critical hydrogen bond acceptor features directly from protein-ligand complexes, enabling targeted virtual screening [6] [10].
Hydrogen Bond Acceptor Features in Pharmacophore Models
In a case study targeting Akt2 inhibitors, structure-based pharmacophore generation revealed seven critical pharmacophoric features, including two hydrogen bond acceptors [6]. These features were strategically located near key amino acid residues:
- Hydrogen Bond Acceptor 1 (HA1): Positioned near the amino group of Ala232
- Hydrogen Bond Acceptor 2 (HA2): Located within short distance of amino groups of Phe294 and Asp293
Compounds mapping to these acceptor features demonstrated enhanced binding affinity through formation of specific hydrogen bonds with adjacent amino acids in the Akt2 active site [6].
Receptor-Based Pharmacophore Generation Algorithm
Advanced algorithms for pharmacophore generation utilize atomic chemical characteristics and hybridization types to identify critical hydrogen bonding features:
- Pocket detection using cavity detection algorithms
- Probe placement with five chemical feature types (H-bond acceptor, H-bond donor, positive ionizable, negative ionizable, hydrophobic)
- Feature filtering based on energy scoring and spatial clustering
- Hybridization-aware feature extraction using SP hybridization models to determine action spheres for H-bond acceptors and donors
- Aromatic feature detection through statistical analysis of aromatic atoms and ring orientation
- Feature consolidation with 3Å spatial constraints to eliminate redundancy [10]
This approach generates pharmacophores with six chemical characteristics while minimizing redundant features that increase computational load during virtual screening [10].
Hydrogen bond acceptors represent fundamental components of pharmacophore models with critical importance in drug design and optimization. Their geometric representation—characterized by specific distance and angular parameters—directly influences interaction strength and biological activity. Through integrated computational and experimental approaches, researchers can now quantitatively predict and measure hydrogen bond acceptor strength, enabling rational optimization of key drug properties including permeability, efflux transport, and target affinity. The continuing refinement of structure-based pharmacophore methods that accurately represent hydrogen bonding features promises to enhance the efficiency of virtual screening and compound optimization in drug discovery campaigns.
In the realm of molecular recognition and rational drug design, the hydrogen bond represents one of the most crucial non-covalent interactions governing biological activity. A hydrogen bond donor (HBD) is specifically defined as an electron-deficient hydrogen atom covalently bound to a highly electronegative atom (typically oxygen, nitrogen, or sulfur) that can form an electrostatic interaction with a hydrogen bond acceptor (HBA)-an electronegative atom possessing lone pair electrons [16] [17]. The strength of hydrogen bonds typically ranges from 4 to 15 kJ/mol, making them stronger than dipolar interactions or London dispersion forces but more reversible than covalent bonds [17]. This reversible nature, combined with significant directional character, makes hydrogen bonding particularly important in biological systems where dynamic interactions govern molecular recognition processes.
The critical importance of HBD features extends across multiple domains of pharmaceutical science, directly influencing fundamental drug properties including solubility, permeability, bioavailability, and target binding affinity [15]. Careful tuning of hydrogen bond donors and acceptors in drug molecules facilitates selective molecular recognition, enabling medicinal chemists to optimize therapeutic efficacy while minimizing off-target effects [15]. In pharmacophore modeling-an essential computational approach in rational drug design-HBD features represent one of the key pharmacophoric elements used to define the spatial and electronic requirements for effective target engagement [18] [19] [20]. This review comprehensively examines the characteristic features of hydrogen bond donors, their quantitative assessment, and their fundamental role in molecular recognition processes within drug discovery.
Quantitative Assessment of HBD Strength
Experimental Measurement Approaches
Quantifying hydrogen bond donor strength requires well-defined experimental approaches that measure the free energy of hydrogen-bonded complex formation. One established method utilizes a colorimetric pyrazinone sensor that undergoes a measurable wavelength shift upon complexation with hydrogen bond donors [15]. Through UV-Vis titration experiments performed in dichloromethane (which minimizes confounding non-covalent interactions), binding constants (Keq) can be determined and converted to natural logarithm values (lnKeq) that directly correlate with HBD strength, with higher values indicating stronger hydrogen bond donors [15].
Large-scale experimental databases have been developed to catalog HBD strengths across diverse chemical functionalities. The HYBOND database represents one of the most extensive collections, containing numerous entries of experimentally measured hydrogen bonding parameters [21]. Similarly, the pK_BHX database provides free energy values for over 1,200 hydrogen bond acceptors, primarily based on 1:1 complex formation with reference donors [21]. The Strasbourg database further complements these resources with additional experimentally determined values [21].
Table 1: Experimental Hydrogen Bond Donor Strengths of Common Functional Groups
| Functional Group | Representative Compound | lnK_eq | Strength Classification |
|---|---|---|---|
| Aliphatic Alcohols | Compound 44 [15] | 0.86 | Very Weak |
| Benzylic Alcohols | Benzyl Alcohol (Compound 50) [15] | 1.93 | Weak |
| Primary Amides | Compound 13 [15] | ~2.5 | Moderate |
| Imidazoles | Unsubstituted Imidazole [15] | 3.42 | Moderate-Strong |
| Indazoles | Compound 41 [15] | 4.20 | Strong |
| Imides | Compound 22 [15] | >4.0 | Strong |
Computational Prediction Methods
First-principles quantum chemical computations provide a powerful alternative to experimental measurements for predicting HBD strengths. Computational protocols typically involve generating molecular fragments containing HBD moieties, followed by density functional theory (DFT) geometry optimization of these fragments and their complexes with reference acceptors like acetone [21]. The reaction free energies (ΔG) for 1:1 hydrogen-bonded complex formation in solution serve as the target values for establishing quantitative HBD strength scales [21].
Machine learning (ML) models have emerged as efficient tools for predicting HBD strengths across broad chemical spaces. These models can be trained on quantum chemical free energies for hydrogen-bonded complex formation, achieving root mean square errors (RMSE) as low as 2.3 kJ mol¯¹ for donors on experimental test sets-comparable to models trained exclusively on experimental data [21]. This performance demonstrates that quantum chemical data can effectively substitute for experimental measurements in HBD strength determination, potentially enabling comprehensive mapping of hydrogen bonding properties without extensive wet lab experimentation [21].
Table 2: Computational Methods for HBD Strength Prediction
| Method Type | Key Features | Applications | Performance Metrics |
|---|---|---|---|
| Quantum Chemical Calculations | DFT geometry optimization; Free energy calculations in solution [21] | Fragment-based HBD screening; Database generation [21] | RMSE ~2-4 kJ/mol vs. experiment [21] |
| Machine Learning Models | Atomic radial descriptors; Training on QC data [21] | Large-scale chemical space exploration [21] | RMSE of 2.3 kJ mol¯¹ for donors [21] |
| Molecular Dynamics Simulations | Explicit solvent models; Binding free energy calculations [22] | Protein-ligand interaction analysis [22] | Dynamic pharmacophore models [22] |
HBD Features in Pharmacophore Modeling
Structure-Based Pharmacophore Development
In structure-based pharmacophore modeling, HBD features are derived from analysis of intermolecular interactions between a biological target and known ligands in their binding conformations. Using protein-ligand complex structures, molecular design software such as LigandScout can identify key chemical features including hydrogen bond donors, acceptors, hydrophobic regions, and aromatic interactions [18] [20]. For example, in pharmacophore modeling for XIAP protein inhibitors, researchers identified five hydrogen bond donor features interacting with amino acid residues THR308, ASP309, GLU314, and water molecules HOH523, HOH556, and HOH565 [20].
The process of structure-based pharmacophore generation begins with retrieval of high-quality protein-ligand complex structures from databases like the Protein Data Bank, followed by identification of key interaction points between the ligand and protein active site [20]. Exclusion volumes are incorporated to represent steric constraints, and pharmacophoric features are refined to maintain optimal complexity for virtual screening [20]. For targets with extensive structural data, consensus pharmacophore models can be developed by integrating molecular features from multiple ligand-bound complexes, reducing model bias and enhancing predictive power [23].
Diagram 1: Structure-Based Pharmacophore Modeling Workflow
HBD Features in Virtual Screening
Hydrogen bond donor features serve as critical components in virtual screening workflows, enabling efficient identification of potential bioactive compounds from large chemical libraries. In a study targeting estrogen receptor beta (ESR2) mutant proteins, researchers developed a shared feature pharmacophore model containing two hydrogen bond donor features alongside hydrogen bond acceptors, hydrophobic interactions, and aromatic features [18]. These features were distributed into 336 combinations using Python scripts to comprehensively explore potential binding pharmacophores, followed by virtual screening of a 41,248-compound library [18].
The screening process identified 33 hits with promising pharmacophoric fit scores and low RMSD values, with the top four compounds demonstrating fit scores exceeding 86% while satisfying Lipinski's Rule of Five [18]. Subsequent molecular docking analysis revealed binding affinities ranging from -5.73 to -10.80 kcal/mol, outperforming the control compound at -7.2 kcal/mol [18]. Molecular dynamics simulations further confirmed the stability of these complexes, highlighting the effectiveness of HBD-containing pharmacophores in identifying potent inhibitors.
Role of HBD in Molecular Recognition
Influence on Binding Affinity and Selectivity
Hydrogen bond donors play a decisive role in determining binding affinity and selectivity in molecular recognition processes. A single optimized hydrogen bond interaction can determine the potency of drug-like molecules for a target when all other interactions remain constant [21]. The directionality of hydrogen bonds-contributing to their energy minimization when the donor dipole aligns collinearly with the acceptor's charged point-significantly enhances binding specificity [17]. This directionality is particularly pronounced in conjugated systems where lone pair electrons are spatially constrained, such as in carbonyl groups where H-bonds are confined to the plane of the R₂C=O group [17].
In protein-ligand interactions, HBD features often target conserved residues in binding pockets to achieve selectivity. For example, in kinase inhibitors targeting the ATP-binding site, hydrogen bond donors frequently interact with the hinge region residues, a highly conserved structural element [22]. Type I kinase inhibitors that compete with ATP typically mimic the adenine purine ring's hydrogen bonding pattern, utilizing both donor and acceptor features to engage backbone atoms in the hinge region [22]. The ability to precisely engineer these interactions allows medicinal chemists to fine-tune selectivity profiles, potentially reducing off-target effects.
Impact on Material Properties and Self-Assembly
Beyond biological recognition, hydrogen bond donors significantly influence material properties and self-assembly behavior in polymer systems. The incorporation of HBD-containing motifs into polymer backbones can enhance mechanical properties including elastic modulus, toughness, and stretchability through the reversible nature of hydrogen bonds [17]. Under small strain regimes, H-bonds function as apparent crosslinks, increasing stiffness, while under large strains they can exchange before covalent bonds break, dissipating energy and contributing to material toughness [17].
Multiple hydrogen bonding motifs are categorized as "rigid" or "flexible" based on their structural characteristics. Rigid multiple H-bonds, exemplified by 2-ureido-4[1H]-pyrimidinone (UPy) units or nucleobases, feature π-conjugated units and structural complementarity that impart strong directionality and association constants as high as 10⁶ M¯¹ in CHCl₃ [17]. In contrast, flexible multiple H-bonds, such as those formed between aliphatic vicinal diol groups, exhibit various stable bonding modes due to conformational freedom and absence of strong π-conjugation [17]. These differences profoundly affect the mechanoresponsive behavior of polymers bearing these motifs.
Experimental Protocols for HBD Characterization
Colorimetric Titration for HBD Strength Determination
The experimental determination of hydrogen bond donor strength via colorimetric titration provides a robust protocol for quantifying this crucial molecular property [15]:
Sensor Preparation: Prepare a stock solution of the pyrazinone colorimetric sensor in dichloromethane at appropriate concentration (typically 10-100 μM).
Analyte Solutions: Dissemble the hydrogen bond donor analytes in dichloromethane at concentrations compatible with their solubility limits. Exclude highly colored compounds that might interfere with UV-Vis measurements.
Titration Procedure: Incrementally add analyte solution to the sensor solution while monitoring spectral changes via UV-Vis spectroscopy. Perform measurements in triplicate to ensure reproducibility.
Data Analysis: Determine binding constants (Keq) by fitting the titration data to an appropriate binding model. Convert these values to natural logarithm scale (lnKeq) for direct comparison of hydrogen bond donor strengths.
Validation Controls: Include reference compounds with established HBD strengths to validate measurement accuracy and ensure consistency across experimental batches.
This protocol can be adapted for high-throughput screening using plate readers, enabling rapid profiling of numerous compounds and facilitating population of comprehensive HBD strength databases [15].
Consensus Pharmacophore Modeling Protocol
For targets with extensive ligand structural data, consensus pharmacophore modeling provides a powerful approach to identify key HBD features [23]:
Complex Preparation: Collect and align all protein-ligand complexes using molecular visualization software such as PyMOL. Extract each aligned ligand conformer and save as separate files in SDF format.
Feature Extraction: Upload each ligand file to pharmacophore modeling tools such as Pharmit to generate individual pharmacophore JSON files. Identify key features including hydrogen bond donors, acceptors, hydrophobic regions, and aromatic interactions.
Data Consolidation: Use informatics tools like ConPhar to parse JSON files and extract pharmacophoric features into a consolidated data frame. Implement exception handling to bypass malformed files during processing.
Consensus Generation: Apply clustering algorithms to identify conserved HBD features across multiple ligand complexes. Generate consensus pharmacophore models that integrate these shared features while maintaining appropriate spatial constraints.
Model Validation: Validate consensus models using receiver operating characteristic (ROC) analysis with known active compounds and decoy sets. Calculate area under curve (AUC) values and early enrichment factors (EF1%) to quantify model performance, with AUC values >0.9 indicating excellent predictive power [20].
Diagram 2: HBD Strength Determination Protocol
Table 3: Essential Research Tools for HBD Characterization and Utilization
| Tool/Resource | Type | Primary Function | Application Context |
|---|---|---|---|
| Pyrazinone Sensor [15] | Chemical Reagent | Colorimetric detection of HBD strength | Experimental quantification of hydrogen bond donor capabilities |
| LigandScout [18] [20] | Software | Structure-based pharmacophore modeling | Identification and visualization of HBD features in protein-ligand complexes |
| ConPhar [23] | Informatics Tool | Consensus pharmacophore generation | Integration of HBD features across multiple ligand complexes |
| ZINC Database [18] [20] | Chemical Library | Source of screening compounds | Virtual screening using HBD-containing pharmacophore models |
| Pharmit [23] | Web Service | Pharmacophore feature extraction | Generation of pharmacophore JSON files from ligand structures |
| AMBER-ff19SB [22] | Force Field | Molecular dynamics parameters | Simulation of HBD interactions in biological systems |
| RDKit [19] [21] | Cheminformatics | Molecular descriptor calculation | Fragment-based analysis of HBD properties |
Hydrogen bond donors represent fundamental features in molecular recognition processes, serving as critical determinants of binding affinity, specificity, and physicochemical properties in drug discovery. The quantitative assessment of HBD strength-through both experimental measurements and computational predictions-provides invaluable insights for rational design of bioactive compounds. In pharmacophore modeling, HBD features constitute essential elements that guide virtual screening and optimization workflows. The continued development of robust experimental protocols, comprehensive databases, and predictive computational models will further enhance our ability to harness hydrogen bonding interactions in targeted molecular design. As drug discovery confronts increasingly challenging targets, the precise engineering of hydrogen bond donors will remain indispensable for achieving desired potency, selectivity, and drug-like properties.
In the field of pharmacophore research, a hydrophobic (H) feature is an abstract description of molecular characteristics essential for productive interaction with a biological target. According to IUPAC definitions, a pharmacophore represents "an ensemble of steric and electronic features that is necessary to ensure the optimal supramolecular interactions with a specific biological target and to trigger (or block) its biological response" [1]. Among these features, hydrophobic regions are critical drivers of molecular recognition and binding. The hydrophobic effect originates from the tendency of water to exclude non-polar molecules, which causes disruption of highly dynamic hydrogen bonds between water molecules [24]. When hydrophobic regions associate, the structured water "cage" around them breaks down, resulting in a favorable entropy increase that drives the interaction [24]. This phenomenon is particularly important in protein-protein interactions and ligand-receptor binding, where hydrophobic patches often mediate key contacts [25] [26].
In pharmacophore modeling, hydrophobic features work in concert with other key pharmacophore elements including hydrogen bond acceptors (HBAs), hydrogen bond donors (HBDs), positively and negatively ionizable groups (PI/NI), and aromatic rings (AR) to define the essential characteristics required for biological activity [1] [27]. Unlike specific atomic representations, pharmacophore features are conceptual entities that can match diverse chemical groups sharing similar properties, enabling the identification of novel ligands through virtual screening [1]. This review provides a comprehensive technical guide to identifying, characterizing, and representing hydrophobic features, with particular emphasis on their application in drug discovery and structural biology.
Fundamental Principles of Hydrophobic Features
Defining Hydrophobicity in Molecular Contexts
Hydrophobicity represents the thermodynamic driving force that minimizes association between non-polar substances and water [24]. In pharmacological contexts, hydrophobic features typically manifest as hydrophobic centroids or hydrophobic volumes that define spatial regions where non-polar interactions are favored [1]. These features capture areas of the molecule that participate in van der Waals interactions and the hydrophobic effect, which collectively contribute significantly to binding free energy.
The complexity of hydrophobic features lies in their context-dependent nature. Research has demonstrated that hydrophobic protein patches are not uniformly non-polar but contain significant fractions of polar and charged atoms [25]. In fact, hydrophobic and hydrophilic protein patches show surprisingly similar chemical compositions, challenging conventional wisdom that directly equates polarity with hydrophilicity [25]. This emergent hydrophobicity stems from the collective response of hydration waters to nanoscale chemical and topographical patterns displayed by the protein surface [25].
Hydrophobicity Scales and Quantitative Measures
Various hydrophobicity scales have been developed to quantify the relative hydrophobicity of amino acid residues. These scales are essential for predicting transmembrane alpha-helices of membrane proteins and identifying hydrophobic regions in protein structures [24]. The table below summarizes four major hydrophobicity scales for amino acids:
Table 1: Major Amino Acid Hydrophobicity Scales (Higher values indicate greater hydrophobicity)
| Amino Acid | Kyte-Doolittle [24] | Hessa-von Heijne [24] | Janin [24] | Wimley-White Interfacial (kcal/mol) [24] |
|---|---|---|---|---|
| Isoleucine | 4.5 | 1.1 | 0.73 | -0.31 |
| Valine | 4.2 | 0.8 | 0.54 | 0.07 |
| Leucine | 3.8 | 1.0 | 0.53 | -0.56 |
| Phenylalanine | 2.8 | 1.0 | 0.50 | -1.13 |
| Cysteine | 2.5 | 0.5 | 0.04 | -0.24 |
| Methionine | 1.9 | 0.7 | 0.26 | -0.23 |
| Alanine | 1.8 | 0.3 | 0.25 | 0.17 |
| Glycine | -0.4 | 0.3 | 0.16 | 0.01 |
| Threonine | -0.7 | -0.4 | -0.18 | 0.14 |
| Tryptophan | -0.9 | 1.1 | 0.37 | -1.85 |
| Serine | -0.8 | -0.5 | -0.26 | 0.05 |
| Tyrosine | -1.3 | 0.5 | -0.40 | -0.94 |
| Proline | -1.6 | -0.3 | -0.07 | 0.45 |
The Wimley-White whole residue hydrophobicity scales are particularly significant as they provide absolute values for transfer free energies and include contributions from peptide bonds as well as side chains [24]. These scales include values for transfer from water to the bilayer interface (ΔGwif) and into octanol (ΔGwoct), which is relevant to the hydrocarbon core of membranes [24].
Methodological Approaches for Identifying Hydrophobic Features
Computational Detection Methods
Molecular Dynamics and Dewetting Simulations
Specialized molecular simulations can characterize protein hydrophobicity by analyzing the collective response of hydration waters to nanoscale chemical and topographical protein patterns [25]. In this approach, an unfavorable biasing potential (φ) is applied to systematically disrupt protein-water interactions, and water molecules are progressively displaced from the protein hydration shell [25]. The process involves:
Defining the Hydration Shell: Spherical subvolumes are pegged to every heavy atom on the protein surface, with the union of all subvolumes (radius typically 0.6 nm) defining the hydration shell (v) that includes only first-shell waters [25].
Applying Biasing Potential: As the potential strength (βφ) increases, the average number of waters (⟨Nv⟩φ) in the hydration shell decreases sigmoidally, with the susceptibility (χv ≡ -∂⟨Nv⟩φ/∂(βφ)) peaking at the dewetting transition point [25].
Mapping Local Water Density: The normalized local water density ⟨ρi⟩φ ≡ ⟨ni⟩φ/⟨ni⟩0 is calculated for each protein surface atom, where atoms falling below a threshold (typically s=0.5, indicating loss of at least half their hydration waters) are classified as dewetted and therefore hydrophobic [25].
Table 2: Computational Methods for Hydrophobic Feature Identification
| Method | Principle | Applications | Advantages | Limitations |
|---|---|---|---|---|
| Dewetting Simulations [25] | Systematically displaces hydration waters to identify regions that relinquish water readily | Characterizing emergent hydrophobicity of protein patches | Accounts for collective solvent response; identifies context-dependent hydrophobicity | Computationally intensive; requires specialized setup |
| Hydrophobic Docking [26] | Uses partial molecular representation based primarily on hydrophobic groups | Predicting structure of protein complexes; molecular recognition sites | Higher signal-to-noise ratio; reduced false positive matches | May overlook important polar interactions |
| Conserved Hydrophobic Contact Analysis [28] | Identifies evolutionarily conserved hydrophobic contacts in protein superfamilies | Understanding fold conservation; identifying structural stability determinants | Reveals evolutionarily invariant structural features | Requires multiple structures and sequences |
| Accessible Surface Area Methods [24] | Calculates solvent accessible surface areas multiplied by empirical solvation parameters | Predicting protein-protein interactions; estimating transfer free energies | Intuitive physical basis; relatively simple computation | May oversimplify complex hydration phenomena |
Hydrophobic Docking and Contact Analysis
Hydrophobic docking enhances molecular recognition techniques by utilizing partial molecular representation based primarily on hydrophobic groups [26]. This approach capitalizes on the higher occurrence of hydrophobic groups at interaction interfaces and their potentially lower flexibility at molecular surfaces [26]. Compared to full atomic representation, hydrophobic docking demonstrates distinctly higher signal-to-noise ratios, enabling better discrimination of correct matches from false positives [26].
For analyzing evolutionarily conserved structural patterns, conserved hydrophobic contact (CHC) identification can be employed. This method involves:
- Building a nonredundant set of superimposed crystallographic structures
- Extracting structurally conserved regions (SCRs) and conserved hydrophobic contacts
- Extending structural alignment with sequence homologs
- Correlating conserved residues with hydrophobic contact values [28]
In studies of PLP-dependent enzymes, this approach revealed a significant correlation (r = 0.70) between evolutionary conservation and the extent of mean hydrophobic contact value of their apolar fraction, identifying a structural pattern of hydrophobic contacts shared by superfamily members [28].
Experimental Characterization Techniques
Partitioning and Chromatographic Methods
Partitioning between immiscible liquid phases represents the most common method for experimentally measuring hydrophobicity [24]. The Wimley-White scales, for instance, were determined through experimental measurements of transfer free energies of polypeptides between aqueous and membrane-mimetic environments [24]. Key methodologies include:
Liquid-Liquid Partitioning: Measuring the distribution of amino acids or peptides between water and organic solvents (e.g., ethanol, dioxane) [24].
Reversed-Phase Liquid Chromatography (RPLC): Using non-polar stationary phases to mimic biological membranes, with retention time indicating hydrophobicity [24]. Derivatization of amino acids is often necessary to ease partition into C18 bonded phases [24].
Vapor Phase Partitioning: Utilizing vapor phases as the simplest non-polar phases that have minimal interaction with the solute [24].
Novel Measurement Approaches
Recent advances include optical methods such as the Maximum Particle Dispersion (MPD) technique for quantitatively characterizing nanoparticle hydrophobicity [29]. This method controls the aggregation state of nanoparticles by manipulating van der Waals interactions between particles across a dispersion liquid, providing a quantitative measure of hydrophobicity that correlates with biological responses [29].
Experimental Protocols for Hydrophobic Feature Analysis
Molecular Dynamics Dewetting Protocol
Objective: To identify hydrophobic patches on protein surfaces through systematic disruption of hydration waters [25].
Workflow:
- System Preparation
- Obtain protein structure from PDB or homology modeling
- Solvate in explicit water box with appropriate dimensions
- Add ions to neutralize system charge
- Energy minimization and equilibrium dynamics
Hydration Shell Definition
- Define spherical subvolumes (radius = 0.6 nm) around each heavy atom
- Create union of subvolumes as hydration shell (v)
Biased Simulations
- Apply unfavorable biasing potential (φ) to waters in hydration shell
- Perform simulations at increasing φ values (e.g., βφ = 0 to 4)
- Calculate ⟨Nv⟩φ (average waters in v) at each potential strength
Dewetting Analysis
- Identify potential (βφ*) where susceptibility χv peaks
- Map normalized local water density ⟨ρi⟩φ for each surface atom
- Classify atoms with ⟨ρi⟩φ < 0.5 as dewetted/hydrophobic
Validation
- Compare identified hydrophobic patches with known interaction interfaces
- Correlate with experimental data on protein-protein interactions
Structure-Based Pharmacophore Modeling with Hydrophobic Features
Objective: To develop a pharmacophore model containing hydrophobic features from protein 3D structure [27].
Workflow:
- Protein Structure Preparation
- Obtain 3D structure from PDB or homology modeling (e.g., AlphaFold2)
- Add hydrogen atoms, assign protonation states
- Correct missing residues/atoms, and optimize structure
Binding Site Identification
- Use computational tools (GRID, LUDI) or experimental data
- Define binding site region for feature extraction
Interaction Map Generation
- Identify potential hydrophobic contact regions in binding site
- Map hydrogen bond donors/acceptors, charged regions
- Define exclusion volumes representing forbidden areas
Feature Selection and Abstraction
- Select essential hydrophobic regions contributing significantly to binding
- Transform specific atomic features into abstract pharmacophore elements
- Define spatial relationships between features
Model Validation
- Test model against known active and inactive compounds
- Validate through virtual screening and experimental testing
The following diagram illustrates the computational workflow for identifying hydrophobic features:
Computational Workflow for Hydrophobic Feature Identification
Table 3: Essential Research Tools for Hydrophobic Feature Analysis
| Tool/Resource | Type | Function | Application Context |
|---|---|---|---|
| GRID [27] | Software | Uses molecular interaction fields to characterize binding sites | Structure-based pharmacophore modeling; binding site analysis |
| LUDI [27] | Software | Predicts interaction sites using knowledge-based distributions | Structure-based pharmacophore modeling; de novo design |
| Wimley-White Hydrophobicity Scales [24] | Database | Provides whole-residue transfer free energies | Predicting transmembrane helices; estimating binding affinities |
| Protein Data Bank (PDB) [27] | Database | Repository of 3D protein structures | Source of structural data for pharmacophore modeling |
| ALPHAFOLD2 [27] | Software | Predicts protein structures from sequence | Structure-based modeling when experimental structures unavailable |
| Molecular Dynamics Software (e.g., GROMACS, NAMD) | Software | Simulates biomolecular systems with explicit solvent | Dewetting simulations; hydrophobic characterizations [25] |
| Reversed-Phase HPLC [24] | Experimental | Separates compounds based on hydrophobicity | Experimental hydrophobicity measurement; peptide analysis |
| Site-Directed Mutagenesis Kits [24] | Experimental | Modifies specific residues in proteins | Validating role of hydrophobic residues in binding |
Applications in Drug Discovery and Design
Virtual Screening and Lead Optimization
Hydrophobic features serve as critical components in virtual screening workflows, where pharmacophore models are used as queries to search large compound libraries for molecules with similar stereo-electronic features [27]. The abstract nature of hydrophobic features enables scaffold hopping—identifying chemically diverse compounds that share the same spatial arrangement of key features—thus expanding medicinal chemistry options [1] [27].
In lead optimization, understanding hydrophobic feature contributions allows medicinal chemists to modulate compound lipophilicity to improve binding affinity while maintaining favorable physicochemical properties. The presence of appropriately positioned hydrophobic features often correlates with increased potency, though excessive hydrophobicity can adversely affect solubility and pharmacokinetics.
Protein-Protein Interaction Inhibition
Hydrophobic patches frequently mediate protein-protein interactions (PPIs), making them attractive targets for therapeutic intervention [25] [26]. Studies have shown that approximately 60-70% of interfacial contacts in protein complexes nucleate cavities in dewetting simulations, compared to only 10-20% of non-contact regions [25]. This striking correspondence between hydrophobic patches and interaction interfaces provides a rational basis for designing PPI inhibitors that target these critical regions.
Hydrophobic features represent fundamental components of pharmacophore models that drive molecular recognition through the hydrophobic effect and van der Waals interactions. Accurate identification and representation of these features require sophisticated computational and experimental approaches that account for the collective behavior of hydration waters and the context-dependent nature of hydrophobicity. Methodologies ranging from molecular dynamics dewetting simulations to hydrophobic docking and conserved contact analysis provide powerful tools for characterizing these critical regions. When properly integrated into pharmacophore models and drug discovery workflows, understanding of hydrophobic features enables more effective virtual screening, lead optimization, and intervention in challenging therapeutic targets such as protein-protein interactions. As computational methods continue to advance and integrate more sophisticated descriptions of solvation phenomena, the precision in defining hydrophobic pharmacophore features will further enhance rational drug design efforts.
In rational drug design, a pharmacophore is defined as the ensemble of steric and electronic features that is necessary to ensure the optimal supramolecular interactions with a specific biological target and to trigger (or block) its biological response [30]. This conceptual framework, first introduced by Paul Ehrlich in 1909, represents an abstract description of the molecular functionalities essential for binding, independent of a particular molecular scaffold. The relative spatial arrangement of these features—including hydrogen bond acceptors, hydrogen bond donors, and hydrophobic regions—directly governs the strength and specificity of supramolecular interactions. The three-dimensional geometry of a pharmacophore is not merely a structural artifact; it is the fundamental determinant of whether a ligand can form the complementary interactions with a protein binding site required for high-affinity binding and biological activity. Weak intermolecular interactions such as hydrogen bonding and hydrophobic interactions are key players in stabilizing energetically-favored ligands in the open conformational environment of protein structures [31]. This guide examines the geometric principles underlying these interactions, provides methodologies for their experimental and computational analysis, and explores advanced techniques for leveraging spatial arrangement in drug discovery campaigns.
Fundamental Geometric Principles of Pharmacophores
Essential Pharmacophore Features and Their Spatial Requirements
Pharmacophore models describe molecular interactions through distinct feature types, each with specific geometric constraints and chemical characteristics. These features represent the minimal set of chemical functionalities required for productive interaction with a biological target. The most common features include:
- Hydrogen Bond Acceptors (HBA): Atoms such as oxygen or nitrogen that can accept a hydrogen bond from the protein. The optimal geometry involves specific distance and angle constraints between donor and acceptor atoms [31].
- Hydrogen Bond Donors (HBD): Functional groups containing a hydrogen atom bonded to an electronegative atom (O, N) that can donate a hydrogen bond. The directionality of this interaction is critical for binding affinity [30].
- Hydrophobic Features: Non-polar regions of the ligand that participate in van der Waals interactions with complementary hydrophobic regions of the protein binding pocket [31].
- Aromatic Rings: Planar systems that can engage in π-π stacking or cation-π interactions with aromatic residues in the protein [32].
- Ionizable Groups: Positively or negatively charged groups that form electrostatic interactions or salt bridges with opposing charges in the binding site [33].
Table 1: Key Pharmacophore Features and Their Geometric Properties
| Feature Type | Chemical Moieties | Spatial Characteristics | Interaction Type |
|---|---|---|---|
| Hydrogen Bond Acceptor | Carbonyl oxygen, Nitrile, Ether oxygen | Directional, optimal H-bond angle ~120-180° | Electrostatic, dipole |
| Hydrogen Bond Donor | Hydroxyl, Amine, Amide NH | Directional, optimal H-bond angle ~120-180° | Electrostatic |
| Hydrophobic | Alkyl chains, Aromatic rings | Non-directional, defined by volume | van der Waals |
| Aromatic | Phenyl, Pyridine, Heterocycles | Planar, defined by ring center and normal vector | π-Stacking, cation-π |
| Ionic | Carboxylate, Ammonium | Point charge with spherical tolerance | Electrostatic, salt bridges |
Coordinate Systems for Defining Spatial Relationships
The geometric description of pharmacophores can be represented using different coordinate systems, each with advantages for specific applications:
- Cartesian Coordinate Systems: Traditionally, pharmacophores are defined using pairwise distance matrices between pharmacophore points in Cartesian space. While intuitive, this approach becomes increasingly complex as the number of points increases, requiring additional geometric planes and angles to fully define the spatial relationship when more than four points are involved [30].
- Spherical Coordinate Systems: An alternative approach describes each pharmacophore point using three parameters: distance to a geometric origin and two angles (θ and φ). This method provides a more efficient description of spatial relationships, particularly for complex pharmacophores with multiple features. Spherical coordinates bring four geometric parameters—an origin, a distance from the origin, and two angles—for the description of one pharmacophore point, enabling easier definition of chirality and feature orientation [30].
The selection of coordinate system has practical implications for pharmacophore patent applications, where precise geometric definitions are essential for protecting intellectual property. Spherical coordinate representations can markedly improve the readability of a pharmacophore definition in patent claims, bringing enough information for a person skilled in the art to understand the essence of the invention [30].
Methodologies for Analyzing Spatial Arrangements
Structure-Based Pharmacophore Modeling from Protein-Ligand Complexes
Structure-based pharmacophore modeling derives feature arrangements directly from analysis of protein-ligand co-crystal structures. The experimental protocol involves:
Protein-Ligand Complex Preparation:
- Obtain high-resolution crystal structure from Protein Data Bank (PDB)
- Remove water molecules (except structurally important waters)
- Add hydrogen atoms using molecular modeling software
- Minimize structure to relieve steric clashes
- Define binding site region around cocrystallized ligand [32]
Pharmacophore Feature Identification:
- Analyze protein-ligand interactions within binding site
- Map favorable interaction points using molecular interaction fields
- Define pharmacophore features complementary to protein functional groups
- Set geometric constraints (tolerances) for each feature
- Validate model against known active compounds [34]
For the SARS-CoV-2 main protease (Mpro), researchers applied this methodology using one hundred non-covalent inhibitors co-crystallized with the target. The resulting consensus pharmacophore captured key interaction features in the catalytic region and enabled identification of new potential ligands through virtual screening [34].
Molecular Dynamics for Capturing Dynamic Pharmacophores
Static crystal structures provide limited information about the flexibility of pharmacophore geometry. Molecular dynamics (MD) simulations address this limitation by sampling multiple conformational states:
MD Simulation Protocol:
- Prepare protein-ligand system in explicit solvent
- Equilibrate system with gradual heating from 0 to 300K over 125 ps
- Conduct production run (typically 100-300 ns) with 2 fs time step
- Extract snapshots at regular intervals (e.g., every 1 ns)
- Generate pharmacophore models for each snapshot [32]
Hierarchical Graph Representation of Pharmacophores (HGPM): To manage the complexity of multiple pharmacophore models from MD trajectories, the HGPM approach creates a single graph representation that enables intuitive observation of numerous pharmacophore models and emphasizes their relationship and feature hierarchy. This representation facilitates selection of pharmacophore sets for virtual screening and analysis of feature composition [32].
Figure 1: Workflow for hierarchical graph representation of pharmacophores from MD simulations
Deep Learning Approaches for Pharmacophore Elucidation
Recent advances in artificial intelligence have enabled the development of methods that can identify pharmacophores in the absence of a ligand. The PharmRL method exemplifies this approach:
Convolutional Neural Network (CNN) Training:
- Voxelize protein structure in cubic volume (9.5 Å edge, 0.5 Å resolution)
- Train multilabel CNN classification to identify plausible interaction points
- Use adversarial training to enhance robustness
- Predict six feature classes: HBA, HBD, Hydrophobic, Aromatic, Negative Ion, Positive Ion [33]
Deep Geometric Q-Learning:
- Represent potential pharmacophore features as graph nodes
- Employ SE(3)-equivariant neural network as Q-value function
- Progressively construct protein-pharmacophore graph
- Select optimal subset of interaction points to form pharmacophore [33]
This method demonstrates better prospective virtual screening performance than random selection of ligand-identified features from co-crystal structures, particularly for targets where structural information is limited [33].
Experimental and Computational Tools
Research Reagent Solutions and Computational Tools
Table 2: Essential Tools for Pharmacophore Modeling and Analysis
| Tool/Reagent | Type | Primary Function | Application Context |
|---|---|---|---|
| LigandScout | Software | Structure-based pharmacophore generation | Create pharmacophores from PDB structures and MD snapshots [32] |
| Pharmit | Web Server | Pharmacophore virtual screening | Screen molecular libraries against pharmacophore queries [33] |
| CHARMM-GUI | Web Tool | Molecular dynamics setup | Prepare protein-ligand systems for MD simulations [32] |
| AMBER | Software Suite | Molecular dynamics simulations | Run production MD trajectories for conformational sampling [32] |
| PharmRL | Deep Learning | Ligand-free pharmacophore identification | Elucidate pharmacophores without known binders [33] |
| ConPhar | Informatics Tool | Consensus pharmacophore generation | Identify common features across multiple ligand-bound complexes [34] |
| CATS Descriptors | Computational Method | Pharmacophore similarity assessment | Quantify pharmacophoric overlap in generative design [35] |
Quantitative Analysis of Geometric Parameters
The geometric tolerance of pharmacophore features significantly impacts virtual screening outcomes. Quantitative analysis reveals optimal parameters for different feature types:
Table 3: Optimal Geometric Tolerances for Pharmacophore Features
| Feature Type | Distance Tolerance (Å) | Angle Tolerance (degrees) | Excluded Volume Spheres | Typical Radius (Å) |
|---|---|---|---|---|
| HBA/HBD | 1.0-1.2 | 30-45 | 2-4 | 1.0 |
| Hydrophobic | 1.2-1.5 | N/A | 1-3 | 1.2 |
| Aromatic | 1.0-1.3 | 15-30 | 3-5 | 1.0 |
| Ionic | 1.1-1.4 | 25-40 | 2-3 | 1.0 |
| Excluded Volumes | N/A | N/A | Protein atoms | 1.5 |
Hydrogen bond interactions show marked directionality, with optimal hydrogen-bond vectors pointing from donor to acceptor atoms. The geometric description should capture this directionality, as it significantly influences binding affinity. In the classical definition, tolerance is represented by an average value and standard deviation for all distances and angles, but this crude representation lacks accuracy and must be refined to meet commitments required for patent applications [30].
Advanced Applications in Drug Discovery
Virtual Screening with Geometric Pharmacophores
Pharmacophore-based virtual screening leverages geometric arrangements to identify novel bioactive compounds from large chemical libraries:
Screening Protocol:
- Generate multiple conformers for each database molecule (typically 20-25 conformers per molecule)
- Perform 3D alignment to pharmacophore query using pattern matching algorithms
- Apply tolerance thresholds for feature matching (typically 1.0-1.5 Å)
- Filter results with receptor exclusion to remove sterically clashing compounds
- Rank hits by fit value and visual inspection [33]
The hierarchical graph representation (HGPM) significantly enhances virtual screening efficiency by enabling strategic prioritization of pharmacophore models derived from long MD simulations. This approach reduces the number of virtual screening runs required while maintaining coverage of relevant pharmacophore space [32].
Generative Molecular Design with Pharmacophore Constraints
Recent advances in generative models incorporate pharmacophore geometry as constraints for de novo molecular design:
Reinforcement Learning Framework:
- Encode molecules using CATS descriptors (pharmacophore patterns) and MACCS keys (structural features)
- Compute pharmacophore similarity using cosine similarity and Euclidean distance
- Assess structural similarity using Tanimoto coefficient and MAP4 fingerprints
- Design reward function to maximize pharmacophore similarity while minimizing structural similarity [35]
This approach balances scaffold novelty with pharmacophoric fidelity, generating compounds with strong pharmacophoric alignment to known active molecules while introducing substantial structural novelty for enhanced patentability. In case studies targeting estrogen receptor modulators, generated compounds maintained high pharmacophoric fidelity (cosine similarity >0.94) while achieving 100% novelty relative to known databases [35].
Figure 2: Pharmacophore-guided generative design workflow
Addressing Chirality through Geometric Definitions
The spatial arrangement of pharmacophore features directly enables the definition and recognition of chiral compounds in drug design. Spherical coordinate systems provide a natural framework for describing chirality, as they can unambiguously represent the handedness of feature arrangements [30]. This capability is particularly valuable for:
- Chiral Switching: Developing single-enantiomer versions of approved racemic drugs
- Distinct Therapeutic Uses: Discovering different biological activities for enantiomers of chiral drugs
- Patent Protection: Extending intellectual property protection for chiral pharmacophores [30]
In therapeutics, chiral effects can be exploited through chiral switching (developing single-enantiomer versions of approved racemic drugs) and by discovering distinct therapeutic uses for enantiomers of chiral drugs. The geometric definition of pharmacophores supports these applications by precisely capturing stereochemical constraints essential for bioactivity [30].
The spatial arrangement of molecular features—precisely governed by relative geometry—represents the fundamental basis of supramolecular interactions in drug discovery. From classical coordinate systems to modern deep learning approaches, the accurate definition and application of pharmacophore geometry continues to drive advances in virtual screening, de novo molecular design, and patent protection. As computational methods evolve to better capture the dynamic nature of protein-ligand interactions and incorporate more sophisticated geometric constraints, pharmacophore-based strategies will remain essential tools for rational drug design. The integration of geometric reinforcement learning, hierarchical graph representations, and consensus modeling approaches provides a powerful framework for elucidating the complex relationship between spatial arrangement and biological activity, ultimately accelerating the discovery of novel therapeutic agents.
From Theory to Practice: Generating and Applying Pharmacophore Models in Drug Discovery
In the landscape of computer-aided drug discovery, pharmacophore modeling stands as a pivotal technique for abstracting and representing the essential steric and electronic features responsible for optimal molecular interactions with a biological target. The International Union of Pure and Applied Chemistry (IUPAC) defines a pharmacophore as "the ensemble of steric and electronic features that is necessary to ensure the optimal supramolecular interactions with a specific biological target structure and to trigger (or to block) its biological response" [27] [36]. Ligand-based pharmacophore modeling specifically addresses scenarios where the three-dimensional structure of the target protein is unknown or unavailable. Instead, it relies on the chemical features and three-dimensional arrangements of a set of known active ligands to deduce the common interaction capabilities essential for biological activity [27] [36]. This approach is grounded in the theory that molecules eliciting the same biological effect share common chemical functionalities maintained in a similar spatial arrangement [27]. This technical guide delineates the core principles, methodologies, and applications of deriving pharmacophore features from ensembles of active compounds, situating the discussion within broader research on fundamental pharmacophore feature types such as hydrogen bond acceptors, donors, and hydrophobic regions.
Theoretical Foundations of Pharmacophore Features
A pharmacophore model is an abstract representation that moves beyond specific molecular structures to focus on generalized chemical functionalities. This abstraction is represented geometrically using entities like spheres, planes, and vectors to define the spatial requirements for binding [27].
Fundamental Pharmacophore Feature Types
The most critical pharmacophoric features are derived from the common non-covalent interactions that govern ligand-receptor binding. The table below summarizes the core feature types utilized in ligand-based pharmacophore modeling.
Table 1: Core Pharmacophore Feature Types and Their Descriptions
| Feature Type | Symbol | Description |
|---|---|---|
| Hydrogen Bond Acceptor (HBA) | HA | An atom or region that can accept a hydrogen bond, typically featuring lone electron pairs (e.g., carbonyl oxygen). |
| Hydrogen Bond Donor (HBD) | HD | A hydrogen atom covalently bound to an electronegative atom (e.g., O-H, N-H) that can donate a hydrogen bond. |
| Hydrophobic Area (H) | HY | A non-polar region of the ligand that participates in van der Waals interactions with complementary hydrophobic pockets on the target. |
| Positively Ionizable Group (PI) | PI | A functional group that can carry or can be protonated to carry a positive charge under physiological conditions (e.g., ammonium). |
| Negatively Ionizable Group (NI) | NE | A functional group that can carry or can be deprotonated to carry a negative charge (e.g., carboxylate). |
| Aromatic Ring (AR) | AR | A planar, cyclic system of conjugated π-electrons that can engage in cation-π or π-π stacking interactions. |
Additional features beyond these core six include metal-coordinating atoms and exclusion volumes (XVOL). Exclusion volumes are particularly important in structure-based approaches, as they represent forbidden regions in space that mimic steric restraints imposed by the protein's binding site walls [27] [37].
Methodological Workflow for Ligand-Based Pharmacophore Modeling
The construction of a ligand-based pharmacophore model is a multi-step process that transforms a set of active ligands into a consensus model capable of identifying new active compounds.
Figure 1: The workflow for developing a ligand-based pharmacophore model, from input ligands to a validated hypothesis.
Ligand Preparation and Conformational Analysis
The initial and crucial step involves curating a set of known active ligands with diverse structures but a common biological activity. Each ligand must be converted into a realistic three-dimensional representation.
- Data Curation: The process begins with a collection of 15-50 ligands with known activity values (e.g., IC₅₀, Kᵢ) [38]. Structural diversity within this set increases the probability that the resulting model captures essential, target-specific features rather than scaffold-specific artifacts.
- 3D Conformation Generation: For each ligand, multiple low-energy 3D conformations are generated using tools like RDKit [36] or iConfGen [39]. This step is vital because the bioactive conformation is typically unknown. The ensemble of conformations accounts for the ligand's flexibility and ensures that the conformation that best matches the pharmacophore hypothesis is available for analysis. The maximum number of output conformations can be set to a default value, such as 25 per molecule, to balance computational cost and conformational coverage [39].
Molecular Alignment and Feature Extraction
This phase identifies the common spatial arrangement of chemical features across the diverse ligand set.
- Molecular Alignment: The 3D structures of the ligands are superimposed in a way that maximizes the overlap of their common chemical functionalities [36]. This alignment can be challenging and is often the most critical step for generating a meaningful model.
- Feature Extraction: With the ligands aligned, chemical features are identified on each molecule. Software tools like RDKit or LigandScout automate the detection of potential hydrogen bond donors/acceptors, hydrophobic regions, and aromatic systems based on molecular topology and atomic properties [36]. The result is a set of discrete feature points for each ligand in the training set.
Consensus Generation and Clustering
The final modeling step involves distilling the individual ligand features into a single consensus pharmacophore.
- Common Feature Identification: The algorithm identifies which features (e.g., a hydrogen bond acceptor) are present in all or most of the active ligands.
- Spatial Clustering: The 3D coordinates of these common features across all aligned ligands are then clustered using algorithms like k-means clustering [36]. The centroid of each cluster becomes the location of that specific feature in the final ensemble pharmacophore model. The number of clusters (k) and the criteria for selecting the most relevant clusters (e.g., based on density or biological plausibility) are key parameters in this step [36].
Advanced Quantitative and Machine Learning Approaches
Traditional methods rely on heuristics and manual refinement. Recent research focuses on increasing automation and quantitative predictive power.
Quantitative Pharmacophore Activity Relationship (QPhAR)
QPhAR represents a novel methodology that constructs quantitative models using pharmacophores as direct input, moving beyond qualitative screening [38] [39].
- Workflow: A consensus "merged-pharmacophore" is generated from all training samples. Input pharmacophores are aligned to this consensus, and their relative feature positions are used as descriptors for a machine learning algorithm (like partial least squares, PLS) to build a regression model that predicts biological activity [39].
- Advantages: This approach harnesses the abstract nature of pharmacophores, reducing bias toward overrepresented functional groups in small datasets and promoting scaffold hopping. It can provide a fully automated, end-to-end workflow from a set of ligands to a validated, activity-predicting pharmacophore model [38].
Table 2: Comparison of Traditional and Advanced (QPhAR) Ligand-Based Modeling Approaches
| Aspect | Traditional Ligand-Based Modeling | QPhAR Approach |
|---|---|---|
| Output | Qualitative hypothesis (active/inactive) | Quantitative model predicting activity (e.g., pIC₅₀) |
| Data Utilization | Often uses a subset of highly active compounds | Uses all available activity data (continuous values) |
| Automation Level | High manual refinement and expert input | Fully automated model optimization |
| Basis for Validation | Fit value, screening decoy sets | Statistical cross-validation (e.g., R², RMSE) |
| Reported Performance | - | Average RMSE of 0.62 (±0.18) on 250+ diverse datasets [39] |
Integration with Deep Learning
The field is beginning to embrace deep learning. For instance, DiffPhore is a knowledge-guided diffusion framework that generates 3D ligand conformations which maximally map to a given pharmacophore model [37]. It uses a diffusion-based generative process, guided by explicit pharmacophore type and direction matching rules, to create conformations that are optimized for a specific pharmacophore, thereby inverting the traditional process [37].
Experimental Protocols and Validation
A robust validation strategy is imperative to ensure the generated pharmacophore model possesses predictive power and is not overfitted to the training data.
Key Experimental Protocol: Ligand-Based Ensemble Pharmacophore Construction
The following protocol, derived from a TeachOpenCADD tutorial, outlines the specific steps for generating an ensemble pharmacophore for a kinase target (EGFR) using open-source tools [36].
- Obtain Pre-aligned Ligands: Start with a set of ligand structures (e.g., from Protein Data Bank entries) known to bind the target. These ligands should be pre-aligned based on their superposition in the target's binding site or via ligand-based alignment methods.
- Load and Prepare Molecules: Read the ligands from their structure files (e.g., PDB format) using RDKit's
Chem.MolFromPDBFile. A critical step is assigning correct bond orders from a reference structure (e.g., SMILES string) usingAllChem.AssignBondOrdersFromTemplateto avoid aromaticity perception errors common when reading PDB files [36]. - Extract Pharmacophore Features: For each aligned ligand, use RDKit's chemical feature factory to identify and locate 3D coordinates of key features: Hydrogen Bond Donors (HBD), Hydrogen Bond Acceptors (HBA), and Hydrophobic centers (H).
- Collect and Cluster Feature Coordinates: Pool the 3D coordinates of each feature type from all ligands. Apply the k-means clustering algorithm (
sklearn.cluster.KMeans) separately to the coordinates of HBDs, HBAs, and Hs. The value ofk(number of clusters) can be set based on the expected number of critical interactions for the target family. - Select Relevant Clusters and Build Model: After clustering, select the most representative cluster for each feature type, often based on the largest cluster or the cluster with the highest density of points. The final ensemble pharmacophore consists of a single 3D point for each key feature type (e.g., one HBD, one HBA, one H) derived from the centroid of the selected clusters.
Model Validation Techniques
- Test Set Decoding: The model's ability to correctly classify a separate test set of known active and inactive compounds is a primary validation method. Metrics like the Fβ-score and FSpecificity-score are more informative than accuracy in a virtual screening context, where minimizing false positives is critical [38].
- Virtual Screening Power: The ultimate test involves using the pharmacophore as a query to screen a large database. A successful model should retrieve known active compounds (from a hold-out set) early in the hit list and potentially identify new, structurally diverse actives (scaffold hops) [40]. For a QPhAR model, the predictive power is measured by metrics like R² and Root Mean Square Error (RMSE) on a test set [38] [39].
The Scientist's Toolkit: Essential Research Reagents and Software
The practical application of ligand-based pharmacophore modeling relies on a suite of software tools and databases.
Table 3: Essential Resources for Ligand-Based Pharmacophore Modeling
| Tool / Resource | Type | Key Function in Research | Availability |
|---|---|---|---|
| RDKit | Software Library | Open-source toolkit for cheminformatics; used for molecule handling, feature extraction, and basic pharmacophore modeling. [36] | Open Source |
| LigandScout | Software Application | Advanced software for creating and validating structure- and ligand-based pharmacophore models and performing virtual screening. [39] | Commercial |
| ZINC Database | Compound Library | A public database of commercially available compounds used as a virtual screening library for experimental validation. [40] [41] | Free Access |
| ChEMBL Database | Bioactivity Database | A manually curated database of bioactive molecules with drug-like properties; used for obtaining training/test ligand sets. [39] | Free Access |
| PHASE | Software Module | A tool within the Schrödinger suite that supports ligand-based pharmacophore modeling and quantitative PHASE QSAR. [37] [39] | Commercial |
| HypoGen (Catalyst) | Algorithm | An algorithm in BIOVIA Discovery Studio that generates quantitative pharmacophore hypotheses from a set of active and inactive compounds. [39] | Commercial |
Ligand-based pharmacophore modeling remains a cornerstone of computer-aided drug design, providing a powerful and intuitive method for translating the chemical information of known active compounds into an abstract query for discovering new hits. The core process of deriving features from an ensemble of ligands—through alignment, feature extraction, and clustering—has been enhanced by quantitative approaches like QPhAR and the emerging application of deep learning. These advancements are steadily automating the modeling process and increasing its predictive robustness. When integrated into a virtual screening workflow and rigorously validated, ligand-based pharmacophore models serve as an efficient and effective strategy for lead identification and optimization, successfully enabling scaffold hopping in the pursuit of novel therapeutic agents.
In the realm of computer-aided drug design, a pharmacophore represents an abstract description of the molecular features that are essential for a ligand to interact with its biological target. According to IUPAC definitions, it is "an ensemble of steric and electronic features that is necessary to ensure the optimal supramolecular interactions with a specific biological target and to trigger (or block) its biological response" [1]. Structure-based pharmacophore modeling specifically derives these critical features directly from the three-dimensional structure of a protein-ligand complex, providing a powerful approach for identifying novel bioactive compounds when the target structure is known [42] [43].
This methodology stands in contrast to ligand-based approaches, which infer pharmacophore features from a set of known active compounds without structural information about the target protein. The structure-based approach offers distinct advantages, particularly that it requires no prior knowledge of active ligands and remains unbiased by existing chemical space [43]. By analyzing the precise atomic interactions within a protein-ligand complex, researchers can identify the essential hydrogen bonding, hydrophobic, aromatic, and ionic interactions responsible for molecular recognition and binding affinity [1].
The fundamental premise of structure-based pharmacophore modeling is that the binding site of a protein presents specific chemical environments that complementary ligands must satisfy. These environments can be translated into pharmacophore features that collectively define the optimal interaction points for potential ligands [43]. This approach has become increasingly valuable in drug discovery, enabling virtual screening of compound libraries to identify novel scaffolds with desired biological activity against therapeutic targets [20] [44] [45].
Fundamental Pharmacophore Features
Types and Characteristics
Pharmacophore models represent key molecular interactions as distinct features with specific spatial orientations. The most fundamental features include hydrogen bond acceptors (HBA), hydrogen bond donors (HBD), hydrophobic centers (H), aromatic rings (AR), and ionic charges (positive/negative) [1] [33]. Some models further distinguish features such as halogen bond donors (XBD) and negative ionizable groups [46].
Table 1: Core Pharmacophore Features and Their Characteristics
| Feature Type | Chemical Groups | Complementary Protein Elements | Typical Distance Constraints |
|---|---|---|---|
| Hydrogen Bond Acceptor | Carbonyl oxygen, Ether oxygen, Nitrile nitrogen | Ser/Thr/Tyr OH, Backbone NH, His NH | 2.5-3.2 Å |
| Hydrogen Bond Donor | Amine NH, Hydroxyl OH, Amide NH | Asp/Glu COO-, Backbone C=O, Asn/Gln CONH2 | 2.5-3.2 Å |
| Hydrophobic | Alkyl chains, Aromatic rings | Leu/Ile/Val/Pro/Phe side chains | 3.3-4.5 Å |
| Aromatic | Phenyl, Pyridine, Heterocycles | Phe/Tyr/Trp side chains, Cationic groups | 3.8-5.5 Å (π-π, cation-π) |
| Positive Ionizable | Primary amines, Guanidines | Asp/Glu COO-, Phosphate groups | 2.8-3.5 Å |
| Negative Ionizable | Carboxylic acids, Phosphates, Tetrazoles | Arg/Lys NH+, His imidazole | 2.8-3.5 Å |
These features are not merely abstract concepts but represent specific, energetically favorable interactions that drive molecular recognition. For example, in a study targeting the XIAP protein, researchers identified four hydrophobic features, one positive ionizable feature, three hydrogen bond acceptors, and five hydrogen bond donors as critical for ligand binding [20]. The spatial arrangement of these features collectively defines the pharmacophore model that can be used for virtual screening.
Exclusion Volumes
Beyond the positive interaction features, structure-based pharmacophore models incorporate exclusion volumes to represent steric constraints. These volumes define regions in space where ligand atoms cannot be placed without causing unfavorable clashes with protein atoms [43] [6]. In the XIAP protein study, the generated pharmacophore model included 15 exclusion volume spheres to account for protein atoms that would sterically hinder ligand binding [20]. The inclusion of exclusion volumes significantly improves the selectivity of pharmacophore-based virtual screening by reducing false positives that might otherwise fit the positive features but sterically clash with the protein [43].
Methodological Workflow
The process of creating structure-based pharmacophore models follows a systematic workflow that transforms protein-ligand structural information into searchable queries for virtual screening. The overall process can be visualized as follows:
Protein-Ligand Complex Preparation
The initial step involves obtaining and preparing a high-quality protein-ligand complex structure, typically from the Protein Data Bank (PDB). The structure should have adequate resolution (preferably <2.5 Å) and contain a bound ligand with confirmed biological activity [20] [6]. Structure preparation includes adding hydrogen atoms, correcting protonation states, and performing energy minimization to ensure structural integrity [45]. For example, in the PD-L1 inhibitor study, researchers used the crystal structure 6R3K complexed with a small molecule inhibitor JQT as the foundation for pharmacophore modeling [44].
Interaction Analysis and Feature Mapping
The core of structure-based pharmacophore modeling involves detailed analysis of interactions between the protein and bound ligand. Software tools like LigandScout [20] and Discovery Studio [6] automatically detect and categorize these interactions, though manual verification is often necessary. The interaction analysis for the XIAP protein revealed that hydrophobic interactions were predominant, with additional specific hydrogen bonds formed with residues THR308, ASP309, and GLU314 [20]. Water-mediated interactions, such as those observed with HOH523, HOH556, and HOH565 in the XIAP complex, should be carefully considered as they can contribute significantly to binding affinity [20].
Pharmacophore Model Generation
Once key interactions are identified, they are translated into pharmacophore features with specific spatial coordinates. The model should balance comprehensiveness with practicality – including all critical interactions while maintaining sufficient flexibility for identifying diverse chemotypes [43]. Most software packages employ clustering algorithms to optimize feature placement. For hydrophobic features, k-means clustering of favorable interaction points is commonly used, with cluster centers representing the optimal feature placement [43]. The distance cutoff for clustering significantly impacts model quality, with values between 1.5-2.5 Å typically providing optimal results [43].
Model Validation
Before deploying a pharmacophore model for virtual screening, rigorous validation is essential. The most common validation method uses decoy sets containing known active compounds and inactive decoys to calculate enrichment factors (EF) and receiver operating characteristic (ROC) curves [20] [6]. The area under the ROC curve (AUC) quantifies model performance, with values approaching 1.0 indicating excellent discrimination. In the XIAP study, the validated pharmacophore model achieved an exceptional AUC value of 0.98 with an enrichment factor (EF1%) of 10.0 at the 1% threshold, demonstrating strong predictive power [20].
Table 2: Pharmacophore Model Validation Metrics from Recent Studies
| Target Protein | Validation Method | AUC Value | Enrichment Factor | Reference |
|---|---|---|---|---|
| XIAP | Decoy Set (DUDe) | 0.98 | EF1% = 10.0 | [20] |
| PD-L1 | ROC Analysis | 0.819 | Not specified | [44] |
| Akt2 | Test Set + Decoy Set | Not specified | Significant enrichment | [6] |
| Pf 5-ALAS | Not specified | Not specified | Not specified | [45] |
Experimental Protocols and Implementation
Detailed Protocol for Structure-Based Pharmacophore Modeling
Step 1: Protein-Ligand Complex Preparation
- Obtain crystal structure from PDB (e.g., 5OQW for XIAP protein [20])
- Remove extraneous water molecules, except those mediating key interactions
- Add hydrogen atoms using protonation tools at physiological pH (7.4)
- Energy minimization using MMFF94 or similar force field to relieve steric clashes
- Define binding site using ligand coordinates or active site prediction tools
Step 2: Interaction Analysis
- Load prepared complex into pharmacophore modeling software (LigandScout, Discovery Studio)
- Automatically detect protein-ligand interactions (hydrogen bonds, hydrophobic contacts, ionic interactions)
- Manually verify automated interaction detection for accuracy
- Identify key water molecules involved in water-mediated hydrogen bonding networks
- Document interacting residues and interaction types for reference
Step 3: Feature Generation
- Convert identified interactions into pharmacophore features with precise coordinates
- Set appropriate feature tolerances (typically 1.0-1.5 Å for hydrogen bonds, 1.5-2.0 Å for hydrophobic)
- Add exclusion volumes representing protein atoms using van der Waals radii
- Optimize feature selection to balance specificity and generality
- Export preliminary pharmacophore model
Step 4: Model Validation
- Compile test set with known active compounds and decoy molecules
- Screen test set against pharmacophore model
- Calculate enrichment factors and ROC curves
- Adjust model parameters if enrichment is unsatisfactory
- Finalize validated pharmacophore model for virtual screening
Advanced Implementation: Protein-Based Pharmacophores Without Ligand Information
In cases where only the apo-protein structure is available, protein-based pharmacophore approaches can generate models without ligand information [43]. This method uses molecular interaction fields (MIFs) generated by probing the binding site with chemical fragments representing different interaction types. A 3D grid with 0.4 Å spacing is projected onto the binding site, and interaction energies are computed at each grid point using scoring functions like ChemScore [43]. The resulting interaction maps are clustered to identify favorable regions for specific pharmacophore features. Studies have demonstrated that optimizing the interaction range for pharmacophore generation (IRFPG) significantly impacts model quality, with optimal distance cutoffs varying by interaction type [43].
Virtual Screening Applications
Database Screening and Hit Identification
Validated pharmacophore models serve as 3D search queries for screening compound databases. The screening process identifies molecules that match the spatial arrangement of pharmacophore features, suggesting potential biological activity. In the PD-L1 inhibitor study, researchers screened 52,765 marine natural products using a structure-based pharmacophore model, ultimately identifying 12 initial hits that matched all pharmacophore features [44]. Similarly, the XIAP study discovered three natural compounds (Caucasicoside A, Polygalaxanthone III, and MCULE-9896837409) with potential anticancer activity through pharmacophore-based screening [20].
The virtual screening workflow typically involves multiple filtering stages:
Integration with Molecular Docking
Pharmacophore screening is frequently combined with molecular docking to refine hit selection. While pharmacophore models efficiently filter large databases, docking provides more detailed assessment of binding modes and affinities. In the PD-L1 study, the two best compounds from pharmacophore screening exhibited binding affinities of -6.5 kcal/mol and -6.3 kcal/mol in molecular docking, outperforming the original reference inhibitor (-6.2 kcal/mol) [44]. This synergistic approach leverages the speed of pharmacophore screening with the precision of docking calculations.
Post-Screening Validation
Following virtual screening, advanced computational techniques validate the stability and binding characteristics of identified hits. Molecular dynamics (MD) simulations over 50-200 ns trajectories assess complex stability and interaction persistence [20] [44] [45]. The MM-GBSA method calculates binding free energies, providing quantitative assessment of ligand affinity [46]. In the ESR2 mutant inhibitor study, researchers used 200 ns MD simulations followed by MM-GBSA analysis to identify ZINC05925939 as the most promising candidate among initial hits [46].
Table 3: Key Research Reagent Solutions for Structure-Based Pharmacophore Modeling
| Resource Category | Specific Tools/Software | Primary Function | Application Context |
|---|---|---|---|
| Protein Structure Sources | PDB, AlphaFold, SWISS-MODEL | Provide 3D protein structures | Initial complex preparation [45] |
| Pharmacophore Modeling Software | LigandScout, Discovery Studio, Pharmit | Generate and visualize pharmacophore models | Feature identification and model generation [20] [45] |
| Compound Databases | ZINC, CHEMBL, ChemSpace, Natural Product Databases | Source compounds for virtual screening | Virtual screening campaigns [20] [44] [45] |
| Molecular Docking Tools | AutoDock, GOLD, Glide | Predict binding poses and affinities | Post-screening validation [44] [6] |
| Dynamics Simulation Software | NAMD, GROMACS, AMBER | Assess complex stability over time | Binding stability validation [20] [45] |
| Cheminformatics Toolkits | RDKit, OpenBabel | Handle chemical data and conversions | Ligand preparation and analysis [19] [33] |
Emerging Trends and Advanced Approaches
Artificial Intelligence in Pharmacophore Modeling
Recent advances integrate deep learning with pharmacophore modeling to enhance feature identification and molecule generation. The PharmRL approach uses convolutional neural networks (CNN) to identify favorable interaction points in binding sites, followed by deep reinforcement learning to select optimal feature combinations [33]. This method demonstrates that AI-generated pharmacophores can achieve competitive performance in virtual screening, even surpassing some traditional approaches. Similarly, the PGMG framework employs graph neural networks to encode spatially distributed chemical features and transformers to generate molecules matching specific pharmacophores [19]. These AI-driven approaches show particular promise for targets with limited structural or ligand information.
Hybrid Methods and Future Directions
The integration of structure-based pharmacophore modeling with complementary computational techniques represents the future of this field. Multi-target pharmacophore models enable polypharmacology applications, while dynamic pharmacophores incorporate protein flexibility through ensemble docking or MD simulations [43]. The growing availability of high-quality protein structures from initiatives like AlphaFold expands the potential applications of structure-based pharmacophore approaches to previously inaccessible targets [45]. As these methods continue evolving, they will likely play increasingly central roles in early drug discovery, potentially reducing the time and cost associated with identifying novel therapeutic candidates.
Structure-based pharmacophore modeling provides a powerful framework for translating structural biology information into actionable drug discovery strategies. By systematically extracting critical interaction features from protein-ligand complexes, researchers can create efficient virtual screening queries that identify novel chemotypes with desired biological activity. The integration of these approaches with molecular docking, dynamics simulations, and emerging AI technologies creates a robust pipeline for accelerating early drug discovery. As structural information continues expanding and computational methods advance, structure-based pharmacophore modeling will remain an essential component of the computer-aided drug design toolkit, enabling more efficient and targeted therapeutic development across diverse disease areas.
In the landscape of computer-aided drug design, a pharmacophore is universally defined as "the ensemble of steric and electronic features that is necessary to ensure the optimal supramolecular interactions with a specific biological target structure and to trigger (or to block) its biological response" [47]. This concept, dating back to Paul Ehrlich in the late 19th century, has evolved into a fundamental principle for understanding and predicting molecular recognition [47]. In practical terms, pharmacophore models abstract key interaction points from active molecules or protein-ligand complexes, moving beyond specific functional groups to represent generalized interaction types. The most critical of these features include hydrogen bond acceptors (HBA), hydrogen bond donors (HBD), and hydrophobic (H) features, which form the cornerstone of most modern virtual screening (VS) campaigns.
Virtual screening represents a critical computational approach for identifying novel bioactive molecules from extensive chemical libraries, significantly reducing the time and cost associated with experimental high-throughput screening [48] [49]. By employing pharmacophore-based virtual screening (PBVS), researchers can efficiently filter large databases to enrich compounds that possess the essential features for biological activity, thereby increasing the likelihood of discovering viable lead compounds [47] [50]. The strategic use of HBA, HBD, and H features allows for this efficient navigation of chemical space, balancing molecular complexity with optimal interaction potential to identify novel chemotypes with desired biological activity.
Theoretical Foundations of Key Pharmacophore Features
Hydrogen Bond Acceptors (HBA)
Hydrogen bond acceptors are atoms or regions in a molecule that can accept a hydrogen bond from a donor group, typically through lone pairs of electrons. Common HBA features include oxygen atoms in carbonyl groups, hydroxyl groups, ethers, and esters, as well as nitrogen atoms in amines, amides, and heterocyclic aromatic rings. In pharmacophore modeling, HBA features are represented as vectors pointing in the direction of the potential hydrogen bond formation, often with a defined tolerance radius to accommodate geometric variations [47]. These features are critical for mediating specific interactions with complementary hydrogen bond donor residues in the protein binding site, such as serine, threonine, tyrosine, or backbone amide groups.
Hydrogen Bond Donors (HBD)
Hydrogen bond donors are atoms or groups that can donate a hydrogen atom in a hydrogen bond interaction. These typically feature a hydrogen atom covalently bonded to an electronegative atom such as oxygen (in hydroxyl groups), nitrogen (in amines, amides), or sometimes sulfur (in thiols). In pharmacophore models, HBD features are represented similarly to HBAs, with directional vectors and tolerance radii [50]. The complementarity between HBD and HBA features between ligand and protein often dictates the specificity and strength of binding, making them crucial for molecular recognition.
Hydrophobic (H) Features
Hydrophobic features represent regions of the molecule that are non-polar and favor interactions with other non-polar surfaces, primarily through van der Waals forces and the hydrophobic effect. These include aliphatic carbon chains, aromatic rings, and hydrocarbon segments that lack polar atoms. In pharmacophore models, hydrophobic features are typically represented as spheres or points without directionality, reflecting their non-specific nature [47]. These features often contribute significantly to binding affinity through the burial of non-polar surface area and can influence bioavailability by affecting membrane permeability.
Table 1: Characteristics of Core Pharmacophore Features
| Feature Type | Atomic Components | Interaction Type | Representation in Models |
|---|---|---|---|
| Hydrogen Bond Acceptor (HBA) | Oxygen (carbonyl, ether), Nitrogen (amines, heterocycles) | Electrostatic, Directional | Vector with tolerance radius |
| Hydrogen Bond Donor (HBD) | O-H, N-H, sometimes S-H | Electrostatic, Directional | Vector with tolerance radius |
| Hydrophobic (H) | Aliphatic carbons, Aromatic rings | van der Waals, Entropic (hydrophobic effect) | Sphere/point without directionality |
Additional Supporting Features
While HBA, HBD, and H form the core feature set, comprehensive pharmacophore models may incorporate additional features for enhanced specificity:
- Positive and Negative Ionizable Groups: Represent functional groups that can carry formal charges under physiological conditions, enabling strong electrostatic interactions [50].
- Aromatic Rings: Sometimes distinguished from general hydrophobic features due to their potential for cation-π and π-π stacking interactions [47].
- Exclusion Volumes: Spatial regions where atoms should not be present, modeling steric constraints of the binding pocket [47].
Methodological Workflow for Pharmacophore-Based Virtual Screening
The successful implementation of pharmacophore-based virtual screening follows a systematic workflow that integrates computational modeling with empirical validation. The diagram below illustrates this multi-stage process:
Data Collection and Preparation
The initial phase involves gathering high-quality structural and chemical data. For structure-based approaches, this entails obtaining three-dimensional structures of the target protein, preferably in complex with known ligands, from sources like the Protein Data Bank (PDB) [47] [50]. For ligand-based approaches, a collection of known active compounds with diverse structures is essential [47]. The screening database must be carefully curated, with compounds converted to appropriate 3D formats and prepared with correct tautomeric and protonation states [51].
Critical to this phase is the preparation of decoys or presumed inactive compounds for model validation. The Directory of Useful Decoys, Enhanced (DUD-E) provides optimized decoys matched to active molecules based on physicochemical properties but different topologies [52] [47]. A typical recommended ratio is approximately 1:50 for active molecules to decoys, reflecting the real-world screening scenario where only a few active molecules are distributed among vast numbers of inactive compounds [47].
Pharmacophore Model Generation
Structure-Based Pharmacophore Modeling
Structure-based models are derived from analysis of protein-ligand complexes. Using software such as LigandScout or Discovery Studio, researchers extract the interaction pattern between the protein and bound ligand [47] [50]. Key HBA, HBD, and H features are identified based on complementarity between ligand functional groups and protein residues. For instance, in a study targeting SARS-CoV-2 papain-like protease, researchers developed a structure-based pharmacophore model with nine features derived from crystallographic complexes with potent inhibitors [50].
Ligand-Based Pharmacophore Modeling
When protein structural data is unavailable, ligand-based approaches align multiple known active compounds to identify common pharmacophore features [47]. This method assumes that all common chemical features from the pharmacophore are essential for activity, whereas structure-based approaches can discriminate which features directly participate in binding [47].
Model Validation and Optimization
Before proceeding to large-scale screening, preliminary models require validation using datasets containing known active and inactive molecules [47]. Key validation metrics include:
- Enrichment Factor (EF): Measures the enrichment of active molecules compared to random selection [47] [48].
- ROC-AUC Analysis: The area under the Receiver Operating Characteristic curve evaluates the model's ability to distinguish actives from inactives [47] [48].
- Yield of Actives: The percentage of active compounds in the virtual hit list [47].
Model refinement involves adjusting feature tolerances, weights, and optional features to maximize retrieval of active compounds while excluding inactives [47] [50].
Virtual Screening Execution
Validated pharmacophore models are used to screen large chemical libraries. Compounds that map to the essential HBA, HBD, and H features are collected in a virtual hit list for further analysis [47]. Successful PBVS campaigns typically report hit rates between 5% to 40%, significantly higher than the <1% rates often observed with random selection [47].
Experimental Protocols and Case Studies
Detailed Protocol: Structure-Based Virtual Screening for Enzyme Targets
The following protocol outlines a representative structure-based virtual screening campaign, integrating HBA, HBD, and H feature identification:
Target Preparation: Obtain the 3D crystal structure of the target enzyme in complex with a high-affinity ligand from PDB. Remove water molecules and cofactors not essential for binding. Add hydrogen atoms and optimize protonation states of key residues using molecular modeling software.
Pharmacophore Feature Identification: Using LigandScout or similar software, analyze the protein-ligand interaction pattern. Identify critical HBA, HBD, and H features:
- Map HBA features complementary to protein HBD residues (e.g., backbone amides, side-chain hydroxyls)
- Map HBD features complementary to protein HBA residues (e.g., carbonyl oxygens, carboxylate groups)
- Identify H features adjacent to protein hydrophobic pockets
Model Generation and Validation: Generate an initial pharmacophore hypothesis containing 5-7 features. Validate against a test set of 20-30 known active compounds and 1000+ decoys from DUD-E. Optimize model by adjusting feature tolerances (typically 1.0-1.5 Å) to achieve enrichment factor >20 at 1% cutoff.
Database Screening: Screen databases such as ZINC, ChEMBL, or in-house collections using the validated model. Apply Lipinski's Rule of Five filters (MW ≤ 500, HBD ≤ 5, HBA ≤ 10, logP ≤ 5) to focus on drug-like compounds [51].
Post-Screening Analysis: Subject virtual hits to molecular docking studies to verify binding poses and complementarity. Further filter based on structural novelty and synthetic accessibility.
Experimental Validation: Procure or synthesize top-ranked compounds for in vitro activity assays to confirm biological activity.
Case Study: Identification of SARS-CoV-2 PLpro Inhibitors
A recent study demonstrated the successful application of PBVS to identify marine natural products as SARS-CoV-2 papain-like protease inhibitors [50]. Researchers developed a structure-based pharmacophore model derived from crystallographic structures of PLpro complexed with potent inhibitors (PDB IDs: 7LBS, 7LOS, 7LLZ, 7LLF). The optimized model contained nine features representing essential HBA, HBD, and H interactions. Screening of the Comprehensive Marine Natural Product Database (CMNPD) identified 66 initial hits, which were subsequently filtered by molecular weight (≤500 g/mol) to yield 50 candidates. Comparative molecular docking and consensus scoring identified aspergillipeptide F as the top candidate, which demonstrated stable binding in molecular dynamics simulations and engaged all five binding sites of PLpro, including the newly discovered BL2 groove [50].
Case Study: Machine Learning-Enhanced Virtual Screening for PARP1 Inhibitors
In a 2025 study targeting PARP1 for prostate cancer treatment, researchers integrated machine learning with pharmacophore-based screening [52]. A library of 9,510 phytochemicals was screened using a random forest model trained on 6,510 known active inhibitors and 2,871 decoys. The model achieved exceptional accuracy (0.9489) and AUC (0.9846) in identifying compounds with potential PARP1 inhibition. Following machine learning classification, researchers applied Lipinski's Rule of Five, yielding 40 promising candidates. Subsequent molecular docking and dynamics simulations identified ZINC14584870 and ZINC43120769 as the most stable interactors with PARP1, demonstrating the power of combining computational approaches [52].
Table 2: Performance Metrics of Virtual Screening Methods Across Targets
| Target Protein | Screening Method | Enrichment Factor (EF1%) | Hit Rate | Reference |
|---|---|---|---|---|
| PARP1 | Machine Learning + PBVS | N/A | 4.2% (40/9510) | [52] |
| SARS-CoV-2 PLpro | Structure-Based PBVS | N/A | 0.76% (66/CMNPD) | [50] |
| CK2 | Docking-Based VS | N/A | 0.025% (104/400,000) | [53] |
| PPARγ | Random Selection | 1.0 (baseline) | 0.075% | [47] |
| Multiple Targets (Average) | Pharmacophore-Based VS | 16.72 (Top 1%) | 5-40% | [47] [54] |
Successful implementation of pharmacophore-based virtual screening requires access to specialized software tools, databases, and computational resources. The following table summarizes key components of the virtual screening toolkit:
Table 3: Essential Resources for Pharmacophore-Based Virtual Screening
| Resource Category | Specific Tools/Databases | Key Function | Access |
|---|---|---|---|
| Pharmacophore Modeling Software | LigandScout, Catalyst, PHASE | Generate and validate pharmacophore hypotheses | Commercial |
| Structural Databases | Protein Data Bank (PDB) | Source of protein-ligand complexes for structure-based modeling | Public |
| Compound Libraries | ZINC, ChEMBL, CMNPD, DrugBank | Collections of screening compounds with bioactivity data | Public |
| Decoy Sets | DUD-E, DEKOIS 2.0 | Property-matched decoys for model validation | Public |
| Molecular Docking Software | AutoDock Vina, GOLD, Glide, DOCK | Verify binding poses of virtual hits | Mixed (Public/Commercial) |
| Cheminformatics Toolkits | RDKit, OpenBabel | Calculate molecular descriptors and format conversion | Open Source |
| High-Performance Computing | Local Clusters, Cloud Computing | Execute computationally intensive screening campaigns | Institutional/Commercial |
Comparative Analysis of Virtual Screening Approaches
Pharmacophore-Based VS vs. Docking-Based VS
A benchmark comparison against eight diverse protein targets revealed that pharmacophore-based virtual screening (PBVS) generally outperformed docking-based virtual screening (DBVS) methods [55]. In fourteen of sixteen virtual screening scenarios, PBVS demonstrated higher enrichment factors than DBVS using programs like DOCK, GOLD, and Glide [55]. The average hit rates at 2% and 5% of the highest ranks were substantially better for PBVS across all targets, including angiotensin-converting enzyme (ACE), acetylcholinesterase (AChE), androgen receptor (AR), and HIV-1 protease [55].
Strategic Integration of Multiple Approaches
While PBVS shows superior performance in many scenarios, the most successful virtual screening campaigns often integrate multiple approaches. A hybrid strategy might employ:
- Pharmacophore-based filtering to rapidly reduce database size
- Molecular docking to refine binding poses and assess complementarity
- Machine learning classification to prioritize compounds based on multiple criteria
- Molecular dynamics simulations to validate binding stability [52] [50]
This integrated approach leverages the strengths of each method while mitigating their individual limitations.
The strategic application of HBA, HBD, and H features in pharmacophore-based virtual screening represents a powerful methodology for lead identification in drug discovery. The abstraction of specific functional groups to generalized interaction types enables effective scaffold hopping and identification of novel chemotypes with desired biological activity. As computational resources continue to expand and algorithms become more sophisticated, the scale and accuracy of virtual screening campaigns will further improve.
Future developments in this field will likely include increased integration of machine learning and artificial intelligence for enhanced feature selection and activity prediction [52] [54], more sophisticated treatment of molecular flexibility and water-mediated interactions, and dynamic pharmacophore models that account for protein conformational changes. Despite these advances, the fundamental principles of molecular recognition embodied in HBA, HBD, and H features will remain central to rational drug design strategies, continuing to provide researchers with a powerful framework for navigating complex chemical space in the pursuit of novel therapeutic agents.
The journey from a initial lead compound to a potent, selective, and drug-like clinical candidate represents one of the most critical phases in drug discovery. Within this process, lead optimization aims to improve the desired biological activity and pharmacokinetic properties of a compound through systematic chemical modifications. Pharmacophore models serve as indispensable conceptual and computational frameworks that guide these structural changes by representing the essential steric and electronic features necessary for a molecule to interact with its biological target and trigger or block a pharmacological response [56] [27]. According to the International Union of Pure and Applied Chemistry (IUPAC), a pharmacophore is formally defined as "the ensemble of steric and electronic features that is necessary to ensure the optimal supramolecular interactions with a specific biological target structure and to trigger (or to block) its biological response" [27]. This abstract description transcends specific molecular scaffolds, enabling medicinal chemists to identify and optimize the fundamental components of bioactivity across chemically diverse compounds.
In the context of lead optimization, pharmacophore insights provide a rational blueprint for chemical modification. By understanding which hydrogen bond acceptors, hydrogen bond donors, hydrophobic regions, and other key features are critical for binding, scientists can prioritize synthetic efforts to reinforce these interactions while eliminating structural elements that contribute to undesired properties like toxicity or poor metabolic stability [57] [9]. The power of this approach lies in its ability to bridge the gap between molecular structure and biological function, creating a strategic pathway for enhancing compound efficacy through targeted structural refinement. This review examines the fundamental pharmacophore feature types, details practical methodologies for their application in lead optimization, and demonstrates their utility through case studies and quantitative frameworks.
Essential Pharmacophore Feature Types and Their Structural Correlates
Successful pharmacophore-guided lead optimization requires a deep understanding of the fundamental chemical features involved in molecular recognition and their corresponding structural manifestations in organic compounds. The most critical pharmacophore features include hydrogen bond acceptors, hydrogen bond donors, hydrophobic regions, and ionizable groups, each contributing distinctly to ligand-receptor binding thermodynamics and kinetics.
Table 1: Fundamental Pharmacophore Features and Their Structural Correlates
| Feature Type | Chemical Groups | Role in Molecular Recognition | Optimization Strategies |
|---|---|---|---|
| Hydrogen Bond Acceptor (HBA) | Ethers, aldehydes, ketones, esters, amines (tertiary) [58] | Forms electrostatic interactions with hydrogen bond donors in protein targets; influences binding orientation and specificity [27] | Introduce electron-withdrawing groups to enhance electronegativity; optimize spatial positioning relative to donor groups |
| Hydrogen Bond Donor (HBD) | Alcohols, primary amines, secondary amines, carboxylic acids [58] | Donates hydrogen to form bridges with acceptor atoms (O, N) in binding pockets; typically requires both donor atom and bound hydrogen [59] | Strengthen partial positive charge on hydrogen; control acidity to fine-tune interaction strength; remove competing donor groups |
| Hydrophobic (H) | Alkyl chains, aromatic rings, alicyclic systems [60] [61] | Drives association via hydrophobic effect; gains ~6.3 kJ/mol per methylene group from water displacement entropy [61] | Extend alkyl chains to bury surface area; incorporate aromatic systems for π-stacking; cluster hydrophobic features |
| Aromatic (AR) | Phenyl, pyridine, heterocyclic rings [27] | Enables π-π stacking, cation-π interactions, and defines molecular shape; provides planar rigid elements for orientation | Fuse rings to enhance electron density; introduce electron-withdrawing/donating substituents to modulate interaction potential |
| Positively Ionizable (PI) | Primary, secondary, tertiary amines (at physiological pH) [27] | Forms salt bridges with negatively charged residues (Asp, Glu); creates strong, long-range electrostatic attractions | Adjust pKa to ensure proper protonation state; spatial positioning opposite carboxylate groups in binding site |
| Negatively Ionizable (NI) | Carboxylic acids, tetrazoles, sulfonamides [27] | Interacts with positively charged residues (Arg, Lys, His); can serve as metal coordinators for catalytic sites | Employ bioisosteric replacement to modulate acidity; optimize geometry for coordination with metal ions |
Hydrogen bonding features deserve particular attention in lead optimization campaigns. A hydrogen bond donor requires a hydrogen atom bound to a small, highly electronegative atom (primarily nitrogen, oxygen, or fluorine), while a hydrogen bond acceptor is a strongly electronegative atom with one or more lone electron pairs [59]. Notably, some functional groups like alcohols, primary amines, and secondary amines can function as both donors and acceptors, while others like ethers, aldehydes, ketones, and esters function primarily as acceptors [58]. This distinction becomes critically important when optimizing lead compounds, as reinforcing key hydrogen bonding interactions can significantly enhance binding affinity.
The hydrophobic effect represents another crucial driver of molecular recognition, distinct from specific directional interactions like hydrogen bonds. Hydrophobic interactions arise from the energetic preference of nonpolar molecular surfaces to interact with each other rather than with water molecules, thereby displacing ordered water molecules from the binding interface and gaining significant entropic benefits [61]. During lead optimization, strategic incorporation of hydrophobic features such as alkyl chains and aromatic systems can dramatically improve binding affinity, with each methylene group contributing approximately 6.3 kJ/mol through the hydrophobic effect [61]. However, this approach must be balanced against potential detrimental effects on solubility and overall drug-likeness.
Methodological Approaches to Pharmacophore Modeling for Lead Optimization
The application of pharmacophore models in lead optimization primarily follows two complementary computational approaches: structure-based and ligand-based modeling. Each methodology offers distinct advantages and is selected based on the availability of structural information for the biological target and known active compounds.
Structure-Based Pharmacophore Modeling
Structure-based pharmacophore modeling leverages three-dimensional structural information about the target protein, typically obtained from X-ray crystallography, NMR spectroscopy, or homology modeling [27]. This approach begins with careful protein preparation, including the addition of hydrogen atoms, optimization of protonation states, and refinement of the structure through energy minimization [62] [27]. The subsequent identification of the ligand-binding site represents a critical step, which can be guided by co-crystallized ligands or through computational binding site detection algorithms like GRID or LUDI that analyze protein surfaces for potential interaction hotspots [27].
Once the binding site is characterized, the model generation focuses on identifying key interaction points between the protein and potential ligands. For instance, in a study targeting matrix metalloproteinases (MMP-1, MMP-8, and MMP-13), researchers used the HypoGen module within Catalyst to develop feature-based pharmacophore models that identified critical hydrogen bond acceptors, donors, and hydrophobic features responsible for high molecular bioactivity [62]. These models subsequently served as three-dimensional queries to screen knowledge-based designed molecules and identify novel inhibitors [62]. The structure-based approach particularly excels in identifying exclusion volumes—regions in space where ligand atoms would experience steric clashes with the protein—thus providing crucial constraints for lead optimization [27].
Ligand-Based Pharmacophore Modeling
When three-dimensional structural information for the target protein is unavailable, ligand-based pharmacophore modeling offers a powerful alternative. This approach derives pharmacophore features exclusively from a set of known active compounds by identifying their common chemical functionalities and spatial arrangements [27] [9]. The underlying principle posits that compounds sharing similar biological activity against a common target will exhibit conserved molecular features responsible for that activity.
The ligand-based workflow typically begins with the selection of a training set of active compounds representing diverse structural classes and a range of potencies [62]. Conformational analysis is then performed for each compound to generate a representative set of low-energy conformers. Using computational tools like Catalyst, Phase, or MOE, the algorithm identifies common pharmacophore features and their optimal spatial arrangement that correlates with biological activity [62] [27]. In the MMP study mentioned previously, researchers selected 21-22 training set compounds for each MMP target based on structural diversity and experimental activities, generated up to 250 conformations per compound using the 'best quality' conformational search option with the 'Poling' algorithm, and then submitted these to hypothesis generation [62]. The resulting pharmacophore hypotheses were rigorously validated using test set molecules not included in the training set, ensuring their predictive capability for novel compounds [62].
Figure 1: Workflow for Structure-Based and Ligand-Based Pharmacophore Modeling in Lead Optimization
Integrating Pharmacophore Insights with Experimental Data in Lead Optimization
The true power of pharmacophore models in lead optimization emerges when they are integrated with experimental data to inform structural modifications. This synergistic approach enables rational, hypothesis-driven design rather than random exploration of chemical space.
Structure-Activity Relationship (SAR) Analysis
Pharmacophore models provide a conceptual framework for interpreting structure-activity relationship (SAR) data by mapping observed changes in potency to specific molecular features and their spatial relationships. For example, in a study targeting the hydrophobic pocket of autotaxin (ATX), researchers developed a focused virtual screening approach based on aromatic sulfonamide derivatives [60]. Through rigorous SAR examination, they discovered that small structural changes at four key positions resulted in dramatic pharmacological differences, enabling the development of a spatially constrained pharmacophore model that delineated unique interactions with the hydrophobic pocket [60]. This model directly informed the optimization campaign, leading to the identification of compound 403070 with a Ki of 8.4 nM and improved drug-like properties [60].
The integration of exclusion volumes in pharmacophore models proves particularly valuable for explaining sudden drops in activity observed in SAR studies. If a compound exhibits unexpectedly low potency despite containing all the necessary pharmacophore features, steric clashes with the binding site—represented as exclusion volumes in the model—may provide the explanation. This insight directly guides subsequent synthetic efforts away from sterically hindered regions and toward more productive chemical space.
Virtual Screening and Scaffold Hopping
Pharmacophore models serve as powerful 3D search queries for virtual screening of compound databases to identify novel chemotypes that maintain the essential interaction features—a process known as scaffold hopping [62] [27]. This application is particularly valuable during lead optimization when seeking to address intellectual property constraints or improve adverse physicochemical properties while maintaining target engagement.
In the MMP inhibitor study, the best pharmacophore hypotheses for MMP-1, MMP-8, and MMP-13 were used to screen a library of 10,000 knowledge-based designed molecules generated through scaffold hopping [62]. The screening identified novel inhibitor scaffolds that matched the essential pharmacophore features—specifically, hydrogen bond acceptors and ring aromatic features in MMP-1 and MMP-13, and hydrogen bond acceptors and hydrophobic features in MMP-8 [62]. These newly identified compounds were subsequently validated through induced fit docking studies to confirm their binding modes and interactions within the S1' specificity pocket of the collagenases [62].
Table 2: Experimental Validation Metrics for Optimized Compounds in Case Studies
| Target | Compound ID/Class | Key Pharmacophore Features | Potency (IC50/Ki) | Validation Method |
|---|---|---|---|---|
| Autotaxin (ATX) [60] | 403070 (Aromatic sulfonamide) | Hydrophobic, H-bond acceptors, Aromatic | Ki = 8.4 nM | Enzyme kinetics (competitive), Cell invasion assay |
| MMP-1 [62] | Hypo-1 model-based hits | Hydrogen bond acceptor, Hydrogen bond donor, Ring aromatic | Wide activity range (0.4 nM - 100,000 nM) | Induced fit docking, Test set prediction |
| MMP-8 [62] | Hypo-11 model-based hits | Two Hydrogen bond acceptors, Hydrogen bond donor, Hydrophobic | Wide activity range (0.13 nM - 78,000 nM) | Induced fit docking, Test set prediction |
| MMP-13 [62] | Hypo-21 model-based hits | Hydrogen bond acceptor, Hydrogen bond donor, Ring aromatic | Wide activity range (0.16 nM - 100,000 nM) | Induced fit docking, Test set prediction |
Advanced Applications and Emerging Methodologies
The field of pharmacophore modeling continues to evolve, with several advanced applications and emerging methodologies enhancing its utility in lead optimization campaigns. These innovations address longstanding challenges and expand the scope of pharmacophore-guided drug discovery.
The integration of machine learning and deep learning approaches with traditional pharmacophore methods represents a particularly promising frontier. The recently developed Pharmacophore-Guided deep learning approach for bioactive Molecule Generation (PGMG) uses graph neural networks to encode spatially distributed chemical features and a transformer decoder to generate molecules that match specific pharmacophore constraints [19]. This method introduces latent variables to model the many-to-many mapping between pharmacophores and molecules, significantly improving the diversity and quality of generated compounds while maintaining high levels of validity, uniqueness, and novelty [19]. Such approaches are particularly valuable for exploring uncharted regions of chemical space during lead optimization while ensuring that generated structures maintain the essential features for target binding.
Another significant advancement involves the application of pharmacophore models for drug repurposing and target identification. By reverse-screening compounds against a library of target-specific pharmacophore models, researchers can predict potential new therapeutic applications for existing drugs or clinical candidates [56] [9]. This approach accelerates the drug development process by identifying new indication opportunities for optimized leads, thereby maximizing return on investment for extensive lead optimization campaigns.
Figure 2: Advanced Applications of Pharmacophore Models in Modern Drug Discovery
Successful implementation of pharmacophore-guided lead optimization requires access to specialized software tools, databases, and computational resources. The following table summarizes key resources that support various aspects of pharmacophore modeling and application.
Table 3: Essential Research Reagent Solutions for Pharmacophore-Guided Lead Optimization
| Tool/Resource | Type | Key Functionality | Application in Lead Optimization |
|---|---|---|---|
| Catalyst/HypoGen [62] | Software Module | Pharmacophore hypothesis generation from ligand activity data | Identifies essential features and their optimal spatial arrangement correlating with biological activity |
| Schrödinger Suite [62] | Software Platform | Protein preparation, molecular docking, induced fit docking | Validates pharmacophore models and predicted binding modes of optimized compounds |
| Cerius2 [62] | Software Platform | Library generation and conformational analysis | Generates knowledge-based designed molecules for scaffold hopping |
| Protein Data Bank (PDB) [27] | Database | Repository of 3D protein structures | Source of structural information for structure-based pharmacophore modeling |
| GOSTAR [62] | Database | Comprehensive repository of SAR data and chemical structures | Source of training and test set compounds for ligand-based modeling |
| RDKit [19] | Open-Source Cheminformatics | Chemical feature identification and pharmacophore perception | Identifies chemical features from molecular structures for model building |
| GRID [27] | Software Program | Molecular interaction fields calculation | Detects favorable interaction sites in protein binding pockets |
| LUDI [27] | Software Program | Interaction site prediction and de novo design | Identifies potential interaction sites using geometric rules and statistical distributions |
Pharmacophore-guided lead optimization represents a powerful paradigm in modern drug discovery, enabling rational, structure-based design of therapeutic agents with enhanced potency, selectivity, and drug-like properties. By distilling complex molecular recognition processes into fundamental chemical features and their spatial relationships, pharmacophore models provide medicinal chemists with strategic blueprints for targeted structural modifications. The integration of these conceptual frameworks with experimental SAR data, virtual screening technologies, and emerging machine learning approaches creates a robust methodology for navigating the challenging landscape of lead optimization. As computational power continues to grow and algorithms become increasingly sophisticated, the role of pharmacophore insights in accelerating the development of clinical candidates will undoubtedly expand, offering new opportunities to address unmet medical needs through rational drug design.
The identification of novel anti-cancer agents remains a paramount challenge in modern drug discovery. Within this landscape, natural products have served as an indispensable source of molecular diversity and therapeutic innovation, accounting for a significant proportion of approved anticancer drugs [63] [64]. However, the direct development of natural products into drugs is often hampered by issues such as low potency, chemical instability, poor pharmacokinetics, and high toxicity [63]. To overcome these limitations, the natural-product-inspired strategy has emerged as a powerful paradigm, using natural compounds as templates for optimization [63] [64].
Central to this approach is pharmacophore modeling, an abstract method that identifies the essential steric and electronic features responsible for a molecule's biological activity [22] [65]. This case study explores the practical application of pharmacophore modeling in the discovery and optimization of natural anti-cancer agents. It details how this methodology bridges traditional knowledge and cutting-edge computational techniques to guide the design of novel, effective therapeutics with improved drug-like properties. The integration of these models with advanced methods like water-based pharmacophore mapping and AI-driven generative design is setting new frontiers in the field [19] [22] [35].
Theoretical Foundation: Pharmacophores in Natural Product Drug Discovery
A pharmacophore is defined as the ensemble of steric and electronic features that is necessary to ensure the optimal supramolecular interactions with a specific biological target structure and to trigger (or to block) its biological response [22]. In simpler terms, it is a conceptual blueprint of the key functional groups and their spatial arrangement required for binding to a target, such as a protein receptor or enzyme.
In the context of natural anti-cancer agents, pharmacophore models can be derived through several strategies, which are generally classified into two categories [22]:
- Ligand-based approaches: These methods develop a pharmacophore hypothesis by analyzing and superimposing the structures of several known active natural compounds to identify their common chemical features.
- Structure-based approaches: These methods generate a pharmacophore model directly from the 3D structure of a target protein, often derived from X-ray crystallography or NMR, by analyzing the binding site's characteristics.
The generated pharmacophore models typically encompass several key pharmacophore feature types, which are the fundamental building blocks of the model. The most common features include [19] [22]:
- Hydrogen Bond Acceptors (HBA)
- Hydrogen Bond Donors (HBD)
- Hydrophobic (H) features
- Aromatic rings (AR)
- Positive and Negative Ionizable features
These features are represented in a model as 3D objects (e.g., vectors, spheres, planes) that define their optimal location and orientation in space. The following diagram illustrates the logical workflow of how these feature types are integrated into the drug discovery process for natural anti-cancer agents.
Methodological Framework: Key Experimental Protocols
The application of pharmacophore modeling involves a multi-step computational and experimental workflow. This section details the core methodologies employed in a representative case study targeting the Epidermal Growth Factor Receptor (EGFR) for non-small cell lung cancer (NSCLC) therapy using phytochemicals [66].
Protein Target Preparation and Validation
The initial phase involves preparing the 3D structure of the biological target.
- Procedure: The crystal structure of the mutated EGFR kinase domain (L858R) was obtained from the Protein Data Bank (PDB ID: 2EB3). The structure was prepared by removing heteroatoms (co-crystallized ligand, co-factors, water molecules) and adding hydrogen atoms. Energy minimization was performed using the GROMOS96 force field in SWISS PDB Viewer to stabilize the structure [66].
- Validation: The prepared protein structure's quality and stereochemical accuracy were validated using a Ramachandran plot, generated via the PROCHECK server. The overall model quality was further assessed using the ProSA web tool to calculate a Z-score, ensuring it falls within the range characteristic of native proteins [66].
This step involves assembling a library of natural compounds for screening.
- Procedure: A library of 687 phytoconstituents was curated from four anticancer plants (Camellia sinensis, Curcuma longa, Ginkgo biloba, and Vitis vinifera) using the IMPPAT database. The 3D structures of these compounds were retrieved in SDF format from PubChem and converted to PDB format using PyMOL [66].
- Standard Reference: A control molecule, the known EGFR inhibitor Erlotinib, was also retrieved from PubChem to serve as a benchmark for docking and pharmacophore studies [66].
Pharmacophore Modeling and Virtual Screening
With both target and ligands prepared, the pharmacophore model is built and used for screening.
- Structure-Based Model Generation: A pharmacophore model can be generated directly from the active site of the prepared EGFR protein structure. This involves mapping the key interaction features (HBA, HBD, Hydrophobic) available in the binding pocket [66] [65].
- Virtual Screening: The curated library of natural compounds is screened against the pharmacophore model. Compounds that match the essential features of the model are considered "hits" and selected for further analysis. In the EGFR case study, this process identified kaempferol, morin, and isorhamnetin from Ginkgo biloba as promising candidates [66].
Molecular Docking and Dynamics Simulations
To refine the hits and understand the stability of their interactions, more detailed computational analyses are performed.
- Molecular Docking: The selected hit compounds are docked into the ATP-binding site of the EGFR protein to predict their binding orientation and affinity. Docking studies in the EGFR case revealed high binding energies for kaempferol (-8.5 kcal/mol), morin (-8.5 kcal/mol), and isorhamnetin (-8.7 kcal/mol), which were superior to the reference drug, erlotinib (-7 kcal/mol) [66].
- Molecular Dynamics (MD) Simulations: To assess the stability of the protein-ligand complexes under more realistic conditions, MD simulations are performed. In the EGFR study, a 100-ns simulation using GROMACS confirmed that the complexes with the phytochemicals had lower average RMSD values and better convergence than the EGFR-erlotinib complex, indicating higher complex stability [66].
Advanced Techniques and Emerging Trends
The field of pharmacophore modeling is being revolutionized by the incorporation of more sophisticated physics-based approaches and artificial intelligence.
Water-Based Pharmacophore Modeling
Traditional structure-based pharmacophore models sometimes overlook the critical role of water molecules in the binding site. Water-based pharmacophore modeling is an emerging strategy that leverages the dynamics of explicit water molecules within empty, solvated binding sites to derive pharmacophore features [22].
- Application: A case study targeting the ATP binding sites of Fyn and Lyn kinases used MD simulations of water-filled, ligand-free (apo) protein structures. The trajectories were analyzed to generate dynamic molecular interaction fields (dMIFs), which were converted into pharmacophore features. This ligand-independent strategy can reveal interaction hotspots missed by traditional methods and is particularly useful for targets with few known ligands [22].
AI-Driven Generative Design
A cutting-edge trend involves using pharmacophore constraints to guide artificial intelligence in generating novel drug-like molecules from scratch.
- Application: The Pharmacophore-Guided deep learning approach for bioactive Molecule Generation (PGMG) uses a graph neural network to encode a pharmacophore (represented as a set of spatially distributed chemical features) and a transformer decoder to generate molecules that match this pharmacophore [19]. This approach was successfully used to generate novel molecules with strong docking affinities and high novelty. Another framework utilizes a reinforcement learning model where the reward function is designed to maximize pharmacophoric similarity to reference active molecules while minimizing structural similarity to enhance novelty and patentability [35].
Data Presentation and Analysis
The following tables consolidate quantitative data from the cited case studies to illustrate the outcomes of pharmacophore-driven discovery workflows.
Table 1: Binding Affinities and Pharmacokinetic Properties of Selected Phytochemicals Targeting EGFR (L858R) [66]
| Compound Name | Plant Source | Docking Score (kcal/mol) | GI Absorption | P-gp Inhibition | Hepatotoxicity |
|---|---|---|---|---|---|
| Kaempferol | Ginkgo biloba | -8.5 | High | No | No |
| Morin | Ginkgo biloba | -8.5 | High | No | No |
| Isorhamnetin | Ginkgo biloba | -8.7 | High | No | No |
| Erlotinib (Reference) | Synthetic | -7.0 | High | Yes | No |
Table 2: Performance Comparison of AI-Generated Molecules Using Different Pharmacophore-Guided Reward Functions [35]
| Reward Function Setup | Pharmacophore Similarity (Cosine, ↑) | Structural Novelty (Tanimoto, ↓) | Drug-Likeness (QED, ↑) | Docking Score (↓) | Synthetic Accessibility (SA, ↓) |
|---|---|---|---|---|---|
| Baseline (No Pharmacophore) | 0.58 | 0.34 | 0.30 | -8.64 | 6.28 |
| Setup 1 (Tanimoto + Euclidean) | 0.94 | 0.34 | 0.33 | -6.49 | 4.64 |
| Setup 2 (Tanimoto + Cosine) | 0.83 | 0.36 | 0.59 | -6.71 | 4.72 |
| Setup 3 (MAP4 + Euclidean) | 0.94 | 0.35 | 0.44 | -7.09 | 4.67 |
| Setup 4 (MAP4 + Cosine) | 0.87 | 0.35 | 0.34 | -6.47 | 4.61 |
Table 3: Essential Research Reagents and Computational Tools for Pharmacophore-Based Discovery
| Reagent / Tool Name | Type | Primary Function in Workflow | Example Source / Software |
|---|---|---|---|
| IMPPAT Database | Database | Curates phytochemicals from Indian medicinal plants. | https://cb.imsc.res.in/imppat/ [66] |
| PubChem Database | Database | Provides 2D/3D chemical structures, identifiers, and properties. | https://pubchem.ncbi.nlm.nih.gov [66] |
| Protein Data Bank (PDB) | Database | Repository for 3D structural data of proteins and nucleic acids. | https://www.rcsb.org [66] |
| PyMOL | Software | Molecular visualization and manipulation; used for ligand format conversion. | Open-Source [66] |
| GROMACS | Software | Performs molecular dynamics simulations to assess complex stability. | Open-Source [66] |
| Discovery Studio | Software | Integrated platform for protein preparation, pharmacophore modeling, and docking. | Commercial [66] |
| Amber20 | Software | Suite for molecular dynamics simulations, including force field parameterization. | Commercial [22] |
This case study has demonstrated that pharmacophore modeling is a powerful and versatile framework for advancing the discovery of natural anti-cancer agents. By abstracting key molecular interactions into functional features, it effectively bridges the gap between the complex structures of natural products and the requirements for modern drug candidates. The methodology enables researchers to move beyond simple screening to a more rational design process, facilitating the optimization of natural leads for enhanced efficacy, improved ADMET properties, and greater synthetic accessibility [63] [64].
The continued evolution of this field, particularly through the integration of water-based pharmacophores [22] and AI-driven generative models [19] [35], promises to further accelerate the identification of novel, diverse, and potent anticancer therapeutics inspired by nature's molecular blueprints. As these computational techniques become more sophisticated and integrated with experimental validation, they will undoubtedly play an increasingly central role in overcoming the challenges of cancer drug discovery.
Navigating Challenges: Overcoming Limitations in Pharmacophore Model Development
Addressing Ligand Conformational Flexibility and Identifying Bioactive Conformations
In modern drug discovery, a central challenge is the accurate prediction of a small molecule's bioactive conformation—the precise three-dimensional shape it adopts when bound to its biological target. Ligands are not rigid entities; they possess conformational flexibility, rotating around single bonds to populate an ensemble of different structures in solution. The ability to identify which of these structures is recognized by the protein is critical for rational drug design, as this conformation dictates the molecular interactions responsible for binding affinity and biological activity.
This guide frames the problem of conformational flexibility within the context of pharmacophore feature types. A pharmacophore is an abstract model that defines the steric and electronic features essential for a molecule to interact with a specific biological target. These features include Hydrogen-Bond Acceptors (HBA), Hydrogen-Bond Donors (HBD), hydrophobic (HY) groups, among others. Understanding how these features, with their specific spatial orientations, guide the selection of a single bioactive conformation from a vast pool of possibilities is fundamental to structure-based drug design. This document provides an in-depth technical overview of contemporary computational strategies addressing this challenge, with a focus on advanced deep-learning methodologies.
Core Concepts and Computational Foundations
The Pharmacophore as a Conformational Filter
A pharmacophore hypothesis serves as a powerful constraint for reducing conformational space. It is defined not just by the presence of specific feature types (e.g., HBA, HBD, HY), but also by their three-dimensional arrangement, including distances, angles, and, for features like HBA and HBD, directional components [37] [67]. A conformation is considered "bioactive" if it can spatially satisfy the constraints of the pharmacophore model derived from the target protein's binding site. Traditional computational methods for exploring conformational space include:
- Systematic Search: Incrementally varying torsional angles to map the energy landscape [68].
- Stochastic Search: Randomly generating conformations to broadly sample the energy landscape and avoid local minima [68].
- Molecular Docking: Predicting the binding conformation of a ligand within a protein's binding site by exploring translational, rotational, and torsional degrees of freedom [68].
The Data Foundation: High-Quality Datasets for Machine Learning
The development of robust deep learning models relies on large, high-quality datasets of 3D ligand-pharmacophore pairs. Recent efforts have created specialized datasets to train and benchmark models for conformational generation:
- CpxPhoreSet: Derived from experimental protein-ligand complex structures, this dataset contains real-world, often imperfectly matched, ligand-pharmacophore pairs, reflecting the "induced-fit" effects of binding [37] [67].
- LigPhoreSet: Generated from energetically favorable ligand conformations, this dataset emphasizes chemical and pharmacophore diversity. It contains perfectly matched ligand-pharmacophore pairs, enabling models to learn generalizable mapping patterns across a broad chemical space [37] [67].
Table 1: Key Characteristics of 3D Ligand-Pharmacophore Datasets
| Dataset | Source | Number of Pairs | Key Characteristics | Primary Application |
|---|---|---|---|---|
| CpxPhoreSet | Protein-ligand complexes | 15,012 | Real, biased mapping; average fitness score of 0.967 | Model refinement for real-world, biased scenarios |
| LigPhoreSet | Diverse ligands from ZINC20 | 840,288 | Perfectly-matched pairs; high chemical & feature diversity | Training for generalizable ligand-pharmacophore mapping patterns |
Advanced AI-Driven Methodologies
Deep learning models, particularly diffusion models, have emerged as state-of-the-art solutions for generating accurate bioactive conformations conditioned on pharmacophore constraints.
The DiffPhore Framework: A Knowledge-Guided Diffusion Model
DiffPhore is a pioneering framework designed for "on-the-fly" 3D ligand-pharmacophore mapping (LPM). Its core innovation is integrating explicit pharmacophore matching knowledge directly into a diffusion-based generative process [37] [67].
The DiffPhore framework consists of three integrated modules:
- Knowledge-Guided LPM Encoder: Encodes the ligand conformation and pharmacophore model as a geometric heterogeneous graph. It explicitly incorporates pharmacophore type matching (e.g., determining if a ligand atom can serve as an HBA for a pharmacophore's HBA feature) and pharmacophore direction matching (e.g., calculating the discrepancy between a ligand atom's orientation and a directional pharmacophore feature's vector) [37] [67].
- Diffusion-Based Conformation Generator: Employs a score-based diffusion model, parameterized by an SE(3)-equivariant graph neural network. This module uses the LPM representations to estimate the translation ((\Delta r)), rotation ((\Delta R)), and torsion ((\Delta \theta)) transformations needed to denoise a random initial conformation into one that satisfies the pharmacophore constraints [37] [67].
- Calibrated Conformation Sampler: Adjusts the conformation perturbation strategy during inference to mitigate the exposure bias inherent in iterative denoising processes, thereby enhancing sampling efficiency and robustness [37] [67].
Experimental Protocol for Binding Conformation Prediction
Objective: Generate a ligand's predicted binding conformation based on a target's pharmacophore model. Input: A pharmacophore model (with defined features like HBA, HBD, HY, and exclusion volumes) and a 2D molecular structure of the ligand. Workflow:
- Initialization: The ligand's initial 3D conformation is generated, often with random coordinates or a coarse geometry.
- Iterative Denoising: For a predetermined number of steps (e.g., T=1000), the following is repeated: a. The current ligand conformation graph and pharmacophore graph are fed into the LPM encoder. b. The conformation generator estimates the necessary translational, rotational, and torsional updates. c. The ligand conformation is updated, moving it closer to a low-energy state that matches the pharmacophore.
- Output: The final, refined 3D ligand conformation that maximally maps to the input pharmacophore model.
Figure 1: Workflow of the DiffPhore framework for predicting binding conformations.
Pharmacophore-Conditioned de novo Molecular Generation
Beyond predicting conformations for existing molecules, AI models now generate novel molecular structures directly from pharmacophore hypotheses. The PharmaDiff model exemplifies this approach, using a transformer-based architecture to integrate an atom-based representation of a 3D pharmacophore into a diffusion-based generative process [69]. This allows for the creation of novel, synthetically accessible molecules that are pre-optimized to match the spatial and feature-based constraints of the pharmacophore, a significant advancement for hit identification in the absence of a known ligand [69] [19].
Performance Benchmarking and Validation
The efficacy of these advanced methods is validated through rigorous benchmarking against traditional tools and experimental data.
Table 2: Performance Benchmarking of AI-based Conformational Prediction Methods
| Method | Core Approach | Reported Performance Advantages | Primary Application |
|---|---|---|---|
| DiffPhore [37] [67] | Knowledge-guided diffusion model | Surpassed traditional pharmacophore tools & several advanced docking methods in predicting binding conformations on PDBBind & PoseBusters sets. Superior virtual screening power for lead discovery & target fishing on DUD-E & IFPTarget. | Binding pose prediction, virtual screening |
| PGMG [19] | Pharmacophore-guided deep learning (VAE/Transformer) | Generated molecules with strong docking affinities, high validity, uniqueness, and novelty. Effective in ligand-based & structure-based de novo design. | de novo molecular generation |
| PharmaDiff [69] | Pharmacophore-conditioned diffusion model | Superior performance in matching 3D pharmacophore constraints & achieving higher docking scores vs. other ligand-based design methods. | 3D de novo molecular generation |
Experimental Validation: Case Study on Human Glutaminyl Cyclases
A compelling validation of the DiffPhore framework involved its application in a virtual screening campaign to identify inhibitors for human glutaminyl cyclases, a target for neurodegenerative diseases and cancer immunotherapy [37] [67]. Protocol:
- Pharmacophore Model Development: A structure-based pharmacophore model was created from the target protein.
- Virtual Screening: DiffPhore was used to screen large compound libraries, predicting the binding conformation and fitness of each molecule to the pharmacophore.
- Experimental Testing: Top-ranked compounds were selected for synthesis and experimental validation.
- Crystallographic Confirmation: The binding modes of the identified inhibitors were verified through co-crystallographic studies, which confirmed that the conformations predicted by DiffPhore were consistent with those observed in the experimental complex crystal structures [37] [67]. This provides critical evidence for the model's real-world predictive accuracy.
Successful implementation of these protocols relies on a suite of software tools, databases, and computational resources.
Table 3: Key Research Reagent Solutions for Pharmacophore-Guided Conformation Analysis
| Tool/Resource Name | Type | Primary Function in Research |
|---|---|---|
| AncPhore [37] [67] | Software Tool | Used for pharmacophore perception and generation; instrumental in creating training datasets like CpxPhoreSet and LigPhoreSet. |
| LigandScout [50] | Software Tool | Enables structure-based pharmacophore model development from protein-ligand complexes (e.g., PDB structures) and virtual screening. |
| RDKit [19] | Cheminformatics Library | Open-source toolkit used for fingerprint generation, molecular descriptor calculation, pharmacophore feature identification, and basic conformation generation. |
| ZINC20 [37] [67] [69] | Compound Database | A publicly available database of commercially available compounds, often used as a source for virtual screening libraries. |
| CpxPhoreSet & LigPhoreSet [37] [67] | Benchmark Datasets | High-quality datasets for training and evaluating machine learning models for pharmacophore-related tasks. |
| PDBBind [37] [67] | Benchmark Database | Curated database of protein-ligand complexes with binding affinity data, used for testing binding mode prediction accuracy. |
| DUD-E [37] [67] | Benchmark Database | Database of useful decoys for benchmarking virtual screening methods and evaluating enrichment. |
The accurate identification of bioactive conformations is a cornerstone of computational drug discovery. While traditional methods like docking provide a foundation, the field is rapidly advancing through the integration of deep learning. Frameworks like DiffPhore and PharmaDiff, which leverage knowledge-guided diffusion models, represent a paradigm shift. By directly incorporating pharmacophore feature constraints—including critical type and direction matching for features like hydrogen bond donors and acceptors—into the generative process, these models demonstrate superior performance in predicting binding conformations and generating novel active molecules. The continued development of high-quality datasets and robust, explainable AI models promises to further solidify the role of pharmacophore-guided approaches in accelerating the discovery of new therapeutics.
Managing Structural Diversity in Ligand Sets and Multiple Binding Modes
The paradigm of protein-ligand binding has evolved significantly from the rigid "lock-and-key" model to a dynamic process where proteins exist as ensembles of conformational substates [70]. This fundamental understanding explains how proteins with pronounced binding specificity can simultaneously accommodate ligands of diverse shapes, sizes, and composition at a single site [70]. The phenomenon of multiple binding modes—where similar ligands occupy different orientations in a binding site, or dissimilar ligands bind at the same site—presents both challenges and opportunities in drug discovery.
Managing this structural diversity is particularly crucial in pharmacophore research, which abstracts essential chemical interactions between ligands and their biological targets. The binding site's shape and size are not fixed independent entities but are defined by the ligand itself during the binding process [70]. This dynamic equilibrium with populations of pre-existing conformers means that if the library of ligands in solution is large enough, favorably matching ligands with altered shapes and sizes can bind, causing a redistribution of the protein populations [70]. This technical guide explores the computational and experimental frameworks for navigating this complexity, with particular emphasis on implications for pharmacophore feature analysis including hydrogen bond acceptors, donors, and hydrophobic interactions.
Theoretical Foundations: Protein Flexibility and Ligand Binding
The Conformational Ensemble Model
Proteins, whether specific or nonspecific, exist in equilibrium ensembles of substates separated by low-energy barriers [70]. This dynamic state enables binding sites to present a range of shapes to incoming ligands. The conformational selection process involves:
- Hinge-bending motions that expand or contract the binding site, yielding different sizes and shapes
- Side-chain movements that invariably accompany all protein binding processes
- Population shifts where binding to given ligands redistributes the equilibrium in favor of complementary conformers [70]
This model explains how presumably specific binding molecules can bind multiple ligands, especially when the ligand library is extensive and contains well-fitting molecules [70].
Implications for Pharmacophore Modeling
The dynamic nature of binding has profound implications for pharmacophore models, which represent spatial arrangements of molecular features essential for biological activity. Traditional pharmacophore types include:
- Classical pharmacophores: Traditional representations of a molecule's active features as three-dimensional arrangements of hydrogen bond acceptors (HA), hydrogen bond donors (HD), and hydrophobic centers (HY) [42]
- Structure-based pharmacophores: Derived from detailed structural information of a target protein, often from X-ray crystallography or NMR [42] [43]
- Ligand-based pharmacophores: Developed from known active compounds without detailed target structural information [42]
- Quantitative pharmacophore models: Incorporate quantitative relationships between pharmacophoric features and biological activity [42]
Table 1: Core Pharmacophore Feature Types and Their Characteristics
| Feature Type | Chemical Group Examples | Interaction Type | Directionality |
|---|---|---|---|
| Hydrogen Bond Acceptor (HA) | Carbonyl, ether, hydroxyl | Electrostatic | High |
| Hydrogen Bond Donor (HD) | Amine, amide, hydroxyl | Electrostatic | High |
| Hydrophobic (HY) | Alkyl, aromatic rings | Entropic (van der Waals) | Low |
| Positively Charged (PC) | Quaternary ammonium | Ionic | Medium |
| Negatively Charged (NC) | Carboxylate, phosphate | Ionic | Medium |
| Aromatic (AR) | Phenyl, fused rings | Cation-π, π-π stacking | Medium |
Computational Approaches and Methodologies
Advanced Algorithms for Handling Multiple Binding Modes
Modern computational methods have evolved to explicitly address protein flexibility and diverse ligand binding. The iterative linear interaction energy (LIE) method represents one approach that automatically calculates relative weights of various binding poses, making initial pose selection less crucial for simulations [71]. This method has demonstrated success in challenging targets with large, flexible binding sites, such as cytochrome P450s, achieving a root mean-square error of 2.9 kJ/mol for a set of 12 compounds binding to CYP 2C9 [71].
For pharmacophore-based approaches, protein-based pharmacophore generation creates models directly from protein binding sites without ligand information, avoiding bias from known actives [43]. The methodology involves:
- Placing a 3D grid with 0.4 Å spacing in the binding site
- Computing interaction potentials between protein atoms and molecular probes
- Generating pharmacophore elements via k-means clustering of favorable interaction points [43]
Key parameters that must be optimized include the cluster distance cutoff (typically 1.0-3.0 Å) and the interaction range for pharmacophore generation (IRFPG), which defines minimum and maximum distance cutoffs for different interaction types [43].
AI-Enabled Pharmacophore Mapping
Recent advances in artificial intelligence have produced sophisticated tools like DiffPhore, a knowledge-guided diffusion framework for 3D ligand-pharmacophore mapping [37]. This approach utilizes:
- Ligand-pharmacophore matching knowledge to guide conformation generation
- Calibrated sampling to mitigate exposure bias in iterative conformation search
- SE(3)-equivariant graph neural networks to process geometric features of ligand conformations and pharmacophores [37]
DiffPhore's performance surpasses traditional pharmacophore tools and several advanced docking methods in predicting binding conformations, demonstrating the power of AI-enabled approaches for handling structural diversity [37].
Table 2: Performance Comparison of Methods Handling Multiple Binding Modes
| Method | Approach Type | Key Advantage | Reported Performance |
|---|---|---|---|
| Iterative LIE [71] | Molecular dynamics/Free energy calculations | Automatic weighting of multiple poses | RMSE of 2.9 kJ/mol for CYP 2C9 ligands |
| Protein-Based Pharmacophores [43] | Structure-based pharmacophore | No ligand bias | Success varies with clustering parameters |
| DiffPhore [37] | AI-guided diffusion model | Handles sparse pharmacophore features | State-of-the-art in binding conformation prediction |
| Consensus Pharmacophore (ConPhar) [34] | Multi-ligand feature analysis | Reduced model bias | Successfully applied to SARS-CoV-2 Mpro |
Managing Structural Redundancy in Datasets
The Protein Data Bank (PDB) contains significant redundancy in protein-ligand complexes, which can introduce bias in computational studies. Quantitative analysis reveals that heme is the most represented ligand (7.9% of complexes), followed by nucleobase derivatives like ATP, NAD, and FMN [72]. Proper clustering based on binding site superposition—combining weighted RMSD assessment and hierarchical clustering—can decrease dataset size by 3.84-fold while maintaining structural diversity [72].
Experimental Protocols and Techniques
Experimental Measurement of Binding Kinetics
Quantifying ligand-protein interactions is critical for understanding biological processes and drug screening. While conventional methods like surface plasmon resonance (SPR) have sensitivities that scale with molecular weights, making small molecule detection challenging, innovative approaches like self-assembled Nano-oscillators provide molecular weight-independent sensitivity [73].
The Nano-oscillator experimental protocol involves:
Fabrication:
- Synthesize 245 nm double-stranded DNA linkers with thiol and biotin terminals
- Prepare gold surface by annealing with hydrogen flame to remove contaminants
- Assemble DNA linkers and MT(PEG)₄ spacers (1:6000 ratio) on gold surface overnight
- Incubate with streptavidin-coated silica particles (540 nm or 5 μm) for 30 minutes
- Modify with target proteins (e.g., biotinylated BSA or KcsA-Kv1.3 Nanodisc) [73]
Measurement:
- Apply oscillating electric field normal to surface using three-electrode electrochemical setup
- Track oscillation amplitude via plasmonic imaging with 680 nm SLED light source
- Record SPR images at 106.5 frames per second
- Determine particle-surface distance from image intensity with ~1 nm precision [73]
Data Processing:
- Select region of interest (ROI) for each Nano-oscillator
- Subtract background from reference region
- Perform fast Fourier transform on oscillation time trace
- Correlate amplitude changes with binding events [73]
This technique enables quantification of binding kinetics for both large and small molecules by detecting charge changes upon ligand binding, rather than relying solely on mass changes.
Protein-Based Pharmacophore Generation Protocol
For generating protein-based pharmacophore models without ligand bias:
Grid Generation:
- Place 3D grid with 0.4 Å spacing in the binding site
- Compute interaction potentials using ChemScore-based scoring functions [43]
Pharmacophore Element Identification:
- Hydrophobic pharmacophores: Apply k-means clustering over grid points with favorable hydrophobic scores
- Hydrogen-bond pharmacophores: Group grid points associated with the same protein functional group, then apply k-means clustering
- Aromatic and ionic pharmacophores: Use similar functional group-specific clustering [43]
Parameter Optimization:
- Test cluster distance cutoffs (1.0, 1.5, 2.0, 2.5, 3.0 Å)
- Optimize interaction range for pharmacophore generation (IRFPG) for different interaction types
- Generate exclusion volumes using grid points closer than 2 Å to protein heavy atoms [43]
This protocol produces pharmacophore models that can be used for virtual screening, pose prediction, and understanding multiple binding modes.
Diagram 1: Protein-based pharmacophore generation workflow
The Scientist's Toolkit: Essential Research Reagents and Materials
Table 3: Key Research Reagents for Studying Multiple Binding Modes
| Reagent/Material | Function/Application | Example Use Case |
|---|---|---|
| Double-stranded DNA linkers (245 nm) [73] | Tethering nanoparticles in Nano-oscillators | Creating precise mechanical tethers for binding studies |
| Streptavidin-coated silica particles [73] | Nano-oscillator sensing elements | Transducing binding events to measurable signals |
| Biotinylated Nanodiscs [73] | Membrane protein stabilization | Studying ligand binding to membrane proteins in lipid environment |
| MT(PEG)₄ spacers [73] | Controlling surface density | Preventing non-specific interactions on biosensor surfaces |
| Pharmocophore feature probes [43] | Mapping interaction potentials | Identifying hydrogen bond, hydrophobic, and ionic features |
| Crystallization screening kits | Protein-ligand co-crystallization | Obtaining structural data for diverse ligand complexes |
Case Studies and Applications
SARS-CoV-2 Main Protease (Mpro) Consensus Pharmacophore
A recent case study on SARS-CoV-2 Mpro demonstrates the power of consensus pharmacophore models derived from extensive ligand libraries. Using ConPhar, researchers generated a pharmacophore model from one hundred non-covalent inhibitors co-crystallized with the target [34]. This approach:
- Captured key interaction features in the catalytic region
- Reduced model bias from individual ligand structures
- Enabled identification of new potential ligands through virtual screening [34]
The methodology is broadly applicable to any biological target with multiple ligand-bound conformations available, particularly valuable for targets with extensive ligand datasets.
Plasmepsin II and Tissue Factor: Structural Evidence
Structural studies provide direct evidence for conformational diversity in binding sites. In plasmepsin II, two independent proteins in the same crystallographic asymmetry unit displayed different domain displacements, even when complexed with the same inhibitor (pepstatin A) [70]. Similarly, tissue factor exhibits hinge rotation of 12.7° between domains in two molecules within the same asymmetric unit [70]. These observations demonstrate that proteins can pre-exist in dynamic equilibrium between multiple states, with different conformers capable of binding the same or different ligands.
Managing structural diversity in ligand sets and multiple binding modes requires both conceptual and technical advances. The recognition that proteins exist as dynamic ensembles fundamentally changes our approach to pharmacophore modeling and drug design [70]. Rather than seeking a single "correct" binding mode, successful strategies must account for:
- The population distribution of protein conformers
- Ligand-dependent selection of complementary conformations
- The potential for multiple productive binding orientations
Future directions in the field include increased integration of AI-guided methods like DiffPhore [37], development of experimental techniques with enhanced sensitivity for small molecules [73], and creation of standardized non-redundant datasets for benchmarking [72]. These advances will enable researchers to more effectively navigate the complexity of protein-ligand interactions, ultimately accelerating the discovery of novel therapeutics with optimized binding properties.
Diagram 2: Workflow for handling multiple binding modes in drug discovery
Accounting for Protein Flexibility and Induced-Fit Effects
In structure-based drug design, the historical "lock-and-key" model has been superseded by the understanding that proteins are dynamic entities. The processes of induced fit, where ligand binding influences protein conformation, and conformational selection, where the ligand selects a binding partner from an existing ensemble of states, are fundamental to molecular recognition [74]. Accounting for this protein flexibility is not merely an academic exercise; it is a critical, practical necessity for accurate prediction of binding modes and affinities. Failure to do so, by relying on a single rigid receptor structure, introduces a significant bottleneck. Traditional rigid docking methods typically show best performance rates between only 50 and 75%, a figure that can be enhanced to 80–95% with the incorporation of fully flexible docking methods [74]. This guide details the core principles and advanced methodologies for integrating protein flexibility and induced-fit effects into pharmacophore-based research, providing a technical roadmap for researchers and drug development professionals.
The Critical Need for Modeling Flexibility
The Limitations of Rigid Receptor Docking
The central challenge in static docking is the cross-docking problem. When attempting to dock a ligand into a protein structure solved with a different ligand, the active site is often biased toward the original, native ligand [74]. This bias manifests as movements in the backbone, side chains, and active site metals, leading to misdocking that cannot be overcome without accounting for these critical conformational shifts. Research has demonstrated that scoring functions themselves are negatively impacted by protein flexibility and solvation, and scoring failures often peak at root-mean-square deviation (RMSD) values between 1.5 and 2.0 Å, precisely the range where pose prediction is most sensitive [74].
The Impact on Pharmacophore Modeling
Protein flexibility directly influences the abstraction of pharmacophore features. A pharmacophore, defined as the "ensemble of steric and electronic features that is necessary to ensure the optimal supramolecular interactions with a specific biological target," is an abstract concept representing common molecular interaction capacities [2] [1]. If the protein conformation used to generate a structure-based pharmacophore model does not represent the relevant biological state, the derived features—such as hydrogen bond acceptors/donors, hydrophobic centroids, and aromatic rings—will be inaccurate [43] [1]. This compromises the model's utility in virtual screening and de novo design, as it may fail to identify true actives or incorrectly prioritize compounds.
Computational Methodologies for Incorporating Flexibility
A spectrum of computational strategies exists to model protein flexibility, ranging from techniques that approximate flexibility to those that explicitly simulate it.
Soft Docking and Side-Chain Flexibility
Early approaches to flexibility included "soft docking," which uses softened interaction potentials to allow for minor steric clashes, implicitly accommodating small conformational changes. More advanced methods explicitly sample side-chain flexibility, often using rotamer libraries. While these techniques handle small-scale adjustments, they are generally insufficient for large conformational changes or backbone movements.
Induced Fit Docking (IFD) and Advanced Sampling
Induced Fit Docking (IFD) protocols represent a significant step forward by iteratively adjusting the receptor conformation in response to the ligand.
Schrödinger's IFD-MD Workflow is a leading example that integrates multiple steps for robust pose prediction [75]:
- Initial Pose Generation: Utilizes pharmacophore docking (Phase) to generate initial ligand poses.
- Structure Refinement: Employs Prime for protein structure refinement around the posed ligand.
- Re-docking: The refined structures are re-docked with Glide.
- Solvation Analysis: Hydration sites are estimated using WaterMap to inform water placement.
- Pose Stability Assessment: The stability of ligand poses is finally assessed using metadynamics (MtD) simulations and scoring.
This workflow is computationally more efficient than brute-force molecular dynamics and has been shown to reproduce key features of crystal structures with 90% or better success in test cases, significantly outperforming rigid receptor docking (GlideSP) and the original IFD method [75]. The following diagram illustrates the logical sequence of this integrated process.
Ensemble Docking and Molecular Dynamics
Ensemble Docking involves docking against a collection of protein conformations, which can be derived from multiple crystal structures, NMR models, or molecular dynamics (MD) simulations. This approach leverages the concept of conformational selection, allowing the ligand to choose its preferred state from a pre-generated ensemble.
Molecular Dynamics (MD) Simulations provide the most explicit representation of flexibility by simulating the physical movements of all atoms over time. While brute-force MD is computationally expensive and often impractical for high-throughput applications, shorter MD simulations are invaluable for refining docked poses and validating the stability of predicted complexes, as seen in the IFD-MD workflow and other binding mode studies [75] [18] [76].
Integrating Flexibility into Pharmacophore Modeling
Protein flexibility can be directly incorporated into pharmacophore generation. Structure-based pharmacophore (SBP) models can be built from individual protein-ligand complexes and then combined to create a shared feature pharmacophore (SFP) model that captures essential interactions across multiple states [18]. For instance, a study on estrogen receptor beta (ESR2) mutants created an SFP model from three mutant structures, consolidating key features like hydrogen bond donors, acceptors, and hydrophobic regions into a unified query for virtual screening [18].
Furthermore, protein-based pharmacophore models derived solely from the protein binding site offer an unbiased approach. The generation process can be optimized by using known protein-ligand contacts from experimental structures to ensure the model accurately reproduces critical interactions [43]. The O-LAP algorithm introduces a shape-focused approach, generating cavity-filling models by clustering atoms from flexibly docked active ligands, creating a negative image of the binding site that accounts for its malleable geometry [77].
Table 1: Performance Comparison of Docking Methodologies
| Methodology | Description | Typical Pose Prediction Success Rate | Key Advantages | Key Limitations |
|---|---|---|---|---|
| Rigid Receptor Docking | Docks flexible ligand into a single static protein structure. | 50-75% [74] | Computationally fast, simple to implement. | Fails when binding induces conformational change. |
| Induced Fit Docking (IFD-MD) | Iteratively refines protein side-chains and ligand pose, assesses stability with MD. | ~90% or better [75] | High accuracy, handles side-chain and limited backbone movement, reliable for SBDD. | More computationally intensive than rigid docking. |
| Ensemble Docking | Docks against a collection of pre-generated protein conformations. | Varies with ensemble quality; generally higher than rigid docking. | Accounts for conformational selection, uses existing structural data. | Quality depends on the representativeness of the ensemble. |
Experimental Protocols and Applications
Protocol: Structure-Based Shared Feature Pharmacophore Modeling
This protocol is adapted from studies on targets like ESR2, where generating a consensus model from multiple structures improves feature relevance [18].
Objective: To create a unified pharmacophore model from several protein-ligand complex structures that accounts for conformational variability.
Materials & Software:
- Software: LigandScout or equivalent structure-based pharmacophore modeling software.
- Structural Data: Multiple high-resolution protein-ligand complex structures (e.g., from PDB) relevant to the target, including apo and holo forms if possible.
Methodology:
- Structure Preparation: For each protein-ligand complex, add hydrogen atoms and optimize hydrogen bonding networks using standard protein preparation tools.
- Individual Pharmacophore Generation: For each complex, use the structure-based pharmacophore module to generate an individual pharmacophore. This process automatically identifies key interaction features (hydrogen bond donors/HBD, acceptors/HBA, hydrophobic/HPho, aromatic/Ar) from the protein-ligand contacts.
- Feature Alignment and Comparison: Load the individual pharmacophore models into the alignment function of the software. The algorithm will superimpose the models based on protein structure or pharmacophore feature overlap.
- Shared Feature Pharmacophore (SFP) Generation: Combine the aligned individual models to generate a consensus SFP model. This model retains only the pharmacophore features that are common or spatially consistent across the multiple input structures.
- Validation: Validate the SFP model by screening a library of known actives and decoys. The model should prioritize active compounds, demonstrating its utility for virtual screening.
Protocol: Protein-Based Pharmacophore Optimization Using Native Contacts
This protocol, based on the work of Zhu et al., uses experimental data to optimize the generation of protein-based pharmacophores for accurate pose prediction [43].
Objective: To optimize parameters for generating a protein-based pharmacophore model so that it best reproduces the native contacts observed in experimentally determined structures.
Materials & Software:
- Software: A protein-based pharmacophore generation tool capable of using Molecular Interaction Fields (MIFs).
- Dataset: A curated set of experimentally determined protein-ligand complexes with known binding modes (e.g., the PDBbind "core set").
Methodology:
- Dataset Curation: Select a non-redundant set of protein-ligand complexes. For each complex, define the "native contacts" (e.g., hydrogen bonds, hydrophobic interactions) between the protein and the ligand.
- Pharmacophore Generation with Variable Parameters: For each protein structure (with the ligand removed), generate protein-based pharmacophore models using MIFs. Systematically vary key generation parameters, such as:
- Cluster Distance Cutoff: The minimum distance between pharmacophore element centers (e.g., test 1.0 Å, 1.5 Å, 2.0 Å, etc.).
- Interaction Range for Pharmacophore Generation (IRFPG): The allowed distance range for favorable interactions between protein atoms and probes.
- Contact Coverage Analysis: For each generated pharmacophore model, calculate the fraction of native contacts (from Step 1) that are covered by a pharmacophore element.
- Parameter Optimization: Identify the set of parameters that yields pharmacophore models with the highest native contact coverage across the entire dataset.
- Pose Prediction and Ranking: Use the optimized pharmacophore models for ligand pose prediction by fitting ligand atoms to the pharmacophore features. Rank the generated poses based on their fit to the pharmacophore model.
Application in Drug Discovery: Venetoclax and Bcl-2
The analysis of the cancer drug venetoclax and its target Bcl-2 provides a compelling real-world example. PLIP (Protein-Ligand Interaction Profiler) analysis revealed that venetoclax binds to Bcl-2 at the same interface as the native protein BAX, with critical overlap in interaction profiles. Key residues like Phe104, Tyr108, Asn143, and Trp144 are common to both the protein-protein interaction (PPI) and the drug-protein interaction [78]. Venetoclax effectively mimics the native PPI by engaging in a similar network of hydrophobic interactions and hydrogen bonds within the hydrophobic groove of Bcl-2. This case illustrates how comparing interaction patterns from flexible complexes can provide insights into the mechanism of action of drugs that target PPIs [78].
The Scientist's Toolkit: Essential Research Reagents and Software
Table 2: Key Software Tools for Modeling Flexibility and Pharmacophores
| Tool Name | Category | Primary Function in Flexibility/Pharmacophore Research | Application Context |
|---|---|---|---|
| PLIP [78] | Interaction Analysis | Automatically detects and classifies non-covalent interactions (H-bonds, hydrophobic contacts, etc.) in protein structures. | Profiling interactions in static structures or MD trajectories; comparing PPI and PLI. |
| LigandScout [18] | Pharmacophore Modeling | Creates structure-based and ligand-based pharmacophore models; performs virtual screening. | Generating shared feature pharmacophores (SFP) from multiple protein complexes. |
| Schrödinger Suite (IFD-MD) [75] | Integrated Drug Design | Provides a workflow (Phase, Glide, Prime, MD) for Induced Fit Docking and pose stability assessment. | Predicting accurate ligand binding poses when significant side-chain movement is expected. |
| PLANTS [77] | Molecular Docking | Flexible ligand docking software used for generating initial poses for pharmacophore model building. | Creating input poses for shape-focused pharmacophore tools like O-LAP. |
| O-LAP [77] | Pharmacophore Modeling | Generates shape-focused pharmacophore models by clustering atoms from docked active ligands. | Creating negative image-based models for docking rescoring or rigid docking. |
| ZINCPharmer [18] | Virtual Screening | Online database and tool for pharmacophore-based screening of compound libraries. | Rapid virtual screening using a generated pharmacophore query. |
Accounting for protein flexibility and induced-fit effects is no longer a niche consideration but a central requirement for robust structure-based drug design. As computational power increases and methods mature, the integration of techniques like IFD-MD, ensemble docking, and dynamic pharmacophore modeling is becoming more accessible. The continued development of tools like PLIP for interaction profiling and O-LAP for shape-based modeling demonstrates a trend towards more sophisticated, physically realistic, and data-driven approaches. By systematically applying the protocols and methodologies outlined in this guide—from generating shared feature pharmacophores to employing advanced induced fit workflows—researchers can significantly improve the accuracy of binding mode predictions, enhance the quality of virtual screening hits, and ultimately accelerate the discovery of novel therapeutics.
Balancing Model Specificity and Sensitivity in Virtual Screening
In the field of computer-aided drug discovery, virtual screening serves as a fundamental technique for identifying potential hit compounds from extensive chemical libraries. The effectiveness of virtual screening campaigns depends significantly on the careful balance between two pivotal performance metrics: sensitivity, the model's ability to correctly identify active compounds (true positives), and specificity, its capacity to exclude inactive compounds (true negatives) [47] [79]. This balance is particularly crucial in pharmacophore-based virtual screening, where abstract representations of molecular interactions—such as hydrogen bond acceptors (HBA), hydrogen bond donors (HBD), and hydrophobic (H) features—guide the selection process [27] [47].
The pursuit of optimal sensitivity and specificity presents a significant trade-off. Overly sensitive models may increase false positives, unnecessarily expanding experimental validation costs, while excessively specific models may discard valuable hits, potentially overlooking promising chemotypes [47]. Within the context of pharmacophore feature research, this balance directly influences the success of identifying compounds with desired bioactivity while maintaining scaffold diversity and drug-like properties. This technical guide examines established and emerging strategies for achieving this critical equilibrium, providing detailed methodologies and metrics relevant to researchers and drug development professionals.
Core Concepts and Metrics
Fundamental Definitions and Computational Representation
In virtual screening, sensitivity and specificity quantify a model's discriminatory power. Sensitivity (or recall) measures the proportion of actual active compounds correctly identified by the model, while specificity measures the proportion of actual inactive compounds correctly rejected [47] [79]. These metrics are derived from the following relationships:
- Sensitivity = True Positives / (True Positives + False Negatives)
- Specificity = True Negatives / (True Negatives + False Positives)
Pharmacophore models represent steric and electronic features necessary for optimal supramolecular interactions with a specific biological target [27] [47]. The most relevant pharmacophore feature types include:
- Hydrogen Bond Acceptors (HBA): Atoms that can accept hydrogen bonds
- Hydrogen Bond Donors (HBD): Atoms that can donate hydrogen bonds
- Hydrophobic Areas (H): Non-polar regions favoring lipid environments
- Positively/Negatively Ionizable Groups (PI/NI): Groups that can become charged
- Aromatic Rings (AR): Electron-rich π-systems
- Exclusion Volumes (XVOL): Steric constraints representing forbidden areas [27]
These features are typically represented as geometric entities (spheres, vectors, planes) in three-dimensional space, defining the spatial and electronic requirements for molecular recognition [27] [80].
Quantitative Assessment Metrics
Table 1: Key Metrics for Evaluating Virtual Screening Performance
| Metric | Calculation | Interpretation | Optimal Range |
|---|---|---|---|
| Enrichment Factor (EF) | (Hitssampled / Nsampled) / (Hitstotal / Ntotal) | Measures early recognition capability | >1 (higher preferred) [47] |
| Area Under ROC Curve (AUC) | Area under receiver operating characteristic curve | Overall discrimination ability | 0.5 (random) - 1.0 (perfect) [47] |
| Yield of Actives | (Hitssampled / Nsampled) × 100 | Percentage of actives in hit list | Variable by project [47] |
| Goodness of Hit Score (GH) | [(3Ha + Ht) / 4] × Ya × (1 - (Na - Ha) / (N - Ht)) | Composite metric balancing different factors | 0 (null) - 1 (ideal) [6] |
The receiver operating characteristic (ROC) curve plots the true positive rate (sensitivity) against the false positive rate (1-specificity) across all classification thresholds [47]. The area under this curve (AUC) provides a single measure of overall performance, with values approaching 1.0 indicating excellent discrimination [47]. For example, in a recent virtual screening study, the RosettaGenFF-VS method achieved an enrichment factor of 16.72 in the top 1%, significantly outperforming other methods [54].
Strategic Approaches to Balance Specificity and Sensitivity
Pharmacophore Feature Optimization
The selection and configuration of pharmacophore features directly influence the sensitivity-specificity balance. Feature redundancy reduction is a crucial first step—initially generated structure-based pharmacophore models often contain excessive features that should be refined to include only those essential for bioactivity [27]. This process may involve removing features that don't strongly contribute to binding energy, identifying conserved interactions across multiple protein-ligand complexes, or incorporating spatial constraints from receptor information [27].
Feature weighting and optional features provide nuanced control over stringency. Most pharmacophore modeling software allows assigning weights to different features based on their predicted importance to binding [47]. Additionally, designating certain features as "optional" rather than "mandatory" increases sensitivity for promising scaffolds that match most but not all features, particularly valuable in scaffold-hopping campaigns [47]. The spatial tolerances of pharmacophore features (sphere radii) also offer adjustment capabilities—increasing radii enhances sensitivity but reduces specificity, while decreasing radii has the opposite effect [80].
Data Curation and Model Validation
The quality of training data fundamentally limits model performance. Active compound selection should include only molecules with experimentally confirmed direct target engagement (e.g., receptor binding or enzyme activity assays) rather than cell-based assays where off-target effects may influence results [47]. Appropriate activity cutoffs must be defined to exclude compounds with weak binding affinity, and structurally diverse actives should be included to capture the essential pharmacophore pattern [47].
Careful decoy set construction is equally critical for realistic specificity assessment. Decoys (assumed inactives) should have similar physicochemical properties (molecular weight, logP, hydrogen bond donors/acceptors) but different 2D topologies compared to known actives [47]. Public resources like the Directory of Useful Decoys, Enhanced (DUD-E) provide optimized decoy sets tailored to specific targets [47]. The recommended ratio is approximately 1:50 active molecules to decoys, reflecting the proportion typically encountered in prospective screening [47].
Integration with Complementary Methods
Hierarchical screening protocols effectively balance computational efficiency with screening power. A common approach employs rapid ligand-based pharmacophore screening as an initial filter (maximizing sensitivity), followed by more computationally intensive structure-based methods like molecular docking to refine hits (enhancing specificity) [6] [20]. This sequential strategy leverages the complementary strengths of different virtual screening approaches.
Shape-based filtering incorporates steric complementarity as an additional constraint. The Pharmit server allows users to define inclusive shape constraints (based on ligand surface) and exclusive shape constraints (based on receptor surface) to ensure retrieved molecules both fit the pharmacophore and are sterically compatible with the binding site [80]. The order of operations—pharmacophore search followed by shape filter versus shape search followed by pharmacophore filter—can be adjusted based on screening priorities [80].
Table 2: Experimental Protocols for Model Optimization
| Protocol | Key Steps | Impact on Sensitivity/Specificity |
|---|---|---|
| Threshold Optimization (RO/BO) | 1. Train regression/classification model2. Optimize threshold to minimize sensitivity-specificity difference3. Apply optimized threshold for classification | Maximizes balance; RO method showed 145.74% sensitivity improvement over baseline models [79] |
| Hierarchical Screening | 1. Rapid pharmacophore screening (high sensitivity)2. Molecular docking refinement (high specificity)3. ADMET filtering | Balanced approach; enables efficient screening of billion-compound libraries [54] |
| Active Learning Integration | 1. Initial docking of diverse subset2. Train target-specific neural network on results3. Iteratively select promising compounds for further docking | Enhances both metrics; enables screening of 1.7B compounds in <7 days [54] [81] |
Experimental Protocols and Workflows
Structure-Based Pharmacophore Modeling
Protein Structure Preparation begins with retrieving a high-quality 3D structure from the Protein Data Bank or generating one through homology modeling or ALPHAFOLD2 [27]. Critical preparation steps include: adding hydrogen atoms, optimizing residue protonation states, correcting missing atoms/residues, and evaluating overall structural quality [27]. Binding Site Detection utilizes tools like GRID or LUDI to identify potential ligand binding pockets based on evolutionary, geometric, energetic, or statistical properties [27].
Pharmacophore Feature Generation involves analyzing interactions between the binding site residues and a known ligand (if available). When a protein-ligand complex structure is available, the ligand's bioactive conformation directly guides feature identification and spatial arrangement [27]. In the absence of a bound ligand, all possible interaction points in the binding site are detected, though this typically produces less accurate models requiring manual refinement [27]. Feature Selection refines the initial feature set by removing redundant features, prioritizing those with known catalytic importance, and adding exclusion volumes to represent binding site boundaries [27] [6].
Ligand-Based Pharmacophore Modeling
Training Set Compilation requires multiple known active compounds with diverse scaffolds but common mechanisms of action [27] [47]. Conformational Analysis generates representative low-energy conformations for each training molecule using tools like the Generate Conformations protocol in Discovery Studio [6]. Common Feature Identification aligns the training set molecules and identifies 3D arrangements of chemical features shared across active compounds [27] [47]. Model Validation assesses the quality of the preliminary model using known active and inactive compounds, with refinement through feature addition/removal, spatial tolerance adjustment, and weighting modification [47] [6].
Virtual Screening Implementation
Database Preparation involves compiling compounds from commercial or public sources like ZINC, ChEMBL, or PubChem [6] [20]. Pharmacophore Screening uses the validated model as a 3D query to search the database, with molecules matching the feature arrangement retained as hits [27] [80]. Post-Screening Filtering applies additional criteria like Lipinski's Rule of Five, physicochemical property thresholds, or ADMET predictions to further refine hits [6] [80]. Experimental Validation ultimately tests selected compounds in biological assays to confirm activity, completing the screening cycle [47] [81].
Virtual Screening Workflow with Optimization Cycle
Case Studies and Applications
Protein Target: XIAP Inhibitor Discovery
A structure-based pharmacophore model targeting the X-linked inhibitor of apoptosis protein (XIAP) identified critical features for inhibitor binding: four hydrophobic features, one positive ionizable, three hydrogen bond acceptors, and five hydrogen bond donors [20]. Model validation demonstrated exceptional performance with an AUC of 0.98 and enrichment factor of 10.0 at the 1% threshold, indicating strong ability to distinguish true actives from decoys [20]. Virtual screening of natural product databases followed by molecular docking and ADMET filtering identified three promising leads with stable binding modes in molecular dynamics simulations [20]. This case highlights how well-balanced pharmacophore models can identify novel chemotypes from natural sources with potential reduced toxicity compared to synthetic inhibitors.
Protein Target: Akt2 Inhibitor Development
In a campaign to discover novel Akt2 inhibitors with diverse scaffolds, researchers developed both structure-based and 3D-QSAR pharmacophore models [6]. The structure-based model contained two hydrogen bond acceptors, one hydrogen bond donor, and four hydrophobic features, complemented by exclusion volumes representing binding site constraints [6]. Using both models as parallel filters for virtual screening ensured identification of compounds with both complementary binding interactions and strong structure-activity relationships [6]. Subsequent drug-likeness filtering and ADMET assessment yielded seven promising hits with diverse scaffolds, demonstrating the value of combined approaches for maintaining chemical diversity while ensuring target affinity [6].
Impact of Library Size on Screening Performance
Recent research has quantitatively demonstrated how library size impacts screening outcomes. In a direct comparison screening AmpC β-lactamase, a 1.7 billion molecule library yielded a two-fold higher hit rate compared to a 99 million molecule library [81]. The larger screen also discovered more novel scaffolds and produced compounds with improved potency [81]. This study confirmed that as docking scores improve, hit rates and affinities show corresponding improvements, validating the fundamental premise that larger libraries contain better ligands [81]. However, the study also highlighted that testing only dozens of molecules—common practice in many screening campaigns—produces highly variable results, with several hundred molecules typically needed for reliable statistics [81].
The Scientist's Toolkit: Essential Research Reagents
Table 3: Key Research Reagent Solutions for Virtual Screening
| Tool/Category | Specific Examples | Function/Application |
|---|---|---|
| Pharmacophore Modeling Software | LigandScout [20], MOE [47], Discovery Studio [6] | Generate and validate structure-based and ligand-based pharmacophore models |
| Virtual Screening Platforms | Pharmit [80], RosettaVS [54], OpenVS [54] | Perform large-scale compound screening with pharmacophore queries |
| Compound Databases | ZINC [6] [20], ChEMBL [47], PubChem [47] | Sources of screening compounds with curated structures and properties |
| Validation Toolsets | DUD-E decoys [47], ROC analysis [47], Enrichment calculators [6] | Assess model performance and screening enrichment |
| AI-Accelerated Screening | PGMG [19], Active learning platforms [54] | Generate molecules matching pharmacophores and optimize screening efficiency |
Emerging Trends and Future Directions
Artificial intelligence approaches are revolutionizing the sensitivity-specificity balance in virtual screening. The Pharmacophore-Guided deep learning approach for bioactive Molecule Generation (PGMG) uses graph neural networks to encode spatially distributed chemical features and transformers to generate molecules matching specific pharmacophores [19]. This method introduces latent variables to model the many-to-many relationship between pharmacophores and molecules, significantly enhancing output diversity while maintaining biological relevance [19]. In benchmarks, PGMG generated molecules with strong docking affinities and high scores of validity, uniqueness, and novelty [19].
Active learning frameworks address the computational challenges of billion-compound screening by iteratively selecting the most promising candidates for full docking calculations. The OpenVS platform combines target-specific neural networks with docking computations, enabling screening of multi-billion compound libraries in less than seven days [54]. This approach demonstrates exceptional performance, with RosettaVS achieving top 1% enrichment factors of 16.72, significantly outperforming other methods [54].
Advanced threshold optimization methods like the Regression Optimal (RO) and Bayesian Optimal (BO) approaches systematically balance sensitivity and specificity by fine-tuning classification thresholds [79]. The RO method outperformed other models across five real datasets, achieving superior F1 scores and Kappa coefficients by optimizing the threshold to minimize differences between sensitivity and specificity [79]. These methodologies provide principled, data-driven approaches to the traditionally subjective process of hit selection.
As virtual screening continues to evolve with expanding chemical libraries and more sophisticated algorithms, the fundamental balance between sensitivity and specificity remains central to successful hit identification. The integration of pharmacophore-based methods with AI-driven approaches promises enhanced capability to navigate complex chemical spaces while maintaining the biochemical interpretability essential for rational drug design.
Pharmacophore modeling represents an established concept for the abstract representation of stereoelectronic molecular features essential for ligand-receptor interactions [38]. According to the IUPAC definition, a pharmacophore model is "an ensemble of steric and electronic features that is necessary to ensure the optimal supramolecular interactions with a specific biological target and to trigger (or block) its biological response" [82]. The core challenge in pharmacophore modeling lies in accurately perceiving and optimizing these chemical features—hydrogen bond acceptors, hydrogen bond donors, hydrophobic regions, and others—to create models with high discriminatory power in virtual screening.
Traditionally, pharmacophore modeling has relied heavily on expert knowledge and often tedious manual refinement [38]. However, recent advances in computational methods have introduced sophisticated rule-based algorithms and calculation-intensive approaches that automate and optimize this process. These methods range from quantitative pharmacophore activity relationship (QPhAR) models that leverage structure-activity relationship (SAR) information to deep learning approaches that generate molecules matching specific pharmacophore hypotheses [38] [19]. This technical guide examines the current software tools and methodologies for optimizing pharmacophore feature perception, focusing specifically on their application within the broader context of hydrogen bond acceptor, donor, and hydrophobic feature research.
Rule-Based Algorithms for Feature Optimization
Rule-based heuristics provide a structured approach to pharmacophore feature selection and model refinement. These methods apply predefined logical rules to identify the most relevant chemical features driving biological activity, thereby optimizing pharmacophores for virtual screening performance.
QPhAR: Automated Feature Selection Using SAR Data
The QPhAR (Quantitative Pharmacophore Activity Relationship) platform implements a novel algorithm for automated selection of features that enhance pharmacophore model quality using SAR information extracted from validated models [38]. This method addresses the critical challenge of manual pharmacophore optimization by applying rule-based logic to identify features with the highest discriminatory power.
Experimental Protocol: QPhAR Feature Selection
- Input Preparation: Begin with a trained and validated QPhAR model derived from a set of 15-50 ligands with known activity values (e.g., IC50 or Ki) [38] [39].
- Feature Extraction: The algorithm automatically extracts refined pharmacophore features from the QPhAR model without requiring additional data.
- Model Evaluation: Generated pharmacophores are evaluated on the training set and ranked by their Fβ-score and FSpecificity-score.
- Validation: Top-performing models (typically the top five) are validated on a separate test set to confirm discriminatory power [38].
The rule-based logic underlying QPhAR contrasts with traditional practices that select features from only highly active compounds. Instead, it incorporates information from weakly active compounds, which often contain important structural information for defining essential pharmacophore features [38]. This approach eliminates the need for arbitrary activity cutoff values between "active" and "inactive" compounds, a subjective decision that often plagues traditional pharmacophore modeling.
Table 1: Performance Comparison of QPhAR-Generated vs. Baseline Pharmacophores
| Data Source | FComposite-Score (Baseline) | FComposite-Score (QPhAR) | QPhAR Model R² | QPhAR Model RMSE |
|---|---|---|---|---|
| Ece et al. [15] | 0.38 | 0.58 | 0.88 | 0.41 |
| Garg et al. [14] | 0.00 | 0.40 | 0.67 | 0.56 |
| Ma et al. [16] | 0.57 | 0.73 | 0.58 | 0.44 |
| Wang et al. [17] | 0.69 | 0.58 | 0.56 | 0.46 |
| Krovat et al. [18] | 0.94 | 0.56 | 0.50 | 0.70 |
As demonstrated in Table 1, QPhAR-based refined pharmacophores consistently outperform baseline pharmacophores (generated from the most active compounds) on the FComposite-score across diverse datasets [38]. This performance advantage is particularly evident in datasets where the QPhAR model itself shows high predictive quality (e.g., R² > 0.6).
Structure-Based Pharmacophore Modeling with Exclusion Volumes
Structure-based pharmacophore modeling generates features directly from the 3D structure of a macromolecular target or macromolecule-ligand complex [82]. This approach applies rule-based algorithms to identify potential interaction points within the binding site.
Experimental Protocol: Structure-Based Pharmacophore Generation
- Structure Preparation: Obtain a high-quality protein-ligand complex structure (e.g., from PDB). Prepare the structure by adding hydrogen atoms, assigning correct protonation states, and optimizing hydrogen bonding networks.
- Binding Site Analysis: Define the binding site using a sphere within a specific distance (typically 7-10 Å) from the native ligand [6].
- Interaction Mapping: Use interaction generation algorithms (e.g., in Discovery Studio) to map all possible hydrogen bond acceptors, donors, and hydrophobic interaction points within the binding site.
- Feature Clustering: Apply clustering algorithms to eliminate redundant features and select representative features with catalytic importance.
- Exclusion Volumes: Add exclusion volume spheres to represent steric constraints from the protein backbone or side chains [6].
A case study on XIAP protein inhibitors demonstrated the effectiveness of this approach, where a structure-based pharmacophore model identified 14 key chemical features: four hydrophobic features, one positive ionizable bond, three hydrogen bond acceptors, and five hydrogen bond donors [20]. The model showed excellent discriminatory power with an AUC value of 0.98 in validation studies, successfully distinguishing active compounds from decoys [20].
Advanced Calculation Methods for Feature Refinement
Beyond rule-based approaches, advanced calculation methods leveraging machine learning, molecular dynamics, and deep learning have emerged as powerful tools for pharmacophore feature optimization.
Dynamic Pharmacophore Modeling from Molecular Dynamics
Traditional structure-based pharmacophore models often suffer from the limitations of static protein structures. Dynamic pharmacophore modeling addresses this by incorporating protein flexibility and explicit water molecules through molecular dynamics (MD) simulations [22].
Experimental Protocol: Water-Based Pharmacophore Modeling
- System Preparation: Select an apo protein structure (e.g., PDB: 2DQ7 for Fyn kinase). Add missing loop regions using modeling tools like MODELLER in ChimeraX.
- Solvation and Minimization: Solvate the system in explicit water molecules (e.g., TIP3P water model) with a 10 Å water layer from the protein to the edge of the solvation box. Add counterions to neutralize the system.
- Equilibration: Perform energy minimization followed by gradual heating to 300 K over 300 ps with positional restraints on heavy atoms, then remove restraints and conduct 10 ns NPT simulations for equilibration.
- Production MD: Run extended MD simulations (100+ ns) to sample water dynamics and protein flexibility.
- Feature Extraction: Analyze trajectories to identify conserved water sites and their interaction patterns. Convert these dynamic molecular interaction fields (dMIFs) into pharmacophore features using tools like PyRod [22].
This water-based approach was successfully applied to Fyn and Lyn kinase targets, resulting in the identification of novel inhibitory compounds through virtual screening. The method proved particularly effective for modeling conserved core interactions like those with the hinge region, though it faced challenges in capturing interactions with highly flexible protein regions [22].
Pharmacophore-Guided Deep Learning for Molecular Generation
PGMG (Pharmacophore-Guided deep learning approach for bioactive Molecule Generation) represents a cutting-edge calculation method that uses pharmacophore hypotheses as input for deep learning models to generate novel bioactive molecules [19].
Experimental Protocol: PGMG Implementation
- Pharmacophore Representation: Represent pharmacophore hypotheses as complete graphs where each node corresponds to a pharmacophore feature (hydrogen bond acceptor, donor, hydrophobic, etc.), with spatial information encoded as distances between node pairs.
- Model Architecture: Implement a graph neural network to encode spatially distributed chemical features and a transformer decoder to generate molecules.
- Latent Variable Integration: Introduce latent variables to model the many-to-many relationship between pharmacophores and molecules, enhancing output diversity.
- Training: Train the model using a diverse set of molecular structures (e.g., from ChEMBL database) without target-specific activity data to avoid data scarcity issues.
- Generation: Given a target pharmacophore hypothesis, sample latent variables from the prior distribution and generate molecules from the conditional distribution that match the input pharmacophore [19].
In benchmark evaluations, PGMG achieved top performance in novelty and ratio of available molecules (6.3% improvement over other methods) while maintaining comparable validity and uniqueness scores [19]. The approach demonstrates how abstract pharmacophore representations can guide deep learning models to explore relevant chemical space efficiently.
Table 2: Performance Metrics of PGMG in Unconditional Molecule Generation
| Model | Validity | Novelty | Uniqueness | Ratio of Available Molecules |
|---|---|---|---|---|
| PGMG | High | Best | Comparable to top models | Best (6.3% improvement) |
| VAE [4] | Moderate | Moderate | Moderate | Moderate |
| ORGAN [9] | Moderate | Low | Low | Low |
| SMILES LSTM [32] | High | High | High | High |
| Syntalinker [17] | High | High | High | High |
Integrated Workflows and Practical Applications
Combining rule-based and calculation methods into integrated workflows represents the state-of-the-art in pharmacophore-based drug discovery. These workflows leverage the strengths of both approaches to maximize efficiency and success rates.
End-to-End Pharmacophore Modeling Workflow
The QPhAR platform demonstrates a fully automated workflow that integrates multiple optimization methods [38]:
- Start with a small set of compounds (15-50) with known activity values
- Train and validate a QPhAR model using cross-validation techniques
- Automatically extract refined pharmacophore features using the rule-based algorithm
- Employ the optimized pharmacophore for virtual screening of large compound databases
- Rank obtained hits using QPhAR-predicted activity values
This workflow was validated in a case study on the hERG K+ channel using a dataset from Garg et al., demonstrating robust performance and the ability to guide researchers with insights about favorable and unfavorable interactions for compounds of interest [38].
Virtual Screening Pipeline with Pharmacophore Filtering
A comprehensive virtual screening pipeline incorporating pharmacophore modeling was developed for identifying novel Akt2 inhibitors [6]:
- Generate both structure-based and 3D-QSAR pharmacophore models
- Use combined models as 3D search queries for screening natural product and synthetic compound databases
- Apply drug-like filters (Lipinski's Rule of Five) and ADMET prediction
- Perform molecular docking studies with selected hits
- Experimental validation of top candidates
This approach identified seven novel hit compounds with different scaffolds, high predicted activity, and favorable ADMET properties, demonstrating the practical utility of optimized pharmacophore models in lead identification [6].
The Scientist's Toolkit: Essential Research Reagents and Software
Table 3: Essential Tools and Software for Pharmacophore Feature Optimization
| Tool/Software | Type | Primary Function | Key Features |
|---|---|---|---|
| QPhAR [38] [39] | Standalone Platform | Quantitative Pharmacophore Modeling | Automated feature selection, SAR-based optimization, Activity prediction |
| LigandScout [20] | Software Suite | Structure & Ligand-Based Modeling | Advanced pharmacophore feature perception, Virtual screening, IDEAL interface |
| Discovery Studio [6] | Molecular Modeling Suite | Comprehensive Drug Discovery | Structure-based pharmacophore generation, 3D-QSAR, ADMET prediction |
| PHASE [39] [82] | QSAR Module | 3D-QSAR Pharmacophore Modeling | Pharmacophore field calculation, PLS regression, Alignment-dependent models |
| PyRod [22] | Computational Tool | Dynamic Pharmacophore Generation | Water-based feature mapping, MD trajectory analysis, Interaction field calculation |
| PGMG [19] | Deep Learning Framework | Pharmacophore-Guided Molecule Generation | Graph neural networks, Transformer architecture, Latent variable modeling |
| RDKit [19] | Cheminformatics Library | Chemical Feature Identification | Pharmacophore feature detection, Conformer generation, Molecular descriptor calculation |
| Amber [22] | Molecular Dynamics Suite | Dynamics Simulations | Force field parameters, Explicit solvent modeling, Trajectory analysis |
The optimization of pharmacophore feature perception through rule-based and calculation methods represents a significant advancement in computer-aided drug design. Traditional approaches that rely on manual feature selection by experts are being progressively augmented—and in some cases replaced—by automated algorithms that can extract optimal feature sets directly from structural and activity data.
Rule-based methods like those implemented in QPhAR provide transparent, interpretable workflows for feature selection, leveraging SAR information to identify chemically relevant features that maximize virtual screening performance. Meanwhile, advanced calculation methods incorporating molecular dynamics and deep learning offer powerful alternatives that capture protein flexibility and solvent effects, enabling the generation of novel chemical entities matched to specific pharmacophore constraints.
The integration of these approaches into end-to-end workflows demonstrates their practical utility in drug discovery campaigns, significantly reducing the time and resources required for lead identification and optimization. As these methods continue to evolve, particularly with advances in machine learning and computational power, they promise to further enhance our ability to perceive and optimize the essential chemical features that govern molecular recognition and biological activity.
Ensuring Efficacy: Validation, Performance Metrics, and Comparative Analysis of Pharmacophore Models
In the field of computer-aided drug design, pharmacophore modeling serves as a crucial bridge between chemistry and biology, providing an abstract representation of the molecular features essential for biological activity. These features typically include hydrogen bond acceptors, hydrogen bond donors, and hydrophobic regions, which form the foundational elements for understanding ligand-target interactions [9]. Within this context, internal validation through cross-validation represents a critical statistical process for assessing the robustness and predictive capability of pharmacophore models before their application in virtual screening or lead optimization [83] [39]. This validation paradigm ensures that the identified pharmacophoric features—whether donor, acceptor, or hydrophobic characteristics—genuinely correlate with biological activity rather than representing random noise in the dataset.
The fundamental principle of internal validation involves testing a model's performance on different subsets of the same data from which it was derived, providing an estimate of how the model will generalize to unseen data [83]. For researchers investigating specific pharmacophore feature types, robust internal validation provides confidence that the spatial arrangement of these features reliably predicts biological activity, enabling more effective scaffold hopping and rational drug design [39] [84]. Without rigorous internal validation, pharmacophore models may appear statistically significant while failing to predict new active compounds, leading to wasted resources in subsequent experimental phases.
Core Methodologies for Internal Validation
Cross-Validation Techniques
The most widely employed method for internal validation in pharmacophore modeling is cross-validation, with the leave-one-out approach being particularly common for datasets of limited size. The process systematically excludes one compound from the training set, builds a model with the remaining compounds, and predicts the activity of the excluded compound [83]. This procedure iterates until every compound in the training set has been excluded and predicted once.
The predictive accuracy of cross-validation is quantified through the cross-validated correlation coefficient (q²), calculated using the formula:
Where (yi) represents the actual activity of the ith molecule, (ŷi) represents the predicted activity of the ith molecule, and (y_{mean}) represents the average activity of all molecules in the training set [83]. A q² value > 0.5 is generally considered indicative of a robust model, with values > 0.7 representing excellent internal predictive ability [85].
For larger datasets, k-fold cross-validation provides a more efficient approach, where the dataset is randomly divided into k subsets of approximately equal size. The model is trained k times, each time using k-1 subsets for training and the remaining subset for testing [39]. Studies implementing five-fold cross-validation for quantitative pharmacophore models have reported strong predictive performance with root mean square error (RMSE) values of 0.62 ± 0.18 across diverse datasets [39].
Y-Scrambling and Randomization Tests
Beyond cross-validation, Y-scrambling represents another crucial internal validation technique that tests for chance correlation [85]. This method involves randomly shuffling the biological activity values (Y-block) while maintaining the original descriptor matrix (X-block), then building new models with the scrambled data. This process typically repeats 100-300 times to generate a distribution of random correlation coefficients [86].
A statistically valid model should demonstrate significantly higher q² and r² values compared to the scrambled models. The scrambling stability metric can be calculated to quantify this difference, with values above 0.5 indicating robust models unlikely to result from chance correlations [85]. This validation step is particularly important when working with complex pharmacophore descriptors that might accidentally correlate with activity due to dataset peculiarities rather than true structure-activity relationships.
Statistical Validation Parameters
Comprehensive internal validation requires examining multiple statistical parameters that collectively assess model quality:
- Pearson's correlation coefficient (r²): Measures the goodness-of-fit between experimental and predicted activities [85]
- F-value: Assesses the overall statistical significance of the model, with higher values indicating greater significance [85]
- Standard deviation (SD): Quantifies the dispersion of predictions around the regression line [85]
- Root mean square error (RMSE): Provides a measure of prediction accuracy in the original activity units [39]
- Z-score: Calculates the number of standard deviations between the actual q² value and the average q² of random models, with values >3 indicating statistical significance [83]
The following table summarizes optimal values for key internal validation parameters in pharmacophore modeling:
Table 1: Key Statistical Parameters for Internal Validation of Pharmacophore Models
| Validation Parameter | Optimal Value | Interpretation | Application Context |
|---|---|---|---|
| q² (LOO-CV) | > 0.5 (Good), > 0.7 (Excellent) | Internal predictive ability | Leave-one-out cross-validation [83] [85] |
| RMSE (CV) | Lower values preferred | Prediction accuracy | Five-fold cross-validation (0.62 ± 0.18 reported) [39] |
| F-value | Higher values preferred | Overall model significance | 83.5 reported for MMP-9 inhibitors model [85] |
| Z-score | > 3 | Statistical significance | Standard deviations from random models [83] |
| Scrambling Stability | > 0.5 | Resistance to chance correlation | Y-scrambling validation [85] |
Experimental Protocols for Internal Validation
Standardized Workflow for Cross-Validation
Implementing a rigorous internal validation protocol requires careful attention to experimental design and execution. The following workflow provides a standardized approach for internal validation of pharmacophore models:
Dataset Preparation and Division: Compile a structurally diverse set of compounds with consistent biological activity data. Divide the dataset into training and test sets, typically using a 60:40 to 80:20 ratio, ensuring both sets span similar activity ranges and structural diversity [83] [85]. For the MMP-9 inhibitor study, 46 compounds (68%) formed the training set while 21 compounds (32%) constituted the test set [85].
Model Generation: Develop the pharmacophore hypothesis using only training set compounds. The model should incorporate relevant pharmacophoric features such as hydrogen bond donors/acceptors and hydrophobic regions identified through ligand-based or structure-based approaches [85].
Cross-Validation Execution: Perform leave-one-out (LOO) or k-fold cross-validation on the training set. For LOO-CV, iterate through each training set compound, excluding it, rebuilding the model, and predicting its activity [83].
Statistical Calculation: Compute q² and other validation metrics using the predictions generated during cross-validation. The PLSR QSAR model development for PfM18AAP inhibitors demonstrated strong internal validation with correlation coefficient r² of 0.88 and predictive correlation coefficient of 0.6101 for the external test set [83].
Y-Scrambling Implementation: Randomize activity values 100-300 times while retaining original structural descriptors. Build new models with scrambled data and compare their statistics with the original model [85].
Model Acceptance Criteria: Accept models that simultaneously satisfy multiple criteria: q² > 0.5, r² > 0.7, high F-value, and scrambled model statistics significantly worse than the original model [85].
Internal Validation Workflow for Pharmacophore Models
Case Study: MMP-9 Inhibitors Model Validation
A comprehensive internal validation was demonstrated in a study on MMP-9 inhibitors, where a ligand-based pharmacophore model was developed using 67 known inhibitors [85]. The validation protocol included:
Hypothesis Generation: Twenty variant hypotheses were developed with five features maximum, with the DDHRR_1 model (two hydrogen bond donors, one hydrophobic group, two aromatic rings) emerging as optimal based on survival score (5.639) and other statistical parameters [85].
Statistical Validation: The model showed excellent internal consistency with r² of 0.9076 and cross-validated q² of 0.8170 at PLS factor four, indicating strong predictive capability within the training set [85].
Y-Scrambling Confirmation: Randomization tests confirmed the model's robustness against chance correlation, with scrambled models showing significantly worse performance [85].
This rigorous internal validation provided the foundation for subsequent successful virtual screening of 2.3 million compounds to identify novel MMP-9 inhibitors [85].
Table 2: Essential Computational Tools for Pharmacophore Modeling and Validation
| Tool/Resource | Primary Function | Application in Validation |
|---|---|---|
| Schrödinger PHASE | Pharmacophore generation & alignment | 3D-QSAR model development with built-in cross-validation [85] |
| VLifeMDS | Molecular descriptor calculation | Calculation of steric and electrostatic interaction energies for QSAR [83] |
| GOLD/GLIDE | Molecular docking | Validation of pharmacophore features against protein structure [83] [6] |
| RDKit | Cheminformatics & clustering | Butina algorithm implementation for diverse training sets [84] |
| AMBER | Molecular dynamics simulations | Water pharmacophore generation and binding pose validation [7] |
Integration with Broader Validation Strategies
While internal validation provides essential checks for model robustness, it represents only one component of a comprehensive validation strategy. Internal validation primarily addresses the question: "Is my model statistically robust for the data used to create it?" This must be complemented with:
External Validation: Assessing the model's predictive power on completely independent test sets not used in model development [83] [86]
Experimental Validation: Confirming model predictions through synthesis and biological testing of new compounds [85]
Prospective Validation: Applying the model in actual virtual screening campaigns and evaluating hit rates [7]
The integration of internal validation within this broader framework ensures that pharmacophore models containing critical feature types like hydrogen bond acceptors, donors, and hydrophobic regions will successfully identify novel active compounds in real-world drug discovery applications [39] [9].
Internal validation through cross-validation and related techniques provides the fundamental statistical foundation for reliable pharmacophore models in structure-activity relationship studies. By implementing the standardized protocols and validation criteria outlined in this technical guide, researchers can develop robust, predictive models that accurately capture the essential features—hydrogen bond acceptors, donors, and hydrophobic regions—required for biological activity. This rigorous approach to model validation ultimately enhances the efficiency and success rates of drug discovery campaigns by ensuring that computational models generate biologically relevant predictions worthy of experimental investigation.
In computational drug discovery, a pharmacophore model is a hypothetical representation of the steric and electronic features necessary for a molecule to interact effectively with a specific biological target and trigger a desired biological response [27]. The development of such a model, whether structure-based (derived from a target protein structure) or ligand-based (derived from a set of known active molecules), is followed by a critical step: establishing its predictive power and reliability [27] [87]. Internal validation, which assesses the model using the same data on which it was trained, can lead to over-optimistic performance metrics. Therefore, external validation using an independent test set is the definitive method for evaluating a model's real-world applicability and its ability to generalize to novel chemical structures [87].
This process involves challenging the pharmacophore model with compounds that were not part of the model generation or training phase. A successful external validation provides researchers with the confidence to use the model in virtual screening campaigns to identify new lead compounds, as it demonstrates an ability to discriminate between active and inactive molecules from a diverse chemical space [38] [87]. This guide details the methodologies, metrics, and experimental protocols for rigorously evaluating pharmacophore models through independent test sets, framed within the context of pharmacophore feature research involving hydrogen bond acceptors, hydrogen bond donors, and hydrophobic features.
Theoretical Foundations and the Imperative for External Validation
The Core Principle of External Validation
External validation is the cornerstone of a robust pharmacophore modeling workflow. It operates on the fundamental scientific principle that a model's true value lies not in its fit to existing data, but in its predictive accuracy for new, unseen data [87]. In practice, this means withholding a portion of the available biologically tested compounds (the test set) during the entire model-building process. The final, validated model is then used to screen this external test set, and its predictions are compared against the known experimental results [88] [38]. This procedure provides an unbiased estimate of how the model will perform in a real-world virtual screening scenario against large databases of unknown compounds.
Contrasting Internal and External Validation
It is crucial to distinguish between internal and external validation methods, as they serve different purposes and provide different levels of evidence for a model's quality.
- Internal Validation: This includes techniques like leave-one-out cross-validation, where multiple models are built by sequentially leaving out one compound from the training set and predicting its activity. While useful for assessing the internal stability and robustness of a model during the training phase, it does not test the model on truly external chemotypes [87].
- External Validation: This is a one-time, definitive test using a fully independent set of compounds. A model that passes external validation demonstrates generalizability, proving that it has captured the essential, underlying structure-activity relationship of the target and has not merely memorized the training data [38].
Table 1: Key Differences Between Internal and External Validation
| Aspect | Internal Validation (e.g., Cross-Validation) | External Validation (Independent Test Set) |
|---|---|---|
| Primary Goal | Assess model stability and robustness during training | Evaluate model generalizability and predictive power |
| Data Usage | Uses only the training set data | Uses a completely separate, unseen test set |
| Risk of Overfitting | Higher; can produce over-optimistic results | Lower; provides an unbiased performance estimate |
| Interpretation | Indicates how well the model explains the training data | Predicts how the model will perform on new chemical matter |
Methodological Framework for External Validation
Construction of the Independent Test Set
The quality of the external test set is paramount to the validity of the evaluation. A poorly constructed test set can lead to misleading conclusions about the model's utility.
- Selection Criteria: The test set should be selected from the same data universe as the training set but must be strictly excluded from the model development process [38]. The selection should ensure that the test compounds:
- Data Source: Test set compounds are typically sourced from the same experimental literature or databases (e.g., ChEMBL) as the training set but are carefully partitioned [88] [39]. For example, in a study on Akt2 inhibitors, 63 active compounds were collected from literature, and a subset was explicitly chosen as the test set for validating the structure-based pharmacophore model [88].
Quantitative Metrics for Evaluating Predictive Power
Once the pharmacophore model is used to screen the independent test set, its performance is quantified using a standard set of metrics. These metrics evaluate the model's ability to correctly classify compounds as active or inactive.
- Enrichment Factor (EF): This measures the model's ability to "enrich" the top portion of a ranked hit list with true actives compared to a random selection. It is calculated as: EF = (Ht / D) / (A / D) = (Ht / A) * (D / D) simplified to EF = (Ht / A) * (D / Ht), where Ht is the number of active hits retrieved, A is the total number of actives in the test set, and D is the total number of compounds in the test set [88]. A higher EF indicates better performance.
- Goodness of Hit Score (GH): This score combines the EF with the yield of actives. It ranges from 0 (null model) to 1 (ideal model) and is calculated using a specific formula. A score above 0.7 is generally considered to indicate a very good model [88].
- Statistical Metrics from Confusion Matrix:
- Sensitivity (Recall): The proportion of actual active compounds that are correctly identified.
- Specificity: The proportion of actual inactive compounds that are correctly identified.
- Precision: The proportion of retrieved hits that are truly active.
- F1-Score: The harmonic mean of precision and recall, providing a single metric for model balance [38] [87].
Table 2: Key Quantitative Metrics for External Validation
| Metric | Formula / Description | Interpretation | Ideal Value |
|---|---|---|---|
| Enrichment Factor (EF) | (Number of actives found in top X% / Total actives in test set) / (X%/100%) | Measures the concentration of actives at the top of a ranked list. | Significantly > 1 |
| Goodness of Hit (GH) | Complex function of EF and recall [88] | A single score balancing enrichment and the recovery of actives. | > 0.7 |
| Sensitivity | True Positives / (True Positives + False Negatives) | Ability to identify all active compounds. | Close to 1 |
| Specificity | True Negatives / (True Negatives + False Positives) | Ability to reject inactive compounds. | Close to 1 |
| F1-Score | 2 * (Precision * Sensitivity) / (Precision + Sensitivity) | Balanced measure of precision and sensitivity. | Close to 1 |
Experimental Protocol for External Validation
The following is a detailed, step-by-step protocol for conducting an external validation of a pharmacophore model, incorporating specific examples from the research literature.
Step 1: Model Generation and Training Set Definition
Generate your pharmacophore model using a defined training set. For instance, in a study on Akt2 inhibitors, a structure-based pharmacophore (PharA) was built from a crystal structure (PDB: 3E8D), while a 3D-QSAR pharmacophore was generated from a training set of 23 compounds with known IC50 values [88]. The chemical features of these models—such as hydrogen bond acceptors (HA1, HA2), a hydrogen bond donor (HD), and hydrophobic features (HY1-HY4)—define the specific interaction points critical for binding [88].
Step 2: Curation of the Independent Test Set
Compile a test set of compounds not used in training. The Akt2 study, for example, used a test set of 40 molecules for the 3D-QSAR model and all 68 known active compounds for the structure-based model validation [88]. For a more rigorous test, include confirmed inactive compounds or decoys. Another robust approach involves using a decoy set of 1980 molecules with unknown activity spiked with 20 known Akt2 inhibitors to calculate EF and GH scores [88].
Step 3: Virtual Screening of the Test Set
Use the pharmacophore model as a 3D query to screen the independent test set. Software like Discovery Studio or LigandScout is typically employed for this task [88] [32] [87]. Compounds are considered "hits" if they map to the essential features of the pharmacophore model, such as aligning with the key hydrogen bond donor/acceptor and hydrophobic points [88].
Step 4: Calculation of Validation Metrics
Compare the virtual screening results against the experimental biological data for the test set. Calculate the key metrics outlined in Section 3.2. In the Akt2 example, the structure-based model PharA retrieved 16 active compounds and 7 unknowns from the decoy set, resulting in an EF of 69.57 and a GH score of 0.72, confirming its high predictive power [88].
Step 5: Analysis and Interpretation
Interpret the results in the context of your drug discovery goals. A model with high sensitivity is good for finding all potential actives, while a model with high specificity and a high EF is efficient for minimizing false positives in a virtual screen [87]. The analysis should also consider whether the model successfully identified actives with diverse scaffolds, demonstrating its utility for lead hopping [89].
Validation Workflow: This diagram illustrates the sequential process of external validation, highlighting the strict separation between the training and test sets.
The Scientist's Toolkit: Essential Reagents and Software
Table 3: Key Research Reagent Solutions for Pharmacophore Modeling and Validation
| Item / Resource | Function in Validation | Specific Example(s) |
|---|---|---|
| Chemical Databases | Source of training and test set compounds with associated bioactivity data. | ChEMBL [38] [39], Zinc Database (for Nature Products, Asinex) [88] |
| Protein Data Bank (PDB) | Source of 3D protein structures for structure-based pharmacophore modeling. | PDB IDs: 3E8D (Akt2), 1v4s, 4no7 (Glucokinase) [88] [32] |
| Pharmacophore Modeling Software | Platform for generating, visualizing, and running virtual screens with pharmacophore models. | Discovery Studio [88] [39], LigandScout [32] [39], MOE [87] |
| Conformational Generation Algorithm | Generates multiple 3D conformations for each ligand to account for flexibility. | iConfGen [39], Generate Conformations protocol in DS [88] |
| Validation & Metric Calculation Scripts | Custom or built-in scripts to calculate enrichment factors, GH scores, and other statistical metrics. | Scripts for calculating EF and GH [88], QPhAR for quantitative analysis [38] [39] |
Advanced Topics and Integrated Workflows
Integration with Quantitative Pharmacophore Activity Relationship (QPhAR)
Emerging methods like QPhAR extend traditional qualitative pharmacophore screening to quantitative activity prediction [39]. In an integrated workflow, a QPhAR model is first trained and validated on a dataset. Subsequently, the model's inherent knowledge is used to automatically derive a refined, classification-optimized pharmacophore. This refined model is then used for virtual screening, and the final hits are ranked by their predicted activity from the QPhAR model, creating a fully automated, end-to-end pipeline for hit identification and prioritization [38].
Handling Complex Systems with Hierarchical Graphs
For complex systems derived from molecular dynamics (MD) simulations, where thousands of potential pharmacophore models may be generated, selecting a single model for validation is challenging. The Hierarchical Graph Representation of Pharmacophore Models (HGPM) addresses this by visualizing all unique models and their interrelationships in a single graph [32]. This tool allows researchers to intuitively select a strategic subset of models for virtual screening based on feature hierarchy and consensus, making the validation process more efficient and informed for highly flexible targets [32].
Feature Hierarchy: This hierarchical graph depicts how core pharmacophore features (e.g., H-Bond Acceptor) can be decomposed into more specific interaction types observed in a protein structure or across a set of active ligands.
In the rigorous field of computer-aided drug design, pharmacophore modeling serves as a critical tool for identifying novel therapeutic compounds by abstracting essential steric and electronic features—such as hydrogen bond acceptors (HBA), hydrogen bond donors (HBD), and hydrophobic (HY) regions—necessary for optimal supramolecular interactions with a biological target. The efficacy of these models hinges on robust validation methods to distinguish true active compounds from inactive decoys. This whitepaper provides an in-depth technical guide to the core performance metrics used in this validation: Enrichment Factor (EF), Receiver Operating Characteristic (ROC) curves, and Area Under the Curve (AUC) analysis. Framed within broader research on pharmacophore feature types, this review synthesizes contemporary methodologies, presents quantitative benchmarks, and offers detailed experimental protocols for employing these metrics, thereby equipping researchers with the knowledge to critically evaluate and optimize their pharmacophore models for successful virtual screening campaigns.
Pharmacophore models are defined as the ensemble of steric and electronic features that are necessary to ensure optimal supramolecular interactions with a specific biological target and to trigger or block its biological response [90]. These features primarily include hydrogen bond acceptors, hydrogen bond donors, positive and negative ionizable groups, lipophilic regions, and aromatic rings. The development of a pharmacophore, whether structure-based (derived from a protein-ligand complex) or ligand-based (inferred from a set of active ligands), is a foundational step in virtual screening [36].
However, the predictive power and utility of any generated pharmacophore model must be quantitatively assessed before its deployment in large-scale database screening. Validation answers a critical question: How well can the model differentiate between known active compounds and inactive decoys? This is where key performance metrics—the Enrichment Factor (EF), the Receiver Operating Characteristic (ROC) curve, and the Area Under the Curve (AUC)—become indispensable [90] [20]. These metrics provide a rigorous, quantitative framework for evaluating model quality, guiding hypothesis refinement, and ensuring computational efficiency and cost-effectiveness in subsequent experimental work. This guide details the theory, calculation, and interpretation of these metrics within the context of pharmacophore feature analysis.
Theoretical Foundations of Key Metrics
The Enrichment Factor (EF)
The Enrichment Factor (EF) is a decisive metric that quantifies the ability of a pharmacophore model to enrich active compounds in a virtual screening hit list compared to a random selection [88]. It measures the concentration of actives at a specific threshold of the screened database.
Calculation: The EF is calculated using the formula: [ EF = \frac{(Ht / Ht_{total})}{(A / D)} ] where:
- ( H_t ) is the number of active molecules retrieved in the hit list (e.g., the top 1% of the screened database).
- ( Ht{total} ) is the total number of molecules in the hit list.
- ( A ) is the number of active molecules in the entire database.
- ( D ) is the total number of molecules in the entire database [88].
Interpretation: An EF of 1 indicates no enrichment over random selection. Higher EF values signify better performance. For instance, in a study targeting the XIAP protein, a structure-based pharmacophore model achieved an exceptional early enrichment (EF1%) of 10.0, demonstrating a ten-fold concentration of actives in the top 1% of the screened library [20]. Similarly, a model for Akt2 inhibitors achieved an EF of 69.57 [88].
ROC Curves and AUC Analysis
The Receiver Operating Characteristic (ROC) curve is a graphical plot that illustrates the diagnostic ability of a binary classifier system, such as a pharmacophore model, by plotting the True Positive Rate (TPR) against the False Positive Rate (FPR) at various classification thresholds [90] [44].
- True Positive Rate (TPR/Sensitivity): ( \text{TPR} = H_t / A )
- False Positive Rate (FPR): ( \text{FPR} = (Dt - Ht) / (D - A) ) Where ( D_t ) is the number of decoys retrieved in the hit list.
The Area Under the Curve (AUC) provides a single scalar value representing the overall quality of the model across all possible thresholds [44] [20].
- An AUC of 1.0 represents a perfect model.
- An AUC of 0.5 indicates a model with no discriminatory power, equivalent to random guessing.
- An AUC greater than 0.7 is generally considered acceptable, while values above 0.8 or 0.9 are indicative of a good or excellent model, respectively [44]. For example, a validated model for PD-L1 inhibitors achieved an AUC of 0.819, confirming its robust predictive ability [44].
Experimental Protocols for Metric Calculation
The following section outlines a standardized workflow for pharmacophore validation, from initial model generation to the final calculation of performance metrics.
Workflow for Pharmacophore Validation
The validation of a pharmacophore model follows a systematic sequence from dataset preparation to performance evaluation, as illustrated below.
Detailed Methodologies
Pharmacophore Model Generation
- Structure-Based Approach: Using a protein-ligand complex (e.g., from the PDB), software such as LigandScout or Discovery Studio is used to identify key interaction features between the ligand and the protein's active site. For instance, a study on Akt2 generated a model (PharA) featuring two hydrogen bond acceptors, one hydrogen bond donor, and four hydrophobic features [88]. Molecular Dynamics (MD) simulations can be employed to refine the initial crystal structure, leading to MD-refined pharmacophores that may better represent physiological binding conditions [90].
- Ligand-Based Approach: When a 3D protein structure is unavailable, a set of known active ligands is aligned, and their common chemical features are identified to build the model [36].
Preparation of the Validation Set
A critical step is the creation of a high-quality validation dataset, which consists of:
- Active Compounds: A set of known active molecules against the target, ideally with measured IC50 or Ki values. For example, 63 active compounds were collected from literature for validating an Akt2 pharmacophore [88].
- Decoy Compounds: A set of molecules presumed to be inactive. These should have similar physicochemical properties (e.g., molecular weight, logP) to the actives but dissimilar 2D topology to ensure they are not actives themselves. Publicly available databases like the Database of Useful Decoys: Enhanced (DUD-E) are specifically designed for this purpose [90] [20]. A typical study might use 10-20 known actives mixed with thousands of decoys (e.g., 5,199 decoys were used in a XIAP study [20]).
Virtual Screening and Metric Calculation
- Screening: The pharmacophore model is used as a query to screen the validation database. Software like PHASE, Pharmit, or LigandScout is typically used for this step [80] [7].
- Ranking: All screened compounds are ranked based on their pharmacophore "fit score," which measures how well a molecule's conformation matches the model's features.
- ROC/AUC Calculation: The ranked list is analyzed to plot the ROC curve and calculate the AUC. This process involves moving down the ranked list and calculating the cumulative TPR and FPR at various thresholds [44].
- EF Calculation: The EF is calculated at a specific early fraction of the screened database (e.g., 1% or 5%). Early enrichment (EF1%) is particularly valuable as it reflects the model's performance under realistic screening scenarios where only a top fraction of hits is selected for further testing [20].
Performance Benchmarks and Data Synthesis
The table below summarizes performance metrics from recent pharmacophore studies, highlighting the effectiveness of these models across various biological targets.
Table 1: Benchmarking Performance Metrics from Recent Pharmacophore Studies
| Target Protein | Pharmacophore Type | Key Features | AUC | Enrichment Factor (EF) | Reference |
|---|---|---|---|---|---|
| XIAP | Structure-Based | HBD, HBA, HY, Positive Ionizable | 0.98 (at 1%) | EF1% = 10.0 | [20] |
| Akt2 | Structure-Based | 2 HBA, 1 HBD, 4 HY | N/R | EF = 69.57 (GH=0.72) | [88] |
| PD-L1 | Structure-Based | HBA, HBD, HY, Charged | 0.819 | N/P | [44] |
| FKBP12 | MD-Refined | Features varied post-MD | Varies | Better than crystal-based | [90] |
| SARS-CoV-2 PLpro | Structure-Based | HBA, HBD, HY | N/P | Successful hit identification | [91] |
Abbreviations: N/R = Not Reported; N/P = Not Provided; HY = Hydrophobic; HBA = Hydrogen Bond Acceptor; HBD = Hydrogen Bond Donor.
The Scientist's Toolkit: Essential Research Reagents and Software
Successful pharmacophore modeling and validation rely on a suite of specialized software tools and databases.
Table 2: Essential Reagents and Software for Pharmacophore Research
| Item Name | Type | Primary Function in Validation | |
|---|---|---|---|
| DUD-E Database | Database | Provides curated sets of active and decoy molecules for rigorous validation. | [90] |
| LigandScout | Software | Generates structure-based pharmacophore models and performs virtual screening and validation. | [90] [20] |
| Schrödinger Suite (PHASE) | Software | A comprehensive platform for ligand-based pharmacophore generation, virtual screening, and ROC analysis. | [7] [36] |
| Pharmit | Online Tool | An interactive web server for high-performance pharmacophore-based virtual screening. | [80] [33] |
| ZINC Database | Database | A freely available collection of commercially available compounds for virtual screening. | [20] |
| RDKit | Open-Source Software | A cheminformatics toolkit used for fundamental tasks like molecule handling and conformer generation. | [36] [33] |
| AutoDock/Vina | Software | Molecular docking programs used for comparative binding mode analysis in integrated workflows. | [44] [91] |
Advanced Considerations and Future Directions
While EF and ROC/AUC are cornerstone metrics, a nuanced understanding is required for optimal application. The EF is highly dependent on the ratio of actives to decoys in the database and the selected early threshold. ROC curves can sometimes be optimistic when dealing with highly imbalanced datasets (a vast excess of decoys over actives). Therefore, it is considered best practice to report multiple metrics (e.g., EF at 1% and 5%, and AUC) to provide a comprehensive view of model performance [90] [20].
The field is rapidly evolving with the integration of more sophisticated computational techniques. The use of Molecular Dynamics (MD) simulations refines static crystal structures, leading to more physiologically relevant pharmacophores and, as shown in several cases, improved enrichment [90]. Furthermore, artificial intelligence is making significant inroads. Emerging deep learning models, such as PharmRL (a geometric reinforcement learning model) and DiffPhore (a knowledge-guided diffusion model), are being developed to automate and enhance the process of pharmacophore elucidation and ligand-pharmacophore mapping, showing promising results in virtual screening benchmarks [37] [33].
The rigorous validation of pharmacophore models using Enrichment Factor, ROC curves, and AUC analysis is a non-negotiable step in modern computational drug discovery. These metrics provide the quantitative evidence needed to trust a model's ability to identify novel hit compounds by correctly discriminating actives from inactives based on key features like hydrogen bond acceptors, donors, and hydrophobic contacts. By adhering to the detailed experimental protocols and leveraging the essential tools outlined in this guide, researchers can robustly validate their models, thereby de-risking the drug discovery pipeline and accelerating the journey toward new therapeutics.
Virtual screening is an indispensable component of modern computer-aided drug design, enabling the rapid identification of potential hit compounds from vast chemical libraries. Among its most critical methodologies are pharmacophore modeling and molecular docking. While both are structure-based techniques, their underlying principles, applications, and strengths differ significantly. Pharmacophore modeling abstracts molecular recognition into a set of steric and electronic features necessary for optimal supramolecular interactions with a biological target [2]. In contrast, molecular docking predicts the precise binding conformation and orientation of a small molecule within a specific target binding site [92]. This review provides a comprehensive technical comparison of these methodologies, focusing on their theoretical foundations, implementation protocols, and synergistic integration in contemporary virtual screening workflows, with particular emphasis on their application in pharmacophore feature analysis.
Theoretical Foundations and Methodological Principles
A pharmacophore is formally defined as "the ensemble of steric and electronic features that is necessary to ensure the optimal supramolecular interactions with a specific biological target structure and to trigger (or to block) its biological response" [2]. This abstract representation captures the essential chemical functionalities for biological activity without being constrained to specific molecular scaffolds.
Key Pharmacophore Features:
- Hydrogen Bond Donor/Acceptor: Represents capacity for hydrogen bonding interactions
- Hydrophobic Features: Identifies non-polar regions favorable for hydrophobic interactions
- Aromatic Features: Captures π-π stacking and cation-π interactions
- Ionic Features: Represents positive or negative ionizable centers
- Exclusion Volumes: Steric constraints preventing ligand atoms from occupying protein backbone regions [43] [2]
Pharmacophore models can be generated through ligand-based approaches (identifying common features among active ligands) or structure-based approaches (deriving features directly from protein binding sites). Protein-based pharmacophore generation typically involves mapping molecular interaction fields (MIFs) using various chemical probes on a 3D grid surrounding the binding site, followed by clustering of favorable interaction points to define pharmacophore elements [43].
Molecular Docking: Pose Prediction and Scoring
Molecular docking aims to predict the bound conformation (pose) of a small molecule within a protein binding site and estimate its binding affinity through scoring functions. The process involves two main components: a search algorithm that explores the conformational space of the ligand-receptor complex, and a scoring function that ranks the generated poses [92].
Conformational Search Algorithms:
- Systematic Methods: Explore conformational space by systematically rotating rotatable bonds (e.g., Glide, FRED)
- Incremental Construction: Builds ligands fragment-by-fragment within binding site (e.g., FlexX, DOCK)
- Stochastic Methods: Utilize random sampling and probabilistic acceptance (e.g., Monte Carlo, Genetic Algorithms as in AutoDock, GOLD) [92]
Scoring functions typically combine physical force field terms with empirical parameters to estimate binding free energy, though accurate prediction remains challenging due to the complexity of molecular recognition events [92].
Technical Comparison: Methodologies and Applications
Table 1: Fundamental Characteristics of Pharmacophore Modeling and Molecular Docking
| Parameter | Pharmacophore Modeling | Molecular Docking |
|---|---|---|
| Fundamental Principle | Abstract representation of interaction features | Prediction of precise binding geometry and affinity |
| Spatial Representation | 3D arrangement of chemical features | Atomic-level coordinates of ligand and receptor |
| Primary Output | Pharmacophore hypothesis with defined features | Ligand pose with binding orientation and score |
| Speed | Fast screening of large compound libraries | Computationally intensive, especially with flexibility |
| Handling of Flexibility | Limited to conformational ensembles | Explicit through search algorithms |
| Application Focus | Feature-based virtual screening, scaffold hopping | Pose prediction, binding mode analysis, lead optimization |
| Key Limitations | May miss novel interaction types, distance sensitivity | Scoring function inaccuracies, limited receptor flexibility |
Implementation Workflows
Pharmacophore Model Development:
Protein-based pharmacophore generation typically follows a multi-step process. First, a 3D grid with appropriate spacing (e.g., 0.4 Å) is placed in the binding site. Interaction potentials between protein atoms and probe atoms are computed using scoring functions like ChemScore for hydrogen-bonding and hydrophobic interactions [43]. Pharmacophore elements are then generated through clustering algorithms - k-means clustering for hydrophobic features, and functional group-specific clustering for directional interactions like hydrogen bonding. The clustering cutoff distance significantly impacts model quality, with values typically ranging from 1.0-3.0 Å [43]. The interaction range for pharmacophore generation (IRFPG) must be optimized, with common cutoffs of 2.5-3.0 Å for hydrogen bonds and 4.0-5.0 Å for hydrophobic interactions [43]. Model validation is crucial, employing methods like decoy sets with enrichment factor (EF) calculations and receiver operating characteristic (ROC) curve analysis [6] [93].
Molecular Docking Protocol:
Meaningful docking requires thorough preparation of both receptor and ligand structures. Protein preparation involves adding hydrogen atoms, correcting protonation states, and optimizing side-chain orientations [92]. Ligands must be prepared with proper ionization states and tautomers. The binding site must be carefully defined, typically based on known ligand positions or functional residues. Selection of appropriate search parameters is critical - for genetic algorithms, population size, mutation rates, and generation numbers must be balanced between thorough sampling and computational cost [92]. Post-docking analysis should include careful inspection of predicted poses for chemical rationality and complementarity to the binding site, not merely reliance on ranking scores [92].
Performance Metrics and Validation
Table 2: Quantitative Performance Assessment Metrics
| Metric | Pharmacophore Modeling | Molecular Docking |
|---|---|---|
| Primary Validation Metrics | Enrichment Factor (EF), Area Under Curve (AUC) of ROC, Hit Rate | Root Mean Square Deviation (RMSD) from experimental pose, Binding Affinity Correlation |
| Typical Benchmark Performance | EF > 2-3, AUC > 0.7-0.8 considered acceptable [6] [93] | RMSD < 2.0 Å considered successful pose prediction [92] |
| Key Strengths | Rapid screening (104-106 compounds/hour), scaffold hopping capability | Atomic-level interaction analysis, binding mode prediction |
| Common Limitations | Limited to predefined feature types, sensitive to conformation | Scoring function inaccuracies, limited receptor flexibility, high computational cost |
Synergistic Integration in Drug Discovery Workflows
Rather than being mutually exclusive, pharmacophore modeling and molecular docking are increasingly combined in hierarchical virtual screening protocols that leverage their complementary strengths.
Combined Workflow Strategies
A typical integrated approach begins with pharmacophore-based screening to rapidly reduce chemical library size by 90-95%, followed by molecular docking of the enriched compound set for more precise evaluation [94] [91] [6]. This strategy was successfully applied in identifying VEGFR-2 and c-Met dual inhibitors, where pharmacophore screening of over 1.28 million compounds from the ChemDiv database efficiently enriched potential hits, which were subsequently processed through molecular docking to identify 18 promising candidates [93]. Similarly, in searching for novel Akt2 inhibitors, structure-based and 3D-QSAR pharmacophore models were used as initial filters, with resulting hits subjected to docking studies that identified seven promising leads with diverse scaffolds [6].
Another powerful integration uses pharmacophore constraints within docking protocols to guide pose generation toward biologically relevant interaction patterns. This hybrid approach is particularly valuable for targets with known key interactions that must be preserved.
Diagram 1: Integrated Virtual Screening Workflow combining pharmacophore modeling, molecular docking, and molecular dynamics simulations. This hierarchical approach leverages the strengths of each method for efficient hit identification.
Advanced Applications and Emerging Trends
Recent advances include machine learning-enhanced methods for both techniques. For pharmacophore modeling, novel approaches like PharmacoForge employ diffusion models to generate 3D pharmacophores conditioned on protein pockets, demonstrating improved performance in benchmark studies [95]. Molecular docking benefits from improved scoring functions incorporating machine learning and better handling of protein flexibility through ensemble docking and molecular dynamics simulations [92].
The integration extends to post-docking analysis through molecular dynamics (MD) simulations, which assess binding stability and account for induced fit effects not captured by static docking. As demonstrated in SARS-CoV-2 PLpro inhibitor identification, MD simulations following pharmacophore screening and docking provided critical insights into protein-ligand complex stability and domain movements [91].
Experimental Protocols and Research Reagents
Key Experimental Protocols
Structure-Based Pharmacophore Generation Protocol (Based on Discovery Studio):
- Protein Preparation: Obtain crystal structure from PDB database. Remove water molecules, add hydrogen atoms, correct missing residues and bonds, minimize energy using CHARMM force field [6] [93].
- Binding Site Definition: Define binding site as sphere within 7.0 Å distance from reference ligand or known active site residues [6].
- Interaction Generation: Use Interaction Generation protocol to map all possible protein-ligand interaction points using six standard pharmacophore features: hydrogen bond acceptor (HBA), hydrogen bond donor (HBD), positive ionizable, negative ionizable, hydrophobic, and aromatic ring features [93].
- Feature Clustering: Edit and cluster pharmacophoric features to remove redundancy while retaining catalytically important features. Set minimum features to 4 and maximum to 6 [6] [93].
- Exclusion Volumes: Add exclusion volume spheres to represent protein backbone atoms and steric restrictions [43] [6].
- Model Validation: Validate using decoy sets with known actives and inactives. Calculate enrichment factor (EF) and area under ROC curve (AUC). Models with EF > 2 and AUC > 0.7 are considered reliable [6] [93].
Molecular Docking Protocol (Based on AutoDock/GOLD):
- Receptor Preparation: Prepare protein structure by adding polar hydrogens, assigning partial atomic charges (Gasteiger charges), and defining solvation parameters [92] [91].
- Ligand Preparation: Generate 3D structures, minimize energy, assign flexible torsions, and determine probable protonation states at physiological pH [92].
- Binding Site Definition: Define grid box centered on binding site with sufficient dimensions to allow ligand rotation (typically 60×60×60 points with 0.375 Å spacing) [91].
- Docking Parameters: For genetic algorithm, set population size to 150-300, number of generations to 27,000-50,000, mutation rate of 0.02, and crossover rate of 0.8. Perform multiple runs (10-100) per ligand [92] [6].
- Pose Selection and Analysis: Cluster resulting poses by RMSD tolerance (typically 2.0 Å), select lowest energy representative from largest cluster. Analyze protein-ligand interactions for key hydrogen bonds, hydrophobic contacts, and π-interactions [92] [6].
Essential Research Reagent Solutions
Table 3: Key Computational Tools and Resources for Virtual Screening
| Tool/Resource | Type | Primary Function | Application Context |
|---|---|---|---|
| Discovery Studio | Software Suite | Pharmacophore modeling, molecular docking, ADMET prediction | Comprehensive drug design platform with automated pharmacophore generation capabilities [6] [93] |
| AutoDock/AutoDock Vina | Docking Program | Molecular docking with genetic algorithm and gradient optimization | Academic and research use with good balance of speed and accuracy [92] [91] |
| GOLD | Docking Program | Genetic algorithm-based docking with flexible protein sidechains | High-performance docking particularly for metalloenzymes and diverse targets [92] [6] |
| Glide | Docking Program | Systematic search and Monte Carlo-based docking with hierarchical filtering | High-accuracy pose prediction in lead optimization stages [92] |
| ChemDiv Database | Compound Library | >1.28 million commercially available screening compounds | Primary source for virtual screening hits [93] |
| ZINC Database | Public Compound Library | >230 million purchasable compounds in ready-to-dock formats | Large-scale virtual screening and hit identification [6] [95] |
| PDBbind Database | Curated Database | Experimentally determined protein-ligand complexes with binding data | Benchmarking and validation of docking and pharmacophore methods [43] |
| LIT-PCBA | Benchmark Set | Validated bioactivity data for machine learning and method evaluation | Performance assessment of virtual screening methods [95] |
Pharmacophore modeling and molecular docking represent complementary paradigms in structure-based virtual screening, each with distinct advantages and limitations. Pharmacophore modeling excels in rapid feature-based screening and scaffold hopping, while molecular docking provides atomic-resolution insights into binding modes and interactions. The most effective contemporary drug discovery pipelines strategically integrate both methods, often supplemented by molecular dynamics simulations and machine learning approaches, to leverage their synergistic potential. As both methodologies continue to evolve through improved algorithms and integration with artificial intelligence, their combined application promises to further accelerate the identification and optimization of novel therapeutic agents across diverse target classes.
The rational identification of bioactive molecules is a cornerstone of drug discovery, and the concept of the pharmacophore—defined as the ensemble of steric and electronic features necessary for molecular recognition—has long been a fundamental tool in this process. Traditional pharmacophore modeling relied on static representations derived from a handful of ligand-bound structures or known active compounds, limiting its ability to capture the dynamic nature of biological systems and explore novel chemical space. The integration of Artificial Intelligence (AI) and Machine Learning (ML) is now fundamentally transforming pharmacophore feature representation, enabling researchers to move from static, hypothesis-driven models to dynamic, data-driven, and predictive frameworks.
This paradigm shift addresses critical limitations of conventional methods. Traditional approaches struggled with highly flexible binding sites, often failed to generalize to novel chemotypes, and provided limited guidance for exploring uncharted chemical territory. Modern AI-driven methodologies leverage vast datasets, complex algorithms, and biophysical simulations to create more biologically relevant and predictively powerful representations of molecular features. By learning the intricate relationships between chemical structure, molecular features, and biological activity, these approaches are accelerating the identification and optimization of lead compounds across diverse therapeutic targets, from neurodegenerative diseases to cancer.
Technical Foundations: AI-Driven Molecular Representation
The efficacy of any AI-driven pharmacophore model hinges on how molecules and their features are represented computationally. Recent advancements have moved beyond traditional descriptors and fingerprints to more sophisticated, learned representations.
From Classical Descriptors to Learned Embeddings
Traditional molecular representation methods, such as extended-connectivity fingerprints (ECFPs) and molecular descriptors, rely on predefined, rule-based feature extraction. While computationally efficient and interpretable, these methods often struggle to capture the subtle and complex relationships between molecular structure and biological function [96].
AI-driven approaches employ deep learning techniques to learn continuous, high-dimensional feature embeddings directly from large and complex datasets:
- Graph Neural Networks (GNNs): Model molecules as graphs with atoms as nodes and bonds as edges. GNNs learn to aggregate information from local atomic environments to create holistic molecular representations that capture both topological and feature-based information [19] [96]. These are particularly suited for representing spatially distributed pharmacophore features.
- Language Model-Based Representations: Treat molecular line notations (e.g., SMILES) as a specialized chemical language. Transformer-based models, like BERT, learn contextual embeddings for atoms and substructures, capturing semantic relationships within the chemical "syntax" [96].
- Multimodal and Contrastive Learning: Combine multiple representation types (e.g., structural, physico-chemical, sequence-based) to create more robust feature embeddings. Contrastive learning frameworks improve representation quality by learning to distinguish similar and dissimilar molecular pairs in the latent space [96].
Representing Pharmacophores for AI Consumption
For AI models to process pharmacophores, the abstract concept of spatially distributed chemical features must be translated into a structured, machine-readable format. The PGMG framework (Pharmacophore-Guided deep learning approach for bioactive Molecule Generation) represents a pharmacophore hypothesis as a complete graph, where each node corresponds to a pharmacophore feature (e.g., hydrogen bond donor, acceptor, hydrophobic region) [19]. The spatial information between features is encoded as the distance between each node pair, often using the shortest-path distances on the molecular graph as a proxy for Euclidean distances in 3D space. This graph-based representation allows GNNs to effectively learn the critical patterns and relationships that define bioactive molecules.
AI-Enhanced Methodologies for Dynamic Feature Identification
Ensemble Pharmacophore Modeling from Molecular Dynamics
Static crystal structures provide a single snapshot of a protein-ligand interaction, often missing the dynamic spectrum of binding site conformations. AI-enhanced dynamic pharmacophore modeling addresses this limitation by integrating Molecular Dynamics (MD) simulations with machine learning to identify critical, conformationally persistent features.
The dyphAI methodology exemplifies this approach by creating an ensemble pharmacophore model that captures key protein-ligand interactions across multiple conformational states. This is particularly valuable for targets with high binding pocket flexibility, such as G protein-coupled receptors (GPCRs) and nuclear hormone receptors [97] [65] [98].
Table 1: Key Components of AI-Enhanced Dynamic Pharmacophore Modeling
| Component | Description | AI/ML Integration |
|---|---|---|
| MD Simulation | Generates an ensemble of protein conformations to capture binding site dynamics. | Provides training data for ML models; reveals transient features. |
| Binding Site Pharmacophore Generation | Identifies potential pharmacophore features (HBD, HBA, hydrophobic, aromatic, ionic) within the binding pocket of each MD frame. | Features are clustered and analyzed for persistence and energy favorability. |
| Feature Selection & Ranking | ML algorithms (ANOVA, Mutual Information, Spearman correlation) identify pharmacophore features most predictive of ligand binding conformations. | Prioritizes biologically relevant features, improving model specificity. |
| Consensus Pharmacophore Model | Integrates selected features into a unified model representing the essential interaction landscape for ligand binding. | Ensemble approach increases robustness and predictive power for virtual screening. |
A recent study applied this framework to four GPCR targets (Adenosine A2A receptor, β2-adrenergic receptor, δ and κ-type opioid receptors). Using 3,000 MD conformations per protein, researchers generated binding site pharmacophores and applied ML-based feature ranking. This approach demonstrated significant enrichment of true positive ligands—improving database enrichment by up to 54-fold compared to random selection—by identifying pharmacophore features uniquely associated with ligand-selected conformations [98].
Water-Based Pharmacophore (WP) Modeling
Hydration patterns in a protein's binding site provide crucial information about the optimal placement of ligand functional groups. The Water Pharmacophore (WP) method constructs pharmacophore models solely from the analysis of water interactions with the protein surface observed in MD simulations, providing a powerful strategy when known active ligands are scarce [7].
The WP methodology involves:
- Hydration Site Analysis: MD simulations of the hydrated binding site identify localized water positions ("hydration sites") with favorable thermodynamics.
- Feature Assignment: Each hydration site is classified as a specific pharmacophore feature (e.g., Hydrogen Bond Donor (HBD), Hydrogen Bond Acceptor (HBA), hydrophobic) based on its energetic and hydrogen-bonding characteristics.
- Model Optimization: Feature positions are refined through energy minimization or hydrogen-bond-constrained docking with simple probe molecules (e.g., water for HBD/HBA, methane for hydrophobic features) [7].
This method has been successfully validated across seven pharmaceutically relevant targets, demonstrating enrichment performance comparable to, and sometimes surpassing, conventional docking-based virtual screening [7].
Deep Learning for Pharmacophore-Guided Molecule Generation
Beyond feature identification, AI is revolutionizing the de novo design of molecules that match specific pharmacophore patterns. The PGMG framework uses a graph neural network to encode spatially distributed chemical features and a transformer decoder to generate molecular structures that satisfy the input pharmacophore [19].
A key innovation in PGMG is the introduction of latent variables to model the many-to-many relationship between pharmacophores and molecules. This enables the generation of structurally diverse compounds that all satisfy the same fundamental pharmacophore constraints, facilitating scaffold hopping—the discovery of new core structures with similar biological activity [19] [96]. In evaluations, PGMG generated molecules with strong docking affinities while maintaining high scores of validity, uniqueness, and novelty, demonstrating its potential for both ligand-based and structure-based drug design [19].
Performance and Validation: Quantitative Comparisons
The ultimate test for any AI-enhanced method is its performance in practical drug discovery scenarios. Quantitative comparisons reveal significant advantages over traditional approaches.
Table 2: Performance Comparison of AI-Enhanced vs. Traditional Methods
| Method | Key Performance Metrics | Advantages Over Traditional Methods |
|---|---|---|
| ML-Accelerated Virtual Screening [99] | - 1000x faster than classical docking- High correlation with actual docking scores- Discovered novel MAO-A inhibitors with 33% inhibition | Dramatically reduces computational time for screening ultra-large libraries; not limited by scarce experimental activity data. |
| Ensemble ML Pharmacophore (dyphAI) [97] [98] | - Up to 54-fold enrichment in true positive identification- Identified novel AChE inhibitors with IC₅₀ ≤ control (galantamine) | Captures binding site flexibility; identifies key features driving conformational selection; highly interpretable. |
| Water Pharmacophore (WP) [7] | - Enrichment factors comparable to docking- Successful identification of known binders without ligand information | Functions in the absence of known active ligands; provides unique insight into essential binding interactions. |
| Pharmacophore-Guided Generation (PGMG) [19] | - High novelty and uniqueness scores- Molecules with strong predicted binding affinities | Enables de novo design of novel scaffolds matching target pharmacophores; addresses data scarcity. |
Implementing AI-enhanced pharmacophore modeling requires a combination of computational tools, software, and data resources.
Table 3: Essential Research Reagent Solutions for AI-Enhanced Pharmacophore Modeling
| Resource Category | Specific Tools / Databases | Function in Workflow |
|---|---|---|
| Molecular Dynamics Software | AMBER, GROMACS, Schrödinger Suite | Generates ensembles of protein conformations for dynamic pharmacophore modeling and hydration site analysis. |
| Pharmacophore Modeling Platforms | Schrödinger PHASE, MOE (Molecular Operating Environment) | Provides tools for feature identification, model generation, and virtual screening against pharmacophore hypotheses. |
| AI/ML Frameworks & Models | Graph Neural Networks (PyTorch Geometric, DGL), Transformers, scikit-learn | Core algorithms for learning molecular representations, ranking features, and generating new molecules. |
| Chemical Databases | ZINC, ChEMBL, BindingDB | Sources of compounds for virtual screening and training data for ML models (known activities, structures). |
| Docking & Scoring Software | Smina, Glide, GOLD | Validates AI predictions and provides training data for ML models predicting docking scores. |
Integrated Workflow and Visualization
A typical integrated workflow for AI-enhanced pharmacophore feature representation combines multiple computational approaches, from simulation to validation. The diagram below illustrates the key stages and their relationships.
The integration of AI and machine learning with pharmacophore modeling represents a fundamental shift in how researchers represent and utilize molecular features for drug discovery. By moving from static, single-conformation models to dynamic, ensemble-based representations informed by molecular simulations and learned from vast chemical datasets, these approaches offer unprecedented insights into the complex landscape of molecular recognition. The ability to identify critical interaction features from protein dynamics alone, to generate novel molecular scaffolds that match specific pharmacophore patterns, and to accelerate virtual screening by orders of magnitude demonstrates the transformative potential of this convergence. As AI methodologies continue to evolve and integrate more deeply with biophysical principles, they will further enhance the precision, efficiency, and creative power of rational drug design.
Conclusion
Hydrogen bond acceptor, donor, and hydrophobic features constitute the indispensable core of pharmacophore models, providing a powerful abstract language for rational drug design. Success hinges on a thorough understanding of their definition, careful application of ligand- and structure-based generation methods, and diligent attention to validation. Future directions point toward the deeper integration of artificial intelligence for handling molecular flexibility, the development of sophisticated multi-target pharmacophores, and the increased use of these models in de novo design. For biomedical research, mastering these elements enables more efficient navigation of chemical space, accelerating the discovery of novel therapeutics with improved efficacy and safety profiles.
References
- 1. Pharmacophore [https://en.wikipedia.org/wiki/Pharmacophore]
- 2. Pharmacophore - an overview [https://www.sciencedirect.com/topics/medicine-and-dentistry/pharmacophore]
- 3. Pharmacophore [https://grokipedia.com/page/Pharmacophore]
- 4. Applications of the Pharmacophore Concept in Natural ... [https://pmc.ncbi.nlm.nih.gov/articles/PMC7685156/]
- 5. Setting the record straight: the origin of the pharmacophore ... [https://pubmed.ncbi.nlm.nih.gov/24745881/]
- 6. Pharmacophore Modeling, Virtual Screening, and ... [https://www.medsci.org/v10p0265.htm]
- 7. Water Pharmacophore: Designing Ligands using ... [https://www.nature.com/articles/s41598-018-28546-z]
- 8. Pharmacophore feature prediction and molecular docking ... [https://pubmed.ncbi.nlm.nih.gov/28691304/]
- 9. What is pharmacophore modeling and its applications? [https://synapse.patsnap.com/article/what-is-pharmacophore-modeling-and-its-applications]
- 10. An Improved Receptor-Based Pharmacophore Generation ... [https://www.frontiersin.org/journals/pharmacology/articles/10.3389/fphar.2018.01463/full]
- 11. Hydrogen bond [https://en.wikipedia.org/wiki/Hydrogen_bond]
- 12. Hydrogen bonds: A Simple Explanation of Why They Form [https://bitesizebio.com/79525/hydrogen-bonds/]
- 13. Efficient Black-Box Prediction of Hydrogen-Bond-Donor and ... [https://www.rowansci.com/publications/hydrogen-bond-acceptor-strength-prediction]
- 14. How to Design More Permeable Compounds? [https://drughunter.com/commentary/how-to-design-more-permeable-compounds]
- 15. Quantification of Hydrogen Bond Donating Ability ... [https://pmc.ncbi.nlm.nih.gov/articles/PMC11305090/]
- 16. Explore the molecular mechanism of hydrogen bond ... [https://www.sciencedirect.com/science/article/abs/pii/S0167732224012637]
- 17. Multiple hydrogen bonds as tools to enhance the ... [https://www.nature.com/articles/s41428-025-01098-6]
- 18. Structure‐based pharmacophore modeling for precision ... [https://pmc.ncbi.nlm.nih.gov/articles/PMC11299079/]
- 19. A pharmacophore-guided deep learning approach for ... [https://www.nature.com/articles/s41467-023-41454-9]
- 20. Structure based pharmacophore modeling, virtual ... [https://www.nature.com/articles/s41598-021-83626-x]
- 21. Machine learning models for hydrogen bond donor and ... [https://jcheminf.biomedcentral.com/articles/10.1186/s13321-019-0381-4]
- 22. Water-Based Pharmacophore Modeling in Kinase Inhibitor ... [https://pmc.ncbi.nlm.nih.gov/articles/PMC12458683/]
- 23. Pharmacophore Modeling for Targets with Extensive ... [https://www.jove.com/t/68933/pharmacophore-modeling-for-targets-with-extensive-ligand-libraries]
- 24. Hydrophobicity scales [https://en.wikipedia.org/wiki/Hydrophobicity_scales]
- 25. Identifying hydrophobic protein patches to inform ... [https://pmc.ncbi.nlm.nih.gov/articles/PMC8018078/]
- 26. Hydrophobic docking: a proposed enhancement to ... [https://pubmed.ncbi.nlm.nih.gov/7731951/]
- 27. Drug Design by Pharmacophore and Virtual Screening Approach - PMC [https://pmc.ncbi.nlm.nih.gov/articles/PMC9145410/]
- 28. Evolutionarily conserved regions and hydrophobic contacts ... [https://pmc.ncbi.nlm.nih.gov/articles/PMC2286575/]
- 29. Quantitative Determination of the Hydrophobicity ... [https://pubmed.ncbi.nlm.nih.gov/35029972/]
- 30. Rational and efficient geometric definition of ... [https://www.sciencedirect.com/science/article/abs/pii/S1359644606003655]
- 31. Optimized Hydrophobic Interactions and Hydrogen ... [https://pmc.ncbi.nlm.nih.gov/articles/PMC2922327/]
- 32. Hierarchical Graph Representation of Pharmacophore ... [https://pmc.ncbi.nlm.nih.gov/articles/PMC7793842/]
- 33. PharmRL: pharmacophore elucidation with deep geometric ... [https://bmcbiol.biomedcentral.com/articles/10.1186/s12915-024-02096-5]
- 34. A Case Study on SARS-CoV-2 Mpro [https://pubmed.ncbi.nlm.nih.gov/41082460/?utm_source=FeedFetcher&utm_medium=rss&utm_campaign=None&utm_content=14mzXgUgXxOhz72eR8oGB-fhcdG9zbPCC1041iU1Zt22GVtQAD&fc=None&ff=20251024010210&v=2.18.0.post22+67771e2]
- 35. Pharmacophore-Guided Generative Design of Novel Drug- ... [https://arxiv.org/html/2510.01480v1]
- 36. T009 · Ligand-based pharmacophores [https://projects.volkamerlab.org/teachopencadd/talktorials/T009_compound_ensemble_pharmacophores.html]
- 37. Knowledge-guided diffusion model for 3D ligand ... [https://www.nature.com/articles/s41467-025-57485-3]
- 38. Applications of the Novel Quantitative Pharmacophore Activity ... [https://pmc.ncbi.nlm.nih.gov/articles/PMC9504690/]
- 39. QPHAR: quantitative pharmacophore activity relationship [https://jcheminf.biomedcentral.com/articles/10.1186/s13321-021-00537-9]
- 40. Ligand-based Pharmacophore Modeling, Virtual Screening ... [https://www.sciencedirect.com/science/article/pii/S2001037018302617]
- 41. Receptor-Based Pharmacophore Modeling in the Search for Natural Products for COVID-19 Mpro - PMC [https://pmc.ncbi.nlm.nih.gov/articles/PMC8000608/]
- 42. What are the different types of pharmacophore? [https://synapse.patsnap.com/article/what-are-the-different-types-of-pharmacophore]
- 43. Exploring the potential of protein-based pharmacophore ... [https://pmc.ncbi.nlm.nih.gov/articles/PMC3725268/]
- 44. Structure-Based Pharmacophore Modeling, Virtual ... [https://pmc.ncbi.nlm.nih.gov/articles/PMC8777599/]
- 45. Structure-based pharmacophore modeling, virtual ... [https://www.frontiersin.org/journals/medicine/articles/10.3389/fmed.2022.1022429/full]
- 46. Structure-based pharmacophore modeling for precision ... [https://pubmed.ncbi.nlm.nih.gov/39101505/]
- 47. Concepts and Applications Exemplified on Hydroxysteroid ... [https://pmc.ncbi.nlm.nih.gov/articles/PMC6332202/]
- 48. Lead Discovery Using Virtual Screening - PMC [https://pmc.ncbi.nlm.nih.gov/articles/PMC7176223/]
- 49. Virtual Screening Algorithms in Drug Discovery: A Review ... [https://www.mdpi.com/2813-2998/2/2/17]
- 50. Pharmacophore model-aided virtual screening combined with ... [https://arabjchem.org/pharmacophore-model-aided-virtual-screening-combined-with-comparative-molecular-docking-and-molecular-dynamics-for-identification-of-marine-natural-products-as-sars-cov-2-papain-like-protease-inhibito/]
- 51. Structure-based pharmacophore modeling, virtual screening ... [https://pmc.ncbi.nlm.nih.gov/articles/PMC9877529/]
- 52. Integrating machine learning driven virtual screening and ... [https://www.nature.com/articles/s41598-025-97208-8]
- 53. Integrating virtual screening in lead discovery [https://www.sciencedirect.com/science/article/abs/pii/S1367593104000845]
- 54. An artificial intelligence accelerated virtual screening ... [https://www.nature.com/articles/s41467-024-52061-7]
- 55. Pharmacophore-based virtual screening versus docking ... [https://www.nature.com/articles/aps2009159]
- 56. Pharmacophore modeling in drug design [https://pubmed.ncbi.nlm.nih.gov/40175047/]
- 57. Structure-based molecular modeling in SAR analysis and ... [https://www.sciencedirect.com/science/article/pii/S2001037021000696]
- 58. 2.14: Organic Functional Groups- H-bond donors and H- ... [https://chem.libretexts.org/Bookshelves/Organic_Chemistry/Map%3A_Organic_Chemistry_(Wade)_Complete_and_Semesters_I_and_II/Map%3A_Organic_Chemistry_(Wade)/02%3A_Structure_and_Properties_of_Organic_Molecules/2.14%3A_Organic_Functional_Groups-_H-bond_donors_and_H-bond_acceptors]
- 59. Hydrogen Bonding: Acceptors and Donors [https://www2.chem.wisc.edu/deptfiles/genchem/netorial/modules/biomolecules/modules/dna1/hbond.htm]
- 60. Targeting the Hydrophobic Pocket of Autotaxin with Virtual ... [https://pmc.ncbi.nlm.nih.gov/articles/PMC4048651/]
- 61. Hydrophobic Effect - an overview [https://www.sciencedirect.com/topics/pharmacology-toxicology-and-pharmaceutical-science/hydrophobic-effect]
- 62. pharmacophore and structure based studies - PMC [https://pmc.ncbi.nlm.nih.gov/articles/PMC3338973/]
- 63. Natural-product-inspired potent anticancer congeners ... [https://www.sciencedirect.com/science/article/abs/pii/S0968089625003335]
- 64. Strategies for the Optimization of Natural Leads to Anticancer ... [https://pmc.ncbi.nlm.nih.gov/articles/PMC4679534/]
- 65. Pharmacophore modeling for biological targets with high ... [https://www.sciencedirect.com/science/article/pii/S2590098622000161]
- 66. In silico exploration of anticancer plant phytochemicals for ... [https://www.nature.com/articles/s41598-025-10412-4]
- 67. Knowledge-guided diffusion model for 3D ligand ... [https://pmc.ncbi.nlm.nih.gov/articles/PMC11885826/]
- 68. Molecular Docking and Structure-Based Drug Design ... [https://www.mdpi.com/1420-3049/20/7/13384]
- 69. Pharmacophore-Conditioned Diffusion Model for Ligand ... [https://arxiv.org/html/2505.10545v1]
- 70. Multiple diverse ligands binding at a single protein site [https://pmc.ncbi.nlm.nih.gov/articles/PMC2373439/]
- 71. Improved Ligand-Protein Binding Affinity Predictions Using ... [https://www.sciencedirect.com/science/article/pii/S0006349510003103]
- 72. Accurate Representation of Protein-Ligand Structural ... [https://www.mdpi.com/1422-0067/21/6/2243]
- 73. -Protein Quantifying Kinetics with Self-Assembled... Ligand Binding [https://pmc.ncbi.nlm.nih.gov/articles/PMC6995402/]
- 74. Protein Flexibility in Docking and Surface Mapping - PMC [https://pmc.ncbi.nlm.nih.gov/articles/PMC4272345/]
- 75. The new solution to the induced fit docking problem: How IFD ... [https://www.schrodinger.com/life-science/learn/white-papers/ifd-md-rapidly-reliably-predicts-accurate-ligand-binding/]
- 76. Pharmacophore modeling, molecular docking, MMGBSA ... [https://www.sciencedirect.com/science/article/pii/S2468227625001048]
- 77. Building shape-focused pharmacophore models for effective ... [https://jcheminf.biomedcentral.com/articles/10.1186/s13321-024-00857-6]
- 78. PLIP 2025: introducing protein–protein interactions to the ... [https://pmc.ncbi.nlm.nih.gov/articles/PMC12230730/]
- 79. Balancing Sensitivity and Specificity Enhances Top and ... [https://www.mdpi.com/2223-7747/14/3/308]
- 80. interactive exploration of chemical space [https://pharmit.csb.pitt.edu/help.html]
- 81. The impact of Library Size and Scale of Testing on Virtual ... [https://pmc.ncbi.nlm.nih.gov/articles/PMC11257449/]
- 82. Pharmacophore modeling and applications in drug discovery [https://www.sciencedirect.com/science/article/abs/pii/S135964461000111X]
- 83. 3D QSAR, pharmacophore and molecular docking studies ... [https://pmc.ncbi.nlm.nih.gov/articles/PMC4989538/]
- 84. Integration of the Butina algorithm and ensemble learning ... [https://www.frontiersin.org/journals/chemistry/articles/10.3389/fchem.2024.1382319/full]
- 85. Ligand-based pharmacophore modeling and molecular ... [https://pubs.rsc.org/en/content/articlehtml/2021/ra/d1ra03891e]
- 86. Pharmacophore model, docking, QSAR, and molecular ... [https://www.sciencedirect.com/science/article/pii/S2405844021007088]
- 87. Pharmacophore modeling | Medicinal Chemistry Class Notes [https://fiveable.me/medicinal-chemistry/unit-11/pharmacophore-modeling/study-guide/uZjEWlQXMHLmcu3u]
- 88. Pharmacophore Modeling, Virtual Screening, and ... [https://pmc.ncbi.nlm.nih.gov/articles/PMC3558715/]
- 89. Pharmacophores | Medicinal Chemistry Class Notes [https://fiveable.me/medicinal-chemistry/unit-4/pharmacophores/study-guide/31XPo2LTA1t5A7Fx]
- 90. Comparing pharmacophore models derived from crystal ... [https://pmc.ncbi.nlm.nih.gov/articles/PMC4785218/]
- 91. Pharmacophore model-aided virtual screening combined ... [https://www.sciencedirect.com/science/article/pii/S1878535222006505]
- 92. Ten quick tips to perform meaningful and reproducible ... [https://journals.plos.org/ploscompbiol/article?id=10.1371/journal.pcbi.1013030]
- 93. Pharmacophore screening, molecular docking, and MD ... [https://www.frontiersin.org/journals/pharmacology/articles/10.3389/fphar.2025.1534707/full]
- 94. Pharmacophore screening, molecular docking, and MD ... [https://pubmed.ncbi.nlm.nih.gov/40124780/]
- 95. Pharmacophore Generation with Diffusion Models [https://chemrxiv.org/engage/chemrxiv/article-details/68926c6b728bf9025e1ef1e5]
- 96. Recent advances in molecular representation methods and ... [https://www.nature.com/articles/s44386-025-00017-2]
- 97. dyphAI dynamic pharmacophore modeling with AI: a tool ... [https://pmc.ncbi.nlm.nih.gov/articles/PMC11865752/]
- 98. Linking machine learning and biophysical structural ... [https://pmc.ncbi.nlm.nih.gov/articles/PMC11798802/]
- 99. Machine learning accelerates pharmacophore-based ... [https://www.nature.com/articles/s41598-024-58122-7]