How 3D-QSAR Predicts Anticancer Compound Activity: A Computational Guide for Drug Discovery
This article provides a comprehensive overview of the application of 3D Quantitative Structure-Activity Relationship (3D-QSAR) modeling in predicting the activity of anticancer compounds.
How 3D-QSAR Predicts Anticancer Compound Activity: A Computational Guide for Drug Discovery
Abstract
This article provides a comprehensive overview of the application of 3D Quantitative Structure-Activity Relationship (3D-QSAR) modeling in predicting the activity of anticancer compounds. Aimed at researchers and drug development professionals, it explores the foundational principles of 3D-QSAR, detailing key methodological approaches like CoMFA and CoMSIA. The content further addresses model troubleshooting, rigorous validation protocols, and practical integration with other computational techniques such as molecular docking and dynamics simulations. By synthesizing recent case studies and advancements, this guide serves as a resource for leveraging 3D-QSAR to accelerate the rational design of novel, potent, and selective anticancer agents.
Understanding 3D-QSAR: The Foundation of Modern Anticancer Drug Design
Quantitative Structure-Activity Relationship (QSAR) modeling represents a cornerstone of modern computational chemistry, enabling researchers to correlate the chemical structure of compounds with their biological activity. While traditional QSAR methods utilize one or two-dimensional molecular descriptors, Three-Dimensional QSAR (3D-QSAR) extends this concept by incorporating the crucial three-dimensional spatial and electronic properties of molecules. This advanced approach has emerged as an indispensable predictive tool in pharmaceutical and agrochemical design, significantly decreasing the trial-and-error factor in drug development by facilitating the selection of the most promising candidates for synthesis [1].
The fundamental principle underlying all QSAR formalism is that differences in structural properties are responsible for variations in biological activities between compounds [1]. In contrast to classical QSAR, which treats molecules as collections of numerical descriptors without spatial context, 3D-QSAR considers each molecule as a three-dimensional object with specific shape characteristics and interaction potential fields surrounding it. These fields represent regions where molecular bulk may create steric hindrance or where electrostatic potentials may attract or repel binding partners [2]. By quantifying these 3D characteristics, 3D-QSAR models can predict biological activity with greater mechanistic insight and higher precision than their 2D counterparts.
The conceptual foundation of 3D-QSAR rests on the lock-and-key principle of molecular recognition, where complementary interactions between a ligand and its biological target determine binding affinity and subsequent biological effect [3]. Within computer-aided drug design (CADD), 3D-QSAR is classified as a ligand-based drug design (LBDD) approach, meaning it relies on information from known active compounds rather than the 3D structure of the target protein itself [4] [3]. When the exact structure of the biological target is unknown, 3D-QSAR becomes particularly valuable as it extracts critical pharmacophoric information from ligand properties and previously obtained experimental data [3].
Methodological Framework of 3D-QSAR
The development of a robust and predictive 3D-QSAR model follows a systematic workflow with several critical stages, each requiring careful execution to ensure model reliability and relevance.
Data Collection and Preparation
The initial phase involves assembling a dataset of compounds with experimentally determined biological activities, typically expressed as IC₅₀ or EC₅₀ values [2]. The integrity of this dataset is paramount, requiring selection of molecules that are structurally related yet sufficiently diverse to capture meaningful structure-activity relationships [2]. All activity data must be acquired under uniform experimental conditions to minimize noise and systemic bias that could compromise predictive value [2]. For QSAR modeling, IC₅₀ values (concentration required for 50% inhibition) are typically converted to pIC₅₀ (-logIC₅₀) to create a more linear relationship with free energy changes [5]. The assembled dataset is then divided into training and test sets, typically with approximately 75-80% of compounds used for model development and the remaining 20-25% reserved for external validation [6] [5].
Molecular Modeling and Alignment
With the dataset defined, 2D molecular structures are converted into three-dimensional coordinates using cheminformatics tools like RDKit or Sybyl [2]. These initial 3D structures undergo geometry optimization using molecular mechanics force fields (e.g., Universal Force Field) or more accurate quantum mechanical methods to ensure each molecule adopts a realistic, low-energy conformation [2].
Molecular alignment constitutes one of the most critical and technically demanding steps in 3D-QSAR [2]. The objective is to superimpose all molecules within a shared 3D reference frame that reflects their putative bioactive conformations [2]. This process assumes all compounds share a similar binding mode to the same biological target. Alignment can be guided by various approaches:
Table 1: Molecular Alignment Methods in 3D-QSAR
| Method | Description | Application Context |
|---|---|---|
| Maximum Common Substructure (MCS) | Identifies the largest substructure shared among a set of molecules | Useful for comparing diverse chemotypes even when scaffolds aren't clearly defined [2] |
| Bemis-Murcko Scaffold | Defines a core structure by removing all side chains and retaining only ring systems and linkers | Widely used for clustering and scaffold-based analysis of congeneric series [2] |
| Field-Based Alignment | Aligns molecules based on similarity of molecular interaction fields rather than atom positions | Handles structurally diverse molecules without identical chemical moieties [7] |
| Pharmacophore-Based Alignment | Uses key pharmacophoric features (H-bond donors/acceptors, hydrophobic centers, etc.) as alignment points | Effective when common pharmacophoric elements are known [3] |
The critical importance of proper alignment cannot be overstated, as even minor deviations from optimal superposition can introduce significant errors in subsequent model predictions [7]. Innovative approaches like the AlphaQ method perform pairwise 3D structural alignments by optimizing quantum mechanical cross-correlation with a template molecule, offering advantages for handling structurally diverse molecules without identical chemical moieties [7].
Molecular Descriptors and Field Calculation
Following alignment, 3D molecular descriptors are computed that numerically represent the steric and electrostatic environments of each molecule. The most established approaches in 3D-QSAR are:
Comparative Molecular Field Analysis (CoMFA) uses a lattice of grid points surrounding the aligned molecules [2] [8]. At each grid point, a probe atom (typically a sp³ carbon with +1 charge) measures steric (Lennard-Jones) and electrostatic (Coulombic) interaction energies with the molecule [2] [8]. This process effectively maps how a molecular "feel" its environment at various locations, creating a fingerprint-like descriptor of the molecule's 3D shape and electrostatic profile [2].
Comparative Molecular Similarity Indices Analysis (CoMSIA) extends this approach by using Gaussian-type functions to evaluate multiple molecular fields simultaneously: steric, electrostatic, hydrophobic, hydrogen bond donor, and hydrogen bond acceptor fields [2]. The Gaussian functions smooth out abrupt field changes that occur near molecular surfaces in CoMFA, making CoMSIA less sensitive to minor alignment discrepancies and enhancing interpretability across structurally diverse compounds [2].
Table 2: Comparison of CoMFA and CoMSIA Approaches
| Feature | CoMFA | CoMSIA |
|---|---|---|
| Fields Calculated | Steric and electrostatic | Steric, electrostatic, hydrophobic, H-bond donor, H-bond acceptor |
| Calculation Method | Lennard-Jones and Coulomb potentials on a 3D grid | Gaussian-type similarity functions |
| Sensitivity to Alignment | Highly sensitive; precise alignment crucial | More robust to small alignment changes |
| Application Scope | Best for congeneric series with high structural similarity | Suitable for structurally diverse datasets |
| Interpretation | May have abrupt field changes near molecular surfaces | Smoother field transitions enhance interpretability |
Model Building and Validation
With descriptors computed for all training set molecules, the next step establishes a mathematical relationship between the 3D descriptor values and biological activity. Partial Least Squares (PLS) regression is the most commonly used statistical technique in 3D-QSAR studies, as it effectively handles the large number of highly correlated descriptors generated by field calculation methods [2] [5]. PLS projects the descriptor variables into a smaller set of latent variables that maximize the covariance between descriptor blocks and the response variable (biological activity) [5].
Model validation represents a critical phase in 3D-QSAR development to ensure predictive reliability for new compounds. Multiple validation strategies are employed:
- Internal Validation: Typically performed through cross-validation techniques like leave-one-out (LOO), where each compound is sequentially excluded from training and predicted by a model built from remaining compounds [2] [8].
- External Validation: Uses the previously reserved test set compounds to evaluate model predictivity on completely unknown data [8] [5].
- Statistical Metrics: Model quality is quantified using parameters including R² (goodness-of-fit), Q² (cross-validated correlation coefficient), and R²pred (predictive correlation coefficient for test set) [2] [5]. Robust models typically exhibit high values for all metrics (Q² > 0.5, R²pred > 0.6) [6] [5].
- Applicability Domain Analysis: Determines the chemical space region where model predictions can be considered reliable [5].
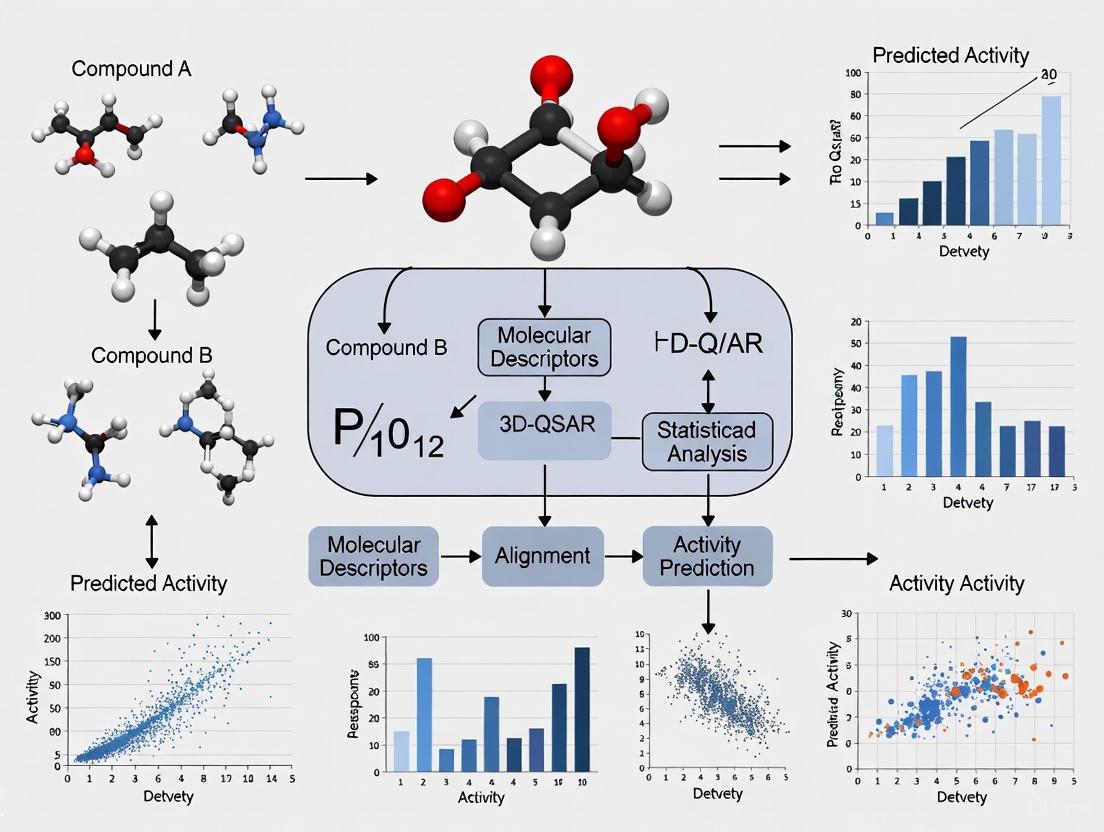
The following diagram illustrates the complete 3D-QSAR workflow from data preparation to model application:
3D-QSAR in Anticancer Drug Discovery: A Case Study on PI3Kα Inhibitors
The application of 3D-QSAR in anticancer drug discovery is effectively illustrated by recent research on PI3Kα inhibitors. Phosphatidylinositol 3-kinase (PI3K) has emerged as a promising molecular target for novel anticancer agents, with selective inhibition of the PI3Kα isoform representing a favorable strategy for achieving therapeutic efficacy with improved safety profiles [9].
In a comprehensive CADD study, benzoxazepine and thiazole derivatives were investigated through integrated computational approaches including molecular dynamics, ensemble docking, and 3D-QSAR studies [9]. The research aimed to identify structural features critical for PI3Kα activity and selectivity over other isoforms (PI3Kβ, PI3Kγ, PI3Kδ). The 3D-QSAR analysis revealed key structural determinants for potent and selective PI3Kα inhibition:
- Specific molecular interactions with αVal851 in the hinge region were identified as crucial for PI3Kα inhibition [9].
- Additional substructures binding to the hydrophobic region, particularly interacting with αGln859, contributed significantly to isoform selectivity [9].
- The 3D-QSAR predictions guided scaffold-hopping and R-group replacement strategies to design structurally diverse PI3Kα inhibitors with improved selectivity profiles [9].
This case study demonstrates how 3D-QSAR contour maps provide visual guidance for medicinal chemists by identifying spatial regions where specific molecular features enhance or diminish biological activity. For example, steric contour maps highlight regions where adding bulky groups is favorable (green contours) or unfavorable (yellow contours), while electrostatic maps indicate areas that benefit from electronegative (red) or electropositive (blue) groups [2]. These visualizations translate complex statistical models into intuitive design rules for optimizing anticancer compounds.
The outcome of this integrated computational approach was the identification of new chemotypes with selective PI3Kα inhibitory potential, including chromeno[3,4-d]imidazole, 2H-benzo[b][1,4]oxazine, and quinoline derivatives [9]. This exemplifies how 3D-QSAR establishes a rational framework for anticancer drug design, providing foundation for the development of targeted therapies with potentially improved efficacy and reduced off-target effects.
Successful implementation of 3D-QSAR in anticancer drug discovery requires specialized computational tools and resources. The following table summarizes key components of the 3D-QSAR research toolkit:
Table 3: Essential Research Reagents and Computational Resources for 3D-QSAR
| Tool Category | Specific Tools | Function in 3D-QSAR Workflow |
|---|---|---|
| Cheminformatics Software | RDKit, ChemOffice | Convert 2D structures to 3D coordinates; generate molecular descriptors [2] [6] |
| 3D-QSAR Specialized Platforms | FLARE, Sybyl | Perform molecular alignment, field calculations, and PLS regression modeling [6] |
| Molecular Visualization | Discovery Studio Visualizer | Analyze contour maps and ligand-receptor interactions [6] |
| Protein Structure Databases | RCSB PDB | Source experimental protein structures for structure-based alignment [6] |
| Compound Libraries | PubChem | Access chemical structures and properties for dataset assembly [6] |
| Force Field Packages | UFF, AMBER, CHARMM | Geometry optimization and molecular dynamics simulations [2] |
| Quantum Chemical Software | Gaussian, ORCA | Calculate quantum mechanical descriptors (electrostatic potentials) [7] |
Advanced computational infrastructure has significantly enhanced 3D-QSAR capabilities in recent years. Structure prediction tools like AlphaFold have revolutionized protein structure determination, enabling more accurate structure-based alignments when experimental structures are unavailable [4]. Similarly, integration of quantum mechanical descriptors has demonstrated improved predictive capability compared to traditional empirical potential functions [7]. In one recent application, quantum mechanical electrostatic potential (ESP) descriptors combined with artificial neural network algorithms yielded highly predictive 3D-QSAR models for hERG channel blockers, with squared correlation coefficients exceeding 0.79 for external test sets [7].
The continuing evolution of these computational resources ensures that 3D-QSAR remains at the forefront of anticancer drug discovery, providing increasingly sophisticated and predictive models to guide therapeutic design.
3D-QSAR represents a mature yet continuously evolving methodology within the computer-aided drug design landscape. By leveraging the three-dimensional structural and electronic properties of molecules, 3D-QSAR provides critical insights into the molecular determinants of biological activity that extend beyond conventional 2D QSAR approaches. The integration of 3D-QSAR with complementary computational techniques—including molecular docking, molecular dynamics simulations, and virtual screening—creates a powerful framework for rational drug design and optimization.
In the specific context of anticancer compound discovery, 3D-QSAR has demonstrated significant utility in identifying critical structural features governing target inhibition and selectivity, as exemplified by the PI3Kα inhibitor case study. The methodology's ability to translate complex structural-activity relationships into visual contour maps provides medicinal chemists with intuitive guidance for molecular design. Furthermore, ongoing advancements in computational infrastructure, including improved alignment algorithms, quantum mechanical descriptors, and machine learning integration, continue to enhance the predictive power and application scope of 3D-QSAR models.
As anticancer drug discovery increasingly focuses on targeted therapies with precise mechanism of action, the role of 3D-QSAR in elucidating subtle structure-activity relationships will remain indispensable. By enabling rational design of compounds with optimized potency, selectivity, and safety profiles, 3D-QSAR contributes significantly to the development of next-generation anticancer therapeutics with improved clinical outcomes.
In modern anticancer drug discovery, the high failure rates and immense costs associated with developing new therapies necessitate more efficient approaches. Quantitative Structure-Activity Relationship (QSAR) modeling represents a computational cornerstone in this endeavor, mathematically linking a chemical compound's structure to its biological activity. The transition from traditional 2D-QSAR to three-dimensional (3D) methods marks a critical evolution, enabling researchers to account for the spatial and electronic properties that govern molecular interactions with cancer-related biological targets. These integrative computational strategies are now indispensable for prioritizing promising drug candidates, reducing reliance on animal testing, and guiding rational chemical modifications to improve efficacy [10] [11].
Within oncology, 3D-QSAR techniques are particularly valuable for understanding how potential drug molecules interact with specific cancer targets, such as aromatase in breast cancer or tubulin in various carcinomas. By employing 3D-QSAR-based pharmacophore modeling and molecular field analysis, researchers can decode the essential structural features required for anticancer activity and predict the potency of novel compounds before they are ever synthesized. This review details the core principles of these methods, focusing on their application in predicting anticancer compound activity, and provides a detailed examination of the methodologies, validation techniques, and practical implementations that define the current state of the field [10] [12].
Theoretical Foundations and Key Concepts
The Fundamental Principle of 3D-QSAR
3D-QSAR models operate on the principle that the biological activity of a compound (such as its potency against a cancer cell line) is a function of its three-dimensional molecular properties. Unlike conventional QSAR, which uses generalized physicochemical descriptors, 3D-QSAR incorporates spatial and electronic characteristics relative to a defined molecular conformation and alignment. The general form of this relationship can be expressed as:
Biological Activity = f(Steric Field, Electrostatic Field, ...other 3D properties...)
Where the function 'f' is derived through statistical analysis of a training set of molecules with known activities [11]. These models aim to identify and quantify the critical regions around molecules where changes in steric bulk or electrostatic potential enhance or diminish biological activity. The resulting contour maps provide visual guidance for medicinal chemists, indicating where structural modifications are likely to improve compound potency [13].
Core Components of 3D-QSAR
- Molecular Alignment: The accurate superposition of training set molecules into a common coordinate system is a critical first step, typically based on their presumed binding mode or common pharmacophoric features [13].
- Molecular Fields: These are computed properties sampled in 3D space around the aligned molecules. The most common are:
- Steric (van der Waals) Fields: Representing shape and bulk.
- Electrostatic (Coulombic) Fields: Representing charge distribution.
- Statistical Correlation: Techniques like Partial Least Squares (PLS) regression correlate the variations in molecular field values with variations in biological activity across the compound set [13].
Methodological Framework
Pharmacophore Hypothesis Generation
The pharmacophore represents the essential, minimal set of structural features necessary for a molecule to interact with its biological target. In 3D-QSAR studies, pharmacophore modeling often serves as the foundation for molecular alignment. The generation of pharmacophore hypotheses is a systematic process [12]:
- Feature Identification: The software identifies potential pharmacophoric features (e.g., hydrogen bond donors, hydrogen bond acceptors, aromatic rings, hydrophobic regions) present in a set of active molecules.
- Hypothesis Generation: Multiple pharmacophore models are created by finding common feature configurations among the active compounds. For example, a study on tubulin inhibitors identified a six-point pharmacophore model, AAARRR.1061, consisting of three hydrogen bond acceptors (A) and three aromatic rings (R) [12].
- Hypothesis Scoring and Selection: Generated models are ranked based on a survival score, which evaluates how well the hypothesis explains the biological activity data and the geometric fit of the compounds. The model with the highest correlation coefficient (R²), cross-validation coefficient (Q²), and F value is typically selected for subsequent 3D-QSAR studies [12].
Table 1: Representative Pharmacophore Model Validation Statistics
| Model Name | R² | Q² | F Value | Features | Target |
|---|---|---|---|---|---|
| AAARRR.1061 [12] | 0.865 | 0.718 | 72.3 | 3 HBA, 3 Ar | Tubulin |
| Example Model 2 | >0.8 | >0.6 | N/A | Variable | Variable |
Molecular Field Analysis: SOMFA
Self-Organizing Molecular Field Analysis (SOMFA) is a grid-based, alignment-dependent 3D-QSAR technique that uses molecular shape and electrostatic potential to build predictive models. The detailed protocol is as follows [13]:
- Data Set Curation: A series of compounds (e.g., 24 quinazoline derivatives as HER2 inhibitors) with known biological activity (pIC₅₀ = -logIC₅₀) is compiled from literature.
- Conformational Sampling and Alignment:
- The lowest energy conformation of each molecule is determined using molecular mechanics (e.g., MM+) and semi-empirical methods (e.g., AM1).
- A reference compound is selected, and all other molecules are superimposed onto it using an atom-based alignment method to minimize the root-mean-square (RMS) deviation of selected atoms.
- Molecular Field Calculation:
- A common 3D grid is defined that encompasses all aligned molecules.
- For each molecule, two master variables are calculated at every grid point:
- Shape Value: The relative distance from the grid point to the molecular surface.
- Electrostatic Value: The molecular electrostatic potential at that grid point.
- PLS Analysis and Model Validation:
- The generated field data (independent variables) are correlated with the biological activity (dependent variable) using Partial Least Squares (PLS) regression.
- The model is validated through leave-one-out (LOO) cross-validation, yielding a cross-validated correlation coefficient (q²). A model with a q² > 0.5 is generally considered predictive.
- The final model is assessed by its non-cross-validated correlation coefficient (r²) and F-test value.
Table 2: Statistical Outcomes of a Representative SOMFA Study on HER2 Inhibitors
| Conformation Source | q² (LOO) | r² (non-CV) | F-test Value | Reference |
|---|---|---|---|---|
| AutoDock Vina | 0.767 | 0.815 | 97.22 | [13] |
| HyperChem | 0.662 | 0.792 | 81.92 | [13] |
| AutoDock 4.2 | 0.608 | 0.782 | 76.45 | [13] |
Integrated Computational Strategies in Practice
Synergy with Other In-Silico Methods
Modern anticancer drug discovery rarely relies on 3D-QSAR alone. It is most powerful when integrated into a combined computational strategy. A representative study on aromatase inhibitors for breast cancer exemplifies this integrated approach [10]:
- Initial Screening with 3D-QSAR and ANN: Predictive 3D-QSAR models, sometimes enhanced with non-linear Artificial Neural Networks (ANN), are built and rigorously validated. These models virtually screen and prioritize novel drug candidates (e.g., L1-L12) based on predicted activity.
- Molecular Docking: The top-ranked candidates are subjected to molecular docking studies to evaluate their binding mode and affinity within the target's active site (e.g., the aromatase enzyme). This step helps confirm the structural basis for the activity predicted by QSAR.
- ADMET Prediction: The absorption, distribution, metabolism, excretion, and toxicity (ADMET) profiles of the candidates are predicted in silico to filter out compounds with unfavorable pharmacokinetic or toxicological properties.
- Stability and Binding Affinity Assessment: Molecular dynamics (MD) simulations are run over time (e.g., 100 ns) to assess the stability of the protein-ligand complex in a simulated biological environment. The binding free energy is often calculated precisely using MM-PBSA (Molecular Mechanics Poisson-Boltzmann Surface Area) methods.
- Retrosynthetic Analysis: Finally, for the most promising hit (e.g., candidate L5), a feasible synthetic route is proposed via retrosynthetic analysis, bridging the gap between in-silico design and laboratory synthesis [10].
Advanced Topics: Model Diversity and Visualization
Given the stochastic nature of many feature selection algorithms used in QSAR, it is common to generate multiple models. A key challenge is identifying whether different models capture unique molecular properties or are functionally equivalent due to correlated descriptors. A correlation-based model similarity measure has been developed to address this [14].
This method calculates the similarity between two feature sets by considering the Pearson correlation coefficient between their descriptors. The pairwise similarities between all models can then be visualized using dimensionality reduction techniques like Stochastic Proximity Embedding (SPE). On the resulting 2D map, each point represents a QSAR model, and the distances between points reflect the similarities of the underlying feature sets. This visualization allows researchers to easily identify clusters of closely related models and select a diverse, non-redundant set of models for further analysis or to create a more robust ensemble predictor [14].
The Scientist's Toolkit: Essential Research Reagents and Software
Table 3: Essential Computational Tools for 3D-QSAR in Anticancer Research
| Tool Category | Example Software/Resource | Primary Function |
|---|---|---|
| Descriptor Calculation | PaDEL-Descriptor, Dragon, RDKit [11] | Generates numerical representations (descriptors) of molecular structures from chemical input. |
| Molecular Docking | AutoDock 4, AutoDock Vina [13] | Predicts the optimal binding orientation and affinity of a small molecule within a protein's binding site. |
| Molecular Dynamics | GROMACS, CHARMM [10] | Simulates the physical movements of atoms and molecules over time to assess complex stability. |
| Pharmacophore Modeling | Phase (Schrödinger), MOE | Creates and validates pharmacophore hypotheses from a set of active molecules. |
| 3D-QSAR Specific | SOMFA Software [13] | Performs Self-Organizing Molecular Field Analysis to build 3D-QSAR models. |
| Data Set Curation | PubChem, ChEMBL | Provides public repositories of chemical structures and associated bioactivity data for training models. |
The journey from a pharmacophore hypothesis to a refined molecular field analysis model encapsulates the power of computational rational design in modern oncology research. Techniques like 3D-QSAR and SOMFA provide a quantitative and visual framework to understand the intricate relationships between molecular structure and anticancer activity. As the field advances, the integration of these methods with artificial intelligence, robust validation protocols, and diverse model visualization will be paramount. This integrated approach, firmly situated within the broader thesis of computational anticancer drug discovery, significantly accelerates the identification and optimization of novel, potent therapeutic agents against challenging targets like HER2, tubulin, and aromatase, ultimately contributing to the fight against cancer.
In modern drug discovery, Quantitative Structure-Activity Relationship (QSAR) modeling serves as a pivotal computational approach that correlates the chemical structure of compounds with their biological activity. While traditional 2D-QSAR utilizes numerical molecular descriptors that are invariant to conformation, three-dimensional QSAR (3D-QSAR) extends this paradigm by incorporating the molecule's spatial orientation and interaction potentials into the analysis [2]. This advancement is particularly valuable in anticancer research, where understanding the precise interaction between inhibitors and their protein targets can accelerate the development of more effective and selective therapies.
The fundamental premise of 3D-QSAR is that biological activity correlates with interaction energy fields surrounding molecules. By analyzing these fields across a series of compounds, researchers can identify structural features that enhance or diminish activity against specific cancer targets [2]. Techniques such as Comparative Molecular Field Analysis (CoMFA), Comparative Molecular Similarity Indices Analysis (CoMSIA), and pharmacophore modeling have become indispensable tools for medicinal chemists working to optimize lead compounds. These methods have been successfully applied to various cancer targets including polo-like kinase 1 (PLK1), B-Raf kinase, aromatase, and tubulin, demonstrating their broad utility in oncology drug discovery [15] [16] [17].
Theoretical Foundations and Methodological Framework
Core Principles of 3D-QSAR
3D-QSAR methodologies operate on the principle that a compound's biological activity can be predicted from its three-dimensional interaction fields. Unlike traditional QSAR that uses global molecular descriptors, 3D-QSAR represents each molecule with detailed field values measured at numerous spatial points, providing finer resolution of molecular interactions [2]. This approach requires all molecules to be aligned in a shared 3D reference frame that presumably reflects their bioactive conformations when bound to the target protein.
The statistical foundation of 3D-QSAR typically employs Partial Least Squares (PLS) regression, which handles the large number of correlated descriptors by projecting them into a smaller set of latent variables [16] [2]. Model quality is assessed through both internal validation (e.g., leave-one-out cross-validation) and external validation using test set compounds not included in model building. Key statistical metrics include Q² (cross-validated correlation coefficient), R² (conventional correlation coefficient), and SEE (standard error of estimation) [18] [16].
Comparative Molecular Field Analysis (CoMFA)
CoMFA, one of the most established 3D-QSAR methods, calculates steric (Lennard-Jones) and electrostatic (Coulombic) interaction energies between each molecule and a probe atom placed at grid points surrounding the molecular ensemble [2] [17]. The resulting interaction energy matrices serve as descriptors for PLS analysis, generating a model that reveals how steric and electrostatic properties influence biological activity.
A significant advantage of CoMFA is its直观的contour maps that highlight regions where specific molecular modifications would enhance activity. However, CoMFA is highly sensitive to molecular alignment and orientation, requiring careful preparation of the molecular dataset [2]. The method also suffers from abrupt changes in potential energy near molecular surfaces, which can be mitigated by various techniques including field smoothing.
Comparative Molecular Similarity Indices Analysis (CoMSIA)
CoMSIA extends beyond CoMFA by incorporating Gaussian-type functions to evaluate similarity indices across multiple fields: steric, electrostatic, hydrophobic, and hydrogen bond donor/acceptor properties [18] [2]. This approach avoids the singularities inherent in CoMFA's potential functions and provides more stable models less sensitive to molecular alignment.
The inclusion of hydrophobic and hydrogen-bonding fields in CoMSIA often yields models with greater biological relevance, as these interactions frequently mediate ligand binding to protein targets. The method's contour maps directly indicate favorable and unfavorable regions for specific chemical features, providing clear guidance for molecular design [18] [2].
Pharmacophore Modeling
Pharmacophore modeling identifies the essential structural features responsible for biological activity, abstracting specific molecules into a set of generalized chemical functionalities [15] [17]. A pharmacophore model typically includes features such as hydrogen bond donors/acceptors, charged groups, hydrophobic regions, and aromatic rings that collectively define the interaction profile required for binding to a target protein.
Pharmacophore models can be derived either ligand-based (from a set of active compounds) or structure-based (from protein-ligand complexes) [17]. These models serve multiple purposes in drug discovery: they help rationalize structure-activity relationships, guide molecular design, and function as queries for virtual screening of compound databases to identify novel chemotypes with potential bioactivity [19] [17].
Comparative Analysis of 3D-QSAR Methodologies
Table 1: Comparison of CoMFA and CoMSIA Methodologies
| Parameter | CoMFA | CoMSIA |
|---|---|---|
| Fields Calculated | Steric (Lennard-Jones) and electrostatic (Coulomb) | Steric, electrostatic, hydrophobic, hydrogen bond donor/acceptor |
| Probe Function | Potential functions | Gaussian-type similarity functions |
| Alignment Sensitivity | High - requires precise molecular alignment | Moderate - more robust to alignment variations |
| Contour Interpretation | Shows regions where steric bulk/electrostatics affect activity | Shows favorable/unfavorable regions for chemical features |
| Advantages | Established method with straightforward interpretation | Broader interaction fields, smoother sampling |
| Limitations | Sensitive to orientation, abrupt potential changes | More parameters to optimize, computationally intensive |
Table 2: Statistical Parameters for 3D-QSAR Model Validation
| Statistical Parameter | Interpretation | Acceptable Threshold |
|---|---|---|
| Q² (LOO cross-validation) | Predictive capability of model | > 0.5 [16] |
| R² | Goodness of fit | > 0.8 |
| SEE | Standard error of estimate | Lower values preferred |
| F value | Statistical significance | Higher values preferred |
| R²pred | Predictive power for test set | > 0.6 [16] |
Experimental Protocols and Workflow
Standard 3D-QSAR Workflow
The development of a robust 3D-QSAR model follows a systematic workflow with multiple critical stages. The diagram below illustrates this process:
Data Collection and Preparation
The initial stage involves assembling a dataset of compounds with experimentally determined biological activities (e.g., IC₅₀ values) obtained under uniform conditions [2]. For anticancer applications, this typically includes compounds screened against specific cancer targets or cell lines. The dataset should contain structurally related yet diverse compounds that span a sufficient range of activity values. A common practice involves dividing the dataset into training (∼80%) and test (∼20%) sets to enable model validation [16].
Molecular Modeling and Conformation Generation
2D molecular structures are converted into 3D coordinates using cheminformatics tools like RDKit or Sybyl [18] [2]. These structures undergo geometry optimization through molecular mechanics (e.g., Tripos force field) or quantum mechanical methods to ensure they represent realistic, low-energy conformations [16] [2]. The selection of appropriate bioactive conformations is critical, as this significantly influences subsequent alignment and descriptor calculation.
Molecular Alignment Strategies
Molecular alignment constitutes one of the most technically demanding steps in 3D-QSAR. The objective is to superimpose all molecules in a shared 3D reference frame that reflects their putative binding modes [2]. Common alignment methods include:
- Distill-based alignment: A rigid alignment approach implemented in Sybyl-X software [16]
- Pharmacophore-based alignment: Using common pharmacophore features to guide superposition [17]
- Docking-based alignment: Using binding poses from molecular docking to align molecules [16]
- Maximum Common Substructure (MCS): Identifying the largest shared substructure for alignment [2]
The alignment assumption presumes all compounds share a similar binding mode to the target protein. Imperfect alignment introduces inconsistencies that undermine model quality, particularly for CoMFA [2].
Descriptor Calculation and Model Building
Following alignment, 3D molecular descriptors are computed. In CoMFA, a lattice of grid points surrounds the molecules, with steric and electrostatic interaction energies calculated at each point using a probe atom [2] [17]. CoMSIA employs Gaussian functions to evaluate similarity indices across multiple fields at grid points [18] [2].
The resulting descriptor matrices are analyzed using PLS regression to build models correlating field values with biological activity [16] [2]. The optimal number of components is determined through cross-validation to avoid overfitting. The model is then subjected to rigorous validation before interpretation and application.
Model Validation Techniques
Robust 3D-QSAR models require comprehensive validation to ensure predictive reliability:
- Internal validation: Leave-one-out (LOO) or leave-several-out cross-validation assessing Q² values [16]
- External validation: Prediction of test set compounds not used in model building [16]
- Statistical significance: Fischer randomization testing to confirm model robustness [20]
- Applicability domain: Defining the chemical space where the model provides reliable predictions [21]
Applications in Anticancer Research
Case Study: Pteridinone Derivatives as PLK1 Inhibitors
PLK1 overexpression occurs in numerous cancers (lung, prostate, colon), making it a promising broad-spectrum anticancer target [16]. A 3D-QSAR study on pteridinone derivatives demonstrated excellent predictive models with CoMFA (Q² = 0.67, R² = 0.992) and CoMSIA (Q² = 0.69, R² = 0.974) [16]. Molecular docking identified key interacting residues (R136, R57, Y133, L69, L82, Y139), while molecular dynamics simulations confirmed binding stability over 50 ns. The models successfully identified compound 28 as a promising candidate for prostate cancer treatment, validated by ADMET property screening [16].
Case Study: Indole Derivatives as Aromatase Inhibitors
Aromatase inhibition represents a proven strategy for treating ER+ breast cancer, which accounts for >70% of breast cancer cases [15]. Integrated 3D-QSAR, molecular docking, pharmacophore mapping, and MD simulation studies on indole derivatives identified key pharmacophoric features: one hydrogen bond acceptor and three aromatic rings essential for optimum aromatase inhibitory activity [15]. The most potent compound (4) demonstrated superior binding affinity compared to letrozole, a standard treatment. Molecular dynamics simulations confirmed stable binding over 100 ns, and the designed compound S8 showed predicted pIC₅₀ of 0.719 nM, comparable to the most active compound [15].
Case Study: Imidazopyridines as B-Raf Inhibitors
B-Raf kinase mutations occur in approximately 7% of human cancers, with particularly high frequency in melanoma (50-70%), ovarian (35%), and thyroid (30%) cancers [17]. 3D-QSAR studies on imidazopyridine inhibitors generated a CoMSIA model with excellent predictive power (q² = 0.621, r²pred = 0.885) [17]. Pharmacophore modeling revealed two acceptor atoms, three donor atoms, and three hydrophobes as critical features. Virtual screening using this pharmacophore identified novel B-Raf inhibitor scaffolds with potential therapeutic utility [17].
Table 3: Essential Software Tools for 3D-QSAR in Anticancer Research
| Tool Category | Specific Tools | Application in 3D-QSAR Workflow |
|---|---|---|
| Molecular Modeling | Sybyl-X, RDKit, ChemDraw | Compound construction, optimization, 3D conformation generation [18] [16] |
| Molecular Alignment | GALAHAD, Maximum Common Substructure | Superposition of molecules in 3D space [2] [17] |
| Descriptor Calculation | CoMFA, CoMSIA | Computation of steric, electrostatic, hydrophobic fields [18] [16] |
| Statistical Analysis | Partial Least Squares (PLS) | Model building, latent variable analysis [16] [2] |
| Molecular Docking | AutoDock, Vina | Binding mode prediction, structure-based alignment [16] |
| Dynamics Simulation | GROMACS, AMBER | Binding stability assessment [15] [18] |
Integration with Complementary Computational Methods
Modern 3D-QSAR studies increasingly integrate multiple computational approaches to enhance predictive accuracy and biological relevance:
Molecular Docking and 3D-QSAR
Molecular docking predicts the binding orientation of small molecules in protein targets, providing structural insights for 3D-QSAR alignment [16]. Docking-derived alignments can be particularly valuable when compounds lack an obvious common scaffold for ligand-based alignment. The combination of docking and 3D-QSAR has been successfully applied to various cancer targets including PLK1, B-Raf, and aromatase [15] [16] [17].
Molecular Dynamics Simulations
Molecular dynamics (MD) simulations assess the stability of protein-ligand complexes over time, validating docking poses used in 3D-QSAR studies [15] [18]. For instance, MD simulations confirmed the stable binding of compound 4 to aromatase over 100 ns, with RMSD values fluctuating between 1.0-2.0 Å, indicating conformational stability [15] [18]. These simulations provide dynamic insights that complement the static picture from docking and 3D-QSAR.
Pharmacophore-Based Virtual Screening
Pharmacophore models derived from 3D-QSAR serve as effective queries for virtual screening of large compound databases [19] [17]. This approach has identified novel scaffolds with potential anticancer activity against targets including tubulin, B-Raf, and histone deacetylases [19] [17]. The integration of pharmacophore screening with 3D-QSAR creates a powerful workflow for lead identification and optimization.
The field of 3D-QSAR continues to evolve with advancements in computational power, algorithms, and integration with artificial intelligence. Machine learning approaches, particularly deep learning, are increasingly being applied to enhance predictive models and explore complex structure-activity relationships [21] [22]. The growing availability of large-scale chemical libraries and target structures further expands the potential applications of 3D-QSAR in anticancer drug discovery [22].
In conclusion, 3D-QSAR methodologies including CoMFA, CoMSIA, and pharmacophore modeling represent powerful approaches for rational anticancer drug design. By correlating three-dimensional molecular properties with biological activity, these techniques provide valuable insights for optimizing lead compounds and identifying novel chemotypes. When integrated with complementary computational methods and experimental validation, 3D-QSAR significantly streamlines the drug discovery process, contributing to the development of more effective and selective anticancer therapies.
The Critical Role of 3D-QSAR in Targeting Specific Cancer Proteins (e.g., TRAP1, VEGFR-2, AKT1)
The development of targeted cancer therapies relies heavily on understanding the intricate molecular interactions between potential drug compounds and their protein targets. Three-dimensional Quantitative Structure-Activity Relationship (3D-QSAR) modeling has emerged as a pivotal computational approach that enables researchers to predict the biological activity of compounds by analyzing their spatially-dependent physicochemical properties [23]. Unlike traditional 2D-QSAR methods that utilize molecular descriptors derived from two-dimensional structures, 3D-QSAR incorporates the critical third dimension, accounting for steric, electrostatic, hydrophobic, and hydrogen-bonding features that fundamentally govern molecular recognition and binding [24] [25]. This advanced methodology has become indispensable in oncology drug discovery, particularly for targeting specific cancer proteins such as VEGFR-2, where it facilitates the rational design of inhibitors with enhanced potency and selectivity [26] [27].
The core premise of 3D-QSAR is that differences in biological activity among compounds can be correlated with changes in their molecular interaction fields when aligned in three-dimensional space [25]. By employing techniques such as Comparative Molecular Field Analysis (CoMFA) and Comparative Molecular Similarity Indices Analysis (CoMSIA), researchers can generate contour maps that visually identify regions where specific chemical modifications would enhance or diminish binding affinity to a target protein [23] [28]. This spatial guidance enables medicinal chemists to prioritize synthetic efforts toward analogs with the highest probability of success, significantly accelerating the drug discovery pipeline while reducing costs associated with experimental screening [23].
Key 3D-QSAR Methodologies and Their Application to Cancer Targets
Fundamental 3D-QSAR Approaches
Several sophisticated computational techniques constitute the methodological foundation of 3D-QSAR studies in cancer research, each with distinct advantages for specific scenarios. The most widely adopted approaches include CoMFA (Comparative Molecular Field Analysis), CoMSIA (Comparative Molecular Similarity Indices Analysis), and Topomer CoMFA, all of which leverage statistical correlation methods to establish quantitative relationships between molecular fields and biological activity [26] [28].
CoMFA analyzes steric (Lennard-Jones) and electrostatic (Coulombic) interaction energies between a probe atom and aligned molecules at regularly spaced grid points, generating three-dimensional contour maps that highlight regions where specific structural modifications would enhance activity [28]. CoMSIA extends this concept by incorporating additional similarity indices, including hydrophobic, hydrogen bond donor, and hydrogen bond acceptor fields, providing a more comprehensive description of ligand-receptor interactions [23] [28]. Recent studies on phenylindole derivatives as multitarget cancer inhibitors demonstrated the exceptional predictive power of CoMSIA models, with statistical parameters of R² = 0.967 and Q² = 0.814, indicating high reliability for designing novel compounds [28].
Topomer CoMFA represents an alignment-independent methodology that fragments molecules into topomerically aligned segments, making it particularly valuable for virtual screening of large compound databases [26]. A recent investigation of VEGFR-2 inhibitors utilized Topomer CoMFA to develop stable predictive models (q² > 0.5), enabling efficient identification of novel chemotypes with potential antiangiogenic activity [26].
Machine Learning-Enhanced 3D-QSAR Models
The integration of machine learning algorithms with traditional 3D-QSAR approaches has significantly enhanced predictive accuracy and model robustness in recent years [29]. Algorithms such as Random Forest (RF), Support Vector Machine (SVM), and Multilayer Perceptron (MLP) have demonstrated superior performance compared to conventional statistical methods, particularly for complex targets like estrogen receptor alpha (ERα) [29]. In one notable study, machine learning-based 3D-QSAR models outperformed established VEGA models in accuracy, sensitivity, and selectivity when predicting the endocrine disruption potential of novel chemical entities, offering a more reliable approach for early-stage toxicity assessment [29].
Table 1: Key 3D-QSAR Methodologies and Their Applications in Cancer Research
| Methodology | Key Fields Analyzed | Statistical Parameters | Cancer Targets | References |
|---|---|---|---|---|
| CoMSIA | Steric, Electrostatic, Hydrophobic, H-bond Donor/Acceptor | R² = 0.967, Q² = 0.814 [28] | CDK2, EGFR, Tubulin [28] | |
| CoMFA | Steric, Electrostatic | q² = 0.569, R² = 0.915 [23] | MAO-B [23] | |
| Topomer CoMFA | Steric, Electrostatic | q² > 0.5 [26] | VEGFR-2 [26] | |
| Field-Based QSAR | Shape, Electrostatics, Hydrophobicity | R² = 0.92, q² = 0.75 [25] | AKR1B10, NR3C1, PTGS2, HER2 [25] | |
| ML-Based 3D-QSAR | Multiple field types combined with ML algorithms | Superior accuracy/sensitivity vs VEGA models [29] | ERα [29] |
Experimental Protocols for 3D-QSAR in Cancer Protein Targeting
Standardized Workflow for 3D-QSAR Model Development
The development of robust 3D-QSAR models follows a systematic workflow encompassing multiple critical stages, from data preparation to model validation. The initial phase involves compound selection and activity data curation, where a structurally diverse set of compounds with reliable biological activity data (typically IC₅₀ or Ki values) against the specific cancer target is assembled [25] [30]. For instance, a recent study targeting Tubulin for breast cancer therapy compiled 32 triazine derivatives with experimentally determined IC₅₀ values against MCF-7 breast cancer cells, ensuring sufficient structural diversity and activity range for model development [30].
The subsequent molecular alignment step represents perhaps the most critical phase, where all compounds are spatially superimposed according to a hypothesized bioactive conformation [28]. Both ligand-based and structure-based alignment strategies are employed, with the distill alignment technique in SYBYL using the most active compound as a template being a common approach [28]. For cases where the target-bound structure is unknown, field-based template methods such as FieldTemplater can generate pharmacophore hypotheses based on molecular field similarity [25].
Following alignment, molecular field calculations are performed at grid points surrounding the aligned molecules. In CoMSIA methodology, five different fields (steric, electrostatic, hydrophobic, hydrogen bond donor, and hydrogen bond acceptor) are computed using a probe atom with specific characteristics [28]. The final stage involves Partial Least Squares (PLS) regression analysis to establish correlations between the field descriptors and biological activity, with model quality assessed through cross-validation techniques such as Leave-One-Out (LOO) and external test set validation [28] [30].
Validation Protocols and Statistical Assessment
Rigorous validation is essential to ensure the predictive reliability and applicability domain of 3D-QSAR models. The Leave-One-Out (LOO) cross-validation technique is widely employed, where each compound is systematically removed from the training set, and its activity is predicted using a model built from the remaining compounds [25] [30]. The cross-validated correlation coefficient (Q²) serves as a key indicator of model robustness, with values above 0.5 generally considered acceptable and above 0.7 indicating excellent predictive ability [28].
External validation using a test set of compounds not included in model development provides the most stringent assessment of predictive power [28] [30]. For phenylindole derivatives targeting multiple cancer proteins, external validation yielded a high predictive R² (R²Pred = 0.722), confirming model utility for designing novel inhibitors [28]. Additional statistical parameters, including the conventional correlation coefficient (R²), standard error of estimate (SEE), and F-value, collectively provide a comprehensive assessment of model quality and statistical significance [23] [28].
Table 2: Representative Validation Statistics from Recent 3D-QSAR Studies in Cancer Research
| Study Focus | Training/Test Set | R² | Q² (LOO-CV) | R²Pred (External) | Reference |
|---|---|---|---|---|---|
| Phenylindole Derivatives (CDK2, EGFR, Tubulin) | 28/5 compounds | 0.967 | 0.814 | 0.722 | [28] |
| 6-Hydroxybenzothiazole-2-carboxamide (MAO-B) | Not specified | 0.915 | 0.569 | Not specified | [23] |
| Maslinic Acid Analogs (MCF-7) | 47/27 compounds | 0.92 | 0.75 | Not specified | [25] |
| Dihydropteridone Derivatives (PLK1) | 26/8 compounds | 0.928 | 0.628 | Not specified | [24] |
| 1,2,4-Triazine-3(2H)-one (Tubulin) | 80:20 split ratio | 0.849 | Not specified | Not specified | [30] |
Case Studies: Targeting Specific Cancer Proteins
Targeting VEGFR-2 for Antiangiogenic Therapy
Vascular Endothelial Growth Factor Receptor-2 (VEGFR-2) plays a pivotal role in tumor angiogenesis, making it a prime target for anticancer drug development. Recent 3D-QSAR investigations have successfully identified critical structural features governing VEGFR-2 inhibition, guiding the design of novel chemotherapeutic agents [26] [27]. In a comprehensive study combining machine learning with 3D-QSAR, researchers developed predictive models with 82.4% and 80.1% accuracy for training and test sets, respectively, using the K-Nearest Neighbors (KNN) algorithm [26]. The subsequent Topomer CoMFA approach yielded a stable model (q² > 0.5) that highlighted the significance of steric bulkiness, electrostatic effects, and hydrogen bond acceptor capacity for inhibitory potency [26] [27].
Molecular docking simulations integrated with these 3D-QSAR findings revealed that optimal VEGFR-2 inhibitors form crucial hydrogen bonds with key residues Asp1046 and Glu885 in the binding pocket [26]. This integrated approach led to the identification of five promising compounds with Total Scores greater than 6, indicating strong hydrogen bonding interactions and high binding affinity [26]. These results demonstrate how 3D-QSAR contour maps can directly inform molecular optimization strategies to enhance interactions with specific subpockets of VEGFR-2, potentially leading to improved antiangiogenic agents with reduced side effects compared to existing therapeutics.
Multitarget Inhibition for Overcoming Cancer Resistance
The emerging paradigm of multitarget therapy addresses the challenge of drug resistance in cancer treatment by simultaneously inhibiting multiple key proteins involved in tumor progression. A recent groundbreaking study on 2-phenylindole derivatives exemplifies the power of 3D-QSAR in designing such multifaceted inhibitors [28]. The developed CoMSIA model exhibited exceptional statistical reliability (R² = 0.967, Q² = 0.814) and successfully guided the design of six novel compounds with predicted enhanced activity against three critical cancer targets: CDK2, EGFR, and Tubulin [28].
Molecular docking confirmed the superior binding affinities of the newly designed compounds (-7.2 to -9.8 kcal/mol) compared to reference drugs and the most active molecule in the original dataset [28]. Particularly noteworthy was the stability of these complexes, validated through 100 ns molecular dynamics simulations that demonstrated minimal structural fluctuations (RMSD between 1.0-2.0 Å) and tight binding conformations [28]. This comprehensive approach underscores how 3D-QSAR can facilitate the rational design of single compounds capable of simultaneously modulating multiple cancer pathways, potentially overcoming the limitations of monotherapies and addressing compensatory resistance mechanisms.
Targeting Tubulin for Breast Cancer Therapy
Microtubules composed of tubulin heterodimers represent well-established targets for anticancer therapy, with their disruption leading to mitotic arrest and apoptosis in rapidly dividing cancer cells. Recent 3D-QSAR investigations have focused on optimizing 1,2,4-triazine-3(2H)-one derivatives as potent tubulin inhibitors for breast cancer treatment [30]. The developed QSAR model achieved a predictive accuracy (R²) of 0.849 and identified absolute electronegativity and water solubility as key descriptors significantly influencing inhibitory activity [30].
Molecular docking studies revealed that the designed compound Pred28 exhibited exceptional binding affinity (-9.6 kcal/mol) to the tubulin colchicine binding site [30]. Subsequent molecular dynamics simulations over 100 ns confirmed the remarkable stability of this complex, with the lowest root mean square deviation (RMSD) of 0.29 nm and minimal fluctuations (RMSF) indicative of a tightly bound conformation [30]. These computational findings were further supported by ADMET profiling, which predicted favorable pharmacokinetic properties and reduced toxicity risks, highlighting the potential of these derivatives as promising therapeutic candidates for breast cancer treatment [30].
The Scientist's Toolkit: Essential Research Reagent Solutions
Successful implementation of 3D-QSAR studies requires a comprehensive suite of computational tools and software resources. The following table summarizes essential research reagent solutions routinely employed in the field, along with their specific functions in the 3D-QSAR workflow.
Table 3: Essential Research Reagent Solutions for 3D-QSAR Studies
| Tool/Software | Primary Function | Application in 3D-QSAR Workflow | Representative Use Cases |
|---|---|---|---|
| SYBYL | Molecular modeling and analysis | Molecular alignment, CoMFA/CoMSIA studies, PLS analysis | Alignment of phenylindole derivatives [28] |
| ChemDraw | 2D structure drawing | Initial structure sketching and representation | Drawing dihydropteridone derivatives [24] |
| Gaussian 09W | Quantum chemical calculations | Geometry optimization, electronic descriptor calculation | DFT optimization of triazine derivatives [30] |
| Forge | Field-based modeling | 3D-QSAR model development using field points | Field-based QSAR on maslinic acid analogs [25] |
| Discovery Studio | Molecular docking and descriptor calculation | Binding site analysis, molecular descriptor generation | Virtual screening of VEGFR-2 inhibitors [26] |
| GROMACS | Molecular dynamics simulations | Stability assessment of protein-ligand complexes | MD simulations of tubulin-inhibitor complexes [30] |
| VEGA | QSAR model development and validation | Building and validating predictive models | Estrogen receptor binding affinity prediction [29] |
| CODESSA | Molecular descriptor calculation | Computing quantum chemical, structural, and topological descriptors | Descriptor calculation for dihydropteridone derivatives [24] |
3D-QSAR methodologies have unequivocally established their critical role in modern anticancer drug discovery, particularly for targeting specific cancer proteins such as VEGFR-2, tubulin, and multitarget combinations. By providing three-dimensional insights into structure-activity relationships, these computational approaches enable rational drug design that significantly accelerates the identification and optimization of promising therapeutic candidates. The integration of 3D-QSAR with complementary techniques including molecular docking, dynamics simulations, and machine learning algorithms has created a powerful paradigm for addressing the complex challenges of cancer therapy, particularly drug resistance and selectivity issues.
Future advancements in 3D-QSAR will likely focus on enhanced integration with artificial intelligence, improved handling of protein flexibility, and more accurate prediction of ADMET properties at earlier stages of drug design. As computational power continues to grow and algorithms become increasingly sophisticated, 3D-QSAR methodologies will undoubtedly remain at the forefront of targeted cancer therapy development, providing researchers with invaluable spatial guidance for molecular optimization and expanding the frontiers of structure-based drug discovery in oncology.
Building and Applying Robust 3D-QSAR Models for Cancer Targets
In modern anticancer drug discovery, Three-Dimensional Quantitative Structure-Activity Relationship (3D-QSAR) modeling has emerged as a pivotal computational technique for predicting compound activity and guiding rational drug design. Unlike traditional QSAR methods that utilize numerical molecular descriptors, 3D-QSAR incorporates the three-dimensional spatial structures of molecules to correlate their interaction fields with biological activity against specific cancer targets [2]. This approach is particularly valuable in oncology research, where understanding the precise steric and electrostatic requirements for target binding can significantly accelerate the identification of promising therapeutic candidates.
The foundational principle of 3D-QSAR rests on the concept that differences in biological activity correlate with changes in the shapes and intensities of non-covalent interaction fields surrounding molecules [31]. For anticancer applications, this enables researchers to identify critical molecular features necessary for inhibiting cancer-relevant targets such as protein kinases, mutant isocitrate dehydrogenase 1 (mIDH1), PI3Kα isoforms, and monoamine oxidase B (MAO-B) [9] [18] [32]. The workflow presented in this guide forms an essential component of a comprehensive framework for predicting anticancer compound activity, with proper execution of dataset curation, molecular alignment, and conformational analysis being prerequisites for developing robust predictive models.
Data Set Curation
Compound Selection and Activity Data
The initial and most critical phase in 3D-QSAR model development involves assembling a high-quality dataset of compounds with experimentally determined biological activities. For anticancer research, this typically involves half-maximal inhibitory concentration (IC50) or half-maximal effective concentration (EC50) values measured against specific cancer cell lines or molecular targets [2] [25].
Key requirements for dataset curation include:
- Select structurally related compounds with sufficient diversity to capture meaningful structure-activity relationships
- Obtain all activity data under uniform experimental conditions to minimize protocol-induced variability
- Include compounds spanning a broad range of activity values (typically 3-4 orders of magnitude)
- Verify compound purity and structural identity through appropriate analytical methods
In recent 3D-QSAR studies focused on anticancer agents, datasets have ranged from approximately 30-80 compounds, with activities converted to pIC50 (-logIC50) values for modeling [18] [16] [25]. For example, a study on maslinic acid analogs against breast cancer MCF-7 cells utilized 74 compounds, while research on pteridinone derivatives as PLK1 inhibitors employed 28 compounds [16] [25].
Training and Test Set Division
Proper division of the dataset into training and test sets is essential for model development and validation. The training set builds the statistical model, while the test set evaluates its predictive capability [16].
Table 1: Common Dataset Division Strategies in 3D-QSAR Studies
| Division Method | Application | Advantages | Considerations |
|---|---|---|---|
| Activity Stratified Selection | Maslinic acid analogs study [25] | Maintains similar activity distribution in both sets | Ensures representative sampling across activity range |
| Random Selection (80:20 Ratio) | Pteridinone derivatives as PLK1 inhibitors [16] | Simple implementation | May create activity gaps if dataset is small |
| Structural Clustering | Novel mIDH1 inhibitors [32] | Captures structural diversity | Requires molecular similarity calculations |
Molecular Modeling and Conformational Analysis
Generation of 3D Structures
With the dataset defined, two-dimensional molecular structures are converted into three-dimensional coordinates using specialized software tools. Common applications for this process include ChemDraw, ChemBio3D, RDKit, and Sybyl-X [2] [18] [25]. The initial 3D structures subsequently undergo geometry optimization to ensure they adopt realistic, low-energy conformations.
Energy minimization methods:
- Molecular Mechanics Force Fields (e.g., TRIPOS, UFF): Faster computation suitable for large datasets
- Quantum Mechanical Methods (e.g., DFT): Higher accuracy for electronic property calculation
For example, in a study on 6-hydroxybenzothiazole-2-carboxamide derivatives as MAO-B inhibitors, structures were constructed in ChemDraw and optimized using Sybyl-X software with the standardized TRIPOS force field [18].
Conformational Analysis and Bioactive Conformation
Since the selected conformation critically influences alignment and descriptor calculation, identifying putative bioactive conformations represents a crucial step. When structural information for the target-bound state is unavailable, specialized approaches are required.
Methods for bioactive conformation identification:
- FieldTemplater: Uses field and shape similarity to generate a pharmacophore hypothesis from active compounds [25]
- XED Force Field: Employes molecular field-based similarity for conformational search [25]
- Docking-Based Alignment: Uses protein structures (when available) to guide conformation selection
In the maslinic acid analogs study, researchers used FieldTemplater with five active compounds to develop a field-based pharmacophore hypothesis, followed by conformational generation using the XED force field with a gradient cut-off of 0.1 [25]. Each compound typically generates 100-200 conformations for subsequent analysis [33].
Molecular Alignment
Alignment Strategies
Molecular alignment constitutes the most critical and technically demanding step in 3D-QSAR, with proper alignment directly determining model quality [34]. The objective is to superimpose all molecules within a shared 3D reference frame that reflects their putative bioactive orientations.
Table 2: Molecular Alignment Methods in 3D-QSAR
| Alignment Method | Principle | Applications | Software Tools |
|---|---|---|---|
| Common Substructure | Superimposes atoms of shared molecular framework | Congeneric series with clear common core | Sybyl, Forge, Py-Align |
| Maximum Common Substructure (MCS) | Identifies largest shared substructure among molecules | Diverse chemotypes with partial structural similarity | RDKit, Forge |
| Field and Shape Similarity | Aligns molecules based on electrostatic and steric field similarity | Structurally diverse compounds without obvious common core | Forge, Torch |
| Pharmacophore-Based | Uses identified pharmacophore features as alignment points | When bioactive conformation hypothesis exists | Forge, FieldTemplater |
Practical Alignment Workflow
A robust alignment protocol for 3D-QSAR studies typically follows this sequence [34]:
- Select a reference molecule that represents the dataset, investing time to establish its putative bioactive conformation through comparison with crystal structures or FieldTemplater
- Align remaining compounds to the reference using substructure or field-based algorithms
- Manually inspect alignments for inconsistencies, particularly for molecules with substituents exploring regions not covered by the initial reference
- Add additional reference molecules (typically 3-4 total) to fully constrain the alignment space
- Re-align the complete dataset using substructure alignment with maximum scoring mode
- Iterate until alignment quality is satisfactory across all compounds
Critical consideration: Alignment must be performed before running QSAR analysis and without consideration of activity values to avoid introducing bias and invalidating the model [34]. A common error involves tweaking alignments based on model outliers, which compromises statistical integrity.
Descriptor Calculation and Model Building
3D Molecular Descriptors
Following alignment, 3D molecular descriptors numerically represent steric and electrostatic environments. The classic Comparative Molecular Field Analysis (CoMFA) method uses a lattice of grid points surrounding aligned molecules, with steric (Lennard-Jones) and electrostatic (Coulomb) fields calculated at each point using a probe atom [2].
Comparative Molecular Similarity Indices Analysis (CoMSIA) extends this approach by incorporating Gaussian-type functions to evaluate multiple fields while reducing sensitivity to alignment artifacts [2] [18].
Table 3: Field Descriptors in CoMFA and CoMSIA
| Method | Field Types | Probe Atoms | Alignment Sensitivity |
|---|---|---|---|
| CoMFA | Steric, Electrostatic | sp³ carbon with +1 charge | High - precise alignment critical |
| CoMSIA | Steric, Electrostatic, Hydrophobic, Hydrogen Bond Donor/Acceptor | Various atom types depending on field | Moderate - more tolerant to minor misalignments |
Statistical Modeling and Validation
With descriptors calculated, the relationship between 3D field values and biological activity is established using Partial Least Squares (PLS) regression, which handles the large number of correlated descriptors by projecting them to latent variables [2] [16].
Model validation is essential and employs multiple strategies:
- Internal Validation: Leave-One-Out (LOO) or Leave-Group-Out cross-validation yielding Q²
- External Validation: Predictive correlation coefficient (R²pred) using test set molecules
- Statistical Metrics: Standard Error of Estimate (SEE), F-value, and optimal number of components
For a model to be considered predictive, Q² should exceed 0.5 and R²pred should be greater than 0.6 [16]. In successful anticancer 3D-QSAR studies, reported Q² values typically range from 0.66-0.77, with conventional R² values of 0.97-0.99 [32] [16] [25].
Experimental Protocols
Standardized 3D-QSAR Protocol for Anticancer Compounds
The following detailed methodology is adapted from recent studies on PLK1 inhibitors and maslinic acid analogs [16] [25]:
Software Requirements: Sybyl-X 2.1, Forge v10, or equivalent molecular modeling software
Step-by-Step Procedure:
Dataset Preparation
- Convert 2D structures to 3D using converter modules (e.g., ChemBio3D, RDKit)
- Add hydrogen atoms and assign Gasteiger-Hückel atomic partial charges
- Perform energy minimization using TRIPOS force field with convergence criterion of 0.005 kcal/mol Å and 1000 iterations
Molecular Alignment
- Identify common substructure or use field-based template for alignment
- Apply rigid body alignment using distill alignment protocol in Sybyl or field similarity in Forge
- Verify alignment quality through visual inspection of superimposed molecules
Descriptor Calculation
- Set grid spacing to 1.0-2.0 Å extending 4.0 Å beyond molecular dimensions in all directions
- Calculate steric and electrostatic fields using sp³ carbon with +1 charge as probe atom
- Apply energy truncation of 30 kcal/mol for both steric and electrostatic fields
PLS Model Development
- Set maximum number of components to 10-20
- Use cross-validated Q² to determine optimal number of components
- Apply column filtering of 2.0 kcal/mol to improve signal-to-noise ratio
Model Validation
- Perform leave-one-out and leave-group-out cross-validation
- Calculate predictive R² for test set compounds
- Conduct y-scrambling (50+ iterations) to verify non-chance correlation
Web-Based Implementation
For researchers without access to commercial software, the www.3d-qsar.com portal provides web-based tools for building 3D-QSAR models through standard browsers without additional installations [31]. The platform includes:
- Py-MolEdit: Dataset compilation and molecular editing
- Py-ConfSearch: Conformational analysis engines
- Py-Align: Automated molecular alignment
- Py-CoMFA: Model building and validation
The Scientist's Toolkit: Essential Research Reagents and Software
Table 4: Essential Resources for 3D-QSAR in Anticancer Research
| Resource Category | Specific Tools | Function | Application Context |
|---|---|---|---|
| Structure Modeling | ChemDraw, ChemBio3D, RDKit | 2D to 3D structure conversion and editing | Initial structure preparation and optimization |
| Molecular Alignment | Sybyl-X, Forge, Py-Align | Molecular superposition and conformational analysis | Critical alignment step for 3D-QSAR |
| Field Calculation | CoMFA, CoMSIA modules in Sybyl or Forge | Steric and electrostatic field computation | Descriptor generation for QSAR models |
| Statistical Analysis | PLS implementation in Sybyl, R packages | Partial Least Squares regression | Model development and validation |
| Validation Tools | Custom scripts, y-scrambling algorithms | Model robustness assessment | Verification of model predictive power |
| Web Platforms | www.3d-qsar.com portal | Integrated 3D-QSAR modeling | Accessible alternative to commercial software |
Workflow Visualization
The following diagram illustrates the complete 3D-QSAR workflow for anticancer drug discovery, integrating dataset curation, molecular alignment, and conformational analysis into a cohesive research pipeline:
The meticulous execution of dataset curation, molecular alignment, and conformational analysis forms the essential foundation for developing predictive 3D-QSAR models in anticancer compound research. When properly implemented, this workflow enables researchers to extract critical structural insights and generate reliable activity predictions for novel compounds. The integration of these computational approaches with experimental validation creates a powerful strategy for accelerating anticancer drug discovery, ultimately contributing to the development of more effective therapeutic agents for oncology applications.
Within the broader thesis on how 3D-QSAR predicts anticancer compound activity, this case study exemplifies the integrated computational workflow essential for modern oncology drug discovery. The development of inhibitors for TRAP1 (Tumor Necrosis Factor Receptor-Associated Protein 1), a mitochondrial chaperone kinase significantly overexpressed in various cancers, presents a compelling target for therapeutic intervention [35] [36]. This technical guide details the construction and validation of a highly predictive 3D-QSAR model for pyrazolo[3,4-d]pyrimidine-based TRAP1 inhibitors, a study that demonstrated exceptional statistical performance with an R² of 0.96 and a Q² of 0.57 [35] [37]. The reliability of this model underscores the power of computational approaches in accelerating the identification and optimization of novel anticancer agents by elucidating the critical structural features governing biological activity.
Data Set Preparation and Pharmacophore Modeling
Data Collection and Curation
The foundational step involved curating a data set of 34 pyrazolo[3,4-d]pyrimidine analogs with known half-maximal inhibitory concentration (IC₅₀) values against TRAP1 from published literature [35]. The biological activity values (IC₅₀ in µM) were converted into pIC₅₀ (-log IC₅₀) to ensure a linear relationship for QSAR analysis. The data set was partitioned into a training set (75%) for model generation and a test set (25%) for external validation [35] [38]. All molecular structures were sketched using ChemDraw Professional 16.0, energy-minimized, and converted into their three-dimensional conformations using the LigPrep module within Maestro v12.1 [35].
Table 1: Representative Data Set of Pyrazolo[3,4-d]pyrimidine Analogs and Their TRAP1 Inhibitory Activity
| Compound | R1 Substituent | R Substituent | IC₅₀ (µM) | pIC₅₀ |
|---|---|---|---|---|
| 4 | Not Specified | Not Specified | 0.50 | 6.30 |
| 9 | Not Specified | Not Specified | 19.00 | 4.72 |
| 42 | Not Specified | Not Specified | 0.44 | 6.36 |
| 46 | Not Specified | Not Specified | 0.47 | 6.33 |
| 59 | Not Specified | Not Specified | 1.00 | 6.00 |
Pharmacophore Hypothesis Generation
Pharmacophore modeling was performed using the PHASE module in Schrödinger [35]. A common pharmacophore hypothesis, DHHRR.1, was identified as the most significant. This hypothesis comprises five distinct chemical features: one hydrogen bond donor (D), two hydrophobic groups (H), and two aromatic rings (R) [35]. The nitrogen atom in the pyrimidine ring often serves as the hydrogen bond donor, critical for interaction with the TRAP1 active site [35].
Diagram: Pharmacophore Modeling Workflow
3D-QSAR Modeling and Validation
Model Development and Statistical Outcomes
An atom-based 3D-QSAR model was developed using the PHASE module. The model's robustness was evaluated using a leave-one-out (LOO) cross-validation method, resulting in a Q² value of 0.57, indicating good predictive ability [35]. The non-cross-validated model demonstrated an impressive R² value of 0.96, signifying an excellent fit to the training set data [35]. The model's predictive power was further validated against the external test set, yielding a predictive R² (R²Pred) of 0.58 [35] [37].
Table 2: Statistical Parameters of the 3D-QSAR Model
| Parameter | Value | Interpretation |
|---|---|---|
| R² | 0.96 | Excellent fit to the training set data |
| Q² (LOO) | 0.57 | Good internal predictive ability |
| R² CV | 0.58 | Satisfactory cross-validated correlation |
| R²Pred | 0.58 | Good external predictive ability |
| PLS Factors | 5 | Number of latent variables used |
Contour Map Analysis and Structural Insights
The 3D-QSAR model generated contour maps around a reference ligand, providing visual guidance for structural optimization. These maps highlight regions where specific chemical features favorably or unfavorably influence biological activity. For instance:
- Electropositive (Blue) Contours: Indicate regions where positively charged groups enhance activity.
- Electronegative (Red) Contours: Show areas where negatively charged groups are favorable.
- Hydrophobic (Yellow) Contours: Reveal zones where hydrophobic substituents increase potency.
- Hydrogen Bond Donor (Green) Contours: Identify locations where H-bond donors are critical for binding [35].
Molecular Docking and Dynamics Simulations
Molecular Docking Protocol and Interactions
The validated 3D-QSAR model was complemented by molecular docking studies to elucidate the binding modes of the most potent compounds. Docking was performed using the Glide module (Grid-Based Ligand Docking with Energetics) in Schrödinger against the TRAP1 kinase structure (PDB ID: 5Y3N) [35] [37]. The five most potent analogs (42, 46, 49, 56, 43) exhibited exceptional XP GScore docking scores ranging from -11.265 to -10.422 kcal/mol [35]. These compounds formed critical interactions with key amino acid residues in the TRAP1 active site, including ASP 594, CYS 532, PHE 583, and SER 536 [35] [37].
Diagram: Key TRAP1-Ligand Molecular Interactions
Molecular Dynamics Simulations for Validation
To validate the stability of the docked complexes, 100 ns molecular dynamics (MD) simulations were conducted for the five selected inhibitor-TRAP1 complexes [35]. The simulations assessed parameters like Root Mean Square Deviation (RMSD), Root Mean Square Fluctuation (RMSF), and the number of hydrogen bonds over time. The results confirmed the structural stability of the complexes and the persistence of key interactions identified in the docking studies, thereby providing a higher level of validation for the predicted binding modes [35] [37].
Virtual Screening and ADMET Analysis
Identification of Novel Hit Compounds
The DHHRR.1 pharmacophore hypothesis was employed as a 3D search query for virtual screening of the ZINC database to identify novel scaffold hop candidates with potential TRAP1 inhibitory activity [35]. This screening process yielded several promising hits, including ZINC05297837, ZINC05434822, and ZINC72286418, which demonstrated similar binding interactions to the most potent ligands from the original data set [35] [37]. These compounds represent starting points for further optimization and experimental validation.
Absorption, Distribution, Metabolism, and Excretion (ADME) Analysis
The drug-likeness and pharmacokinetic properties of the potent analogs and newly identified hits were evaluated using in silico ADME analysis. The results indicated favorable properties, such as good predicted solubility, permeability, and metabolic stability, which are crucial for the development of orally bioavailable anticancer drugs [35] [37].
Table 3: Research Reagent Solutions for TRAP1 Inhibitor Development
| Reagent/Software | Function/Purpose |
|---|---|
| Schrödinger Suite (Maestro) | Integrated platform for molecular modeling, pharmacophore development, QSAR, and docking [35]. |
| Pyrazolo[3,4-d]pyrimidine analogs | Chemical scaffold with demonstrated TRAP1 inhibitory activity; basis for QSAR model [35] [37]. |
| TRAP1 Kinase (PDB ID: 5Y3N) | High-resolution crystal structure of the target protein for molecular docking studies [35]. |
| ZINC Database | Publicly accessible database of commercially available compounds for virtual screening [35]. |
| Glide (Schrödinger) | High-throughput molecular docking tool for predicting binding poses and affinities [35]. |
| PHASE (Schrödinger) | Module for developing common pharmacophore hypotheses and performing 3D-QSAR studies [35]. |
This case study demonstrates a successful application of 3D-QSAR in predicting anticancer compound activity, resulting in a highly predictive model for TRAP1 inhibition. The integration of pharmacophore modeling, 3D-QSAR, molecular docking, MD simulations, and virtual screening creates a powerful, iterative framework for rational drug design. The biological significance of targeting TRAP1 is profound; it is a key regulator of mitochondrial integrity, oxidative stress response, and cellular metabolism [36] [39]. Its overexpression in numerous cancers, including prostate and colorectal carcinomas, and its role in promoting a Warburg effect (aerobic glycolysis) make it a attractive therapeutic target [40] [36] [39]. The computational protocols and high-fidelity model detailed herein provide a validated roadmap for accelerating the discovery of novel, potent, and selective TRAP1 inhibitors, ultimately contributing to the broader thesis that 3D-QSAR is an indispensable tool in modern anticancer drug discovery.
The targeted suppression of angiogenesis represents a cornerstone of modern anticancer therapy. As a critical mediator of tumor-induced blood vessel formation, Vascular Endothelial Growth Factor Receptor-2 (VEGFR-2) has emerged as a prime therapeutic target [41]. Inhibition of VEGFR-2's tyrosine kinase activity disrupts downstream signaling pathways essential for endothelial cell proliferation, migration, and survival, effectively starving tumors of oxygen and nutrients [42]. Within this context, Three-Dimensional Quantitative Structure-Activity Relationship (3D-QSAR) methodologies, particularly Comparative Molecular Similarity Indices Analysis (CoMSIA), provide powerful computational frameworks for rational drug design. This case study details the application of CoMSIA to develop predictive models for novel VEGFR-2 inhibitors, framed within a broader thesis on how 3D-QSAR predicts anticancer compound activity. The integration of these computational approaches accelerates the identification and optimization of lead compounds, guiding the synthesis of more potent and selective therapeutic agents [43] [44].
Biological Rationale: VEGFR-2 as a Therapeutic Target
The Role of VEGFR-2 in Tumor Angiogenesis
Angiogenesis, the formation of new blood vessels from pre-existing vasculature, is an essential physiological process in growth, tissue repair, and wound healing [41]. In oncology, it becomes a pathological driver, enabling tumor growth beyond a minimal size and facilitating metastasis. VEGFR-2 (also known as KDR) is a receptor tyrosine kinase (RTK) that transmits pro-angiogenic signals upon binding its primary ligand, VEGF-A [42]. Its overexpression is clinically observed in diverse cancers, including breast cancer, cervical cancer, non-small cell lung cancer, hepatocellular carcinoma, and renal carcinoma [41]. Upon activation, VEGFR-2 undergoes autophosphorylation, initiating a cascade of downstream effectors such as MAPK, PI3K, and PLCγ, which ultimately promote endothelial cell proliferation, tumor angiogenesis, growth, and metastasis [41]. Consequently, targeted inhibition of VEGFR-2 kinase activity has been validated as a successful strategy for impairing angiogenesis and curtailing tumor progression [42].
VEGFR-2 Signaling Pathway
The diagram below illustrates the key components and sequence of events in VEGFR-2-mediated angiogenic signaling, highlighting potential intervention points for inhibitors.
CoMSIA Methodology and Experimental Protocol
Theoretical Foundation of CoMSIA
Comparative Molecular Similarity Indices Analysis (CoMSIA) is an advanced 3D-QSAR technique that evaluates the similarity of molecules based on physicochemical fields. Unlike its predecessor CoMFA (Comparative Molecular Field Analysis), which calculates steric and electrostatic potentials, CoMSIA typically incorporates five distinct fields: steric, electrostatic, hydrophobic, and hydrogen bond donor and acceptor [45] [46]. A key advantage of CoMSIA is the use of a Gaussian function to calculate field contributions, avoiding the singularities at atomic positions and cutoff limits inherent in CoMFA's Lennard-Jones and Coulomb potentials. This provides smoother, more interpretable contour maps around the molecules [42].
Detailed Computational Workflow
The standard protocol for developing a CoMSIA model for VEGFR-2 inhibitors involves a multi-step process, as implemented in molecular modeling suites like SYBYL [42] [46]:
- Data Set Curation: A series of compounds with known inhibitory activity (e.g., half-maximal inhibitory concentration, IC50) against VEGFR-2 is compiled. The IC50 values are converted to pIC50 (-log IC50) for analysis. This set is randomly divided into a training set (typically 75-85% of the molecules) for model building and a test set (the remaining 15-25%) for external validation [42] [46].
- Molecular Modeling and Alignment:
- The 3D structures of all compounds are sketched and energy-minimized using a force field (e.g., Tripos Force Field).
- A critical step involves aligning the molecules based on a common scaffold or a postulated pharmacophore model. A consistently active molecule is often used as a template for the alignment [42].
- Descriptor Generation: The aligned molecules are placed in a 3D grid. The CoMSIA similarity indices are calculated for each molecule at every grid point for the selected physicochemical fields.
- Partial Least Squares (PLS) Analysis:
- The relationship between the CoMSIA descriptors (independent variables) and the biological activity, pIC50 (dependent variable), is established using PLS regression.
- The model is initially validated using the leave-one-out (LOO) cross-validation method to determine the optimal number of components (ONC) and the cross-validated correlation coefficient, Q². A Q² > 0.5 is generally considered statistically significant [45] [46].
- A non-cross-validated model is then built using the ONC to calculate the conventional correlation coefficient, R², standard error of estimate (SEE), and F-test value (F) [45].
- Model Validation:
- External Validation: The predictive power of the model is assessed by predicting the activities of the test set compounds, yielding the predictive R² (R²pred) [46].
- Y-Randomization: The biological activities of the training set are randomly shuffled, and new models are generated. The consistently low Q² and R² values from these tests confirm that the original model is robust and not based on chance correlation [42].
Workflow Diagram
The following flowchart summarizes the key stages in the CoMSIA modeling process.
Case Study Analysis and Data Presentation
Exemplary CoMSIA Studies on VEGFR-2 Inhibitors
Recent research demonstrates the robust application of CoMSIA for designing diverse VEGFR-2 inhibitors. The table below summarizes key statistical parameters from several published studies, highlighting the reliability and predictive power of the developed models.
Table 1: Statistical Parameters of Exemplary CoMSIA Models for VEGFR-2 Inhibitors
| Compound Scaffold | Statistical Metric | Value | Field Contributions | Reference |
|---|---|---|---|---|
| Quinazolin-4(3H)-one | Q² | 0.717 | Steric, H-bond Acceptor | [46] |
| R² | 0.995 | |||
| R²pred | 0.832 | |||
| Triazolopyrazine | Q² | 0.575 | Steric, Electrostatic | [42] |
| R² | 0.936 | |||
| R²pred | 0.847 | |||
| Quinoxaline | Q² | 0.631 | Not Specified | [43] |
| R²pred | 0.6974 | |||
| Thieno-pyrimidine (VEGFR3) | Q² | 0.801 | Steric (29.5%), Electrostatic (29.8%), Hydrophobic (29.8%) | [45] |
| R² | 0.897 | |||
| R²pred | 0.762 |
Interpretation of CoMSIA Contour Maps
The CoMSIA model results are visually interpreted through contour maps, which highlight regions in 3D space where specific physicochemical properties favor or disfavor biological activity. These maps are superimposed on the molecular structure of a highly active compound.
- Steric Fields: Green contours indicate regions where bulky groups enhance activity, while yellow contours signify areas where bulky substituents are detrimental.
- Electrostatic Fields: Blue contours show regions where positively charged groups are favorable, and red contours indicate areas where negatively charged groups are preferred.
- Hydrophobic Fields: Yellow contours denote areas where hydrophobic groups increase activity, and white contours show regions where hydrophilic groups are beneficial.
For instance, a study on quinoxaline derivatives revealed specific structural requirements for VEGFR-2 inhibition through contour map analysis, guiding the design of novel compounds with optimized interactions [43]. Molecular dynamics simulations further identified key amino acid residues (Leu838, Phe916, Leu976) involved in critical ligand-receptor interactions, validating the design hypotheses derived from the CoMSIA model [43].
Integration with Broader Anticancer Research
The application of CoMSIA for VEGFR-2 inhibitor design fits within the broader thesis of how 3D-QSAR predicts anticancer compound activity. This methodology is not limited to a single target; it has been successfully deployed for other kinases relevant to cancer, such as the PI3Kα isoform [9] and VEGFR3 [45]. The predictive power of these models lies in their ability to:
- Decipher Key Structural Features: Identify critical physicochemical properties and substituents governing target affinity and selectivity.
- Accelerate Lead Optimization: Virtually screen and prioritize compounds for synthesis, reducing the time and cost of drug discovery.
- Reveal Interaction Mechanisms: Provide insights into ligand-target binding modes, often corroborated by molecular docking and dynamics simulations [43] [44].
This computational strategy forms a synergistic cycle with experimental biology. The models are built on experimental data and, in turn, generate testable hypotheses for the design of novel compounds, which are then synthesized and assayed. The resulting new data can be used to refine the models further, creating an iterative and efficient drug discovery pipeline.
The Scientist's Toolkit: Essential Research Reagents and Materials
Table 2: Key Research Reagents and Computational Tools for CoMSIA Studies
| Reagent / Software Tool | Function / Purpose | Specific Example / Note |
|---|---|---|
| SYBYL-X | Integrated molecular modeling software suite | Used for compound sketching, minimization, alignment, and CoMFA/CoMSIA model generation [42] [46]. |
| Tripos Force Field | Molecular mechanics force field | Used for energy minimization of compound structures to achieve stable low-energy conformations [42] [46]. |
| Gasteiger-Hückel Charges | Method for calculating partial atomic charges | Assigns electrostatic charges to atoms, crucial for calculating the electrostatic field in CoMSIA [42]. |
| PLS Algorithm | Partial Least Squares regression | Statistical method used to correlate CoMSIA fields with biological activity [45] [46]. |
| VEGFR-2 Kinase Assay Kit | In vitro biochemical assay | Measures the half-maximal inhibitory concentration (IC50) of compounds against VEGFR-2 kinase activity [47]. |
| Molecular Dynamics Software (e.g., GROMACS) | Simulation of ligand-receptor dynamics | Used to validate the stability of ligand-receptor complexes predicted by docking (e.g., 100 ns simulations) [43] [42]. |
This case study demonstrates that CoMSIA is a highly effective computational tool within the broader context of 3D-QSAR-based anticancer research. By establishing a quantitative and visual relationship between the physicochemical properties of molecules and their inhibitory activity against VEGFR-2, CoMSIA provides a rational framework for drug design. The robust statistical validation of these models, evidenced by high Q² and R²pred values across diverse chemical scaffolds, confirms their predictive reliability. The insights gained from CoMSIA contour maps directly guide the medicinal chemist in optimizing molecular structures to enhance potency and selectivity. When integrated with complementary techniques like molecular docking, dynamics simulations, and ADMET profiling, CoMSIA significantly expedites the discovery and development of next-generation VEGFR-2 inhibitors, offering a powerful strategy to suppress angiogenesis and overcome cancer resistance.
In modern anticancer drug discovery, the integration of virtual screening and three-dimensional quantitative structure-activity relationship (3D-QSAR) modeling has emerged as a powerful paradigm for efficiently identifying novel therapeutic candidates. These computational approaches dramatically reduce the time and cost associated with traditional drug discovery by prioritizing the most promising compounds for experimental validation. The ZINC database serves as a fundamental resource in this process, providing access to millions of commercially available compounds for virtual screening campaigns. Within the context of anticancer research, these methodologies have proven particularly valuable for identifying compounds that target specific proteins implicated in tumorigenesis, such as mutant kinases, tubulin isotypes, and matrix metalloproteinases.
The core premise of 3D-QSAR lies in its ability to correlate the three-dimensional structural and electrostatic properties of molecules with their biological activities, creating predictive models that can guide the design of novel compounds with enhanced potency. When combined with structure-based virtual screening techniques, researchers can rapidly navigate vast chemical spaces to identify initial hit compounds that simultaneously exhibit strong binding affinity to specific cancer targets and favorable drug-like properties. This integrated approach represents a sophisticated framework for advancing personalized cancer therapeutics, particularly against targets that have proven recalcitrant to conventional drug discovery methods.
Theoretical Foundation: 3D-QSAR and Molecular Docking
3D-QSAR Methodologies
3D-QSAR techniques extend traditional QSAR methods by incorporating spatial and electrostatic molecular parameters to develop models that predict biological activity based on a compound's three-dimensional structure. The most established approaches include Comparative Molecular Field Analysis (CoMFA) and Comparative Molecular Similarity Indices Analysis (CoMSIA), which analyze steric, electrostatic, hydrophobic, and hydrogen-bonding fields around a set of aligned molecules. These methods generate contour maps that visually guide medicinal chemists on where to introduce specific substituents to enhance biological activity [48].
The statistical robustness of 3D-QSAR models is validated through parameters such as R² (coefficient of determination) and Q² (cross-validated correlation coefficient). For instance, in a study on purine-based Bcr-Abl inhibitors, the developed CoMFA model demonstrated a Q² value of 0.8589 and R² value of 0.9521, indicating high predictive accuracy [49]. Similarly, a 3D-QSAR study on 1,2,4-triazine-3(2H)-one derivatives achieved a predictive accuracy (R²) of 0.849 for Tubulin inhibition, with absolute electronegativity and water solubility identified as significant descriptors influencing inhibitory activity [30].
Molecular Docking Principles
Molecular docking serves as the complementary structure-based approach to ligand-based 3D-QSAR, predicting how small molecules bind to protein targets and estimating binding affinity through scoring functions. Docking simulations position small molecules within the binding site of a target protein and evaluate interactions through energy-based scoring functions [50]. Advanced docking protocols incorporate flexibility for both ligand and protein side chains, providing more realistic binding predictions. For anticancer targets, docking is particularly valuable for identifying compounds that can overcome resistance mutations, such as the T315I mutation in Bcr-Abl [48].
Table 1: Key Validation Parameters for 3D-QSAR Models in Anticancer Research
| Parameter | Description | Ideal Value | Example from Literature |
|---|---|---|---|
| R² | Coefficient of determination for training set | >0.8 | 0.9521 for purine-based Bcr-Abl inhibitors [49] |
| Q² | Cross-validated correlation coefficient | >0.5 | 0.8589 for anti-tubercular agents [49] |
| Pearson r-factor | Correlation between predicted and observed activities | Close to 1.0 | 0.8988 for multi-targeted anti-tubercular agents [49] |
| RMSE | Root mean square error | As low as possible | Not specified in results |
Integrated Virtual Screening Workflows
The standard virtual screening workflow integrates multiple computational techniques to systematically identify and optimize potential drug candidates from large compound libraries. The process typically begins with target selection and preparation, followed by compound library screening, hit identification, and experimental validation.
Diagram 1: Integrated Virtual Screening Workflow. This diagram illustrates the multi-step process for identifying novel anticancer compounds from initial target selection to experimental validation.
Structure-Based Virtual Screening
Structure-based virtual screening relies on the three-dimensional structure of the target protein to identify potential binders. In a study targeting mitogen-activated protein kinase-1 (MAPK1), researchers screened approximately 22,000 natural compounds from the ZINC database using molecular docking [50]. The top hits were subsequently evaluated for pan-assay interference compounds (PAINS), ADMET properties, and pharmacological activities using PASS analysis. This rigorous screening identified three natural compounds—ZINC0209285, ZINC02130647, and ZINC02133691—as potential MAPK1 inhibitors with promising anticancer properties [50].
Similarly, for matrix metalloproteinase-9 (MMP-9), a key target in tumor invasion and metastasis, researchers employed a pharmacophore-based virtual screening approach of the ZINC database [51]. This identified five promising MMP-9 inhibitors with excellent drug properties and lower toxicity profiles. Notably, ZINC1069371 demonstrated higher dissociation tendency and lower toxicity compared to other candidates [51].
Ligand-Based Virtual Screening
Ligand-based approaches utilize known active compounds to identify structurally similar molecules with potential enhanced activity. For Bcr-Abl inhibitors, researchers developed 3D-QSAR models based on 58 purine derivatives, then used these models to design new compounds with improved inhibitory activity [48]. The most potent compounds (7a and 7c) demonstrated IC₅₀ values of 0.13 and 0.19 μM, respectively, surpassing the potency of imatinib (IC₅₀ = 0.33 μM) against Bcr-Abl [48].
Machine learning has further enhanced ligand-based screening approaches. In a study targeting the αβIII-tubulin isotype, researchers applied machine learning classifiers to 1,000 initial hits from the ZINC database, narrowing these to 20 active natural compounds [52]. Four compounds—ZINC12889138, ZINC08952577, ZINC08952607, and ZINC03847075—demonstrated exceptional binding affinities to the 'Taxol site' and favorable ADMET properties [52].
Case Studies: Successful Applications in Anticancer Discovery
Targeting Breast Cancer with Natural Products
In an integrated in silico-in vitro screening study against breast cancer targets, researchers screened 187,119 natural compounds from the ZINC database against five proteins implicated in breast tumorigenesis: mutant PIK3CA-E545K, overexpressed ESR1, mutant ERBB4-Y1242C, overexpressed EGFR, and overexpressed ERBB2 [53]. The top 15 compounds (C1-C15) were selected based on binding affinity (≤ -8.6 kcal/mol) and commercial availability, then evaluated for cytotoxicity in breast cancer cell lines (MCF-7, MDA-MB-468, SK-BR-3) and a normal fibroblast line (CCD-1064Sk).
Several hits (notably C3-C7 and C10) demonstrated potent binding with favorable selectivity indices (SI ≥ 2.0), and a clear correlation was observed between more negative docking scores and enhanced cytotoxicity [53]. Structure-activity relationship analysis highlighted molecular planarity and hydrophobic substituents as key drivers of anticancer activity, validating the hybrid virtual and experimental approach for identifying natural product leads for breast cancer therapy.
Overcoming Drug Resistance in Chronic Myeloid Leukemia
The emergence of resistance mutations, particularly the T315I mutation in Bcr-Abl, presents a significant challenge in chronic myeloid leukemia treatment. Researchers addressed this by developing 3D-QSAR models of purine derivatives to design novel Bcr-Abl inhibitors [48]. The resulting compounds were evaluated in imatinib-sensitive CML cells (K562 and KCL22) and imatinib-resistant cells (KCL22-B8).
Compounds 7a and 7c demonstrated the highest inhibition activity on Bcr-Abl (IC₅₀ = 0.13 and 0.19 μM, respectively), surpassing imatinib (IC₅₀ = 0.33 μM) [48]. Importantly, KCL22-B8 cells expressing Bcr-Abl[T315I] showed greater sensitivity to compounds 7e and 7f than to imatinib, indicating these newly identified compounds could potentially overcome this common resistance mechanism. Subsequent molecular dynamics simulations elucidated the structural basis for this enhanced potency against the mutant protein [48].
Table 2: Experimental Results for Novel Bcr-Abl Inhibitors [48]
| Compound | Bcr-Abl IC₅₀ (μM) | GI₅₀ K562 (μM) | GI₅₀ KCL22 (μM) | GI₅₀ KCL22-B8 (T315I) (μM) |
|---|---|---|---|---|
| 7a | 0.13 | Not specified | Not specified | Not specified |
| 7c | 0.19 | 0.30 | 1.54 | Not specified |
| 7e | Not specified | Not specified | Not specified | 13.80 |
| 7f | Not specified | Not specified | Not specified | 15.43 |
| Imatinib | 0.33 | Not specified | Not specified | >20 |
Targeting Tubulin for Breast Cancer Therapy
In the search for novel tubulin inhibitors for breast cancer therapy, researchers explored 1,2,4-triazine-3(2H)-one derivatives using an integrated computational approach combining QSAR modeling, ADMET profiling, molecular docking, and molecular dynamics simulations [30]. The developed QSAR model achieved a predictive accuracy (R²) of 0.849, with absolute electronegativity and water solubility identified as significant descriptors influencing inhibitory activity.
Molecular docking studies identified compound Pred28 with the best docking score of -9.6 kcal/mol against tubulin [30]. Molecular dynamics simulations over 100 ns provided insights into the stability of these interactions, with Pred28 demonstrating notable stability with the lowest root mean square deviation (RMSD) of 0.29 nm and root mean square fluctuation (RMSF) values indicative of a tightly bound conformation to tubulin [30].
Experimental Protocols and Methodologies
Standard Virtual Screening Protocol
A comprehensive virtual screening protocol against cancer targets typically includes the following steps:
Target Preparation: Obtain the three-dimensional structure of the target protein from the Protein Data Bank (e.g., PDB ID: 8AOJ for MAPK1) [50]. Remove water molecules and co-crystallized ligands, add hydrogen atoms, and model missing residues using tools like PyMOL or Modeller.
Compound Library Preparation: Download compound structures from the ZINC database in SDF format. Convert to PDBQT format using Open Babel [52]. Filter compounds using Lipinski's Rule of Five to ensure drug-likeness.
Molecular Docking: Perform high-throughput docking using AutoDock Vina or similar software. Define the binding site based on known active sites or co-crystallized ligands. For MAPK1 inhibitors, researchers used InstaDock for virtual screening [50].
Hit Selection and Analysis: Select top compounds based on binding energy (typically ≤ -8.0 kcal/mol). Analyze protein-ligand interactions using Discovery Studio Visualizer or PyMOL. Identify key hydrogen bonds, hydrophobic interactions, and π-π stacking.
ADMET Prediction: Evaluate absorption, distribution, metabolism, excretion, and toxicity properties using tools like SwissADME or pkCSM [50]. Assess potential pan-assay interference compounds (PAINS).
Molecular Dynamics Simulations: Perform all-atom MD simulations using GROMACS or Desmond for top hits (typically 100-200 ns). Analyze RMSD, RMSF, radius of gyration (Rg), and solvent-accessible surface area (SASA) to evaluate complex stability [30] [50].
3D-QSAR Model Development Protocol
Developing a robust 3D-QSAR model involves these key steps:
Data Set Collection: Compile a series of compounds with known biological activities (e.g., IC₅₀ values). For purine-based Bcr-Abl inhibitors, 58 compounds were used [48].
Molecular Alignment: Generate low-energy 3D structures for each ligand using energy minimization. Align molecules using flexible ligand alignment options in software such as Maestro [49].
Model Generation: Develop CoMFA and CoMSIA models using steric, electrostatic, hydrophobic, and hydrogen-bond field parameters. For anti-tubercular agents, researchers created models with R² value of 0.9521 and Q² value of 0.8589 [49].
Model Validation: Employ leave-one-out cross-validation and external test set validation. Calculate statistical parameters including R², Q², and Pearson r-factor.
Contour Map Analysis: Interpret contour maps to identify regions where specific molecular properties enhance or diminish biological activity.
Table 3: Key Research Reagents and Computational Tools for Virtual Screening
| Resource/Tool | Function | Application Example |
|---|---|---|
| ZINC Database | Repository of commercially available compounds | Source of 187,119 natural compounds for breast cancer target screening [53] |
| RCSB Protein Data Bank | Source of 3D protein structures | Retrieval of MAPK1 structure (PDB ID: 8AOJ) for docking studies [50] |
| AutoDock Vina | Molecular docking software | Virtual screening of 89,399 compounds against αβIII-tubulin isotype [52] |
| GROMACS | Molecular dynamics simulation package | 100-200 ns simulations to assess complex stability [30] [50] |
| PyMOL | Molecular visualization system | Protein structure processing and visualization of docking poses [50] |
| Discovery Studio | Comprehensive modeling suite | Protein preparation and interaction analysis [54] |
| Open Babel | Chemical toolbox | Format conversion for compound libraries [52] |
| SwissADME | Web tool for ADME prediction | Evaluation of drug-likeness and pharmacokinetics [50] |
The integration of virtual screening approaches with 3D-QSAR modeling represents a powerful strategy for identifying novel anticancer compounds from the ZINC database. As demonstrated across multiple case studies, this integrated framework enables researchers to efficiently navigate vast chemical spaces, predict compound activity with remarkable accuracy, and prioritize the most promising candidates for experimental validation. The continuing evolution of these computational methods—particularly through incorporation of machine learning and advanced molecular dynamics simulations—promises to further accelerate anticancer drug discovery. Importantly, these approaches have proven valuable for addressing challenging aspects of cancer treatment, including drug resistance and subtype-specific therapies, ultimately contributing to the development of more effective and personalized anticancer therapeutics.
Overcoming Challenges and Enhancing 3D-QSAR Model Performance
In the relentless pursuit of novel anticancer therapeutics, Three-Dimensional Quantitative Structure-Activity Relationship (3D-QSAR) modeling has emerged as an indispensable computational technique for predicting compound activity and optimizing lead structures. By establishing a correlation between the spatial arrangement of molecular features and biological efficacy against specific cancer targets, 3D-QSAR enables researchers to prioritize promising compounds for synthesis and experimental validation [3]. This approach is particularly valuable in oncology drug discovery, where it has been successfully applied to diverse target classes including protein kinases [55], tubulin [56], and nuclear receptors [25]. The methodology represents a significant advancement over traditional 2D-QSAR by explicitly incorporating stereochemical properties and three-dimensional molecular fields that more accurately represent ligand-receptor interactions [24].
However, the predictive power and practical utility of 3D-QSAR models are frequently compromised by three pervasive challenges: inadequate data set diversity, conformational alignment errors, and statistical overfitting. These pitfalls are particularly acute in anticancer research due to the structural complexity of oncological targets, the heterogeneity of cancer cell lines, and the tremendous economic pressure to accelerate therapeutic development. This technical guide examines these critical challenges within the context of anticancer compound activity prediction, providing detailed methodologies for their identification, mitigation, and validation to enhance the reliability of 3D-QSAR models in drug discovery pipelines.
Pitfall 1: Data Set Diversity and Composition
The Chemical Space Representation Problem
The foundational requirement for any robust QSAR model is a training set that adequately represents the chemical space under investigation. In anticancer research, this is particularly challenging due to the structural diversity of compounds targeting different oncological pathways. A model trained on a narrow region of chemical space will possess a limited applicability domain and poor predictive power for structurally novel scaffolds [3]. The Kier Index of Molecular Flexibility provides a valuable metric for assessing conformational diversity within a data set, with values ranging from 1.7 for fairly rigid molecules to 14.4 for highly flexible compounds [57]. In a study of 146 androgen receptor binders, researchers found that 32.9% of compounds had indices below 3.0 (fairly rigid), 47.9% had indices between 3.0-5.0 (partially flexible), and 19.2% had higher indices (flexible), creating a balanced representation of molecular flexibility [57].
Table 1: Assessing Data Set Diversity Through Molecular Descriptors
| Descriptor Category | Specific Metrics | Optimal Range | Application in Anticancer Studies |
|---|---|---|---|
| Structural Flexibility | Kier Flexibility Index | 1.7-14.4 (balanced distribution) | Androgen receptor binders [57] |
| Physicochemical Properties | logP, Molecular Weight, HBD/HBA | Lipinski's Rule of Five compliance | Maslinic acid analogs for breast cancer [25] |
| Electronic Features | Min exchange energy for C-N bond | Correlation with activity | Dihydropteridone derivatives for glioblastoma [24] |
| Shape Similarity | Tanimoto score | ≥80% for similarity searching | Maslinic acid derivative screening [25] |
Experimental Protocol for Data Set Curation and Validation
To ensure adequate chemical diversity, researchers should implement the following protocol when assembling data sets for anticancer 3D-QSAR modeling:
Compound Collection and Standardization: Gather biologically tested compounds from public databases (ChEMBL, PubChem) and literature sources. For a study on maslinic acid analogs targeting breast cancer MCF-7 cells, 74 compounds were collected from prior literature reports with consistent experimental IC50 values [25]. Standardize structures using tools like ChemBio3D Ultra to convert 2D representations to 3D conformations [25].
Chemical Space Mapping: Apply Principal Component Analysis (PCA) to reduce the complexity of descriptor space and identify principal properties (PPs) that capture maximum variance [3]. Use statistical molecular design (SMD) to ensure these PPs are systematically varied across the entire data set.
Stratified Data Splitting: Partition compounds into training and test sets using activity-stratified selection to maintain similar distributions of activity values and structural features in both sets. In the maslinic acid study, 47 compounds were assigned to training and 27 to test sets [25]. For binary classification models, maintain similar ratios of active to inactive compounds in both sets.
Applicability Domain Definition: Establish the structural and physicochemical boundaries of the model using descriptor ranges present in the training set. This domain determines when model predictions can be considered reliable [3].
Pitfall 2: Molecular Alignment Errors
Conformational Selection and Alignment Methodologies
Molecular alignment represents perhaps the most critical and subjective step in 3D-QSAR model development, with alignment errors directly propagating into distorted molecular field calculations and compromised predictive accuracy. The fundamental challenge lies in approximating the bioactive conformation without explicit knowledge of the target-bound structure, particularly problematic for flexible molecules with multiple low-energy conformers [57].
Multiple alignment strategies have been developed, each with distinct advantages and limitations:
Global Minimum Conformation: Uses the lowest energy conformation from potential energy surface (PES) analysis followed by semi-empirical or quantum mechanical optimization. This approach guarantees consistent, reproducible geometries but may not represent the biologically relevant conformation [57].
Template-Based Alignment: Aligns compounds to one or more template molecules using equal electronic/steric force field contributions or "Best-for-Each" template selection. In androgen receptor binding studies, alignment-to-template approaches produced test set R² values of 0.56-0.61 [57].
Pharmacophore-Based Alignment: Employs field points and shape information to determine a bioactive conformation hypothesis. For maslinic acid analogs, the FieldTemplater module identified a common pharmacophore using compounds M-159, M-254, M-286, M-543, and M-659 as templates [25].
Direct 2D→3D Conversion: Uses simple molecular mechanics conversion without systematic conformational adjustment. Surprisingly, this approach achieved superior results (R²Test = 0.61) for androgen receptor binding data in only 3-7% of the time required for energy-minimized conformations [57].
Table 2: Comparison of Alignment Methods in Anticancer 3D-QSAR Studies
| Alignment Method | Theoretical Basis | Computational Cost | Reported Performance | Best Applications |
|---|---|---|---|---|
| Global Minimum Conformation | Potential energy surface minimization | High | Variable performance [57] | Rigid molecules with single low-energy conformer |
| Template-Based Alignment | Structural similarity to reference molecule | Medium | R²Test = 0.56-0.61 [57] | Congeneric series with known active compound |
| Pharmacophore Alignment | Field point similarity and shape overlap | High | LOO q² = 0.75 [25] | Diverse scaffolds targeting same binding site |
| 2D→3D Direct Conversion | Molecular mechanics without optimization | Low | R²Test = 0.61 [57] | Large datasets with fairly inflexible substrates |
Experimental Protocol for Robust Molecular Alignment
To minimize alignment errors in anticancer 3D-QSAR studies, implement the following standardized protocol:
Conformational Sampling: Generate multiple low-energy conformations for each molecule. Using Forge software with the XED force field, generate up to 100 conformers per compound with a minimization gradient cut-off of 0.1 [25]. For dihydropteridone derivatives targeting glioblastoma, employ the Polak-Ribiere method with root mean square gradient threshold of 0.01 [24].
Pharmacophore Hypothesis Generation: Identify common pharmacophoric elements using active compounds. For cytotoxic quinolines as tubulin inhibitors, categorize ligands as active (pIC50 > 5.5) and inactive (pIC50 < 4.7), then generate pharmacophore hypotheses using Phase module with six built-in features: hydrogen bond acceptor (A), donor (D), hydrophobic (H), negative charge (N), positive charge (P), and aromatic ring (R) [56].
Consensus Alignment Validation: Compare multiple alignment methods and select the approach that produces models with the highest predictive accuracy. For androgen receptor binders, compare energy-minimized, template-aligned, and 2D→3D conformations, then consider consensus predictions from models based on different molecular conformations (achieving R²Test = 0.65) [57].
Alignment Quality Assessment: Quantify alignment quality using similarity scores. In the maslinic acid study, use Forge's similarity score which employs 50% field similarity and 50% Dice volume similarity to evaluate conformer alignment to the pharmacophore template [25].
Pitfall 3: Model Overfitting and Validation Deficiencies
Statistical Overfitting in High-Dimensional Descriptor Space
Overfitting occurs when a model captures noise in the training data rather than the underlying structure-activity relationship, resulting in impressive training set statistics but poor predictive performance on external compounds. This risk is particularly acute in 3D-QSAR due to the high dimensionality of molecular field descriptors, where thousands of grid points may be generated with most having zero occupancy [57]. The problem is compounded in anticancer research where data sets may be small due to the cost and complexity of biological testing.
Traditional validation metrics like R² can be misleading for imbalanced data sets common in drug discovery, where inactive compounds vastly outnumber actives. A recent paradigm shift recommends prioritizing Positive Predictive Value (PPV) over balanced accuracy for virtual screening applications, as PPV directly measures the proportion of true actives among predicted actives in the context of limited experimental testing capacity [58]. Studies demonstrate that models trained on imbalanced datasets achieve hit rates at least 30% higher than models using balanced datasets when evaluated by PPV [58].
Experimental Protocol for Comprehensive Model Validation
To ensure robust, predictive 3D-QSAR models for anticancer activity prediction, implement this multi-tier validation protocol:
Internal Validation using PLS Regression: Apply Partial Least Squares regression to address descriptor collinearity. For maslinic acid analogs, use the SIMPLS algorithm with maximum components set to 20, and validate via Leave-One-Out cross-validation (LOOCV) [25]. In the dihydropteridone derivative study, internal predictivity was measured by q² = 0.2129 [59].
External Test Set Validation: Reserve a sufficiently large portion of compounds (typically 20-30%) that are excluded from model building. For the 62 cytotoxic quinolines, 12 compounds were assigned to the test set with the remaining 50 used for training [56]. Evaluate using predictive R² (pred R²), with the triazole derivative study achieving pred R² = 0.8417 [59].
Y-Randomization Testing: Scramble activity values and rebuild models to confirm that original model performance exceeds random chance. For the quinoline-based tubulin inhibitors, perform Y-randomization with 62 compounds to verify model significance [56].
Progressive Validation: For virtual screening applications, prioritize PPV calculated on top-ranked predictions. In a study of five HTS datasets, models were evaluated based on their ability to identify true actives within the top 128 predictions (simulating a single 1536-well plate), with imbalanced models showing 30% more true positives in this critical range [58].
Table 3: Validation Metrics and Thresholds for Anticancer 3D-QSAR Models
| Validation Type | Key Metrics | Acceptable Thresholds | Exemplary Studies |
|---|---|---|---|
| Internal Validation | LOO q², R² | q² > 0.5, R² > 0.6 | Maslinic acid analogs: q² = 0.75, R² = 0.92 [25] |
| External Validation | pred R², RMSE | pred R² > 0.6, low RMSE | Triazole derivatives: pred R² = 0.8417 [59] |
| Randomization Test | cR²p | > 0.5 | Cytotoxic quinolines: Y-randomization [56] |
| Virtual Screening | PPV, BEDROC | PPV top-128 > 30% | Five HTS datasets: 30% higher hit rate [58] |
Integrated Case Study: 3D-QSAR Analysis of Maslinic Acid Analogs for Breast Cancer
To illustrate the successful implementation of the protocols outlined above, we examine a comprehensive 3D-QSAR study on maslinic acid analogs targeting the MCF-7 breast cancer cell line [25]. This case study exemplifies proper handling of data set diversity, alignment strategy, and validation rigor.
The research team collected 74 compounds from literature sources with consistent IC50 values against MCF-7 cells. Following structure preparation and conversion to 3D coordinates using ChemBio3D Ultra, they addressed the alignment challenge through pharmacophore generation using the FieldTemplater module. With no structural information available for maslinic acid in its target-bound state, they used field and shape information from five representative compounds (M-159, M-254, M-286, M-543, and M-659) to determine a hypothesis for the 3D conformation [25].
The derived pharmacophore template was transferred to Forge software, and all compounds were aligned to this template. Field point-based descriptors were then used to build the 3D-QSAR model after alignment of the training set compounds. The model demonstrated excellent internal predictivity with LOO q² = 0.75 and correlation coefficient R² = 0.92 [25]. External validation on 27 test set compounds confirmed model robustness, with the model successfully identifying compound P-902 as a promising candidate through subsequent virtual screening of the ZINC database [25].
This case study highlights several best practices: (1) use of consistent biological data from the same experimental system; (2) pharmacophore-based alignment to handle structural diversity; (3) appropriate data splitting between training and test sets; and (4) multi-stage validation including external prediction. The resulting model provided insights into the structural requirements for anticancer activity, revealing positive and negative electrostatic regions and hydrophobic patterns contributing to potency against breast cancer cells [25].
The Scientist's Toolkit: Essential Research Reagents and Computational Solutions
Table 4: Essential Computational Tools for Robust 3D-QSAR in Anticancer Research
| Tool Category | Specific Software/Packages | Primary Function | Application Example |
|---|---|---|---|
| Structure Preparation | ChemBio3D Ultra, ChemDraw, HyperChem | 2D to 3D structure conversion, initial optimization | Dihydropteridone derivative optimization [24] |
| Conformational Analysis | Jmol, Forge, FieldTemplater | Conformational search, pharmacophore generation | Maslinic acid analog conformational hunt [25] |
| Molecular Descriptors | CODESSA, Phase | Calculation of quantum chemical, topological descriptors | Dihydropteridone derivative descriptor calculation [24] |
| Statistical Modeling | PLS in Forge, Heuristic Method, kNN-MFA | Model development, validation | kNN-MFA on triazole derivatives [59] |
| Validation Tools | Custom scripts, ROC-AUC analysis | Y-randomization, applicability domain | Cytotoxic quinoline model validation [56] |
The effective application of 3D-QSAR modeling in anticancer compound activity prediction requires meticulous attention to data set composition, molecular alignment, and validation rigor. By implementing the protocols and best practices outlined in this technical guide, researchers can develop more reliable, predictive models that genuinely advance oncology drug discovery. Future directions should focus on integrating 3D-QSAR with complementary approaches like molecular dynamics simulations [55] and deep learning methods to further enhance predictive accuracy while addressing the fundamental challenges of conformational flexibility and biological complexity inherent in anticancer drug development.
In the relentless pursuit of effective anticancer therapeutics, computer-aided drug design has emerged as a pivotal approach for accelerating discovery while reducing associated costs. Within this domain, Three-Dimensional Quantitative Structure-Activity Relationship modeling represents a sophisticated ligand-based strategy that correlates the three-dimensional molecular structures of compounds with their biological activity against specific cancer targets. Unlike traditional 2D-QSAR methods that utilize numerical descriptors invariant to molecular conformation, 3D-QSAR explicitly incorporates the spatial orientation and interaction fields of molecules, providing superior insights for anticancer compound optimization [2].
The application of 3D-QSAR in anticancer research addresses critical challenges in oncology drug development, including drug resistance, off-target toxicity, and the exorbitant costs associated with conventional high-throughput screening. Recent studies demonstrate successful 3D-QSAR implementations across various cancer types, including breast cancer through aromatase inhibition [10], glioblastoma via PLK1 targeting [24], and liver cancer using shikonin oxime derivatives [60]. This technical guide examines advanced optimization strategies within 3D-QSAR workflows, focusing specifically on feature selection techniques and chemical space management to enhance the prediction of anticancer compound activity.
Theoretical Foundations of 3D-QSAR
Core Principles and Methodologies
3D-QSAR methodologies fundamentally rely on the concept that biological activity can be correlated with interaction fields surrounding molecules in their bioactive conformations. The most established approaches include Comparative Molecular Field Analysis and Comparative Molecular Similarity Indices Analysis [2]. CoMFA calculates steric (Lennard-Jones) and electrostatic (Coulomb) fields on a 3D grid surrounding aligned molecules, while CoMSIA extends this concept by employing Gaussian-type functions to evaluate steric, electrostatic, hydrophobic, and hydrogen-bonding fields, offering enhanced tolerance to minor alignment variations [2].
The mathematical foundation of 3D-QSAR typically employs Partial Least Squares regression to handle the high dimensionality and multicollinearity of field descriptors. PLS projects the original variables into a reduced space of latent variables that maximize the covariance between descriptor blocks and biological activity values [25]. Recent advancements incorporate machine learning techniques, including Convolutional Neural Networks to extract key interaction features from molecular grids, demonstrating superior performance over traditional methods in specific applications [61].
Molecular Descriptors in 3D-QSAR
In 3D-QSAR, descriptors are derived from the spatial characteristics of molecules and their interaction potentials. The primary descriptor categories include:
- Steric fields: Represent regions where molecular bulk may interact with target binding sites
- Electrostatic fields: Map areas of positive or negative electrostatic potential
- Hydrophobic fields: Characterize regions correlated with steric bulk and hydrophobicity
- Hydrogen-bonding fields: Identify potential hydrogen bond donor and acceptor regions [2] [25]
These descriptors are calculated at numerous grid points surrounding aligned molecules, creating a comprehensive interaction profile that far exceeds the dimensionality of classical 2D-QSAR approaches.
Feature Selection Strategies in 3D-QSAR
Statistical Approaches for Descriptor Selection
Feature selection constitutes a critical step in 3D-QSAR model development to mitigate overfitting and enhance interpretability. The Heuristic Method provides a linear approach for descriptor selection, employing objective measures including F-test, R², and cross-validated R² to identify optimal descriptor combinations [24]. In application to dihydropteridone derivatives as PLK1 inhibitors for glioblastoma treatment, HM generated a model with R² = 0.6682 and R²cv = 0.5669, utilizing six key descriptors including "Min exchange energy for a C-N bond" which emerged as the most significant contributor [24].
For nonlinear relationships, Genetic Algorithm optimization enables efficient exploration of complex descriptor spaces. Applied to triazole derivatives with anticancer activity, GA-based feature selection identified critical steric (S 1047, S 927) and electrostatic (E 1002) descriptors, yielding a model with correlation coefficient r = 0.9334 and predictive power pred_r² = 0.8417 [59]. The k-Nearest Neighbor Molecular Field Analysis approach further complements these techniques by evaluating local similarity patterns within the chemical space [59].
Machine Learning-Enhanced Feature Extraction
Recent advancements integrate deep learning architectures for automated feature extraction in 3D-QSAR. The L3D-PLS framework employs CNN modules to extract key interaction features from grids surrounding aligned ligands, followed by PLS regression to fit binding affinity [61]. This hybrid approach has demonstrated superior performance over traditional CoMFA across 30 publicly available pre-aligned molecular datasets, particularly beneficial for lead optimization scenarios with limited data, which is commonplace in anticancer drug discovery campaigns [61].
Validation Protocols for Feature Selection
Rigorous validation protocols are essential to ensure selected features yield robust, predictive models. Leave-one-out cross-validation represents the gold standard for internal validation, where each compound is sequentially excluded from training and predicted by a model built from remaining data [2] [25]. External validation through designated test sets provides further assurance of generalizability [24]. For maslinic acid analogs with activity against breast cancer cell line MCF-7, the validated 3D-QSAR model exhibited excellent statistics (r² = 0.92, q² = 0.75), confirming the appropriateness of selected features [25].
Table 1: Performance Metrics of Feature Selection Methods in Anticancer 3D-QSAR Studies
| Feature Selection Method | Cancer Type | Molecular Series | Statistical Performance | Key Descriptors Identified |
|---|---|---|---|---|
| Heuristic Method (HM) [24] | Glioblastoma | Dihydropteridone derivatives | R² = 0.6682, R²cv = 0.5669 | Min exchange energy for C-N bond (MECN) |
| Genetic Algorithm (GA) [59] | Various | 1,2,4-triazole derivatives | r = 0.9334, pred_r² = 0.8417 | Steric (S 1047, S 927), Electrostatic (E 1002) |
| Gene Expression Programming (GEP) [24] | Glioblastoma | Dihydropteridone derivatives | R²train = 0.79, R²validation = 0.76 | Nonlinear descriptor combinations |
| CNN-based L3D-PLS [61] | Various | Multiple public datasets | Superior to traditional CoMFA | Automated feature extraction from molecular grids |
Managing Chemical Space in Anticancer Discovery
Molecular Alignment Strategies
The management of chemical space begins with proper molecular alignment, which establishes a common reference frame for comparative analysis. The fundamental assumption underpinning alignment is that all compounds share similar binding modes with the target protein [2]. Common approaches include:
- Scaffold-based alignment: Utilizing the Bemis-Murcko framework to define core structures by removing side chains and retaining ring systems and linkers
- Maximum Common Substructure: Identifying the largest shared substructure among molecules, beneficial for diverse chemotypes
- Pharmacophore-based alignment: Employing field points and shape similarity to superimpose molecules according to their putative bioactive conformations [2] [25]
In studies on maslinic acid analogs, the FieldTemplater module was used to generate a pharmacophore hypothesis based on field and shape information from reference compounds, ensuring biologically relevant alignment [25]. The quality of molecular alignment directly impacts descriptor calculation and consequently model performance, particularly for alignment-sensitive methods like CoMFA.
Conformational Sampling and Bioactive Conformation
Determining the bioactive conformation represents a significant challenge in 3D-QSAR. When structural information for the target-bound state is unavailable, as was the case with maslinic acid, computational approaches must be employed to approximate this conformation [25]. The XED force field enables extended electron distribution calculations for conformational hunting, employing molecular field-based similarity to design pharmacophore templates that resemble bioactive conformations [25]. For each compound, multiple low-energy conformers are generated and minimized, with the best-matching conformation to the template selected for model building.
Chemical Space Diversity and Representation
Effective chemical space management requires careful balancing of structural diversity with coherent SAR. The training set should encompass sufficient structural variation to explore key molecular interactions while maintaining relatedness to ensure meaningful comparisons [2]. Activity-atlas modeling provides a qualitative approach to visualize explored regions of chemical space, identifying areas where structural features correlate with enhanced activity [25]. For dihydropteridone derivatives, combining the MECN descriptor with hydrophobic field information enabled strategic navigation of chemical space, leading to the design of compound 21E.153 with outstanding antitumor properties [24].
Integrated Experimental Protocols
Standardized 3D-QSAR Workflow Protocol
A comprehensive 3D-QSAR protocol for anticancer compound optimization comprises the following methodological stages:
Data Curation: Assemble a dataset of compounds with uniformly determined biological activities (e.g., IC₅₀ values). For breast cancer aromatase inhibitors, 12 novel drug candidates (L1-L12) were designed and evaluated against reference drug exemestane [10].
Structure Preparation and Optimization: Generate 3D structures from 2D representations using tools like ChemDraw or ChemBio3D. Conduct geometry optimization through molecular mechanics (MM+ or UFF) or quantum mechanical methods (AM1/PM3), cycling until the root mean square gradient reaches ≤0.01 [24] [25].
Conformational Analysis and Alignment: Hunt for low-energy conformations using field-based similarity methods. Align compounds to a common reference frame via scaffold-based or pharmacophore-based approaches [25].
Descriptor Calculation: Compute 3D molecular field descriptors (steric, electrostatic, hydrophobic, hydrogen-bonding) at grid points surrounding aligned molecules [2].
Model Building and Validation: Employ PLS regression with descriptor block scaling. Validate through LOO cross-validation and external test sets, using statistical metrics (Q², R², F-value) to assess robustness [25].
Figure 1: 3D-QSAR Workflow for Anticancer Compound Optimization
Advanced Integrative Protocol
Contemporary anticancer drug discovery increasingly employs integrative computational strategies that combine 3D-QSAR with complementary approaches:
Multi-dimensional QSAR: Develop both 2D and 3D-QSAR models to leverage descriptor complementarity. For dihydropteridone derivatives, 2D models identified key molecular descriptors while 3D-CoMSIA elucidated spatial field contributions [24].
Virtual Screening: Apply validated 3D-QSAR models to screen chemical databases (e.g., ZINC) based on structural similarity to known actives. For maslinic acid analogs, 593 compounds were initially retrieved, with 39 top hits remaining after successive filtering [25].
Molecular Docking and Dynamics: Subject high-predicted-activity compounds to docking studies for binding mode analysis, followed by molecular dynamics simulations to assess complex stability. For shikonin oxime derivatives, this approach confirmed stronger target binding than reference drugs [60].
ADMET Profiling: Evaluate absorption, distribution, metabolism, excretion, and toxicity properties using in silico predictors, applying filters like Lipinski's Rule of Five for oral bioavailability [25].
Retrosynthetic Analysis: Propose synthetic routes for promising candidates to assess synthetic accessibility [10].
Table 2: The Scientist's Toolkit: Essential Resources for 3D-QSAR in Anticancer Research
| Tool Category | Specific Software/Resource | Application in 3D-QSAR Workflow | Key Functionality |
|---|---|---|---|
| Cheminformatics Suites | ChemBio3D [25], HyperChem [24] | Structure preparation and optimization | 2D to 3D structure conversion, geometry minimization |
| Molecular Modeling | Sybyl, RDKit [2], Forge [25] | Conformational analysis, alignment, field calculation | Pharmacophore generation, molecular field computation |
| Descriptor Calculation | CODESSA [24] | Molecular descriptor computation | Quantum chemical, topological, geometrical descriptor calculation |
| Statistical Analysis | PLS modules in Forge, SYBYL [25] | Model building and validation | Partial least squares regression, cross-validation |
| Virtual Screening | ZINC Database [25] | Chemical space exploration | Access to commercially available compound libraries |
Case Studies in Anticancer Optimization
Breast Cancer: Aromatase Inhibitors
In hormone-responsive breast cancer, aromatase inhibition remains a cornerstone therapeutic strategy. An integrative computational study employed QSAR-Artificial Neural Networks combined with molecular docking, ADMET prediction, and molecular dynamics to design novel aromatase inhibitors [10]. Through rigorous virtual screening, 12 proposed drug candidates were evaluated, with one hit (L5) demonstrating significant potential compared to the reference drug exemestane. Stability studies and pharmacokinetic evaluations further reinforced L5 as an effective aromatase inhibitor, with retrosynthetic analysis proposing feasible synthetic routes [10].
Glioblastoma: PLK1 Inhibitors
For the aggressive brain cancer glioblastoma, researchers developed 2D and 3D-QSAR models for dihydropteridone derivatives targeting PLK1 [24]. The 3D-QSAR paradigm exhibited exemplary performance (Q² = 0.628, R² = 0.928), significantly outperforming linear models. By combining the MECN descriptor from 2D-QSAR with hydrophobic field information from 3D-QSAR, researchers designed compound 21E.153, which demonstrated outstanding antitumor properties and docking capabilities [24]. This case highlights the power of descriptor integration across QSAR dimensions for optimizing anticancer activity.
Liver Cancer: Shikonin Oxime Derivatives
In liver cancer research, QSAR modeling guided the optimization of shikonin oxime derivatives, with newly designed compounds exhibiting improved inhibitory potential compared to the parent molecule [60]. Molecular docking revealed stronger binding interactions with target receptors than reference drugs, while molecular dynamics simulations confirmed complex stability. Pharmacokinetic predictions indicated favorable ADMET profiles, suggesting good oral bioavailability and safety for these potential anti-liver cancer agents [60].
Figure 2: Integrated Strategy for Anticancer Compound Optimization
Feature selection and chemical space management represent cornerstone methodologies in 3D-QSAR-enabled anticancer drug discovery. As demonstrated across multiple cancer types, strategic descriptor selection combined with rational navigation of chemical space significantly enhances the prediction and optimization of anticancer compound activity. The integration of traditional statistical approaches with emerging machine learning techniques, particularly CNN-based feature extraction, promises continued advancement in 3D-QSAR predictive capabilities [61].
Future directions in the field point toward increased methodological hybridization, combining 3D-QSAR with structural biology approaches, enhanced dynamics simulations, and multi-omics data integration. Furthermore, the development of more sophisticated alignment-independent methods and automated workflow platforms will expand accessibility and application across diverse anticancer targets. As these computational strategies mature, their capacity to accelerate the discovery of novel, effective, and safer anticancer therapeutics will continue to transform oncology drug development.
Integrating 3D-QSAR with ADMET Predictions for Drug-Likeness
In the field of anticancer drug discovery, the integration of Three-Dimensional Quantitative Structure-Activity Relationship (3D-QSAR) modeling with Absorption, Distribution, Metabolism, Excretion, and Toxicity (ADMET) predictions represents a paradigm shift towards more efficient and rational drug design. This synergistic approach allows researchers to simultaneously optimize for biological potency and drug-like properties early in the development pipeline, significantly reducing late-stage attrition rates [62]. The complexity of cancer pathogenesis, characterized by tumor heterogeneity and dynamic interactions within the tumor microenvironment, necessitates sophisticated computational strategies that can accurately predict compound behavior across multiple biological endpoints [63].
The fundamental premise of this integration lies in the complementary nature of these methodologies. While 3D-QSAR models establish a quantitative relationship between the three-dimensional structural features of compounds and their biological activity against specific cancer targets, ADMET profiling provides critical insights into the pharmacokinetic and safety profiles of these potential drug candidates [64] [65]. When applied within the context of anticancer research, this integrated framework enables the identification of compounds that not only demonstrate potent activity against validated cancer targets such as topoisomerase IIα, tubulin, and aromatase but also exhibit favorable pharmacokinetic properties for clinical translation [64] [62] [30].
Theoretical Foundations of 3D-QSAR
Core Principles and Methodologies
3D-QSAR extends traditional QSAR approaches by incorporating the three-dimensional structural and electronic properties of molecules, thereby providing a more comprehensive understanding of ligand-receptor interactions. The methodology relies on the fundamental assumption that biological activity correlates with molecular interaction fields surrounding the compounds of interest. Two predominant techniques in this domain are Comparative Molecular Field Analysis (CoMFA) and Comparative Molecular Similarity Indices Analysis (CoMSIA), both of which employ statistical methods to correlate spatial molecular properties with biological activity [62].
CoMFA typically characterizes steric (Lennard-Jones) and electrostatic (Coulombic) fields around aligned molecules, while CoMSIA extends this approach to include additional fields such as hydrophobic, hydrogen bond donor, and hydrogen bond acceptor properties [28]. The mathematical foundation of these methods involves Partial Least Squares (PLS) regression, which correlates the interaction energy values at regularly spaced grid points with biological activity values (typically pIC50 or pIC50 = -logIC50) [62] [28].
Molecular Alignment and Field Calculation
A critical step in 3D-QSAR model development is molecular alignment, where compounds are superimposed based on a common scaffold or pharmacophoric features. The alignment strategy significantly influences model quality, as improper alignment can lead to models with poor predictive power. As highlighted in a study on thioquinazolinone derivatives, the most active compound is often selected as a template for alignment to ensure optimal spatial orientation [62].
Following alignment, interaction fields are calculated using a probe atom placed at each grid point. For instance, in CoMSIA studies, a common approach employs "an sp³ carbon atom with a +1 charge and 1.0 Å radius" as the probe to calculate steric, electrostatic, hydrophobic, and hydrogen-bonding fields [28]. The resulting data matrix is then subjected to PLS analysis to extract latent variables that best explain the variance in biological activity.
ADMET Profiling in Anticancer Drug Design
Key ADMET Parameters for Anticancer Compounds
ADMET profiling provides crucial insights into the drug-likeness and developability of potential anticancer agents. Key parameters include human intestinal absorption (HIA), blood-brain barrier (BBB) penetration, cytochrome P450 inhibition, hepatotoxicity, and Ames mutagenicity [64] [65]. These properties collectively determine whether a compound with promising in vitro activity will succeed in subsequent preclinical and clinical development stages.
For anticancer drugs, optimal ADMET properties must balance efficacy with safety considerations. While adequate absorption and bioavailability are essential for reaching systemic circulation and tumor tissues, appropriate metabolism and excretion profiles prevent unwanted accumulation and toxicity [65]. Furthermore, selective toxicity toward cancer cells remains a paramount objective, necessitating careful evaluation of off-target effects and general cytotoxicity.
Computational Approaches for ADMET Prediction
Modern ADMET prediction leverages a variety of computational approaches, including rule-based methods, machine learning models, and physiologically based pharmacokinetic (PBPK) modeling. Molecular descriptors such as logP (lipophilicity), polar surface area (PSA), molecular weight, and hydrogen bond donor/acceptor counts serve as key inputs for these models [65] [30].
Recent advances incorporate molecular dynamics simulations to provide time-dependent insights into drug-membrane interactions and metabolic stability [64] [65]. Additionally, the integration of DFT-calculated electronic properties with traditional descriptors has enhanced the prediction of metabolic susceptibility and reactive metabolite formation [65].
Integrated Workflow: From 3D-QSAR to ADMET Optimization
The sequential integration of 3D-QSAR and ADMET predictions establishes a robust framework for optimizing anticancer compounds. The workflow begins with 3D-QSAR model development to identify structural features enhancing potency, followed by virtual screening of designed compounds, ADMET filtering, and final validation through molecular docking and dynamics simulations [64] [62] [30].
This integrated approach was successfully demonstrated in a study on naphthoquinone derivatives, where researchers developed six QSAR models using Monte Carlo optimization, screened 2300 compounds, identified 16 promising candidates through ADMET filtering, and confirmed target binding through molecular docking and dynamics simulations [64]. Similarly, studies on triazine derivatives and thioquinazolinones have validated this multi-step approach for efficiently advancing anticancer drug candidates [62] [30].
Diagram 1: Integrated Computational Workflow. This flowchart illustrates the sequential process of combining 3D-QSAR modeling with ADMET predictions for anticancer drug design.
Case Studies in Anticancer Research
Naphthoquinone Derivatives as Topoisomerase IIα Inhibitors
A comprehensive study demonstrated the power of integrating QSAR modeling with ADMET screening for identifying naphthoquinone derivatives as potential MCF-7 breast cancer inhibitors. Researchers developed six QSAR models using Monte Carlo optimization with SMILES and molecular graph descriptors, achieving high predictive accuracy for pIC50 values [64].
From an initial set of 2435 naphthoquinone derivatives, the best QSAR model predicted 67 compounds with pIC50 values greater than 6. Subsequent ADMET screening narrowed this list to 16 promising candidates with favorable pharmacokinetic and toxicity profiles [64]. Molecular docking against topoisomerase IIα (PDB: 1ZXM) identified compound A14 as exhibiting the highest binding affinity, which was further validated through 300 ns molecular dynamics simulations that demonstrated stable protein-ligand interactions [64].
Thioquinazolinone Derivatives as Aromatase Inhibitors
In another study focusing on breast cancer, researchers employed 3D-QSAR, molecular docking, and ADMET studies to optimize thioquinazolinone derivatives targeting the aromatase enzyme (PDB: 3S7S) [62]. The best CoMSIA model demonstrated impressive statistical values, indicating high predictive capability for aromatase inhibitory activity [62].
The contour maps generated from the CoMSIA model revealed that electrostatic, hydrophobic, and hydrogen bond donor/acceptor fields significantly influenced inhibitory activity. Based on these insights, researchers designed novel compounds with optimized properties and confirmed their drug-likeness through comprehensive ADMET profiling [62]. This systematic approach enabled the identification of potential aromatase inhibitors with balanced potency and pharmacokinetic properties.
Triazine Derivatives as Tubulin Inhibitors
A study on 1,2,4-triazine-3(2H)-one derivatives showcased the integration of QSAR modeling with ADMET predictions for developing tubulin inhibitors for breast cancer therapy [30]. The QSAR model achieved a predictive accuracy (R²) of 0.849, with descriptors such as absolute electronegativity and water solubility significantly influencing tubulin inhibitory activity [30].
Molecular docking identified Pred28 as the most promising candidate with a docking score of -9.6 kcal/mol against tubulin. ADMET profiling confirmed favorable pharmacokinetic properties, while 100 ns molecular dynamics simulations demonstrated stable binding with a low root mean square deviation (RMSD) of 0.29 nm [30]. This case study highlights how integrated computational approaches can efficiently identify and optimize targeted therapies for breast cancer.
Experimental Protocols and Methodologies
3D-QSAR Model Development Protocol
Step 1: Dataset Preparation and Molecular Alignment
- Curate a structurally diverse set of compounds with reliable biological activity data (e.g., IC50 against specific cancer cell lines)
- Sketch 3D molecular structures using molecular modeling software (e.g., SYBYL, Maestro)
- Optimize geometries using appropriate force fields (e.g., Tripos, OPLS_2005)
- Align molecules using a common scaffold or distill alignment techniques with the most active compound as template [62] [28]
Step 2: Interaction Field Calculation
- Generate a 3D grid box encompassing all aligned molecules
- Calculate steric, electrostatic, hydrophobic, hydrogen bond donor, and hydrogen bond acceptor fields using probe atoms
- For CoMSIA, use a common probe of "an sp³ carbon atom with a +1 charge and 1.0 Å radius" [28]
Step 3: Statistical Analysis and Validation
- Perform Partial Least Squares (PLS) regression to correlate field values with biological activity
- Determine optimal number of components using Leave-One-Out (LOO) cross-validation
- Validate models using external test sets and statistical parameters (R², Q², R²pred) [62] [28]
ADMET Prediction Protocol
Step 1: Descriptor Calculation
- Compute key molecular descriptors: logP, polar surface area (PSA), molecular weight, hydrogen bond donors/acceptors, rotatable bonds
- Calculate electronic properties using Density Functional Theory (DFT) with B3LYP functional and 6-311++G(d,p) or similar basis sets [65]
Step 2: Property Prediction
- Employ validated software/tools (e.g., admetSAR, SwissADME) to predict:
Step 3: Drug-likeness Assessment
- Apply established filters (e.g., Lipinski's Rule of Five, Veber's criteria)
- Evaluate overall drug-likeness and synthetic accessibility [65] [30]
Quantitative Data from Anticancer Studies
Table 1: Statistical Parameters of 3D-QSAR Models in Anticancer Studies
| Compound Class | Target | Model Type | R² | Q² | R²pred | Reference |
|---|---|---|---|---|---|---|
| Naphthoquinones | Topoisomerase IIα | Monte Carlo QSAR | 0.849* | 0.718* | - | [64] |
| Thioquinazolinones | Aromatase | CoMSIA | 0.967 | 0.814 | 0.722 | [62] |
| Phenylindoles | CDK2/EGFR/Tubulin | CoMSIA/SEHDA | 0.967 | 0.814 | 0.722 | [28] |
| Quinolines | Tubulin | Pharmacophore (AAARRR.1061) | 0.865 | 0.718 | - | [56] |
| 1,2,4-Triazine-3(2H)-ones | Tubulin | MLR-QSAR | 0.849 | - | - | [30] |
*Average values across six models; R²: determination coefficient; Q²: cross-validation coefficient; R²pred: external prediction coefficient
Table 2: Key ADMET Parameters for Optimized Anticancer Compounds
| Parameter | Isoxazolines [65] | Naphthoquinones [64] | 1,2,4-Triazine-3(2H)-ones [30] | Thioquinazolinones [62] |
|---|---|---|---|---|
| HIA | High for compound 3b | Favorable for 16 candidates | Reported for Pred28 | Favorable for designed compounds |
| BBB Penetration | Not specified | Not specified | Not specified | Not specified |
| CYP Inhibition | Not specified | Screened | Screened | Screened |
| Hepatotoxicity | Low concern | Low concern for selected compounds | Low concern for Pred28 | Low concern |
| Ames Test | Negative | Negative for selected compounds | Negative for Pred28 | Negative |
| logP | Optimal range | Optimal range | Optimal range | Optimal range |
| Drug-likeness | Compound 3b superior | 16 passed criteria | Pred28 favorable | Designed compounds favorable |
Research Reagent Solutions
Table 3: Essential Computational Tools for Integrated 3D-QSAR and ADMET Studies
| Tool/Software | Function | Application in Anticancer Research |
|---|---|---|
| CORAL | QSAR model development using Monte Carlo optimization | Predict pIC50 of naphthoquinone derivatives against MCF-7 cells [64] |
| SYBYL | Molecular modeling, CoMFA/CoMSIA analysis | 3D-QSAR studies of phenylindole and thioquinazolinone derivatives [62] [28] |
| Schrödinger Suite | Molecular docking, ADMET prediction | Docking studies on quinoline derivatives as tubulin inhibitors [56] |
| Gaussian | DFT calculations for electronic descriptors | Optimization of isoxazoline derivatives and calculation of frontier molecular orbitals [65] |
| GROMACS/AMBER | Molecular dynamics simulations | 100-300 ns simulations to validate stability of protein-ligand complexes [64] [65] |
| admetSAR | ADMET property prediction | Screening of naphthoquinone and triazine derivatives for drug-likeness [64] [30] |
| PaDEL/RDKit | Molecular descriptor calculation | Feature calculation for machine learning-based anticancer prediction [63] |
| AlphaFold | Protein structure prediction | Determination of 3D structures of cancer targets when experimental structures unavailable [4] |
The integration of 3D-QSAR modeling with ADMET predictions represents a transformative approach in anticancer drug discovery, enabling the simultaneous optimization of potency and drug-like properties. Through case studies involving naphthoquinones, thioquinazolinones, triazines, and other chemotypes, this review demonstrates how this integrated framework efficiently identifies promising anticancer candidates against diverse targets including topoisomerase IIα, aromatase, and tubulin.
The provided experimental protocols, quantitative data, and reagent solutions offer researchers a practical roadmap for implementing this approach. As computational methods continue to advance, particularly through incorporation of machine learning and artificial intelligence, the synergy between 3D-QSAR and ADMET predictions will play an increasingly pivotal role in accelerating the discovery of effective anticancer therapies with optimal pharmacological profiles.
Interpreting Contour Maps to Guide Rational Molecular Design
Within modern anticancer drug discovery, the efficient design of novel compounds with optimized activity and pharmacokinetic profiles is paramount. Three-dimensional Quantitative Structure-Activity Relationship (3D-QSAR) modeling has emerged as a powerful computational technique to address this challenge. This guide details the methodology for interpreting the 3D contour maps generated by these models, which visually articulate the critical structural features influencing biological activity. By translating these spatial and electrostatic constraints into design principles, medicinal chemists can strategically guide the rational molecular design of promising anticancer agents, thereby accelerating the hit-to-lead optimization process.
Cancer remains a leading cause of mortality worldwide, driving an urgent need for novel therapeutic agents. In the realm of computer-aided drug design, 3D-QSAR techniques provide a critical link between a molecule's three-dimensional structure and its biological potency by analyzing the physicochemical properties of a set of aligned molecules [25]. Unlike traditional QSAR, which relies on two-dimensional molecular descriptors, 3D-QSAR accounts for the spatial orientation and interaction fields around a molecule, offering a more nuanced view of its interaction with a biological target [56].
The primary methodologies include Comparative Molecular Field Analysis (CoMFA) and Comparative Molecular Similarity Indices Analysis (CoMSIA). These methods calculate steric, electrostatic, hydrophobic, and hydrogen-bond donor/acceptor fields around a set of molecules and correlate these fields with measured biological activities, such as half-maximal inhibitory concentration (IC~50~) against specific cancer cell lines [66] [67]. The output of these analyses is not merely a statistical model but a visual, three-dimensional guide—the contour map. For researchers focused on targets like histone deacetylase 1 (HDAC1), a pivotal epigenetic modulator involved in oncogenesis, or efflux pumps like Multidrug Resistance Protein 1 (MRP1), these maps are indispensable for designing inhibitors with optimized bioactivity and pharmacokinetic profiles [68] [66].
The Foundation: How 3D-QSAR Contour Maps are Generated
The generation of a reliable, interpretable contour map is a multi-step process requiring careful execution at each stage. The following workflow outlines the critical path from biological data to a validated 3D-QSAR model.
Figure 1. Workflow for Generating 3D-QSAR Contour Maps. The process begins with the curation of reliable biological data and proceeds through sequential computational steps to produce validated contour maps. Key stages include structure optimization using methods like Density Functional Theory (DFT), spatial alignment of molecules, and statistical validation.
Data Set Curation and Molecular Alignment
The first step involves assembling a data set of compounds with reliably measured biological activities (e.g., IC~50~ values). The half-maximal inhibitory concentration (IC~50~) is converted to pIC~50~ (-logIC~50~) for analysis, which linearizes the relationship with free energy changes [56] [25]. This set is typically divided into a training set, to build the model, and a test set, to validate its predictive power.
A critical and often challenging step is molecular alignment. The predictive accuracy of a 3D-QSAR model is heavily dependent on the correct spatial superposition of the molecules' putative bioactive conformations. Common alignment methods include:
- Pharmacophore-based alignment: Using a common pharmacophore hypothesis identified from the most active compounds.
- Atom-based alignment: Matching atoms with similar properties across the data set to a template structure [69].
- Field-based alignment: Aligning molecules based on their steric and electrostatic similarity [25].
Misalignment can introduce significant noise, rendering the resulting model unreliable.
Field Calculation, Model Building, and Validation
Once aligned, the molecules are placed within a 3D grid. A probe atom is used to calculate interaction energies (steric and electrostatic in CoMFA; additional hydrophobic and hydrogen-bonding fields in CoMSIA) at thousands of grid points around each molecule [67].
Partial Least Squares (PLS) regression is then used to correlate these field values with the biological activity, resulting in a quantitative model. The model's robustness is evaluated using several statistical parameters:
- r²: The conventional correlation coefficient, indicating the goodness-of-fit.
- q² (or Q²): The cross-validated correlation coefficient, typically obtained via Leave-One-Out (LOO) methods, indicating the model's predictive reliability [56] [25].
- F value: The Fisher statistic, signaling the overall statistical significance of the model.
A model is generally considered predictive when q² > 0.5 [68] [25]. For instance, a study on triazole-containing HDAC1 inhibitors reported a CoMFA model with a high q² of 0.781 and a non-cross-validated r² of 0.966, confirming its high predictive reliability [68].
A Guide to Interpreting Contour Maps for Molecular Design
The final output of the 3D-QSAR analysis is a set of contour maps. Unlike topographic maps that connect points of equal elevation [70] [71], these maps connect points in space where changes in specific molecular fields are predicted to have a favorable or unfavorable impact on biological activity. Interpreting these maps allows the medicinal chemist to "see" the environment of the binding pocket and make informed design decisions.
Decoding the Colors: The Significance of Field Contributions
Contour maps use a standardized color scheme to represent different molecular fields and their favorable/unfavorable regions. The table below summarizes the key contours and their design implications.
| Contour Color & Type | Molecular Field | Favorable Indication (Design Implication) | Unfavorable Indication (Design Implication) |
|---|---|---|---|
| Green | Steric (CoMFA/CoMSIA) | Bulky substituents enhance activity. Introduce large, sterically demanding groups (e.g., aryl rings, tert-butyl). | Bulky substituents hinder activity. Avoid bulky groups; prioritize small/hydrogen atoms. |
| Yellow | Steric (CoMFA/CoMSIA) | Bulky substituents hinder activity. Avoid bulky groups; prioritize small/hydrogen atoms. | Bulky substituents enhance activity. Introduce large, sterically demanding groups. |
| Blue | Electrostatic (CoMFA/CoMSIA) | Electron-deficient groups (positive charge) enhance activity. Introduce electronegative atoms/electron-withdrawing groups. | Electron-rich groups (negative charge) enhance activity. Introduce electropositive atoms/electron-donating groups. |
| Red | Electrostatic (CoMFA/CoMSIA) | Electron-rich groups (negative charge) enhance activity. Introduce electropositive atoms/electron-donating groups. | Electron-deficient groups (positive charge) enhance activity. Introduce electronegative atoms/electron-withdrawing groups. |
| Orange | Hydrophobic (CoMSIA) | Hydrophobic groups enhance activity. Introduce aliphatic/aromatic chains (e.g., phenyl, methyl). | Hydrophobic groups hinder activity. Introduce hydrophilic/polar groups (e.g., hydroxyl, amine). |
| White | Hydrogen Bond Donor (CoMSIA) | H-Bond Donor groups enhance activity. Introduce -OH, -NH₂, etc., oriented toward the contour. | H-Bond Donor groups hinder activity. Remove or shield donors in this region. |
| Cyan | Hydrogen Bond Acceptor (CoMSIA) | H-Bond Acceptor groups enhance activity. Introduce -C=O, -O-, -N-, etc., oriented toward the contour. | H-Bond Acceptor groups hinder activity. Remove or shield acceptors in this region. |
Table 1. Interpretation Guide for 3D-QSAR Contour Maps. The table delineates the standard color codes used in CoMFA and CoMSIA contour maps and provides direct molecular design implications derived from each contour type.
A Practical Example: Designing an HDAC1 Inhibitor
Consider a 3D-QSAR study on triazole-containing HDAC1 antitumor inhibitors [68]. The analysis of contour maps revealed key structural modification sites. For instance:
- A large green steric contour near a specific position on the triazole scaffold suggests that introducing a bulky aromatic ring system at that location would improve activity by filling a hydrophobic pocket in the HDAC1 enzyme.
- A adjacent red electrostatic contour indicates that an electron-rich group (e.g., a methoxy substituent on the aromatic ring) would form a favorable electrostatic interaction with a residue in the binding site.
- Conversely, a yellow steric contour on the opposite side of the molecule would warn against adding bulky groups there, as they would cause steric clashes.
Guided by these maps, researchers designed seven novel analogs with optimized bioactivity and promising ADME/T (Absorption, Distribution, Metabolism, Excretion, and Toxicity) profiles [68].
Integrating Contour Map Analysis with the Drug Discovery Pipeline
Contour map interpretation is not a standalone activity but is integrated into a broader, iterative drug discovery workflow. It bridges the gap between computational modeling and experimental chemistry.
The Iterative Design Cycle
The process is cyclical, as illustrated below.
Figure 2. The Iterative Drug Design Cycle. Insights from contour maps are used to design new analogs virtually. These compounds are screened in silico, synthesized, and tested biologically. The resulting new data is used to refine the 3D-QSAR model and its contour maps, guiding the next round of design in an ongoing optimization loop.
Integration with Other Computational and Experimental Techniques
The hypotheses generated from contour maps are strengthened when combined with other structural biology and computational techniques.
- Molecular Docking: Docking proposed compounds into a crystal structure of the target protein (e.g., COX-2, PdxK) helps validate that the modifications suggested by the contours are geometrically feasible and form specific interactions, such as hydrogen bonds or pi-pi stacking, with key amino acid residues [69] [67].
- Molecular Dynamics (MD) Simulations: MD simulations can assess the stability of the ligand-protein complex over time, providing insight into the dynamic interactions that static contour maps cannot capture [69].
- ADMET Profiling: Promising candidates are subjected to in silico prediction of their pharmacokinetic and toxicological properties. This ensures that optimizing for potency does not come at the cost of poor absorption or high toxicity [68] [25]. For example, a study on maslinic acid analogs filtered predicted compounds through Lipinski's Rule of Five and ADMET risk assessment before selecting them for further study [25].
Essential Research Reagents and Computational Tools
The experimental and computational protocols underpinning 3D-QSAR and contour map analysis rely on a suite of specialized software tools and resources.
| Research Reagent / Software Solution | Primary Function in 3D-QSAR Workflow |
|---|---|
| Schrodinger Suite (Maestro, Phase) | A comprehensive platform for molecular modeling, pharmacophore generation, and 3D-QSAR analysis [56]. |
| Forge (Cresset) | Specialized software for field-based QSAR, pharmacophore generation, and activity-atlas modeling using extended electron distribution (XED) fields [25]. |
| SYBYL/X (Tripos) | The classic software for performing CoMFA and CoMSIA studies, including molecular alignment and field calculation [67]. |
| Open3DAlign | An open-source tool for molecular structure alignment, a critical step in 3D-QSAR model development [69]. |
| Molegro Virtual Docker (MVD) | Software for molecular docking, used to validate the binding mode of designed compounds to the target protein [69]. |
| Gaussian / Spartan | Software for quantum chemical calculations and geometry optimization of ligands using methods like DFT (e.g., B3LYP/6-31G) [69] [67]. |
| PDB (Protein Data Bank) | Repository for 3D structural data of biological macromolecules (e.g., COX-2, PdxK), essential for docking studies and understanding the binding site [69] [67]. |
| ZINC Database | A publicly available database of commercially available compounds for virtual screening to identify new lead structures [25]. |
Table 2. The Scientist's Toolkit: Key Software and Resources for 3D-QSAR. This table lists essential computational tools and databases used in various stages of the 3D-QSAR workflow, from initial structure preparation to final validation.
The ability to interpret 3D-QSAR contour maps is a powerful skill in the arsenal of the modern drug discovery scientist. These maps transform abstract statistical models into tangible, visual guides for molecular design. By clearly delineating regions in space where steric bulk, electrostatic character, or hydrophobic interactions are favored or disfavored, they provide a rational blueprint for the systematic optimization of anticancer agents. When integrated into a holistic discovery pipeline that includes synthetic chemistry, biological testing, and complementary computational techniques like docking and ADMET prediction, contour map analysis significantly de-risks the lead optimization process. This methodology enables researchers to efficiently navigate vast chemical space toward novel, potent, and drug-like anticancer therapeutics, ultimately contributing to the fight against a complex and devastating disease.
Validating Predictions and Integrating 3D-QSAR in a Multi-Method Workflow
In the pursuit of new anticancer therapeutics, three-dimensional quantitative structure-activity relationship (3D-QSAR) modeling serves as a pivotal computational technique for optimizing lead compounds. Unlike traditional 2D methods that rely on molecular descriptors, 3D-QSAR analyzes the spatial arrangement of molecular properties to understand how structural features influence biological activity against specific cancer targets [24] [62]. This approach is particularly valuable in oncology drug discovery, where researchers aim to design compounds that potently inhibit critical targets such as PLK1 for glioblastoma, aromatase for breast cancer, or tubulin for various malignancies [24] [56] [62]. The predictive power and reliability of these models hinge upon rigorous validation using specific statistical metrics, primarily the cross-validated coefficient q² for internal robustness and the coefficient of determination R² for model fit, supplemented by external test set predictions to verify real-world predictive ability [72] [73].
Core Validation Metrics Explained
The Coefficient of Determination (R²)
The coefficient of determination (R²) represents the proportion of variance in the dependent variable (biological activity) that is predictable from the independent variables (3D structural descriptors) in the model. Mathematically, it is calculated as 1 - (SS{res}/SS{tot}), where SS{res} is the sum of squares of residuals and SS{tot} is the total sum of squares. An R² value close to 1.0 indicates that the model accounts for most of the variance in the biological activity data [24] [56]. For instance, in a 3D-QSAR study on thioquinazolinone derivatives against breast cancer, the best CoMSIA model demonstrated an R² value of 0.967, indicating excellent model fit [62]. Similarly, a study on cytotoxic quinolines reported an R² of 0.865 for its pharmacophore model [56]. It is crucial to recognize that a high R² alone does not guarantee predictive power, as models can be overfitted to the training data [72].
The Cross-Validated Coefficient (q²)
The leave-one-out (LOO) cross-validated correlation coefficient (q²) assesses the internal predictive ability of a 3D-QSAR model. In this procedure, one compound is systematically removed from the training set, the model is rebuilt with the remaining compounds, and the activity of the omitted compound is predicted. This process repeats until every compound has been excluded once [56] [25]. The q² value is calculated using the formula: q² = 1 - (PRESS/SS), where PRESS is the predictive sum of squares and SS is the residual sum of squares of the training set [28]. A q² value greater than 0.5 is generally considered statistically significant, while values above 0.7 indicate a robust model [56] [62]. For example, in a study on phenylindole derivatives, the CoMSIA model achieved a high q² of 0.814, demonstrating strong internal predictability [28].
External Test Set Prediction (R²ₚᵣₑ𝒹)
External validation represents the most stringent assessment of a model's predictive power. This process involves reserving a portion of the available compounds (typically 20-30%) as a test set that remains completely unused during model development [24] [62]. After model construction, these test compounds are used for prediction, and the external predictive R² (R²ₚᵣₑ𝒹) is calculated. The R²ₚᵣₑ𝒹 formula is similar to R² but applied solely to the test set: R²ₚᵣₑ𝒹 = 1 - (PRESSₜₑₛₜ/SSₜₑₛₜ) [62]. A model with R²ₚᵣₑ𝒹 > 0.6 is considered to have good external predictive ability [62] [28]. For instance, the CoMSIA model for phenylindole derivatives showed R²ₚᵣₑ𝒹 of 0.722, confirming its validity for predicting new compounds [28].
Table 1: Interpretation Guidelines for Key 3D-QSAR Validation Metrics
| Metric | Excellent | Good | Acceptable | Poor |
|---|---|---|---|---|
| R² | > 0.9 | 0.8-0.9 | 0.7-0.8 | < 0.7 |
| q² | > 0.7 | 0.6-0.7 | 0.5-0.6 | < 0.5 |
| R²ₚᵣₑ𝒹 | > 0.7 | 0.6-0.7 | 0.5-0.6 | < 0.5 |
Advanced Validation Techniques
The rm² Metric and Its Variants
The modified r² (rm²) metric addresses limitations of traditional validation parameters by considering the actual difference between observed and predicted values without reference to training set mean [73]. This provides a more stringent assessment of model predictivity. The rm² parameter has three variants: rm²(LOO) for internal validation, rm²(test) for external validation, and rm²(overall) for analyzing combined performance [73]. This metric is particularly valuable when datasets contain compounds with wide activity ranges, where traditional metrics might yield misleadingly high values [73].
Y-Randomization Test
The Y-randomization test validates that the QSAR model is not the result of a chance correlation. In this procedure, the biological activity values (Y-block) are randomly shuffled while keeping the descriptor matrix unchanged, and new models are built using the randomized activities [56]. This process is typically repeated multiple times (e.g., 50-100 iterations). The resulting models should show significantly lower R² and q² values compared to the original model. If randomized models produce statistics similar to the original, it suggests the original model may be based on chance correlations rather than meaningful structure-activity relationships [56].
Experimental Protocols for 3D-QSAR Validation
Standard Model Development and Validation Workflow
Diagram 1: 3D-QSAR Model Development and Validation Workflow. This flowchart illustrates the standard protocol for building and rigorously validating 3D-QSAR models, highlighting the sequential stages from data preparation to final model acceptance.
Data Set Preparation and Division Protocol
The initial critical step involves curating a high-quality dataset of compounds with reliable biological activity data (typically IC₅₀ or pIC₅₀ values) against specific cancer cell lines or molecular targets [24] [62]. For 3D-QSAR studies on anticancer compounds, datasets typically range from 20 to 70 compounds, such as the 34 dihydropteridone derivatives studied for glioblastoma or the 24 thioquinazolinone derivatives investigated for breast cancer [24] [62]. The dataset is then divided into training and test sets using activity-stratified random partitioning to ensure both sets represent similar activity ranges [56] [25]. A common practice allocates 70-80% of compounds to the training set for model development and 20-30% to the test set for external validation [24] [28]. Molecular structures are sketched using tools like ChemDraw or the sketch module in SYBYL, followed by geometry optimization using molecular mechanics (MM+ or Tripos force field) and semi-empirical methods (AM1 or PM3) until the root mean square gradient reaches 0.01 kcal/mol [24] [28].
Molecular Alignment and Field Calculation Methodology
Molecular alignment represents the most critical step in 3D-QSAR model development. The distill alignment method in SYBYL uses the most active compound as a template, while field-based approaches use field points to determine bioactive conformations [25] [28]. For CoMSIA analysis, descriptor fields are computed within a 3D cubic grid with 2Å spacing that extends beyond the aligned molecules in all directions [28]. A probe atom (typically an sp³ carbon with +1.0 charge and 1.0Å radius) calculates steric, electrostatic, hydrophobic, and hydrogen-bond donor/acceptor properties at each grid point [28]. The field values are derived using Gaussian-type distance functions, with the default attenuation factor (α) set to 0.3 for the hydrophobic field [28].
Partial Least Squares (PLS) Analysis Protocol
PLS regression establishes the correlation between descriptor fields and biological activity values [62] [28]. The optimal number of PLS components is determined through the leave-one-out (LOO) cross-validation procedure, selecting the component count that yields the highest q² value [28]. The model then undergoes non-cross-validated analysis to calculate conventional R², F-value, and standard error of estimate (SEE) [28]. The SEE is calculated as SEE = √[∑(Yₚᵣₑ𝒹 - Yₐ𝒸ₜᵤₐₗ)²/(n - c - 1)], where n is the number of compounds and c is the number of components [28]. Statistical significance is further verified through the Y-randomization test with multiple iterations (typically 50-100) to ensure the model is not based on chance correlation [56].
Table 2: Representative Validation Metrics from Recent Anticancer 3D-QSAR Studies
| Study Compound Class | Cancer Target | R² | q² | R²ₚᵣₑ𝒹 | Reference |
|---|---|---|---|---|---|
| Phenylindole Derivatives | MCF-7 Breast Cancer | 0.967 | 0.814 | 0.722 | [28] |
| Thioquinazolinone Derivatives | Breast Cancer (Aromatase) | Not specified | Not specified | Significant | [62] |
| Cytotoxic Quinolines | A2780 Ovarian Cancer | 0.865 | 0.718 | Not specified | [56] |
| Dihydropteridone Derivatives | Glioblastoma (PLK1) | 0.928 | 0.628 | Not specified | [24] |
| Maslinic Acid Analogs | MCF-7 Breast Cancer | 0.92 | 0.75 | Not specified | [25] |
The Scientist's Toolkit: Essential Research Reagents and Software
Table 3: Essential Computational Tools for 3D-QSAR in Anticancer Research
| Tool/Software | Function in 3D-QSAR | Application Example |
|---|---|---|
| SYBYL | Comprehensive molecular modeling and 3D-QSAR analysis | CoMFA/CoMSIA studies on phenylindole derivatives [28] |
| Schrödinger Suite | Protein and ligand preparation, molecular docking | Pharmacophore modeling of cytotoxic quinolines [56] |
| Forge | Field-based alignment and 3D-QSAR modeling | Maslinic acid analog studies against breast cancer [25] |
| ChemBio3D | 2D to 3D structure conversion and preliminary optimization | Structure preparation for QSAR studies [25] |
| CODESSA | Calculation of diverse molecular descriptors | Descriptor computation for dihydropteridone derivatives [24] |
| HyperChem | Molecular mechanics and semi-empirical optimization | Structure optimization using MM+ and AM1/PM3 methods [24] |
Interrelationships Among Validation Metrics
Diagram 2: Interrelationships Among Key 3D-QSAR Validation Metrics. This diagram illustrates how different validation metrics work together to establish model credibility, highlighting that high R² is necessary but insufficient without complementary validation through q², external prediction, and randomization tests.
Robust validation of 3D-QSAR models using multiple complementary metrics is indispensable for reliable anticancer drug discovery. The integrated assessment of internal validity (q²), model fit (R²), and external predictability (R²ₚᵣₑ𝒹), supplemented by rm² metrics and Y-randomization tests, provides a comprehensive framework for evaluating model quality [72] [73]. These validated models successfully identify critical structural features governing anticancer activity, enabling the rational design of novel compounds with enhanced potency against specific molecular targets in cancer therapy [24] [62] [28]. As computational methods continue to advance, the rigorous application of these validation principles will remain fundamental to translating 3D-QSAR predictions into effective anticancer therapeutics.
Comparing 3D-QSAR with 2D-QSAR and Other Ligand-Based Methods
In the relentless pursuit of innovative anticancer therapies, computational methods have become indispensable for accelerating drug discovery and optimizing lead compounds. Among these methods, Quantitative Structure-Activity Relationship (QSAR) modeling stands as a pivotal ligand-based approach that mathematically correlates chemical structures with biological activity [3]. This technical guide provides an in-depth comparison between traditional 2D-QSAR and advanced 3D-QSAR methodologies, framed within the context of predicting anticancer compound activity. As the chemical space of potential drug molecules is estimated to include 10^200 drug-like compounds, intelligent screening methods like QSAR are not merely advantageous but essential for navigating this vast landscape efficiently [3]. The evolution from 2D to 3D-QSAR represents a significant paradigm shift in computational drug design, offering enhanced predictive capabilities and deeper insights into the structural determinants of anticancer activity.
Fundamental Principles: 2D-QSAR vs. 3D-QSAR
2D-QSAR Foundations and Limitations
Two-dimensional QSAR (2D-QSAR) represents the traditional approach that establishes correlations between biological activity and molecular descriptors derived from two-dimensional structural representations. This methodology relies primarily on molecular descriptors encompassing quantum chemistry, structure, topology, geometry, and electrostatic properties [24]. The Heuristic Method (HM) and Gene Expression Programming (GEP) are commonly employed algorithms for constructing 2D-QSAR models, with the former generating linear models and the latter capable of developing nonlinear models [24].
The fundamental principle underlying 2D-QSAR is that structural variations within a congeneric series of compounds will produce proportional changes in their physicochemical properties, which in turn affect biological activity. However, a significant limitation of conventional 2D-QSAR is its inability to capture spatial relationships and three-dimensional structural features that directly influence ligand-receptor interactions [74]. Despite this limitation, 2D-QSAR remains valuable for preliminary screening and when 3D structural information is unavailable.
3D-QSAR Advancements and Capabilities
Three-dimensional QSAR (3D-QSAR) represents a substantial advancement over traditional approaches by incorporating the spatial orientation and three-dimensional characteristics of molecules. This methodology focuses on those ligand physicochemical properties that can be causatively related to biological reactions, effectively blending the strengths and blunting the limitations of traditional QSAR models [74]. The most representative 3D-QSAR methods include Comparative Molecular Field Analysis (CoMFA) and Comparative Molecular Similarity Index Analysis (CoMSIA) [75] [74].
The core principle of 3D-QSAR involves analyzing molecular force fields and spatial arrangements by placing molecules within a three-dimensional grid and calculating interaction energies at regular grid points using probe atoms [25]. This approach enables the identification of specific regions within the molecular structure where particular physicochemical properties (steric, electrostatic, hydrophobic) either enhance or diminish biological activity. The exceptional capability of 3D-QSAR to account for conformational dependence and align molecules according to their putative bioactive conformation represents its most significant advantage over 2D approaches.
Performance Comparison and Statistical Evaluation
Quantitative Performance Metrics
Multiple studies have conducted head-to-head comparisons between 2D and 3D-QSAR methodologies, revealing distinct performance advantages for 3D approaches in predicting anticancer activity. In a comprehensive study investigating dihydropteridone derivatives as PLK1 inhibitors for glioblastoma treatment, the 3D-QSAR model demonstrated superior statistical performance with exemplary fit characterized by formidable Q² (0.628) and R² (0.928) values, complemented by an impressive F-value (12.194) and a minimized standard error of estimate (SEE) at 0.160 [24]. Conversely, the HM linear 2D model exhibited substantially lower performance with an R² of 0.6682, while the GEP nonlinear 2D model showed intermediate efficacy with coefficients of determination for the training and validation sets at 0.79 and 0.76, respectively [24].
Table 1: Statistical Performance Comparison of 2D-QSAR and 3D-QSAR Models in Anticancer Research
| Study Focus | Model Type | R² | Q² | Standard Error | Reference |
|---|---|---|---|---|---|
| Dihydropteridone derivatives (PLK1 inhibitors) | 3D-QSAR (CoMSIA) | 0.928 | 0.628 | 0.160 | [24] |
| Dihydropteridone derivatives (PLK1 inhibitors) | 2D-QSAR (GEP nonlinear) | 0.79 (training) 0.76 (validation) | - | - | [24] |
| Dihydropteridone derivatives (PLK1 inhibitors) | 2D-QSAR (HM linear) | 0.6682 | 0.5669 | - | [24] |
| Maslinic acid analogs (MCF-7 breast cancer) | 3D-QSAR (Field-based) | 0.92 | 0.75 | - | [25] |
| SARS-CoV-2 Mpro inhibitors | 3D-QSAR (Field QSAR) | 0.96 | 0.81 | - | [76] |
| SARS-CoV-2 Mpro inhibitors | 2D-QSAR (MLP) | 0.91 | 0.68 | - | [76] |
Predictive Accuracy and Model Robustness
The enhanced predictive accuracy of 3D-QSAR models extends beyond statistical measures to practical applications in anticancer drug discovery. In studies on maslinic acid analogs for activity against breast cancer cell line MCF-7, the derived 3D-QSAR model demonstrated exceptional predictive capability with R² and Q² values of 0.92 and 0.75, respectively [25]. Similarly, a comparative analysis of SARS-CoV-2 Mpro inhibitors revealed that 3D-QSAR models consistently outperformed their 2D counterparts, with Field 3D-QSAR achieving an R² test set value of 0.71 compared to 0.69 for the best 2D-QSAR model using multilayer perceptron (MLP) [76].
Notably, the predictive robustness of 3D-QSAR models enables more reliable virtual screening of potential anticancer compounds. For instance, in the maslinic acid study, researchers successfully identified 39 top hits from 593 initial compounds after applying Lipinski's rule of five filters and ADMET risk assessment, with compound P-902 emerging as the best candidate through subsequent docking studies [25]. This demonstrates the practical utility of 3D-QSAR in streamlining the drug discovery pipeline for anticancer agents.
Methodological Workflows and Experimental Protocols
2D-QSAR Implementation Workflow
The implementation of 2D-QSAR follows a systematic protocol beginning with data set acquisition and curation. For anticancer activity modeling, compounds with known experimental activities (e.g., IC₅₀ or GI₅₀ values) are collected from literature or databases, typically comprising 30-100 compounds with structural diversity and a broad activity range [77] [78]. The chemical structures are sketched using tools like ChemDraw and optimized through molecular mechanics force fields (MM+) followed by semi-empirical methods (AM1 or PM3) until the root mean square gradient reaches 0.01 [24].
Molecular descriptor calculation represents the most critical step, with software packages like CODESSA, PaDEL, or Dragon generating hundreds to thousands of descriptors encompassing quantum chemical parameters, topological indices, geometrical descriptors, and electrostatic properties [24] [77]. Descriptor selection employs statistical approaches like genetic algorithm-coupled partial least squares or stepwise multiple regression to identify the most relevant descriptors while avoiding overfitting [75]. Model development utilizes various algorithms including multiple linear regression (MLR), artificial neural networks (ANN), support vector machines (SVM), and random forest (RF), with rigorous validation through leave-one-out (LOO) cross-validation and external test sets [75] [77] [76].
3D-QSAR Implementation Workflow
The 3D-QSAR methodology incorporates additional sophisticated steps that account for spatial molecular features. Following data collection, the process initiates with conformational analysis to identify the bioactive conformation, often using field-based similarity methods or molecular dynamics simulations [25]. For studies where the target-bound structure is unknown, the FieldTemplater module or similar approaches generate pharmacophore hypotheses using field and shape information from highly active compounds [25].
Molecular alignment constitutes the most critical and challenging step, employing techniques such as maximum common substructure (MCS) alignment, pharmacophore-based alignment, or docking-derived alignment to ensure structurally meaningful superimposition of molecules [25] [76]. Following alignment, molecular field calculations sample steric, electrostatic, and hydrophobic properties at grid points surrounding the molecules using probe atoms [25] [74]. Partial least squares (PLS) regression typically develops the 3D-QSAR model, with validation through LOO cross-validation and external test sets assessing predictive capability [25]. The final model visualization identifies regions where specific molecular properties enhance or diminish biological activity, providing direct guidance for molecular design [76].
Applications in Anticancer Research
Case Studies in Various Cancer Types
The application of QSAR methodologies has demonstrated significant utility across multiple cancer types, providing valuable insights for anticancer drug development. In glioblastoma research, dihydropteridone derivatives were investigated as PLK1 inhibitors through integrated 2D and 3D-QSAR approaches, leading to the identification of compound 21E.153 with outstanding antitumor properties and docking capabilities [24]. The study revealed that the most significant molecular descriptor in the 2D model was "Min exchange energy for a C-N bond" (MECN), while the 3D-QSAR hydrophobic field provided additional design insights for novel chemotherapeutic agents [24].
For breast cancer, 3D-QSAR studies on maslinic acid analogs against MCF-7 cell lines enabled researchers to map key structural features controlling anticancer activity and toxicity [25]. The model identified positive and negative electrostatic regions and hydrophobic patterns that influenced activity, facilitating the design of optimized analogs with improved efficacy [25]. Similarly, in melanoma research, QSAR modeling of cytotoxic compounds from the National Cancer Institute (NCI) database successfully predicted activities against SK-MEL-2 cell lines, with the best model showing excellent statistical parameters (R² = 0.864, Q²cv = 0.799) [77]. The designed compounds AN2 and AC4 demonstrated better binding scores (-12.1 and -12.4 kcal/mol, respectively) compared to the known inhibitor vemurafenib (-11.3 kcal/mol) [77].
Integration with Docking and ADMET Profiling
Modern QSAR applications in anticancer research increasingly integrate with complementary computational approaches to enhance predictive accuracy and clinical relevance. Molecular docking studies frequently complement both 2D and 3D-QSAR by validating predicted activities through binding mode analysis and affinity calculations [77] [25] [78]. For instance, in studies on sophoridine derivatives as topoisomerase I inhibitors, QSAR predictions guided the synthesis of 28 novel compounds, with compound 26 exhibiting remarkable inhibitory effects (IC₅₀ = 15.6 μM against HepG-2 cells) that surpassed cisplatin [78]. Docking studies verified that the derivatives exhibited stronger binding affinity with DNA topoisomerase I compared to the parent sophoridine [78].
ADMET (Absorption, Distribution, Metabolism, Excretion, and Toxicity) profiling represents another critical integration point, particularly in 3D-QSAR studies where spatial features directly influence pharmacological properties [25]. The application of Lipinski's rule of five and ADMET risk filters following QSAR-based virtual screening ensures that identified compounds not only exhibit potent anticancer activity but also favorable drug-like properties [25]. This integrated approach significantly enhances the efficiency of the drug discovery pipeline by prioritizing candidates with balanced efficacy and safety profiles.
Research Reagents and Computational Tools
Table 2: Essential Research Reagents and Computational Tools for QSAR Studies
| Tool/Reagent | Function | Application Context |
|---|---|---|
| ChemDraw | Chemical structure sketching and representation | Initial 2D structure creation [24] |
| HyperChem | Molecular mechanics and semi-empirical optimization | Structure optimization using MM+ and AM1/PM3 methods [24] |
| CODESSA | Comprehensive descriptor calculation for QSAR | Calculation of quantum chemical, structural, topological, geometrical, and electrostatic descriptors [24] |
| PaDEL-Descriptor | Molecular descriptor and fingerprint calculation | Generation of structural descriptors for QSAR modeling [77] |
| Gaussian 09 | Quantum chemical calculations | Computation of electronic properties and charge distributions [74] |
| Forge/Cresset | Field-based molecular alignment and 3D-QSAR | Conformational hunt, pharmacophore generation, and field point calculations [25] [76] |
| SYBYL | Comprehensive molecular modeling | CoMFA and CoMSIA implementations for 3D-QSAR [74] |
| RDKit | Open-source cheminformatics | Calculation of molecular descriptors and fingerprints for machine learning QSAR [76] |
The comparative analysis of 2D and 3D-QSAR methodologies reveals a complex landscape where each approach offers distinct advantages and limitations within anticancer drug discovery. While 2D-QSAR provides computationally efficient models suitable for high-throughput screening and preliminary activity prediction, 3D-QSAR delivers superior predictive accuracy and detailed structural insights that directly guide molecular optimization. The integration of both approaches, complemented by molecular docking and ADMET profiling, represents the most powerful strategy for accelerating anticancer drug development. As computational capabilities advance and machine learning algorithms become increasingly sophisticated, the synergy between 2D and 3D-QSAR methodologies will continue to enhance their predictive power, solidifying their role as indispensable tools in the ongoing battle against cancer.
The discovery of new anticancer agents is a critical yet challenging endeavor, characterized by high costs and low success rates. In this context, Computer-Aided Drug Design (CADD) provides powerful tools to accelerate and rationalize the process [21] [79]. Among the most effective strategies in modern computational oncology is the integration of multiple CADD techniques into a cohesive workflow. This whitepaper details a synergistic methodology that combines Three-Dimensional Quantitative Structure-Activity Relationship (3D-QSAR) modeling with molecular docking and molecular dynamics (MD) simulations to predict, evaluate, and validate the activity of potential anticancer compounds [10].
The core strength of this integrated approach lies in the complementary nature of these techniques. 3D-QSAR models identify critical structural and electronic features required for biological activity, providing a blueprint for compound design and optimization. Molecular docking then offers a static, atomistic view of how these designed compounds might interact with a specific protein target. Finally, molecular dynamics simulations bring these interactions to life, revealing the stability and behavior of the drug-target complex under physiologically relevant conditions over time [30]. When framed within anticancer research, this workflow provides a robust framework for understanding and inhibiting the molecular drivers of cancer progression, such as the PI3Kα isoform implicated in various malignancies [9] or Tubulin, a pivotal protein in cancer cell division [30]. This guide provides a technical deep-dive into this synergistic methodology, complete with protocols, data interpretation guidelines, and visualizations for the practicing computational researcher.
Theoretical Foundations and Key Components
The Role of 3D-QSAR in Predicting Anticancer Activity
3D-QSAR establishes a mathematical relationship between the three-dimensional structural properties of a set of molecules and their biological activities. Unlike traditional QSAR, which relies on global molecular descriptors, 3D-QSAR techniques consider the spatial arrangement of molecular features, providing a contour map that visually guides chemical modification [21].
In anticancer research, this is crucial for understanding what makes a compound toxic to cancer cells. Techniques such as Comparative Molecular Field Analysis (CoMFA) and Comparative Molecular Similarity Indices Analysis (CoMSIA) are widely used. They calculate steric (shape), electrostatic, hydrophobic, and hydrogen-bonding fields around a set of aligned molecules. The resulting model can predict the activity of new, untested compounds, prioritizing the most promising candidates for synthesis and biological evaluation [9] [80]. For instance, a 3D-QSAR study on 1,2,4-triazine-3(2H)-one derivatives as Tubulin inhibitors revealed that descriptors like absolute electronegativity (χ) and water solubility (LogS) were critical determinants of their inhibitory activity against MCF-7 breast cancer cells [30].
Molecular Docking for Binding Mode Elucidation
Molecular docking predicts the preferred orientation and conformation of a small molecule (ligand) when bound to its macromolecular target (e.g., a protein) [81]. The primary outputs are a binding pose and a docking score representing the estimated binding affinity.
In the context of an integrated workflow, docking serves two key purposes:
- Pose Prediction: It elucidates the atomic-level interactions (e.g., hydrogen bonds, hydrophobic contacts, pi-stacking) that stabilize the ligand in the protein's binding pocket. This helps explain the structure-activity relationship suggested by the 3D-QSAR model.
- Virtual Screening: It can rapidly screen thousands of compounds generated from QSAR-guided design to identify those with the strongest predicted binding to the target, such as HSP90 in cancer therapy [82] or the adenosine A1 receptor in breast cancer [83].
Molecular Dynamics for Assessing Complex Stability
A docking pose provides a single, static "snapshot" of the binding event, which may not be representative of the dynamic reality in a biological system. Molecular dynamics simulations address this limitation by modeling the time-dependent behavior of the protein-ligand complex in a solvated environment [81] [30].
By applying Newton's laws of motion, MD simulations show how the complex evolves, assessing the stability of the predicted binding mode. Key metrics analyzed include:
- Root Mean Square Deviation (RMSD): Measures the stability of the protein and ligand backbone over time. A stable complex will plateau at a low RMSD value (e.g., below 2.5 Å) [81].
- Root Mean Square Fluctuation (RMSF): Assesses the flexibility of individual protein residues, highlighting regions that become more or less flexible upon ligand binding.
- Radius of Gyration (Rg): Indicates the overall compactness of the protein structure.
For example, an MD study on a triazole derivative bound to the A2A adenosine receptor confirmed complex stability with RMSD values below 2.5 Å, validating the initial docking predictions [81].
Integrated Workflow and Experimental Protocols
The following section outlines a standardized, end-to-end protocol for implementing the synergistic 3D-QSAR, docking, and MD workflow in anticancer drug discovery.
Visual Workflow of the Integrated Computational Approach
The diagram below illustrates the sequential and iterative nature of the combined computational methodology.
Detailed Experimental Protocols
Protocol 1: Developing a Robust 3D-QSAR Model
This protocol is adapted from studies on 1,2,4-triazine-3(2H)-one derivatives as Tubulin inhibitors and acylshikonin derivatives with antitumor activity [30] [84].
Data Set Collection:
- Curate a dataset of 20-30 compounds with known anticancer activity (e.g., IC50 or pIC50 values) against a specific cell line (e.g., MCF-7) or protein target.
- Divide the dataset into a training set (~80%) for model building and a test set (~20%) for external validation. A randomized split is recommended to avoid bias [30].
Molecular Modeling and Descriptor Calculation:
- Use software like Gaussian 09W to optimize the 3D geometry of each compound using Density Functional Theory (DFT) methods (e.g., B3LYP functional with a 6-31G(d,p) basis set) [30].
- Calculate a range of electronic and topological descriptors. Electronic descriptors include:
- EHOMO / ELUMO: Energy of the Highest Occupied and Lowest Unoccupied Molecular Orbitals.
- Absolute Electronegativity (χ): χ = (ELUMO + EHOMO)/2
- Absolute Hardness (η): η = (ELUMO - EHOMO)/2
- Dipole Moment (μm)
- Calculate topological descriptors using software like ChemOffice:
Model Construction and Validation:
- Employ statistical methods like Multiple Linear Regression (MLR) or Principal Component Regression (PCR) to build the model [21] [84].
- Validate the model rigorously. Key statistical parameters include:
- R²: Coefficient of determination for the training set (should be >0.8).
- Q²: Cross-validated correlation coefficient (should be >0.6).
- R²test: Predictive power on the external test set (should be close to R²) [30].
- The final model will be an equation, e.g., pIC50 = C + a(χ) + b(LogS) + ..., which can predict the activity of new designs.
Protocol 2: Structure-Based Design via Molecular Docking
This protocol is based on methodologies used to study triazole derivatives and rosemary-derived compounds as HSP90 inhibitors [81] [82].
Protein and Ligand Preparation:
- Obtain the 3D structure of the target protein (e.g., Tubulin, HSP90, PI3Kα) from the Protein Data Bank (PDB).
- Prepare the protein using a tool like the Protein Preparation Wizard (Schrödinger) or CHARMMM. Steps include adding hydrogen atoms, assigning bond orders, filling in missing loops/side chains, and optimizing the H-bond network [83] [82].
- Prepare the ligands designed from the QSAR study. Generate 3D structures, assign correct protonation states at biological pH (e.g., using LigPrep in Schrödinger), and minimize their energy [82].
Docking Simulation and Pose Analysis:
- Define the binding site on the protein, typically based on the known location of a co-crystallized native ligand.
- Perform docking calculations using programs like Glide (Schrödinger), AutoDock Vina, or CHARMM.
- Analyze the top-scoring poses for key interactions with amino acids in the binding site. For example, selective PI3Kα inhibitors should form specific interactions with non-conserved residues like αVal851 and αGln859 to achieve selectivity over other isoforms [9].
Protocol 3: Stability Validation via Molecular Dynamics Simulations
This protocol follows the analysis performed on tubulin and protein-ligand complexes to confirm binding stability [81] [30].
System Setup:
- Use the best docking pose as the starting structure for the simulation.
- Solvate the protein-ligand complex in a triclinic water box (e.g., TIP3P water model) and add ions (e.g., Na+, Cl-) to neutralize the system's charge and mimic physiological ionic strength.
Simulation Execution:
- Use software like GROMACS or AMBER to run the simulation.
- Employ a force field such as CHARMM27 or AMBER ff14SB for proteins and GAFF for small molecules.
- The typical simulation protocol involves:
- Energy minimization to remove steric clashes.
- Gradual heating of the system to 310 K (body temperature) over 100 ps.
- Equilibrium of the system at constant temperature and pressure (NPT ensemble) for 100 ps-1 ns.
- Production run for a minimum of 100 ns (longer for more rigorous analysis) [30].
Trajectory Analysis:
- Calculate the RMSD of the protein backbone and the ligand to assess overall stability.
- Calculate the RMSF of protein residues to identify flexible regions.
- Calculate the Radius of Gyration (Rg) to monitor protein compactness.
- Specific to binding, analyze the number and stability of hydrogen bonds between the ligand and protein throughout the simulation.
Data Presentation and Analysis
Table 1: Representative Quantitative Outcomes from Anticancer Drug Discovery Studies Applying the Integrated Workflow.
| Study Focus / Compound | 3D-QSAR Model Performance | Docking Score (kcal/mol) | MD Simulation Stability (RMSD, nm) | Key Biological Activity |
|---|---|---|---|---|
| 1,2,4-Triazine-3(2H)-one derivatives (Pred28) [30] | R² = 0.849, Q² = 0.732 | -9.6 (Tubulin) | Ligand: ~0.29 (stable) | Potent tubulin inhibition; anti-breast cancer activity |
| Triazole derivative (Compound 1d) [81] | N/A | -7.882 to -9.107 (across multiple targets) | Complex: < 2.5 Å (stable) | Multi-target inhibitor against HDAC6, A2A receptor, TYRP1 |
| Acylshikonin derivatives (Compound D1) [84] | PCR R² = 0.912, RMSE = 0.119 | -7.55 (Target 4ZAU) | N/Reported | Promising cytotoxic activity |
| Rosemary-derived compounds (Rosmanol) [82] | N/A | Strong predicted affinity (HSP90) | Complex stable over simulation | Potential HSP90 inhibitor for cancer therapy |
| Novel Molecule 10 [83] | Pharmacophore-based screening | Stable binding (7LD3) | N/Reported | IC50 = 0.032 µM (MCF-7 cells) |
The Scientist's Toolkit: Essential Research Reagents and Software
Table 2: Key computational tools and resources essential for executing the integrated workflow.
| Category / Item | Specific Examples | Primary Function in the Workflow |
|---|---|---|
| Computational Chemistry Suites | Gaussian 09W, ChemOffice | Quantum chemical calculations and topological descriptor generation for QSAR. |
| Statistical Analysis Software | XLSTAT, R | Statistical model development (MLR, PCR) and validation for QSAR. |
| Molecular Docking Platforms | Glide (Schrödinger), AutoDock Vina, CHARMM | Predicting ligand binding poses and affinities to the protein target. |
| Molecular Dynamics Engines | GROMACS, AMBER | Simulating the dynamic behavior and stability of protein-ligand complexes. |
| Visualization & Analysis Tools | Discovery Studio Visualizer, VMD, PyMOL | Preparing structures, visualizing docking poses, and analyzing MD trajectories. |
| Chemical Databases | Protein Data Bank (PDB), PubChem, ChEMBL | Sourcing protein structures and chemical compounds for dataset creation. |
The synergistic combination of 3D-QSAR, molecular docking, and molecular dynamics simulations represents a powerful and rational paradigm in modern anticancer drug discovery. This integrated workflow creates a virtuous cycle of design, prediction, and validation. 3D-QSAR provides the foundational understanding of the structural features governing potency, guiding the design of novel compounds. Molecular docking offers a structural hypothesis for target engagement, and molecular dynamics subjects this hypothesis to the rigorous test of time and motion, confirming whether a stable interaction is likely to occur in a biological context [10] [30].
As computational power increases and algorithms become more sophisticated, this synergistic approach is poised to become even more central to drug discovery efforts. The application of Artificial Intelligence (AI) and machine learning, particularly in analyzing complex QSAR models and MD trajectories, promises to further enhance the speed and predictive accuracy of this pipeline [79]. By adopting this comprehensive computational strategy, researchers can significantly de-risk the early drug discovery process, efficiently prioritizing the most promising anticancer candidates for costly and time-consuming experimental studies, thereby accelerating the journey toward new and more effective cancer therapies.
The discovery and development of new anticancer agents represent a critical frontier in the ongoing battle against cancer. Among the various computational approaches accelerating this process, Three-Dimensional Quantitative Structure-Activity Relationship (3D-QSAR) modeling has emerged as a powerful predictive tool in rational drug design. This methodology quantitatively correlates the three-dimensional molecular structures of compounds with their biological activity, enabling researchers to predict the potency of novel compounds before synthesis and biological testing [3]. The application of 3D-QSAR is particularly valuable in oncology, where it helps optimize lead compounds, understand ligand-receptor interactions, and identify critical chemical features responsible for anticancer efficacy [85] [86].
This whitepaper presents three detailed case studies demonstrating the real-world impact of 3D-QSAR in anticancer drug discovery for breast cancer, leukemia, and ovarian cancer. Each case study provides a comprehensive examination of the methodologies employed, key findings, and experimental protocols, offering researchers and drug development professionals actionable insights into the practical application of these computational techniques.
Breast Cancer Case Study: 3D-QSAR of Maslinic Acid Analogs
Background and Rationale
Breast cancer remains the most prevalent cancer among women worldwide, accounting for nearly 1 in 3 cancer diagnoses and approximately 27% of all cancers in women [86]. The growing incidence of breast cancer and the development of drug resistance to existing therapeutics necessitate the discovery of new treatment options. Natural products serve as excellent sources for modern cancer drug development, with maslinic acid—a triterpenoid derived from dry olive-pomace oil—emerging as a promising anticancer compound [86]. This case study details the development of a field-based 3D-QSAR model to guide the optimization of maslinic acid analogs against human breast cancer cell line MCF7.
Methodology and Experimental Protocol
Data Collection and Structure Preparation: A training dataset of 74 compounds with known IC50 values against MCF7 cells was assembled from literature sources. Two-dimensional chemical structures were converted into three-dimensional structures using ChemBio3D Ultra software [86].
Conformational Analysis and Pharmacophore Generation: The FieldTemplater module in Forge v10 software was employed to determine the bioactive conformation using field and shape information from five reference compounds (M-159, M-254, M-286, M-543, and M-659). Molecular fields—including positive/negative electrostatic, shape (van der Waals), and hydrophobic fields—were calculated using the eXtended Electron Distribution (XED) force field [86].
Compound Alignment and 3D-QSAR Model Development: Compounds were aligned against the pharmacophore template, and field point-based descriptors were used to build the 3D-QSAR model. The Partial Least Squares (PLS) regression method with the SIMPLS algorithm was applied, with maximum components set to 20, sample point maximum distance at 1.0 Å, and 50 Y scrambles. The dataset was partitioned into training (47 compounds) and test (27 compounds) sets using activity stratification [86].
Model Validation: The model was validated using the leave-one-out (LOO) cross-validation method, yielding a regression coefficient (r²) of 0.92 and cross-validation coefficient (q²) of 0.75. Predictive power was further assessed using the external test set [86].
Virtual Screening and Hit Identification: The ZINC database was screened for compounds with >80% structural similarity to maslinic acid. Identified hits were filtered through Lipinski's Rule of Five for oral bioavailability and ADMET risk assessment for drug-like properties [86].
Table 1: Statistical Parameters of the 3D-QSAR Model for Maslinic Acid Analogs
| Parameter | Value | Interpretation |
|---|---|---|
| r² | 0.92 | Excellent model fit |
| q² | 0.75 | Good predictive ability |
| Number of Components | 4 | Optimal complexity |
| Sample Point Distance | 1.0 Å | Grid resolution |
| Training Set Size | 47 compounds | Model building |
| Test Set Size | 27 compounds | Model validation |
Key Findings and Impact
The developed 3D-QSAR model demonstrated excellent predictive capability for the anticancer activity of maslinic acid analogs. Activity-atlas models generated from the study revealed key structural requirements for potency, including:
- Specific hydrophobic regions that enhance activity
- Electrostatic patterns critical for target interaction
- Defined steric constraints that influence binding
Virtual screening of 593 compounds from the ZINC database, followed by drug-likeness filtering, identified 39 top hits. Subsequent docking studies against potential breast cancer targets (AKR1B10, NR3C1, PTGS2, and HER2) revealed compound P-902 as the most promising candidate [86]. This compound showed strong binding affinity and favorable physicochemical properties, positioning it as a valuable lead for further development in breast cancer therapeutics.
Leukemia Case Study: Network Pharmacology and 3D-QSAR of Eclipta prostrata
Background and Rationale
Acute myeloid leukemia (AML) is an aggressive hematological malignancy with a poor prognosis, particularly in older patients where the 5-year overall survival rate is only 10-20% [87]. The medicinal plant Eclipta prostrata has demonstrated promising anticancer properties against AML, but its mechanism of action remained largely unexplored. This case study employs an integrated computational approach combining network pharmacology, molecular docking, dynamics simulations, and 3D-QSAR modeling to elucidate the anti-AML mechanisms of E. prostrata constituents [87].
Methodology and Experimental Protocol
Compound Selection and Screening: Bioactive compounds from E. prostrata were obtained from the IMPPAT 2.0 database, with additional taxonomic and bioactivity data gathered from PubChem and PubMed. ADMET properties were evaluated using SwissADME and pkCSM platforms [87].
Quantum Chemical Calculations: Density Functional Theory (DFT) calculations were performed using Gaussian software with the B3LYP algorithm and 6-311G basis set to determine thermodynamic, electronic, and reactivity properties of the compounds [87].
Target Prediction and Network Pharmacology: The SwissTargetPrediction platform was used to identify potential protein targets, followed by protein-protein interaction network construction, gene ontology enrichment, and pathway analysis [87].
Molecular Docking and Dynamics: Molecular docking against key AML targets FLT3 and PIM1 was performed, with top complexes subjected to 200ns molecular dynamics simulations. Binding free energies were calculated using MM-GBSA [87].
3D-QSAR Model Development: 3D-QSAR models for both FLT3 and PIM1 inhibitors were developed using the comparative molecular field analysis (CoMFA) approach. Model robustness was evaluated using statistical parameters [87].
Table 2: Binding Affinities and Predicted IC50 Values of Eclipta prostrata Compounds Against AML Targets
| Compound | Target | Docking Score (kcal/mol) | MM-GBSA (kcal/mol) | Predicted IC50 (nM) |
|---|---|---|---|---|
| Kaempferol | FLT3 | -8.931 | -73.75 | 493.17 |
| Apigenin | FLT3 | -8.752 | -68.76 | 588.84 |
| Tricetin | PIM1 | -8.634 | -64.28 | 406.44 |
| Diosmetin | PIM1 | -7.780 | -52.20 | 523.60 |
| Pacritinib (Control) | FLT3 | -5.403 | -51.27 | - |
| SEL24 (Control) | PIM1 | -6.385 | -53.38 | - |
Key Findings and Impact
The comprehensive in silico analysis identified 12 potential anti-cancer compounds from E. prostrata. Molecular docking revealed strong binding affinities of kaempferol and apigenin to FLT3, and tricetin and diosmetin to PIM1—all superior to control inhibitors [87]. The developed 3D-QSAR models showed robust predictive power with R² values of 0.95 for FLT3 and 0.96 for PIM1, and Q² values of 0.85 and 0.93, respectively [87].
The study also identified key regulatory elements, including microRNAs (hsa-mir-335-5p, hsa-mir-150-5p) and transcription factors (ABL1, RUNX1) regulating the target genes. FLT3 and MPO were pinpointed as specific diagnostic and prognostic biomarkers for AML [87]. These findings provide a comprehensive mechanistic understanding of E. prostrata's anti-AML activity and offer valuable leads for further experimental validation and drug development.
Ovarian Cancer Case Study: 3D-QSAR and Molecular Dynamics of Flavonoids Targeting AKT1
Background and Rationale
Ovarian cancer ranks as the fifth leading cause of cancer deaths in females, with poor survival rates due to limited early screening methods and ineffective treatments for advanced disease [55]. The AKT1 protein, a serine-threonine kinase that mediates the PI3K/AKT/mTOR signaling pathway, plays a decisive role in cross-talk cell signaling in ovarian cancer. This case study focuses on molecular docking, dynamics simulations, and 3D-QSAR modeling of flavonoids targeting the W80R mutant of AKT1, a gain-of-function mutation associated with ovarian cancer progression [55].
Methodology and Experimental Protocol
Virtual Screening and Compound Selection: A library of 12,000 flavonoids was screened for drug-likeness using Lipinski's Rule of Five. ADMET properties were evaluated to assess pharmacokinetic profiles [55].
Molecular Docking: Molecular docking studies were performed against the W80R mutant AKT1 protein using Glide software. Binding modes and interaction patterns were analyzed for top-ranking compounds [55].
Molecular Dynamics Simulations: Molecular dynamics simulations (MDS) were conducted for 100ns under physiological conditions to evaluate the stability and conformational behavior of ligand-protein complexes [55].
3D-QSAR Model Development: A 3D-QSAR model was developed using the partial least squares (PLS) method, yielding a correlation coefficient (R²) of 0.822 and cross-validation coefficient (Q²) of 0.6132 at 4 components [55].
Binding Free Energy Calculations: The MM-PBSA/GBSA methods were employed to calculate binding free energies for the top complexes from molecular dynamics simulations [55].
Key Findings and Impact
Taxifolin emerged as the most promising flavonoid, demonstrating a high docking score of -9.63 kcal/mol with the W80R mutant AKT1 [55]. Key interactions included hydrogen bonds with GLU234, ASP274, and LEU156 residues, along with π-cation and hydrophobic interactions with LYS276 [55].
The 3D-QSAR model provided insights into structural requirements for AKT1 inhibition, identifying specific steric, electrostatic, and hydrophobic features contributing to binding affinity. Molecular dynamics simulations confirmed the stability of the taxifolin-W80R complex, with minimal deviation and stable hydrogen bonding patterns throughout the simulation period [55].
This study provides a structural basis for the development of flavonoid-based AKT1 inhibitors, with taxifolin representing a promising lead compound for further optimization and experimental validation in ovarian cancer models.
Table 3: Key Research Reagent Solutions for 3D-QSAR in Anticancer Research
| Reagent/Resource | Function/Application | Example Sources/Tools |
|---|---|---|
| Chemical Databases | Source of compound structures and bioactivity data | ZINC, PubChem, IMPPAT 2.0 |
| Molecular Modeling Software | Structure preparation, conformational analysis, QSAR model development | ChemBio3D, Forge, SYBYL |
| Docking Tools | Prediction of ligand-protein interactions and binding modes | AutoDock, Glide, Molecular Operating Environment (MOE) |
| Dynamics Simulation Packages | Assessment of complex stability under physiological conditions | GROMACS, AMBER, Gaussian |
| ADMET Prediction Platforms | Evaluation of drug-likeness and pharmacokinetic properties | SwissADME, pkCSM |
| Target Prediction Servers | Identification of potential protein targets for bioactive compounds | SwissTargetPrediction |
| Statistical Analysis Tools | QSAR model development and validation | R, Python, Scikit-learn |
Integrated Workflow and Signaling Pathways
The application of 3D-QSAR in anticancer drug discovery follows a systematic workflow that integrates multiple computational approaches. The diagram below illustrates this integrated methodology:
Integrated Computational Workflow for 3D-QSAR in Anticancer Discovery
The following diagram illustrates key cancer signaling pathways targeted in the case studies, highlighting protein targets and compound interactions:
Key Cancer Signaling Pathways and Compound Targeting
The case studies presented in this whitepaper demonstrate the significant real-world impact of 3D-QSAR modeling in anticancer drug discovery across three major cancer types. In breast cancer research, 3D-QSAR guided the optimization of maslinic acid analogs, identifying compound P-902 as a promising lead [86]. For leukemia, integrated computational approaches elucidated the mechanism of action of Eclipta prostrata compounds, with robust 3D-QSAR models enabling prediction of FLT3 and PIM1 inhibitors [87]. In ovarian cancer, 3D-QSAR combined with molecular dynamics identified taxifolin as a potential AKT1 inhibitor [55].
The consistent success of 3D-QSAR across these diverse case studies highlights its value as a predictive tool in rational drug design. By enabling researchers to understand structure-activity relationships and predict compound potency prior to synthesis and biological testing, 3D-QSAR significantly accelerates the anticancer drug discovery process. Future advances in computational power, artificial intelligence integration, and structural biology promise to further enhance the predictive accuracy and application scope of 3D-QSAR methodologies in oncology drug development [85] [88].
Conclusion
3D-QSAR has firmly established itself as an indispensable predictive tool in the anticancer drug discovery pipeline. By translating molecular structures into quantitative activity models, it provides critical insights for the rational design of novel inhibitors, significantly reducing the time and cost associated with early-stage development. The future of 3D-QSAR lies in its deeper integration with other computational methods—such as AI-driven QSAR-ANN models, extensive molecular dynamics simulations, and systems pharmacology approaches—to create more holistic and predictive platforms. As these methodologies continue to evolve, they hold the promise of delivering more effective, targeted, and personalized cancer therapies, accelerating the journey from in-silico prediction to clinical reality.
References
- 1. 3D-QSAR in drug design--a review [https://pubmed.ncbi.nlm.nih.gov/19929826/]
- 2. Beginner's Guide to 3D-QSAR in Drug Design [https://neovarsity.org/blogs/beginners-guide-3d-qsar-drug-design]
- 3. A (Comprehensive) Review of the Application ... [https://www.mdpi.com/2076-3417/15/3/1206]
- 4. Computational-aided drug design strategies for drug ... [https://pmc.ncbi.nlm.nih.gov/articles/PMC12634332/]
- 5. Robust and predictive 3D-QSAR models for ... - RSC Publishing [https://pubs.rsc.org/en/content/articlehtml/2024/ra/d4ra05342g]
- 6. Unveiling Calotropis procera's promising wound healing ... [https://www.nature.com/articles/s41598-025-06822-z]
- 7. Derivation of Highly Predictive 3D-QSAR Models for hERG ... [https://pmc.ncbi.nlm.nih.gov/articles/PMC10675541/]
- 8. Quantitative structure–activity relationship [https://en.wikipedia.org/wiki/Quantitative_structure%E2%80%93activity_relationship]
- 9. A Computational Framework for the Design and ... [https://chemrxiv.org/engage/chemrxiv/article-details/68da6293f416303770d517c2]
- 10. QSAR-ANN modeling, molecular docking, ADMET ... [https://pubs.rsc.org/en/content/articlelanding/2025/nj/d5nj02417j]
- 11. A Beginner's Guide to QSAR Modeling in Cheminformatics ... [https://neovarsity.org/blogs/cheminformatics-qsar-beginner-guides]
- 12. 3D-QSAR-Based Pharmacophore Modeling, Virtual ... [https://pubmed.ncbi.nlm.nih.gov/34485522/]
- 13. Combined 3D-QSAR modeling and molecular docking ... [https://pmc.ncbi.nlm.nih.gov/articles/PMC4531791/]
- 14. A method for quantifying and visualizing the diversity of ... [https://www.sciencedirect.com/science/article/abs/pii/S109332630300175X]
- 15. Simulation, 3D-QSAR, molecular docking and ... [https://www.sciencedirect.com/science/article/pii/S1570180825000077]
- 16. 3D-QSAR Studies, Molecular Docking, Molecular Dynamic ... [https://pmc.ncbi.nlm.nih.gov/articles/PMC9865323/]
- 17. A Combined Pharmacophore Modeling, 3D QSAR and ... [https://www.mdpi.com/1422-0067/16/6/12307]
- 18. 3D-QSAR, design, molecular docking and dynamics ... [https://www.frontiersin.org/journals/pharmacology/articles/10.3389/fphar.2025.1545791/full]
- 19. [PDF] 3D-QSAR-Based Pharmacophore Modeling, Virtual ... [https://www.semanticscholar.org/paper/3D-QSAR-Based-Pharmacophore-Modeling%2C-Virtual-and-Mirzaei-Ghodsi/7df0c0275c086ff2c87394b71f545fb05c0dcc94]
- 20. 3D QSAR Pharmacophore, CoMFA and CoMSIA Based ... [https://pubmed.ncbi.nlm.nih.gov/22741782/]
- 21. Advancing QSAR models in drug discovery for best ... [https://www.sciencedirect.com/science/article/abs/pii/S0169743925002291]
- 22. Computational approaches streamlining drug discovery [https://www.nature.com/articles/s41586-023-05905-z]
- 23. 3D-QSAR, design, molecular docking and dynamics ... [https://pmc.ncbi.nlm.nih.gov/articles/PMC11841475/]
- 24. Exploration of 2D and 3D-QSAR analysis and docking studies ... [https://pmc.ncbi.nlm.nih.gov/articles/PMC10501407/]
- 25. 3D-QSAR studies on Maslinic acid analogs for Anticancer ... [https://www.nature.com/articles/s41598-017-06131-0]
- 26. QSAR analysis of VEGFR-2 inhibitors based on machine ... [https://pmc.ncbi.nlm.nih.gov/articles/PMC10981835/]
- 27. Pharmacophore based 3D-QSAR study of VEGFR-2 ... [https://www.semanticscholar.org/paper/Pharmacophore-based-3D-QSAR-study-of-VEGFR-2-Neaz-Pasha/b87330d40d18f18334f8d2ae9cab1ea8785bfce6]
- 28. Insights from 3D-QSAR, molecular docking, and dynamics for ... [https://journals.plos.org/plosone/article?id=10.1371/journal.pone.0326245]
- 29. Machine learning-based 3D-QSAR models for predicting ... [https://www.sciencedirect.com/science/article/pii/S3050787125000137]
- 30. one derivatives as tubulin inhibitors for breast cancer therapy [https://www.nature.com/articles/s41598-024-66877-2]
- 31. www.3d-qsar.com: A Portal to Build 3-D QSAR Models [https://www.mdpi.com/2504-3900/22/1/76]
- 32. 3D-QSAR, Scaffold Hopping, Virtual Screening, and ... [https://pmc.ncbi.nlm.nih.gov/articles/PMC11242256/]
- 33. Extrapolative prediction using physically-based QSAR [https://link.springer.com/article/10.1007/s10822-016-9896-1]
- 34. The three secrets to great 3D-QSAR: Alignment, alignment ... [https://cresset-group.com/about/news/the-three-secrets-to-great-3d-qsar-alignment-align/]
- 35. Computational Approaches for the Design of Novel ... [https://pmc.ncbi.nlm.nih.gov/articles/PMC8512242/]
- 36. TRAP1 in Oxidative Stress and Neurodegeneration [https://www.mdpi.com/2076-3921/10/11/1829]
- 37. Computational Approaches for the Design of Novel ... [https://pubmed.ncbi.nlm.nih.gov/34641473/]
- 38. 3D-QSAR and virtual screening studies of thiazolidine-2,4- ... [https://www.sciencedirect.com/science/article/abs/pii/S0022286016312960]
- 39. Analysis and functional relevance of the chaperone TRAP ... [https://www.nature.com/articles/s41598-023-34728-1]
- 40. Elucidation of Novel TRAP1-Selective Inhibitors That Regulate ... [https://pmc.ncbi.nlm.nih.gov/articles/PMC10529355/]
- 41. Vascular Endothelial Growth Factor Receptor (VEGFR-2) ... [https://www.sciencedirect.com/science/article/pii/S2590098619300090]
- 42. Potent VEGFR-2 inhibitors for resistant breast cancer [https://www.frontiersin.org/journals/molecular-biosciences/articles/10.3389/fmolb.2023.1288652/full]
- 43. Quinoxaline derivatives in identifying novel VEGFR-2 ... [https://pubmed.ncbi.nlm.nih.gov/40850176/]
- 44. Unveiling novel VEGFR-2 inhibitors: QSAR modeling ... [https://www.sciencedirect.com/science/article/pii/S2468227625001620]
- 45. Structure-Activity Relationship Studies Based on 3D-QSAR ... [https://www.mdpi.com/1420-3049/27/22/7974]
- 46. Computational design of quinazolin-4(3H)-one derivatives as ... [https://arabjchem.org/computational-design-of-quinazolin-43h-one-derivatives-as-multitarget-inhibitors-against-angiogenesis-and-metabolic-reprogramming-to-help-overcome-cancer-resistance/]
- 47. Discovery of novel VEGFR-2 inhibitors through virtual ... [https://pubmed.ncbi.nlm.nih.gov/41046919/]
- 48. 3D-QSAR Design of New Bcr-Abl Inhibitors Based on Purine ... [https://pmc.ncbi.nlm.nih.gov/articles/PMC12195648/]
- 49. Computational approaches: atom-based 3D-QSAR, molecular ... [https://bmcchem.biomedcentral.com/articles/10.1186/s13065-024-01357-2]
- 50. Structure-guided identification of mitogen-activated protein ... [https://journals.plos.org/plosone/article?id=10.1371/journal.pone.0311954]
- 51. Discovery of novel potential small-molecule inhibitors ... [https://www.sciencedirect.com/science/article/pii/S2211715625002760]
- 52. Structure based drug design and machine learning ... [https://www.nature.com/articles/s41598-025-17708-5]
- 53. Integrated virtual and experimental screening of natural ... [https://pubmed.ncbi.nlm.nih.gov/41167062/]
- 54. Virtual screening and drug repositioning of FDA-approved ... [https://www.frontiersin.org/journals/pharmacology/articles/10.3389/fphar.2022.1048691/full]
- 55. Simulation studies, 3D QSAR and molecular docking on a ... [https://bmcpharmacoltoxicol.biomedcentral.com/articles/10.1186/s40360-021-00512-y]
- 56. 3D-QSAR-Based Pharmacophore Modeling, Virtual ... [https://pmc.ncbi.nlm.nih.gov/articles/PMC8410400/]
- 57. Alignment-independent technique for 3D QSAR analysis - PMC [https://pmc.ncbi.nlm.nih.gov/articles/PMC4833814/]
- 58. One size does not fit all: revising traditional paradigms for ... [https://jcheminf.biomedcentral.com/articles/10.1186/s13321-025-00948-y]
- 59. 3D QSAR study on substituted 1, 2, 4 triazole derivatives as ... [https://www.sciencedirect.com/science/article/pii/S1319016423003316]
- 60. Design and Evaluation of Potential Anti-Liver Cancer Agents [https://www.sciencedirect.com/science/article/pii/S3050787125001295]
- 61. An improved 3D quantitative structure-activity relationships ... [https://www.sciencedirect.com/science/article/pii/S2667318523000090]
- 62. 3D-QSAR, molecular docking and ADMET studies of ... [https://www.sciencedirect.com/science/article/abs/pii/S0019452222003375]
- 63. ACLPred: an explainable machine learning and tree-based ... [https://www.nature.com/articles/s41598-025-16575-4]
- 64. Integrating QSAR modeling, ADMET screening, molecular ... [https://www.sciencedirect.com/science/article/abs/pii/S0010482525013241]
- 65. DFT study, ADMET prediction, and molecular docking [https://www.sciencedirect.com/science/article/pii/S0022286024008500]
- 66. 3D-QSAR AND CONTOUR MAP ANALYSIS OF ... [https://pmc.ncbi.nlm.nih.gov/articles/PMC4762489/]
- 67. Design of novel anti-cancer agents targeting COX-2 inhibitors ... [https://arabjchem.org/design-of-novel-anti-cancer-agents-targeting-cox-2-inhibitors-based-on-computational-studies/]
- 68. Identifying novel triazole-containing histone deacetylase 1 ... [https://pubmed.ncbi.nlm.nih.gov/41176684/]
- 69. Computational design, molecular properties, ADME, and ... [https://pmc.ncbi.nlm.nih.gov/articles/PMC10033787/]
- 70. Contour Maps: Understanding Elevation and Slope [https://www.rvslandsurveyors.com/contour-maps-guide-for-architects]
- 71. A Beginner's Guide to Understanding Map Contour Lines [https://getoutside.ordnancesurvey.co.uk/guides/understanding-map-contour-lines-for-beginners/]
- 72. Comparison of various methods for validity evaluation ... [https://pmc.ncbi.nlm.nih.gov/articles/PMC9396839/]
- 73. On the use of the metric rm² as an effective tool for ... [https://pubmed.ncbi.nlm.nih.gov/22587764/]
- 74. 2D-QSAR and 3D-QSAR simulations for the reaction rate ... [https://www.sciencedirect.com/science/article/abs/pii/S0045653518315728]
- 75. Comparison of Different 2D and 3D-QSAR Methods on Activity ... [https://pmc.ncbi.nlm.nih.gov/articles/PMC3876572/]
- 76. Prioritization of new molecule design using QSAR models - 2D [https://cresset-group.com/discovery/specific/prioritization-new-molecule-design-qsar-models/]
- 77. QSAR modelling and molecular docking studies for anti- ... [https://pmc.ncbi.nlm.nih.gov/articles/PMC7110328/]
- 78. QSAR prediction, synthesis, anticancer evaluation, and ... [https://www.sciencedirect.com/science/article/abs/pii/S0367326X24001047]
- 79. Exploring Artificial Intelligence's Potential to Enhance ... [https://pmc.ncbi.nlm.nih.gov/articles/PMC12582507/]
- 80. Development of Novel ROCK Inhibitors via 3D-QSAR and ... [https://pmc.ncbi.nlm.nih.gov/articles/PMC11514586/]
- 81. Molecular docking and dynamics simulations of 4 ... [https://www.sciencedirect.com/science/article/abs/pii/S1476927125003184]
- 82. In Silico Network Pharmacology, Molecular Docking, and ... [https://www.mdpi.com/1467-3045/47/10/860]
- 83. Target screening and optimization of candidate ... [https://pmc.ncbi.nlm.nih.gov/articles/PMC12098522/]
- 84. Design, Quantitative Structure–Activity Relationships and ... [https://www.sciencedirect.com/science/article/pii/S2667022425001458]
- 85. Anticancer Drug Discovery Based on Natural Products [https://pmc.ncbi.nlm.nih.gov/articles/PMC10813144/]
- 86. 3D-QSAR studies on Maslinic acid analogs for Anticancer ... [https://pmc.ncbi.nlm.nih.gov/articles/PMC5519539/]
- 87. In silico approaches unveil the mechanism of action ... [https://www.nature.com/articles/s41598-025-18547-0]
- 88. A breast cancer-specific combinational QSAR model ... [https://www.frontiersin.org/journals/bioinformatics/articles/10.3389/fbinf.2023.1328262/full]