Digital PCR vs. qPCR for Liquid Biopsy: A Comprehensive Guide for Precision Oncology and Clinical Research
This article provides a detailed comparison of digital PCR (dPCR) and quantitative real-time PCR (qPCR) for liquid biopsy applications, tailored for researchers, scientists, and drug development professionals.
Digital PCR vs. qPCR for Liquid Biopsy: A Comprehensive Guide for Precision Oncology and Clinical Research
Abstract
This article provides a detailed comparison of digital PCR (dPCR) and quantitative real-time PCR (qPCR) for liquid biopsy applications, tailored for researchers, scientists, and drug development professionals. It explores the foundational principles of both technologies, delves into their specific methodological applications in detecting circulating tumor DNA (ctDNA) and other biomarkers, addresses critical troubleshooting and optimization strategies, and synthesizes validation data and performance comparisons from recent studies. The scope covers key considerations for selecting the appropriate technology to enhance sensitivity, precision, and reliability in cancer diagnostics, treatment monitoring, and minimal residual disease (MRD) detection.
Understanding the Core Technologies: From qPCR Fundamentals to dPCR Innovation
Liquid biopsy represents a transformative approach in modern oncology, moving beyond the constraints of traditional tissue biopsy by analyzing tumor-derived components present in bodily fluids. This minimally invasive technique provides a dynamic window into the tumor's molecular landscape, enabling real-time monitoring of tumor evolution, treatment response, and emerging resistance mechanisms [1] [2]. As a library, NLM provides access to scientific literature. Inclusion in an NLM database does not imply endorsement of, or agreement with, the contents by NLM or the National Institutes of Health.
At its core, liquid biopsy involves the extraction and analysis of various tumor-derived markers, including circulating tumor cells (CTCs), circulating tumor DNA (ctDNA), and tumor extracellular vesicles (EVs) from blood, urine, cerebrospinal fluid, and other accessible biological samples [1]. The clinical adoption of liquid biopsy addresses critical challenges in cancer management, including tumor heterogeneity, the inability to perform serial tissue sampling, and the need for early detection of recurrence [1] [2]. With the emergence of advanced molecular detection technologies, particularly digital PCR and next-generation sequencing, liquid biopsy has transitioned from research tool to clinical application, now playing pivotal roles in cancer screening, minimal residual disease detection, therapy selection, and monitoring of therapeutic resistance [3] [4] [5].
Core Components of Liquid Biopsy
Circulating Tumor Cells (CTCs)
CTCs are cells shed from primary and metastatic tumors that circulate in the peripheral blood. First identified in 1869 by Australian physician Thomas Ashworth, CTCs represent a rare population, with approximately 1 CTC found per 1 million leukocytes, and most undergo apoptosis within 1-2.5 hours in circulation [2]. Despite their low abundance, CTCs provide valuable information about cancer biology, particularly in the metastatic process [2].
The isolation of CTCs presents technical challenges due to their scarcity. Current methodologies leverage both physical properties (size, deformability) and biological characteristics (surface marker expression). The CellSearch system remains the only FDA-cleared method for CTC enumeration and monitoring, employing immunomagnetic separation based on epithelial cell adhesion molecule (EpCAM) expression [2]. Clinically, CTC counts have demonstrated prognostic significance, with higher levels correlating with reduced progression-free and overall survival in multiple cancer types, including breast cancer [2].
Circulating Tumor DNA (ctDNA)
CtDNA comprises small fragments of tumor-derived DNA circulating in the bloodstream, representing only 0.1-1.0% of total cell-free DNA (cfDNA) in cancer patients [2]. These fragments are typically shorter than non-tumor cfDNA (approximately 20-50 base pairs) and have a short half-life, enabling real-time assessment of tumor dynamics [2].
The clinical utility of ctDNA stems from its ability to capture tumor-specific genetic and epigenetic alterations, including somatic mutations, copy number alterations, and methylation patterns [1]. First linked to malignancies in 1977 when elevated cfDNA levels were observed in cancer patients, ctDNA now serves multiple roles in oncology [2]. In 2014, the European Medicines Agency authorized ctDNA testing for EGFR mutations in non-small cell lung cancer, marking a milestone in its clinical adoption [2]. Current applications include identification of minimal residual disease, early relapse detection, and guidance for targeted therapies [4].
Other Biomarker Components
Liquid biopsy encompasses additional tumor-derived elements with emerging clinical relevance:
- Tumor Extracellular Vesicles (EVs): Membrane-bound nanoparticles containing proteins, nucleic acids, and lipids that mediate intercellular communication. Over 50% of EV isolation methods utilize preparative ultracentrifugation, though nanomembrane ultrafiltration concentrators show promise for improved recovery [1].
- Tumor-Educated Platelets (TEPs): Platelets that have been altered by interactions with tumor cells, exhibiting modified RNA and protein profiles that may contribute to cancer progression [1].
- Cell-Free RNA (cfRNA): Including microRNAs and other non-coding RNAs that reflect gene expression patterns in the tumor microenvironment [1].
Digital PCR vs. qPCR: Technological Foundations for Liquid Biopsy Analysis
The analytical precision of liquid biopsy depends heavily on the detection technology employed. This section compares the fundamental principles and performance characteristics of quantitative real-time PCR (qPCR) and digital PCR (dPCR) for analyzing liquid biopsy biomarkers.
qPCR: Relative Quantification with Established Workflows
qPCR operates by monitoring PCR amplification in real-time using fluorescent probes or DNA-binding dyes. The technology relies on cycle threshold (Ct) values compared against standard curves to provide relative quantification of target nucleic acids [6]. While qPCR offers a wider dynamic range and is well-established in clinical laboratories, its dependence on external calibration curves introduces variability and reduces precision, particularly with low-abundance targets or in the presence of PCR inhibitors [6] [7].
dPCR: Absolute Quantification through Partitioning
dPCR represents a fundamental evolution in nucleic acid detection by partitioning the reaction mixture into thousands of individual reactions—either in droplets (ddPCR) or nanowells (ndPCR)—and performing endpoint detection after amplification [6] [8]. This partitioning enables absolute quantification without standard curves by applying Poisson statistics to count positive versus negative partitions [6] [8]. The QIAcuity system (nanoplate-based) and QX200 system (droplet-based) are prominent platforms, both offering high sensitivity and precision, though they differ in their partitioning mechanisms and throughput capabilities [9].
dot-Techinical Comparison: qPCR vs. dPCR
Performance Comparison: dPCR vs. qPCR for Liquid Biopsy Applications
Multiple studies have directly compared the analytical performance of dPCR and qPCR platforms, with significant implications for liquid biopsy analysis. The following tables summarize key performance metrics across different application areas.
Table 1: Overall Performance Characteristics of dPCR vs. qPCR
| Parameter | Digital PCR (dPCR) | Quantitative PCR (qPCR) | Clinical Significance in Liquid Biopsy |
|---|---|---|---|
| Quantification Method | Absolute (without standard curve) | Relative (requires standard curve) | dPCR eliminates calibration variability, enhancing reproducibility [6] [8] |
| Precision | Higher (CV: 4.5-13%) [8] [6] | Lower (higher variability) | dPCR provides more reliable serial monitoring of ctDNA levels during treatment [8] |
| Sensitivity | Superior for low-abundance targets [6] [7] [8] | Limited at very low concentrations | dPCR enables detection of minimal residual disease and early relapse [4] |
| Dynamic Range | Narrower [7] | Wider quantification range [7] | qPCR may be preferable for high viral loads; dPCR excels at low target concentrations [7] |
| Tolerance to Inhibitors | Higher [8] | Lower | dPCR performs better with complex clinical samples containing PCR inhibitors [8] |
| Multiplexing Capability | Improved for multiple targets [8] | Limited in complex samples | dPCR enables simultaneous quantification of multiple biomarkers in limited sample volumes [8] |
Table 2: Experimental Performance Data Across Study Types
| Study Focus | dPCR Platform | qPCR System | Key Findings | Reference |
|---|---|---|---|---|
| Respiratory Viruses (n=123 samples) | QIAcuity | CFX96 | dPCR showed superior accuracy for high viral loads (Influenza A/B, SARS-CoV-2) and medium loads (RSV); greater consistency and precision | [6] |
| Periodontal Pathobionts (n=40 samples) | QIAcuity Four | Not specified | dPCR showed lower intra-assay variability (median CV: 4.5% vs higher for qPCR); superior sensitivity for low bacterial loads; 5-fold higher A. actinomycetemcomitans detection | [8] |
| Infectious Bronchitis Virus | Not specified | Not specified | dPCR had higher sensitivity but narrower dynamic range; superior precision for repeatability and reproducibility | [7] |
| Gene Copy Number in Protists | QIAcuity One vs QX200 | N/A | Both dPCR platforms showed high precision; restriction enzyme choice (HaeIII vs EcoRI) impacted precision, especially for QX200 | [9] |
Experimental Protocols for Liquid Biopsy Analysis
Protocol 1: Nanoplate-based dPCR for ctDNA Mutation Detection
This protocol adapts methodologies from multiple studies for detecting tumor-specific mutations in ctDNA using nanoplate-based dPCR systems (e.g., QIAcuity) [6] [8]:
Sample Collection and Processing: Collect peripheral blood (10-20 mL) in cell-stabilization tubes. Process within 2-4 hours with plasma separation via double centrifugation (800 × g for 10 minutes, then 14,000 × g for 10 minutes). Store at -80°C until analysis.
Nucleic Acid Extraction: Extract cfDNA from 1-5 mL plasma using silica membrane-based kits (e.g., QIAamp DNA Mini kit, Qiagen). Elute in 20-50 μL nuclease-free water. Quantify using fluorometric methods suitable for low-concentration samples.
dPCR Reaction Setup: Prepare 40 μL reactions containing:
- 10 μL sample DNA
- 10 μL 4× Probe PCR Master Mix
- 0.4 μM of each primer
- 0.2 μM of each probe (FAM/HEX-labeled)
- 0.025 U/μL restriction enzyme (e.g., Anza 52 PvuII)
- Nuclease-free water to volume
Partitioning and Amplification: Transfer reactions to nanoplate (26,000 partitions). Seal and run on dPCR instrument with cycling conditions:
- Enzyme activation: 95°C for 2 minutes
- 45 cycles: 95°C for 15 seconds, 58-60°C for 1 minute
- Signal stabilization: 98°C for 10 minutes
Data Analysis: Image partitions and analyze using instrument software. Apply Poisson correction for absolute quantification. Report mutant allele frequency as copies/μL or percentage.
Protocol 2: Comparative Analysis of dPCR vs. qPCR Performance
For validation studies comparing detection technologies [6] [8]:
Sample Stratification: Categorize samples based on target concentration (high, medium, low) using qPCR Ct values or expected variant allele frequencies.
Parallel Processing: Split samples for simultaneous analysis by both technologies. Use identical extraction methods and input volumes.
qPCR Analysis: Run in triplicate with standard curves spanning 5-6 orders of magnitude. Include no-template and positive controls. Calculate concentrations from standard curves.
dPCR Analysis: Perform according to manufacturer protocols with appropriate controls. Test serial dilutions for samples with high target concentrations to avoid saturation.
Statistical Comparison: Assess correlation between technologies using linear regression. Evaluate precision via coefficient of variation across replicates. Calculate sensitivity/specificity using predefined thresholds. Utilize Bland-Altman plots to assess agreement across concentration ranges.
The Scientist's Toolkit: Essential Research Reagent Solutions
Table 3: Key Reagents and Materials for Liquid Biopsy Research
| Reagent/Material | Function | Example Products | Application Notes |
|---|---|---|---|
| Cell-Free DNA Collection Tubes | Stabilize blood samples during storage/transport | Streck Cell-Free DNA BCT, PAXgene Blood ccfDNA Tubes | Prevent leukocyte lysis and background cfDNA release; critical for accurate ctDNA quantification |
| Nucleic Acid Extraction Kits | Isolation of high-quality cfDNA/RNA from biofluids | QIAamp DNA Mini Kit, MagMAX Viral/Pathogen Kit | Optimized for low-concentration targets; include carrier RNA for improved recovery |
| dPCR Master Mixes | Partition-stable PCR amplification | QIAcuity Probe PCR Master Mix, ddPCR Supermix | Formulated for optimal partitioning and endpoint fluorescence detection |
| Assay Design Tools | In silico design of mutation-specific assays | Primer-BLAST, UCSC In-Silico PCR | Critical for developing tumor-specific assays; must address sequence homology challenges |
| Reference Standards | Quality control and assay validation | Seraseq ctDNA Reference Materials, Horizon Multiplex I cfDNA Reference | Enable standardization across laboratories and platforms |
| Restriction Enzymes | Enhance access to target sequences | HaeIII, EcoRI, PvuII | Particularly important for high GC-content targets or complex DNA secondary structures [9] |
Clinical Applications and Future Directions
Liquid biopsy has moved beyond proof-of-concept to demonstrate tangible clinical impact across the cancer care continuum. In early cancer detection, multicancer early detection (MCED) tests show potential to substantially reduce late-stage diagnoses. Simulation models indicate that annual MCED testing could lead to a 45% decrease in stage IV diagnoses, with the largest absolute reductions in lung, colorectal, and pancreatic cancers [10].
In minimal residual disease (MRD) monitoring, liquid biopsy enables detection of molecular relapse months before clinical or radiographic progression. The SERENA-6 trial demonstrated benefits of modifying therapy based on early detection of ESR1 mutations via serial ctDNA monitoring, supporting the concept that early eradication of resistant clones can improve outcomes [3].
For treatment selection and monitoring, liquid biopsy provides real-time assessment of tumor evolution and therapeutic resistance. Serial monitoring allows for dynamic treatment adaptation—escalation when resistance emerges or de-escalation when targets become undetectable [4]. Ongoing clinical trials (25 U.S. registered trials targeting immunotherapy and liquid biopsy as of 2025) continue to expand the evidence base for these applications [1].
Future developments focus on enhancing analytical sensitivity through ultrasensitive ctDNA assays that push detection limits forward a hundred- or thousandfold, potentially enabling earlier intervention in both early- and late-stage settings [3]. Integration of multi-analyte approaches that combine ctDNA, CTCs, and extracellular vesicles may provide a more comprehensive tumor profile, while advances in cell-free RNA sequencing and novel ctDNA analyses continue to expand the biological insights obtainable from liquid biopsies [3].
Liquid biopsy represents a paradigm shift in cancer management, offering a minimally invasive window into tumor biology through analysis of CTCs, ctDNA, and other circulating biomarkers. The choice between dPCR and qPCR technologies represents a critical methodological consideration, with dPCR offering superior sensitivity and precision for low-abundance targets—particularly valuable for minimal residual disease detection and early relapse monitoring—while qPCR maintains advantages for higher concentration applications and broader dynamic ranges.
As technological advancements continue to enhance the sensitivity and multiplexing capabilities of detection platforms, and as clinical trial evidence accumulates, liquid biopsy is poised to become increasingly integrated into routine oncology practice. This evolution promises more personalized, dynamic cancer management approaches that can detect resistance earlier, monitor treatment response more precisely, and ultimately improve outcomes across the cancer spectrum.
Quantitative PCR (qPCR), also known as real-time PCR, is a fundamental technology in molecular biology that enables the detection and quantification of nucleic acid sequences. This technique has revolutionized genetic analysis by allowing researchers to monitor the amplification of DNA in real-time, as the reaction progresses. Unlike conventional PCR that provides only endpoint detection, qPCR offers quantitative data throughout the exponential phase of amplification, providing precise measurement of target sequences in samples. The core principle of qPCR lies in tracking the accumulation of PCR products during each cycle using fluorescent reporting systems, allowing for quantification of the initial target amount [11].
In modern research environments, qPCR remains a workhorse technology with extensive applications in gene expression analysis, pathogen detection, microbiome studies, and validation of microarray data [12]. The technique's speed, sensitivity, specificity, and relatively easy workflow have made it indispensable in both basic research and clinical diagnostics. When applied to RNA templates through reverse transcription, the method becomes RT-qPCR (reverse transcription quantitative PCR), which allows for quantification of RNA molecules by first converting them to complementary DNA (cDNA) [13]. This variation has become particularly important in gene expression studies and viral load detection, including recent applications in SARS-CoV-2 testing [14].
The quantification capability of qPCR primarily relies on two main approaches: absolute quantification using standard curves and relative quantification using comparative threshold cycle methods. The standard curve method, which forms the focus of this article, depends on creating a calibration curve from samples of known concentration to interpolate values for unknown samples [15]. This method provides a robust framework for quantification that has supported countless research discoveries and diagnostic applications across diverse scientific fields.
Fundamental Principles of qPCR
Real-Time Fluorescence Detection
The operational principle of qPCR centers on the detection and quantification of fluorescence signals that increase proportionally to the amount of amplified PCR product. During the amplification process, fluorescent reporters emit signals that are captured by specialized optical systems at the end of each PCR cycle. Two primary fluorescence detection chemistries dominate qPCR applications: DNA-binding dyes and probe-based systems [11]. The TaqMan assay, one of the earliest and most widely adopted probe-based systems, exploits the 5' nuclease activity of Taq DNA polymerase to clease a fluorescently labeled oligonucleotide probe during PCR [11]. This cleavage generates a detectable fluorescent signal that accumulates with each amplification cycle.
The analysis of qPCR data focuses on several key parameters. The baseline represents the initial cycles where fluorescent signal accumulation remains beneath the detection threshold of the instrument. ΔRn refers to the incremental fluorescent signal at each time point, plotted against cycle number. The threshold is an arbitrary fluorescence level set above the baseline but within the exponential amplification phase. The Ct (threshold cycle) value represents the fractional PCR cycle number at which the reporter fluorescence exceeds the threshold [11]. This Ct value serves as the fundamental metric for quantification, as it correlates inversely with the logarithm of the initial target quantity—samples with higher starting concentrations yield lower Ct values.
Reverse Transcription qPCR (RT-qPCR)
For RNA quantification, RT-qPCR incorporates an initial reverse transcription step that converts RNA into cDNA before quantitative amplification [13]. This technique can be performed in one-step or two-step formats. In one-step RT-qPCR, reverse transcription and PCR amplification occur in a single tube using a unified buffer system, combining reverse transcriptase with DNA polymerase. This approach minimizes pipetting steps and reduces contamination risk, making it suitable for high-throughput applications. In contrast, two-step RT-qPCR separates reverse transcription and PCR amplification into discrete reactions performed in different tubes with individually optimized conditions [13].
The reverse transcription step itself can be primed using different strategies, each with distinct advantages. Oligo(dT) primers target the poly(A) tails of eukaryotic mRNA, generating full-length cDNA but with potential 3' bias. Random primers anneal at multiple points along RNA transcripts, enabling coverage of all RNA types including non-polyadenylated species but potentially producing truncated cDNA fragments. Gene-specific primers offer maximal specificity by targeting particular mRNA sequences but limit analysis to single genes of interest [13]. The choice of reverse transcriptase enzyme also impacts performance, with thermally stable enzymes offering advantages for transcribing RNA with complex secondary structures.
Standard Curve Quantification Method
Principles and Workflow
The standard curve method represents a cornerstone approach for absolute and relative quantification in qPCR. This technique relies on constructing a calibration curve using serial dilutions of standards with known concentrations, then using this curve to determine concentrations of unknown samples based on their Ct values [15]. The standards typically consist of purified DNA, cDNA, or in vitro transcribed RNA diluted over several orders of magnitude—commonly using 2-fold, 5-fold, or 10-fold dilution series [16]. Each dilution is amplified in the same qPCR run as the unknown samples, generating Ct values that decrease logarithmically with increasing template concentration.
The workflow begins with preparing five or more serial dilutions of a standard template known to express the gene of interest in high abundance [16]. Each dilution undergoes real-time PCR amplification alongside experimental samples and appropriate controls. The resulting Ct values are plotted against the logarithm of the known initial template concentrations, generating a standard curve that should display a strong linear relationship (correlation coefficient R² ≥ 0.99) [16]. The concentration of unknown samples is then determined by interpolating their Ct values against this standard curve, providing either absolute quantification (when standards are absolutely quantified) or relative quantification (when expressing results relative to a calibrator sample).
Experimental Protocol for Standard Curve Generation
Materials Required:
- High-purity DNA or RNA standard with known concentration
- Appropriate dilution buffer (e.g., TE buffer, nuclease-free water)
- qPCR master mix containing DNA polymerase, dNTPs, and buffer
- Sequence-specific primers and probes
- qPCR plates or tubes compatible with the detection instrument
- Positive and negative control templates
Step-by-Step Procedure:
Standard Preparation: Accurately determine the concentration of the stock standard solution using spectrophotometric (A260) or fluorometric methods. Calculate the copy number based on molecular weight [15].
Serial Dilution: Prepare a dilution series covering at least five orders of magnitude. For absolute quantification, use standards with known copy numbers; for relative quantification, known relative dilutions suffice [15]. Use precise pipetting techniques to ensure accuracy, as dilution errors significantly impact quantification reliability.
Reaction Setup: Assemble qPCR reactions containing master mix, primers, probe, and each standard dilution in separate wells. Include experimental unknowns and negative controls (no-template controls) on the same plate.
Amplification: Run the qPCR protocol with appropriate cycling conditions for the chosen chemistry. Ensure the reaction volume and cycling parameters remain consistent across all samples.
Data Analysis: After amplification, plot the Ct values against the logarithm of the standard concentrations. Generate a linear regression line and verify the correlation coefficient exceeds 0.99. Interpolate unknown sample concentrations from their Ct values using the regression equation [16].
For gene expression studies, this process is repeated for both the target gene and an endogenous reference gene (e.g., housekeeping genes like GAPDH or β-actin). The target quantity is then normalized to the reference gene quantity to account for variations in sample input and quality [16]. This normalized value can be expressed relative to a calibrator sample (such as an untreated control) to generate fold-change values in gene expression.
Figure 1: Standard Curve Quantification Workflow. This diagram illustrates the sequential steps in the standard curve method for qPCR quantification, from preparation of serial dilutions to final calculation of relative expression levels.
Performance Comparison: qPCR versus Digital PCR
Technical Comparison
Digital PCR (dPCR) represents a significant evolution in nucleic acid quantification technology, operating on fundamentally different principles than qPCR. While qPCR measures amplification in a bulk reaction, dPCR partitions the sample into thousands of individual reactions, with each partition containing either zero, one, or several target molecules [14]. After endpoint amplification, the proportion of positive partitions is counted and used to calculate the absolute target concentration using Poisson statistics, eliminating the need for standard curves [15] [12].
The partitioning approach provides dPCR with several distinct advantages. It offers absolute quantification without external calibration, demonstrates higher tolerance to PCR inhibitors due to sample fractionation, and provides enhanced precision for detecting small-fold changes or rare mutations [12]. dPCR typically detects mutation rates as low as 0.1%, compared to >1% for qPCR, making it particularly valuable for detecting rare alleles in complex backgrounds [12]. However, qPCR maintains advantages in dynamic range, established protocols, and broader availability in research settings.
Comparative Performance Data
Recent studies have directly compared the performance of qPCR and dPCR across various applications. In viral detection, dPCR demonstrates superior sensitivity for low viral loads while qPCR offers a wider quantitative range [7]. A 2024 study comparing respiratory virus detection found dPCR provided greater accuracy for high viral loads of influenza A, influenza B, and SARS-CoV-2, and for medium loads of RSV [6]. The precision of dPCR, measured through repeatability and reproducibility, consistently outperforms qPCR, particularly at low target concentrations [7].
Table 1: Technical Comparison Between qPCR and dPCR
| Parameter | qPCR | dPCR |
|---|---|---|
| Quantification Type | Relative or absolute (requires standards) | Absolute (no standards required) |
| Principle | Bulk reaction monitoring | Sample partitioning and endpoint detection |
| Dynamic Range | Wide (up to 7-8 logs) | Moderate (up to 5 logs) [7] |
| Precision | Good | Higher precision, especially for low abundances [7] |
| Sensitivity | Detects mutation rates >1% | Detects mutation rates ≥0.1% [12] |
| Tolerance to Inhibitors | Moderate | High [12] |
| Throughput | High | Moderate to high (platform-dependent) |
| Standardization | Well-established protocols | Emerging protocols |
In the context of liquid biopsy research, dPCR's ability to detect rare mutations in circulating tumor DNA (ctDNA) provides significant advantages. ctDNA often represents less than 0.1% of total cell-free DNA in blood, pushing against the detection limits of conventional qPCR [17] [2]. Studies have demonstrated dPCR's utility in detecting tumor-specific mutations in cerebrospinal fluid, plasma, and other liquid biopsy sources, with levels correlating with disease progression and treatment response [17].
Table 2: Performance Comparison in Viral Detection Applications
| Performance Metric | qPCR Performance | dPCR Performance |
|---|---|---|
| Detection Sensitivity | 100-1000 copies/reaction [14] | 10-100 copies/reaction [14] |
| Quantification Precision | Moderate (CV: 10-25%) | High (CV: <10%) [7] |
| Accuracy at Low Viral Loads | Variable, efficiency-dependent | Superior, especially near detection limit [6] |
| Resistance to Inhibitors | Moderate | High [12] |
| Reproducibility Across Labs | Good with standardized protocols | Higher precision across laboratories [12] |
Applications in Liquid Biopsy Research
Liquid biopsy has emerged as a transformative approach in oncology, enabling non-invasive detection and monitoring of cancer through analysis of circulating biomarkers in blood and other bodily fluids [2]. The technique focuses primarily on circulating tumor cells (CTCs), circulating tumor DNA (ctDNA), and extracellular vesicles, with ctDNA analysis representing one of the most promising applications for PCR-based technologies [2].
In liquid biopsy applications, qPCR serves as a valuable tool for detecting known mutations in ctDNA, particularly when variant allele frequencies are sufficiently high (>1%). The standard curve method enables relative quantification of mutant alleles across different time points, allowing monitoring of treatment response and disease progression [2]. However, the limited sensitivity of qPCR presents challenges for early cancer detection and minimal residual disease monitoring, where mutant alleles may represent only a tiny fraction of total cell-free DNA.
dPCR addresses these limitations by offering ultra-sensitive detection of rare mutations, with some studies reporting reliable detection at variant allele frequencies as low as 0.01% [17]. This enhanced sensitivity makes dPCR particularly suitable for liquid biopsy applications in neuro-oncology, where ctDNA levels in plasma are typically very low but enriched in cerebrospinal fluid [17]. Research has demonstrated that dPCR can effectively detect and quantify tumor-specific mutations in CSF with higher sensitivity than qPCR, providing valuable prognostic information and enabling treatment monitoring without invasive procedures.
The combination of both technologies offers a powerful approach in liquid biopsy workflows. dPCR provides superior sensitivity for initial detection and absolute quantification of rare mutations, while qPCR enables cost-effective monitoring of known mutations once identified. This complementary relationship maximizes both sensitivity and throughput in clinical research settings.
Essential Research Reagent Solutions
Successful implementation of qPCR and dPCR methodologies requires careful selection of reagents and controls. The following table outlines key solutions and their functions in experimental workflows.
Table 3: Essential Research Reagents for qPCR and dPCR Applications
| Reagent Category | Specific Examples | Function and Importance |
|---|---|---|
| Reverse Transcriptases | Moloney murine leukemia virus (MMLV) RT, Avian myeloblastosis virus (AMV) RT | Converts RNA to cDNA for RT-qPCR; thermal stability is crucial for efficient transcription of structured RNAs [13] |
| PCR Polymerases | Hot-start Taq polymerases, reverse transcriptase/Taq polymerase blends | DNA amplification with high fidelity and efficiency; 5' nuclease activity essential for probe-based detection [11] |
| Fluorescent Probes | TaqMan probes, molecular beacons, dual hybridization probes | Sequence-specific detection; generates fluorescent signal proportional to amplicon yield [11] |
| DNA Binding Dyes | SYBR Green, EvaGreen | Binds double-stranded DNA non-specifically; cost-effective for target detection but requires amplicon specificity verification |
| Primer/Probe Sets | Target-specific primers, endogenous control primers | Defines amplification specificity; should span exon-exon junctions to avoid genomic DNA amplification [13] |
| Reference Standards | Plasmid DNA, in vitro transcribed RNA, synthetic oligos | Enables standard curve generation for quantification; requires accurate initial concentration determination [15] |
| Nucleic Acid Isolation Kits | QIAamp Viral RNA Mini Kit, QIAamp circulating nucleic acid kit | Extracts high-quality DNA/RNA from various sample types; critical for reproducible results [14] [17] |
| Internal Controls | Endogenous genes (GAPDH, β-actin), exogenous spike-ins | Normalizes for sample input and processing variations; essential for accurate relative quantification [15] |
qPCR with standard curve quantification remains a powerful, well-established methodology for nucleic acid quantification with broad applications across life sciences research. The technique's robustness, relatively low cost, and extensive validation history ensure its continued relevance in research and diagnostic applications. The standard curve method provides a reliable framework for both absolute and relative quantification, particularly when properly validated with appropriate controls and reference materials.
The emergence of dPCR represents not a replacement for qPCR, but rather a complementary technology that addresses specific limitations in sensitivity and absolute quantification. While dPCR offers superior performance for detecting rare variants and providing standard-free quantification, qPCR maintains advantages in dynamic range, throughput, and established workflows. In liquid biopsy research and other applications requiring high sensitivity, these technologies can be deployed strategically based on specific research needs—utilizing dPCR for initial detection of rare targets and qPCR for ongoing monitoring of known markers.
The future of nucleic acid quantification will likely see increased integration of both technologies, with ongoing advancements in qPCR chemistries and dPCR platforms further enhancing their respective capabilities. For researchers, the choice between these technologies should be guided by specific application requirements, including needed sensitivity, precision, throughput, and available resources rather than perceived technological superiority.
Digital PCR (dPCR) represents a significant advancement in nucleic acid quantification by enabling absolute target measurement without requiring standard curves. This technology partitions a sample into thousands of individual reactions, with target detection following Poisson distribution statistics to calculate initial concentration. Particularly valuable for liquid biopsy applications, dPCR demonstrates superior sensitivity and precision for detecting rare mutations and low-abundance targets compared to traditional quantitative PCR (qPCR). This guide explores the fundamental principles, experimental protocols, and performance characteristics of dPCR within the context of molecular diagnostics for cancer research.
Digital PCR operates on a fundamentally different principle than quantitative PCR for nucleic acid quantification. While qPCR relies on monitoring amplification fluorescence in real-time relative to a standard curve, dPCR utilizes sample partitioning and end-point detection to provide absolute quantification [18] [19]. The method partitions a nucleic acid sample into thousands of individual reactions, each acting as an independent PCR microreactor [18]. After amplification, partitions are analyzed for fluorescence, and the ratio of positive to negative partitions enables absolute quantification of the target sequence based on Poisson distribution statistics [18]. This partitioning approach concentrates target sequences within isolated microreactors, reducing template competition and increasing tolerance to inhibitors present in complex clinical samples like blood or tissue [18]. For liquid biopsy research—which focuses on detecting circulating tumor DNA (ctDNA) and other rare nucleic acid biomarkers in patient blood samples—this enhanced sensitivity is particularly valuable for early cancer detection, treatment monitoring, and residual disease assessment [20] [21].
Fundamental Principles of dPCR
Sample Partitioning and Analysis
The dPCR workflow begins with partitioning the PCR reaction mixture into thousands of nanoscale reactions [18]. This partitioning can be achieved through different technological approaches:
- Droplet-based systems (ddPCR): Generate thousands of nanoliter-sized droplets, each functioning as an independent PCR reaction vessel [6]
- Nanowell-based systems (e.g., QIAcuity): Employ fixed nanowells on a microfluidic chip, facilitating high-throughput processing and automated workflows [6]
Following partitioning, the plate undergoes conventional PCR amplification with specific primers and fluorescent probes targeting the sequence of interest. After amplification, each partition is analyzed for fluorescence using a dedicated reader [8]. Partitions containing the target sequence (positive) fluoresce, while those without it (negative) show no fluorescence [18] [22]. This binary detection approach converts the continuous analog signal of traditional PCR into discrete digital measurements, hence the name "digital" PCR [18].
Absolute Quantification via Poisson Statistics
The mathematical foundation of dPCR quantification relies on Poisson statistics, which describe the probability of target molecule distribution across partitions [18] [22]. The critical assumption is that target molecules are randomly distributed throughout the partitions, with each partition containing zero, one, or a few target molecules [22].
The Poisson equation for dPCR quantification is:
λ = -ln(1 - p/N)
Where:
- λ (lambda) represents the average number of target molecules per partition
- p is the number of positive partitions
- N is the total number of partitions [22]
The initial sample concentration is then calculated as:
C = -d/v × ln(1 - p/N)
Where:
- C is the target concentration in the stock sample (copies/μL)
- d is the dilution factor
- v is the partition volume (μL) [22]
This statistical approach enables absolute quantification without external calibration curves, a significant advantage over qPCR [18] [19].
dPCR Workflow: From Sample to Quantification
Statistical Considerations and Confidence Intervals
The precision of dPCR quantification depends directly on the number of partitions analyzed [18]. According to Poisson statistics, the confidence in estimating target concentration increases with the total number of partitions [18]. Statistical analysis reveals that optimal precision occurs when approximately 20% of partitions are negative (λ = 1.6), as this provides the most informative balance between positive and negative partitions [18]. When most partitions are either all positive or all negative, confidence in the estimated concentration decreases because the distribution pattern becomes less informative for precise quantification [18]. This statistical foundation defines dPCR's performance parameters, including its dynamic range and limits of detection [18].
Comparative Performance: dPCR vs. qPCR for Liquid Biopsy
Sensitivity and Detection Capabilities
Multiple studies demonstrate dPCR's superior sensitivity for detecting low-abundance targets, which is particularly relevant for liquid biopsy applications where circulating tumor DNA (ctDNA) represents a small fraction of total cell-free DNA:
Table 1: Detection Sensitivity Comparison Across Applications
| Application Domain | qPCR Performance | dPCR Performance | Study Details |
|---|---|---|---|
| HPV-Associated Cancers (ctDNA) | Lower sensitivity | NGS > dPCR > qPCRSensitivity: NGS > ddPCR, P = 0.014; ddPCR > qPCR, P < 0.001 [20] [23] | Meta-analysis of 36 studies with 2,986 patients [20] |
| Lung Cancer (EGFR mutations) | 58.8% detection rate | 100% detection rateSubstantially higher than ddPCR (κ = 0.54) [21] | 20 NSCLC patients; ddPCR vs. solid dPCR [21] |
| Colorectal Cancer (RAS mutations) | 72.7% detection rate | 86.4% detection rateHigher detection than ddPCR (κ = 0.34) [21] | 22 CRC patients [21] |
| Periodontal Pathobionts | Higher false negatives at low concentrations | Superior low-load detection5-fold higher A. actinomycetemcomitans prevalence [8] | 40 subgingival plaque samples [8] |
For respiratory virus detection, dPCR demonstrated superior accuracy particularly for high viral loads of influenza A, influenza B, and SARS-CoV-2, showing greater consistency and precision than Real-Time RT-PCR [6]. This enhanced detection capability for low-abundance targets makes dPCR particularly valuable for liquid biopsy applications in early cancer detection and minimal residual disease monitoring.
Precision, Accuracy, and Technical Performance
dPCR demonstrates enhanced precision and reduced variability compared to qPCR, especially for low-abundance targets:
Table 2: Technical Performance Comparison Between dPCR and qPCR
| Performance Characteristic | Quantitative PCR (qPCR) | Digital PCR (dPCR) |
|---|---|---|
| Quantification Method | Relative (requires standard curve) [18] [19] | Absolute (direct counting) [18] [19] |
| Precision at Low Concentrations | Limited for rare targets [19] | Superior precision [8] [19] |
| Dynamic Range | Wide (6-7 orders of magnitude) [19] | Narrower [19] |
| Impact of PCR Inhibitors | Sensitive to inhibitors [19] | Resistant to inhibitors (partitioning reduces impact) [18] [19] |
| Intra-assay Variability | Higher (median CV% not specified) | Lower (median CV%: 4.5%) [8] |
| Multiplexing Capability | Limited by spectral overlap | Improved (reduces template competition) [8] |
dPCR's partitioning approach naturally dilutes inhibitors across thousands of reactions, making it more robust for complex clinical samples like blood, tissue, or environmental samples [18] [19]. This characteristic is particularly advantageous for liquid biopsy samples that may contain various PCR inhibitors.
Quantification Approaches: qPCR vs. dPCR
Experimental Protocols for Liquid Biopsy Applications
Sample Processing and DNA Extraction
Proper sample preparation is critical for reliable liquid biopsy analysis:
- Blood Collection and Processing: Collect blood into EDTA or specialized ctDNA collection tubes. Process within 2-6 hours to prevent genomic DNA contamination. Isolate plasma through double centrifugation (e.g., 1600 × g for 10 min, then 16,000 × g for 10 min) [21]
- Cell-free DNA Extraction: Use commercial cfDNA extraction kits (e.g., QIAamp DNA Mini kit, MagMax Viral/Pathogen kit) optimized for short fragment recovery [8] [21]. For the QIAamp DNA Mini kit, follow manufacturer's instructions with proteinase K digestion and wash steps before elution in nuclease-free water [8]
- DNA Quantification and Quality Control: Assess cfDNA concentration using fluorometric methods. Verify fragment size distribution (expected peak ~166 bp) if using bioanalyzer systems
dPCR Assay Setup and Optimization
Protocol for nanoplate-based dPCR systems (e.g., QIAcuity):
Reaction Mixture Preparation:
- 10 µL sample DNA
- 10 µL 4× Probe PCR Master Mix
- 0.4 µM of each specific primer
- 0.2 µM of each specific probe
- 0.025 U/µL restriction enzyme (e.g., Anza 52 PvuII) to reduce background
- Nuclease-free water to 40 µL total volume [8]
Partitioning and Amplification:
- Transfer mixtures to nanoplate (e.g., QIAcuity Nanoplate 26k)
- Seal plate and load into instrument
- Partitions form automatically (~26,000 partitions/well)
- Thermal cycling: 2 min at 95°C (enzyme activation), then 45 cycles of 15 s at 95°C and 1 min at 58°C [8]
Signal Detection and Analysis:
Optimization Strategies for Liquid Biopsy
- Primer/Probe Optimization: Empirically adjust primer and probe concentrations within manufacturer-validated frameworks to ensure optimal performance with cfDNA templates [8]
- Template Dilution: For samples with high target concentrations (>10⁵ copies/reaction), test serial dilutions to avoid positive fluorescence signal saturation, which would lead to template concentration underestimation [8]
- Multiplexing Validation: When detecting multiple mutations simultaneously, verify minimal cross-reactivity between assays and confirm detection specificity for each target [8]
Research Reagent Solutions for dPCR
Table 3: Essential Reagents and Materials for dPCR Experiments
| Reagent/Material | Function | Examples/Specifications |
|---|---|---|
| dPCR Master Mix | Provides optimized buffer, nucleotides, and polymerase for partitioning and amplification | QIAcuity Probe PCR Kit [8] |
| Primer/Probe Sets | Target-specific detection with fluorescent signaling | Hydrolysis probes (TaqMan-style) [8]; Sequence-specific to target genes [8] |
| Partitioning Plates/Cartridges | Physical separation of reactions into nanoscale compartments | QIAcuity Nanoplate 26k [8] |
| Nucleic Acid Extraction Kits | Isolation of high-quality DNA from clinical samples | QIAamp DNA Mini kit [8]; MagMax Viral/Pathogen kit [6] |
| Restriction Enzymes | Reduce background signal from complex samples | Anza 52 PvuII (0.025 U/µL) [8] |
| Reference Materials | Assay validation and quality control | Bacterial reference strains [8]; Synthetic DNA controls |
Digital PCR's unique combination of sample partitioning, Poisson statistical analysis, and absolute quantification without standard curves provides significant advantages for liquid biopsy research and other applications requiring high sensitivity and precision [18] [19]. While qPCR remains valuable for high-throughput screening and applications with abundant targets, dPCR excels in detecting rare mutations, quantifying low-abundance targets, and analyzing challenging sample matrices [20] [21] [19]. The choice between these technologies should be guided by specific application requirements, with dPCR offering particular value for liquid biopsy applications in cancer research, infectious disease monitoring, and precision medicine initiatives where detection sensitivity and quantification accuracy are paramount.
The accurate quantification of nucleic acids has been a cornerstone of advancement in life sciences, driving innovations from basic research to clinical diagnostics. The journey from traditional methods like limiting dilution to the development of quantitative PCR (qPCR) and ultimately to digital PCR (dPCR) represents a paradigm shift in analytical precision and sensitivity. This evolution has been particularly transformative for applications requiring absolute quantification of rare targets, such as liquid biopsy research in oncology, where detecting minute amounts of tumor-derived DNA in blood can guide diagnosis and treatment. While qPCR provided a major leap forward as a relative quantification method, its dependence on external standard curves introduced limitations in precision and reproducibility. The emergence of dPCR addressed these challenges by enabling absolute quantification through single-molecule amplification in partitioned reactions, revolutionizing how researchers approach nucleic acid detection and quantification.
The Foundation: From Limiting Dilution to qPCR
Before the advent of qPCR, researchers relied on methods like limiting dilution analysis to quantify biological entities. This technique involved serially diluting samples until the target molecule was present in approximately one or fewer copies per reaction, then applying Poisson statistics to estimate original concentration. While conceptually sound, this approach was labor-intensive, low-throughput, and imprecise.
The development of quantitative PCR (qPCR) in the 1990s represented a major advancement by enabling real-time monitoring of DNA amplification through fluorescence detection. qPCR became the workhorse of molecular quantification due to its wide dynamic range and high throughput. However, as a relative quantification method, qPCR requires standard curves for quantification, making it susceptible to amplification efficiency variations and inhibitor effects. Research has shown that data preprocessing approaches and regression models can significantly impact qPCR accuracy, with weighted linear regression models demonstrating improved estimation quality compared to simple linear regression [24].
The Digital PCR Paradigm: Fundamental Principles
Digital PCR represents a fundamental shift in quantification approach by combining limiting dilution principles with PCR endpoint detection. The core concept involves partitioning a PCR reaction into thousands of individual reactions so that each contains zero, one, or a few target molecules. After amplification, each partition is analyzed for fluorescence, and the original target concentration is calculated using Poisson statistics based on the ratio of positive to negative partitions [9].
This approach provides several key advantages:
- Absolute quantification without need for standard curves
- Superior sensitivity for detecting rare mutations
- Increased resilience to PCR inhibitors
- Precise quantification across a wide dynamic range
The concept of dPCR was first developed in the 1990s, but has seen rapid technological advancement over the past decade with the commercialization of various platforms employing different partitioning mechanisms [9].
Modern dPCR Platforms: A Comparative Technical Analysis
Current dPCR technologies primarily fall into two categories based on their partitioning methods: droplet-based systems and nanoplate-based systems.
Table 1: Comparison of Major Digital PCR Platforms
| Feature | Droplet Digital PCR (ddPCR) | Nanoplate Digital PCR (ndPCR) |
|---|---|---|
| Partitioning Mechanism | Water-in-oil droplets | Nanoscale chambers in plates |
| Typical Partitions | ~20,000 droplets/reaction | ~26,000 partitions/panel |
| Reaction Volume | 20μL standard [9] | 40μL standard [9] |
| Detection Method | Flow cytometry with laser scanning | Imaging of entire plate |
| Key Advantage | Flexible sample input | Standardized partition size |
| Limit of Detection | ~0.17 copies/μL [9] | ~0.39 copies/μL [9] |
Performance Comparison in Research Applications
Multiple studies have directly compared the performance of these platforms across various applications. In a comprehensive evaluation using synthetic oligonucleotides and ciliate DNA, both ddPCR (QX200 system) and ndPCR (QIAcuity One) demonstrated high precision across most analyses, with coefficient of variation (CV) values generally below 10% for synthetic targets [9]. However, the study found that restriction enzyme selection significantly impacted precision, especially for ddPCR, where CV values improved from up to 62.1% with EcoRI to below 5% with HaeIII [9].
In liquid biopsy applications for cancer, a 2023 study comparing ddPCR and solid dPCR for detecting EGFR and RAS mutations in lung and colorectal cancer patients found a moderate agreement between platforms (κ = 0.54 for EGFR; κ = 0.34 for RAS) [21]. Notably, solid dPCR demonstrated higher sensitivity, detecting 100% of known EGFR mutations compared to 58.8% with ddPCR [21].
dPCR vs. qPCR: Critical Performance Metrics for Liquid Biopsy
The superior performance of dPCR is particularly evident in liquid biopsy applications, where detecting rare mutant alleles against a high background of wild-type DNA is essential.
Table 2: Performance Comparison of qPCR vs. dPCR in Viral and Liquid Biopsy Applications
| Parameter | qPCR | dPCR |
|---|---|---|
| Quantification Method | Relative (requires standard curve) | Absolute (no standard curve needed) |
| Sensitivity | Lower sensitivity for rare variants | Can detect mutants at <0.001% frequency [25] |
| Precision | Lower precision in repeatability tests | Higher precision and reproducibility [26] |
| Dynamic Range | Wider quantification range [26] | Slightly narrower range but better low-end sensitivity |
| Effect of Inhibitors | More susceptible to inhibition effects | More resilient to PCR inhibitors [27] |
| Cost Considerations | Lower operational costs | 5-8.5x lower cost than NGS, but higher than qPCR [28] |
In virology applications, dPCR has demonstrated higher sensitivity and improved precision compared to qPCR. When quantifying Infectious Bronchitis Virus (IBV), dPCR showed superior repeatability and reproducibility, despite qPCR having a wider quantification range [26]. Similarly, in AAV vector characterization for gene therapy, ddPCR outperformed qPCR in terms of robustness and assay variance, particularly for partially purified samples [27].
Experimental Protocols: dPCR in Liquid Biopsy Analysis
ctDNA Detection in Rectal Cancer
A 2025 study established a practical workflow for ctDNA detection in localized rectal cancer, comparing ddPCR and next-generation sequencing (NGS) [28]:
- Sample Collection: Pre-therapy plasma and matched tumor samples collected from development (n=41) and validation (n=26) cohorts
- Tumor Mutation Identification: Primary tumor DNA sequenced using Ion AmpliSeq Cancer Hotspot Panel v2 (covering 50 oncogene and tumor suppressor gene hotspots)
- ctDNA Detection with ddPCR: Designed 1-2 custom probes targeting mutations with highest variant allele frequencies in matched tumors
- ctDNA Detection with NGS: Applied the same panel sequencing optimized for ctDNA with variant calling threshold lowered to 0.01% VAF
- Analysis: All ctDNA analyses performed by an experienced hospital geneticist, with positivity defined as any detectable oncogenic mutation
This tumor-informed approach demonstrated that ddPCR detected ctDNA in 58.5% (24/41) of baseline plasma samples compared to 36.6% (15/41) with NGS (p=0.00075) [28].
Optimized HPV16 Detection in Head and Neck Cancer
A 2024 study developed streamlined ddPCR workflows for HPV16 detection in liquid biopsies from head and neck cancer patients [25]:
Diagram 1: Workflow for ddPCR Detection in Liquid Biopsies
This protocol achieved significant improvements by:
- Increasing cfDNA concentration by 8.5-fold through reduced elution volume
- Increasing sample volume loading by 22-fold by eluting in PCR reaction solution
- Enabling detection without restriction enzyme digestion despite 1200 ng background cfDNA
- Establishing direct detection from unpurified cfDNA with concordance rates up to 95.8% for surgical drain fluid [25]
The Scientist's Toolkit: Essential Reagents and Materials
Table 3: Key Research Reagent Solutions for dPCR Applications
| Reagent/Material | Function | Example Application |
|---|---|---|
| Streck Cell Free DNA BCT Tubes | Preserves cfDNA in blood samples | Liquid biopsy sample collection [28] |
| QIAamp Circulating Nucleic Acid Kit | Extracts cfDNA from plasma, serum | Purification of ctDNA from liquid biopsies [25] |
| ddPCR Supermix for Probes | Optimized reaction mixture for droplet digital PCR | Detection of HPV16 E6 region [25] |
| Restriction Enzymes (HaeIII, EcoRI) | Digest genomic DNA to improve target accessibility | Enhancing precision in gene copy number analysis [9] |
| Proteinase K | Digests proteins and nucleases that may interfere | Sample pre-treatment for in-process samples [27] |
| Ion AmpliSeq Cancer Hotspot Panel v2 | NGS panel covering 50 cancer genes | Tumor mutation identification for informed ddPCR [28] |
The evolution from limiting dilution to modern dPCR platforms has fundamentally transformed nucleic acid quantification, particularly in challenging applications like liquid biopsy. While qPCR remains valuable for many applications, dPCR provides superior precision, sensitivity, and absolute quantification capabilities that are essential for detecting rare mutations and quantifying minimal residual disease. The continuing refinement of dPCR technologies, including the development of more streamlined workflows, reduced costs, and improved standardization across platforms, promises to further expand its applications in clinical research and diagnostics. As the field advances, the integration of dPCR with other technologies like NGS and the development of novel partitioning methods will likely open new frontiers in precision medicine and molecular analysis.
In the evolving field of liquid biopsy research, the precise detection and quantification of nucleic acids are paramount. Two principal molecular techniques—quantitative PCR (qPCR) and digital PCR (dPCR)—diverge fundamentally in their approach to detection and calibration. qPCR relies on real-time detection of amplification signals during the PCR process, requiring calibration curves for relative quantification. In contrast, dPCR utilizes endpoint detection after amplification is complete, enabling absolute quantification without standard curves. This guide objectively compares these technological pillars, providing researchers and drug development professionals with experimental data and protocols to inform their methodological choices.
Core Technological Principles and Workflows
The fundamental distinction between these PCR methodologies lies in their detection phase and data acquisition strategy.
Real-Time Detection in qPCR
Quantitative PCR (qPCR), also known as real-time PCR, monitors the accumulation of PCR products during each cycle of the amplification process. A fluorescent signal increases in direct proportion to the amount of amplified DNA, and the point at which the fluorescence crosses a predetermined threshold is recorded as the quantification cycle (Cq). The Cq value is inversely related to the starting quantity of the target nucleic acid. This method requires the parallel amplification of known standards to construct a calibration curve, against which the quantity of unknown samples is extrapolated [29] [30].
Endpoint Detection in dPCR
Digital PCR (dPCR), including its droplet-based form (ddPCR), takes a different approach. The PCR reaction mixture is partitioned into thousands of individual reactions—such as water-in-oil microdroplets or nanoplate wells [8] [29]. Amplification occurs within each partition, which is then analyzed at the end of the PCR process (endpoint). Partitions are scored as positive or negative based on the presence of a fluorescence signal, and the absolute quantity of the target molecule is calculated directly using Poisson statistics, without reference to a calibration curve [8] [31].
The following diagram illustrates the core workflow differences between these two technologies:
Comparative Performance Data from Experimental Studies
Robust experimental data from peer-reviewed studies across various applications highlight the performance implications of these technological differences. The table below summarizes key quantitative findings.
Table 1: Comparative Performance of qPCR and dPCR in Various Applications
| Application & Study | Key Performance Metric | qPCR Performance | dPCR/ddPCR Performance | Citation |
|---|---|---|---|---|
| HPV-Associated Cancers (Meta-Analysis) | Sensitivity (Pooled) | Lower sensitivity | Superior sensitivity (NGS > ddPCR > qPCR) | [20] |
| Periodontal Pathobiont Detection | Intra-assay Variability (CV%) | Higher (p=0.020) | Lower median CV% (4.5%) | [8] |
| T Cell Quantification (vs. FACS) | Concordance with Gold Standard | Lower (Concordance=0.36) | Higher (Concordance=0.78) | [32] |
| CAR-T Cell Monitoring | Sensitivity Limit | 1% | 0.01% | [33] |
| DNA Copy Number Variation (vs. PFGE) | Average Difference from Gold Standard | 22% | 5% | [31] |
| Precision (Technical Replicates) | Coefficient of Variation (%CV) | 5.0% | 2.3% | [29] |
The superior sensitivity and precision of dPCR are particularly critical in liquid biopsy applications, such as detecting circulating tumor DNA (ctDNA), where target molecules are rare. A 2025 study on rectal cancer demonstrated that a tumor-informed ddPCR assay detected ctDNA in 58.5% (24/41) of baseline plasma samples, significantly outperforming a standard NGS panel which detected ctDNA in only 36.6% (15/41) of the same samples [28].
Detailed Experimental Protocols
To ensure rigor and reproducibility, the following subsections outline the core methodologies cited in the performance comparisons.
Protocol: Multiplex dPCR for Periodontal Pathobionts
This protocol, adapted from a study comparing multiplex dPCR to qPCR, details the simultaneous detection of three bacterial species [8].
- Sample Preparation: Subgingival plaque samples are collected with absorbent paper points and pooled in reduced transport fluid with glycerol. DNA is extracted using the QIAamp DNA Mini kit.
- Reaction Setup: A 40 μL reaction mixture is prepared containing:
- 10 µL of sample DNA.
- 10 µL of 4× Probe PCR Master Mix.
- 0.4 µM of each specific primer.
- 0.2 µM of each specific, double-quenched hydrolysis probe.
- A restriction enzyme (Anza 52 PvuII) to reduce viscosity.
- Partitioning and Amplification: The mixture is transferred to a nanoplate (e.g., QIAcuity Nanoplate 26k) and partitioned into ~26,000 wells. Thermocycling conditions: initial denaturation at 95°C for 2 min, followed by 45 cycles of 95°C for 15 s and 58°C for 1 min.
- Endpoint Analysis: Fluorescence in each partition is measured on three channels after amplification. The software automatically calculates DNA concentration via Poisson distribution, with a reaction considered positive if at least three partitions are positive.
Protocol: ddPCR for CD3Z Demethylation for T-cell Quantification
This protocol, used to demonstrate superior precision over qPCR, quantifies demethylated CD3Z DNA as a marker for T cells [32].
- Bisulfite Conversion: Patient DNA samples are treated with bisulfite, which converts unmethylated cytosines to uracils, while methylated cytosines remain unchanged.
- Assay Design: Primers and probes are designed to hybridize specifically to the bisulfite-converted, demethylated sequence of the CD3Z promoter.
- Droplet Generation and PCR: The reaction mix is partitioned into ~20,000 nanodroplets using a droplet generator. Standard PCR amplification is performed.
- Droplet Reading and Quantification: A droplet reader counts the number of positive (fluorescent) and negative droplets. The absolute copy number of the demethylated CD3Z target is calculated directly using Poisson statistics, without a standard curve.
Protocol: qPCR with ANCOVA for Rigorous Data Analysis
To maximize rigor in qPCR, this protocol emphasizes best practices for data analysis, moving beyond the commonly used 2−ΔΔCT method [30].
- Data Collection: Raw fluorescence data from the qPCR run is exported for full transparency.
- Efficiency Consideration: The analysis must account for variations in amplification efficiency between assays. The ANCOVA (Analysis of Covariance) statistical method is recommended over 2−ΔΔCT as it offers greater robustness to such variability and enhances statistical power.
- Reference Gene Validation: The stability of reference genes must be empirically validated for the specific experimental conditions. Graphics that depict the behavior of both target and reference genes together are recommended for improved interpretability.
- Data Sharing: To ensure reproducibility, researchers should share raw fluorescence data and detailed analysis scripts (e.g., in R) that trace the entire workflow from raw data to final results.
The Scientist's Toolkit: Essential Research Reagents
The following table lists key reagents and their critical functions in these PCR assays, based on the cited protocols.
Table 2: Essential Reagents for dPCR and qPCR Experiments
| Reagent / Tool | Function | Example from Protocols |
|---|---|---|
| Hydrolysis Probes (e.g., TaqMan) | Sequence-specific detection; fluoresce upon cleavage during amplification. | Double-quenched probes for P. gingivalis, A. actinomycetemcomitans, F. nucleatum [8]. |
| Bisulfite Conversion Kit | Chemically modifies DNA to distinguish methylated from unmethylated cytosines. | Used in CD3Z methylation assay to detect T cells [32]. |
| Digital PCR Partitioning Plates/Consumables | Creates 1000s of individual reaction chambers for absolute quantification. | QIAcuity Nanoplate 26k [8]; droplets in ddPCR [32] [31] [28]. |
| Restriction Enzymes | Reduces DNA viscosity and complexity to improve partitioning efficiency. | Anza 52 PvuII in multiplex dPCR assay [8]. |
| Stable Reference Gene Assays | Provides a stable internal control for normalization in qPCR. | C-less reaction (methylation-insensitive target) [32]; validated housekeeping genes [30]. |
| Master Mix with High-Fidelity Polymerase | Provides optimized buffer, nucleotides, and enzyme for efficient, specific amplification. | QIAcuity Probe PCR Master Mix [8]; standard TaqMan master mixes [30]. |
The choice between endpoint detection (dPCR) and real-time detection (qPCR) is governed by the specific requirements of the liquid biopsy application. The collective experimental data demonstrate that dPCR offers superior sensitivity, precision, and accuracy for absolute quantification, making it particularly suited for detecting rare targets like ctDNA, monitoring minimal residual disease, and accurately assessing copy number variations. Its independence from calibration curves eliminates a major source of variability and bias.
Conversely, qPCR remains a robust, cost-effective technology for high-throughput applications where the target is relatively abundant and relative quantification is sufficient. By adhering to rigorous experimental protocols and modern data analysis principles like ANCOVA, researchers can maximize the value and reproducibility of qPCR data. Ultimately, the technological selection should be a deliberate decision based on the required detection limits, precision, and quantification needs of the research question.
Liquid Biopsy in Action: Methodological Workflows and Application-Specific Use Cases
Quantitative PCR (qPCR) has long been the gold-standard technique for gene-expression quantification, particularly in high-throughput applications where reliability, established workflows, and cost-effectiveness are paramount [34]. In the context of liquid biopsy research for oncology and other fields, the choice between qPCR and emerging technologies like digital PCR (dPCR) hinges on specific experimental goals, target abundance, and required sensitivity [35] [36]. This guide objectively compares the performance of qPCR against dPCR alternatives, focusing on its optimal application scenarios. While digital PCR excels in absolute quantification of low-abundance targets and has demonstrated superior performance in detecting rare mutations in liquid biopsy applications [6] [2], qPCR remains the preferred tool for high-throughput gene expression analysis and rapid screening of known targets, especially in well-characterized sample systems with minimal contamination [35] [37]. The following sections provide experimental data and methodologies to guide researchers in selecting the appropriate technology for their specific needs in drug development and clinical research.
Technology Comparison: Fundamental Principles and Capabilities
Understanding the core differences between qPCR and dPCR is essential for selecting the right platform. The table below summarizes their key characteristics, highlighting how their fundamental principles lead to distinct performance profiles.
Table 1: Fundamental Comparison of qPCR and dPCR Technologies
| Feature | Quantitative PCR (qPCR) | Digital PCR (dPCR) |
|---|---|---|
| Core Principle | Measures amplification in real-time during exponential phase | Partitions sample into thousands of reactions for end-point counting |
| Quantification | Relative (requires standard curve) | Absolute (no standard curve) |
| Primary Output | Cycle threshold (Cq) value | Copies per microliter |
| Ideal Target Abundance | Medium to high abundance targets | Low abundance targets, rare variants [35] |
| Throughput | High (96-well, 384-well formats) | Moderate (limited by partitioning) |
| Sensitivity to Inhibitors | High (affects reaction efficiency and Cq) | Lower (partitioning dilutes inhibitors) [35] |
| Multiplexing Capability | Limited by fluorescent channels | Improved by massive partitioning [38] |
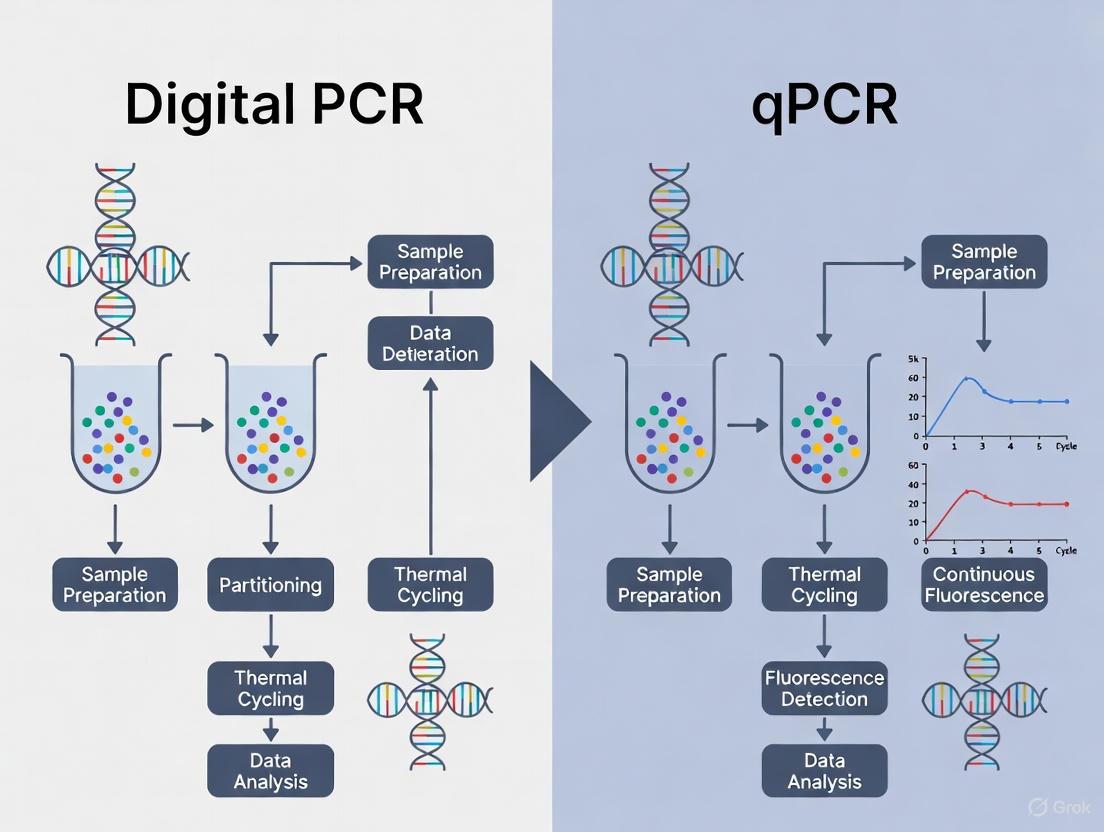
The logical relationship and workflow differences between these two technologies can be visualized as follows:
Figure 1: Comparative Workflows of qPCR and dPCR. qPCR relies on real-time monitoring and standard curves for relative quantification, while dPCR uses sample partitioning and end-point counting for absolute quantification.
Experimental Performance Data in Key Applications
Performance in Gene Expression Analysis
A direct comparison study using synthetic DNA samples under identical reaction conditions revealed key performance differentiators. For samples with low levels of nucleic acids (Cq ≥ 29) and/or variable amounts of chemical and protein contaminants, ddPCR technology produced more precise, reproducible, and statistically significant results [35]. However, for clean samples with well-optimized primers, both technologies showed comparable performance.
Table 2: Experimental Performance in Gene Expression Analysis with Low-Abundance Targets
| Experimental Condition | qPCR Performance | dPCR Performance |
|---|---|---|
| Clean samples (in water) | Good reaction efficiency (90-110%); low variability (<15% CV) [35] | Excellent separation of positive/negative droplets; accurate 2-fold dilution factor correlation [35] |
| Consistent sample contamination (4µL RT mix) | Acceptable reaction efficiency (~89.6%) [35] | Maintained accurate quantification despite interface droplets [35] |
| Consistent sample contamination (5µL RT mix) | Poor reaction efficiency (~67.1%); 2 Cq shift [35] | Maintained accurate quantification with increased interface droplets [35] |
| Inconsistent contamination across samples | Highly variable results; requires reference gene normalization [35] | Robust quantification with minimal variability; less dependent on normalization [35] |
Performance in Liquid Biopsy and Pathogen Detection
Recent studies across oncology and infectious disease diagnostics further highlight the technology-specific strengths. The following table summarizes key comparative findings:
Table 3: Clinical Application Performance in Liquid Biopsy and Pathogen Detection
| Application/Study | qPCR Findings | dPCR/ddPCR Findings |
|---|---|---|
| Lung Cancer (EGFR detection) | N/A | ddPCR: 58.8% detection rate vs tissue; dPCR (QIAcuity): 100% detection rate [39] [21] |
| Colorectal Cancer (RAS detection) | N/A | ddPCR: 72.7% detection rate vs tissue; dPCR (QIAcuity): 86.4% detection rate [39] [21] |
| Respiratory Virus Detection (2023-2024) | Standard method; quantification depends on standard curves [6] | Superior accuracy for high viral loads (Influenza A/B, SARS-CoV-2) and medium loads (RSV); more consistent precision [6] |
| General Liquid Biopsy Application | Widely available; suitable for screening known variants with higher abundance [36] | Extremely high sensitivity for limited targets; ideal for rare ctDNA mutation detection [36] |
Experimental Protocols for Technology Comparison
Protocol 1: Assessing Platform Performance with Low-Abundance Targets
This methodology, adapted from a published comparative study, is designed to evaluate the performance of qPCR versus dPCR when quantifying low-abundance targets—a common scenario in liquid biopsy research [35].
Materials and Reagents:
- Purified synthetic DNA target (e.g., cloned gene fragment)
- Validated primer pair for the target sequence
- qPCR/dPCR master mix (using identical chemistry for both platforms)
- Nuclease-free water
- Reverse transcription (RT) mix for contamination simulation
- Microcentrifuge tubes and pipettes
Procedure:
- Sample Preparation: Prepare a 1:2 serial dilution series of the synthetic DNA in nuclease-free water, covering a concentration range expected to yield Cq values between 27 and 32 in qPCR.
- Reaction Mix Setup: For each DNA dilution, create a single master mix containing the DNA, primers, and PCR master mix. Split this master mix equally (20 µL each) for analysis on both qPCR and dPCR platforms to ensure identical reaction conditions.
- Contamination Simulation: Repeat the dilution series preparation, this time supplementing the reactions with varying amounts (e.g., 4 µL and 5 µL) of RT mix to simulate consistent and inconsistent sample contamination.
- Data Acquisition:
- qPCR: Pipette all reactions into a single 96-well plate. Run the qPCR protocol with standard cycling conditions and fluorescence acquisition.
- dPCR: Load the reactions into the dPCR system (e.g., droplet generator or nanowell plate) according to the manufacturer's instructions. Perform PCR amplification with end-point fluorescence reading.
- Data Analysis:
- For qPCR: Calculate reaction efficiency from the standard curve and assess the variability in Cq values and relative quantification between replicates.
- For dPCR: Determine the absolute concentration (copies/µL) for each sample and assess precision and accuracy across the dilution series, even in the presence of contaminants.
Protocol 2: Mutation Detection in Liquid Biopsy Samples
This protocol, based on clinical cancer research, is tailored for comparing the sensitivity of different PCR platforms in detecting tumor-derived mutations in cell-free DNA (cfDNA) [39] [21].
Materials and Reagents:
- Plasma samples from cancer patients (e.g., NSCLC or CRC)
- cfDNA extraction kit (e.g., magnetic bead-based)
- Validated mutation assays (e.g., for EGFR or KRAS mutations)
- dPCR system (e.g., droplet-based or nanowell-based)
- qPCR system
- Appropriate probe-based master mixes for each platform
Procedure:
- Sample Collection and Processing: Collect blood plasma from patients according to standardized liquid biopsy procedures. Centrifuge to obtain cell-free plasma.
- cfDNA Extraction: Extract cfDNA from plasma using a commercially available kit. Prefer automated systems (e.g., KingFisher Flex) for consistency. Quantify and assess DNA quality.
- Assay Setup:
- For dPCR: Prepare the reaction mix according to the manufacturer's specifications for the target mutation. Include wild-type control assays. Partition the reactions and perform PCR amplification.
- For qPCR: Prepare the reaction mix for allele-specific qPCR or similar methods. Run in duplicate or triplicate on a real-time cycler, including a standard curve of known mutation abundance if performing quantitative analysis.
- Data Analysis:
- For dPCR: Use the platform's software to calculate the absolute concentration of mutant and wild-type alleles, determining the variant allele frequency (VAF).
- For qPCR: Determine Cq values and use the standard curve to interpolate mutant allele concentration, or use ΔΔCq methods for relative quantification. Compare the detection rates and VAFs obtained by each platform against tissue biopsy results (the reference standard).
Essential Research Reagent Solutions
The table below details key reagents and materials central to performing the experiments described in this guide, along with their critical functions in the workflow.
Table 4: Essential Research Reagents and Materials for qPCR/dPCR Studies
| Reagent/Material | Function/Application | Considerations |
|---|---|---|
| Validated Primer/Probe Assays | Specific amplification and detection of target DNA sequences. | Pre-validated assays ensure optimal reaction efficiency (90-110%) and specificity for both platforms [35]. |
| PCR Master Mix | Contains Taq polymerase, dNTPs, buffers, and salts necessary for amplification. | Using the same master mix for both qPCR and dPCR comparisons is critical for a fair performance assessment [35]. |
| cfDNA Extraction Kit | Isolation of high-quality, inhibitor-free cell-free DNA from plasma. | Purity is critical; residual contaminants can variably inhibit Taq polymerase, affecting qPCR more significantly [35] [2]. |
| Synthetic DNA Controls | Used for standard curves (qPCR) and absolute quantification calibration (dPCR). | Well-characterized controls are essential for assessing precision, dynamic range, and accuracy in both systems [35]. |
| Reverse Transcription (RT) Mix | For cDNA synthesis in gene expression studies; can be used as a source of known contaminants. | Components can inhibit Taq polymerase; its variable introduction is useful for testing platform robustness [35]. |
Technology Selection Guide
The choice between qPCR and dPCR is not one of superiority but of appropriateness for specific research questions. The following diagram outlines a decision pathway to guide scientists in selecting the optimal technology based on their experimental parameters.
Figure 2: Decision Workflow for Selecting Between qPCR and dPCR. This pathway helps researchers determine the optimal technology based on key experimental parameters including target abundance, sample quality, and quantification needs.
Key Selection Criteria Elaborated
- Optimal qPCR Applications: qPCR is the recommended technology for high-throughput gene expression analysis where the targets are of medium to high abundance and samples are well-characterized and free of significant contaminants [35] [34]. It is also the pragmatic choice for rapid screening of a limited number of known targets (≤ 20) and when budget is a primary constraint, as the technology is more accessible and established in most labs [37].
- Optimal dPCR Applications: dPCR is unequivocally superior for applications requiring absolute quantification of low-abundance targets, such as detecting rare mutations in circulating tumor DNA (ctDNA) for liquid biopsy [39] [2] [36]. Its robustness in the face of sample contaminants and its ability to provide precise measurements without standard curves make it ideal for analyzing challenging clinical samples like cfDNA [35] [6].
- When to Consider Other Technologies: For studies requiring the discovery of novel variants or the profiling of hundreds to thousands of target regions simultaneously, Next-Generation Sequencing (NGS) offers a hypothesis-free approach with unparalleled discovery power, though often at a higher cost and complexity [37].
dPCR for Detecting Rare Mutations and Low-Abundance Targets in ctDNA
Liquid biopsy, the analysis of circulating tumor DNA (ctDNA) from blood plasma, has emerged as a transformative, non-invasive approach for cancer detection, monitoring, and management. This paradigm enables real-time assessment of tumor burden, genetic heterogeneity, and therapeutic response [40] [1]. However, a significant challenge persists: in early-stage cancers and minimal residual disease (MRD), ctDNA can be exceptionally scarce, often constituting less than 0.1% of the total cell-free DNA (cfDNA), demanding exceptional sensitivity and specificity from detection technologies [40].
Within this context, digital PCR (dPCR) has established itself as a powerful tool for detecting rare mutations and low-abundance targets in ctDNA, offering advantages over traditional quantitative PCR (qPCR) and next-generation sequencing (NGS) for specific clinical applications [19]. This guide provides an objective, data-driven comparison of dPCR's performance against alternative technologies, focusing on its critical role in advancing liquid biopsy research.
Technology Comparison: dPCR vs. qPCR vs. NGS
The choice between dPCR, qPCR, and NGS is fundamental to designing effective liquid biopsy studies. Each technology operates on distinct principles, leading to different performance characteristics.
Fundamental Principles and Workflows
The core innovation of dPCR is sample partitioning, which enables direct molecule counting. The following diagram illustrates the typical dPCR workflow for ctDNA analysis.
In contrast, qPCR amplifies the entire sample in a single tube, monitoring fluorescence in real-time. Quantification relies on comparing the amplification cycle threshold (Ct) to a standard curve, providing relative, not absolute, quantification [19]. NGS sequences millions of DNA fragments in parallel, allowing for the detection of multiple unknown mutations across a wide genomic region but typically requiring high sequencing depth to find rare variants [40] [41].
Performance Metrics and Experimental Data
Direct comparisons in clinical studies highlight the practical differences between these technologies. The table below summarizes key performance characteristics based on recent research.
| Feature | Digital PCR (dPCR) | Quantitative PCR (qPCR) | Next-Generation Sequencing (NGS) |
|---|---|---|---|
| Quantification Method | Absolute (direct counting) [19] | Relative (standard curve) [19] | Relative (bioinformatic analysis) |
| Sensitivity (VAF) | ~0.001% - 0.01% [40] [28] | ~1% - 5% [19] | ~0.1% - 1% (varies with depth) [42] [41] |
| Dynamic Range | Narrower [19] | Wide (6-7 orders) [19] | Very Wide |
| Multiplexing Capability | Low (1-4 plex) | Moderate | High (100s-1000s of targets) |
| Cost & Throughput | Higher cost, lower throughput [19] | Lower cost, high throughput [19] | Highest cost, scalable throughput |
| Robustness to Inhibitors | High (partitioning dilutes effect) [19] | Sensitive [19] | Sensitive |
A 2025 study in Cancer Medicine directly compared dPCR and an NGS panel for detecting ctDNA in localized rectal cancer. The results were striking: in the development cohort, dPCR detected ctDNA in 24/41 (58.5%) of baseline plasma samples, significantly outperforming the NGS panel, which detected ctDNA in only 15/41 (36.6%) (p = 0.00075) [42] [28]. This demonstrates dPCR's superior sensitivity for oligomarker detection in a clinical workflow.
Choosing the Right Technology
The choice of platform depends heavily on the research question:
- dPCR is ideal for tracking known, low-frequency mutations with utmost sensitivity, such as in MRD monitoring or resistance mutation detection [19].
- qPCR is suitable for high-throughput, cost-effective screening of more abundant targets, like gene expression or high-VAF variants [19].
- NGS is unmatched for discovery applications, profiling unknown mutations, assessing tumor heterogeneity, and analyzing structural variants or epigenetic modifications [40].
Experimental Protocols for ctDNA Analysis Using dPCR
Robust experimental protocols are essential for reliable ctDNA detection. The following section details a standard methodology.
Sample Collection and cfDNA Extraction
- Blood Collection: Collect peripheral blood (e.g., 3 x 9 mL) into cell-free DNA blood collection tubes (e.g., Streck Cell-Free DNA BCT) to stabilize nucleated cells and prevent genomic DNA contamination [28].
- Plasma Isolation: Process blood within 6 hours of collection. Isolate plasma through double centrifugation (e.g., 1,600 x g for 20 min, then 16,000 x g for 10 min) to remove all cells and debris [28].
- cfDNA Extraction: Purify cfDNA from plasma using commercially available silica-membrane or magnetic bead-based kits (e.g., QIAamp Circulating Nucleic Acid Kit). Elute in a low-EDTA buffer to ensure compatibility with downstream enzymatic reactions. Quantify cfDNA using a fluorescence-based assay sensitive to low DNA concentrations.
dPCR Assay Setup and Execution
- Assay Design: Design and validate hydrolysis (TaqMan) probes and primers specific to the mutation of interest. For a tumor-informed approach, the mutation is first identified in the primary tumor tissue via NGS [28].
- Reaction Partitioning: Prepare the dPCR reaction mix containing the extracted cfDNA, primers, probes, and dPCR master mix. Load the mixture into a cartridge or plate for automated partitioning. The QX200 ddPCR system, for instance, generates ~20,000 nanodroplets per sample [28].
- PCR Amplification: Perform endpoint PCR amplification on a thermal cycler using optimized cycling conditions. A typical protocol includes: enzyme activation (95°C for 10 min), 40 cycles of denaturation (94°C for 30 sec) and annealing/extension (55-60°C for 60 sec), followed by a enzyme deactivation step (98°C for 10 min) [28].
- Data Analysis: Read the plate or droplet cartridge on a dedicated reader. Using Poisson statistics, the software calculates the absolute concentration of mutant and wild-type DNA molecules (copies/μL) in the original sample, from which the variant allele frequency (VAF) is derived [43].
The Scientist's Toolkit: Essential Reagents and Materials
Successful ctDNA analysis requires a suite of specialized reagents and instruments. The following table details key solutions for a standard dPCR workflow.
| Item | Function/Description | Example Products/Brands |
|---|---|---|
| cfDNA Blood Collection Tubes | Preserves blood sample, prevents cell lysis and release of wild-type genomic DNA. | Streck Cell-Free DNA BCT [28] |
| cfDNA Extraction Kit | Isulates short-fragment cfDNA from plasma with high efficiency and purity. | QIAamp Circulating Nucleic Acid Kit [28] |
| dPCR Supermix | Optimized buffer, enzymes, and dNTPs for efficient amplification in partitioned reactions. | ddPCR Supermix for Probes [9] |
| Hydrolysis Probes & Primers | Target-specific assays for mutant and wild-type alleles; require rigorous validation. | TaqMan Assays [28] |
| Partitioning Oil/Cartridge | Creates the nanodroplets or nanowells for individual PCR reactions. | DG8 Cartridges & Droplet Generation Oil [9] |
| dPCR Instrument System | Platform for partitioning, thermal cycling, and fluorescence reading. | Bio-Rad QX200, QIAGEN QIAcuity [9] |
Digital PCR has firmly established its role as a cornerstone technology in liquid biopsy research, particularly for applications demanding the sensitive and absolute quantification of rare mutations. Its demonstrated superiority over NGS in detecting low-VAF ctDNA in specific clinical settings [42] [28], combined with its robustness and calibration-free nature, makes it an indispensable tool for monitoring minimal residual disease, tracking treatment resistance, and validating therapeutic targets. While NGS remains the technology of choice for exploratory discovery and comprehensive genomic profiling, and qPCR for high-throughput, cost-effective screening, dPCR occupies a critical niche where precision and sensitivity at the limit of detection are paramount. As the field progresses, the synergistic use of these technologies, leveraging the strengths of each, will undoubtedly accelerate the integration of liquid biopsies into routine clinical practice.
In the evolving field of molecular diagnostics, particularly for liquid biopsy research, the selection of an appropriate PCR technology is paramount. Quantitative PCR (qPCR) and digital PCR (dPCR) represent two powerful yet fundamentally distinct approaches for nucleic acid detection and quantification [44]. While qPCR has long been the gold standard for gene expression analysis and pathogen detection, dPCR has emerged as a robust alternative offering absolute quantification without the need for standard curves [45] [46]. This guide provides a comprehensive, objective comparison of the complete workflows of both technologies, from initial sample preparation through final data analysis, focusing on their application in liquid biopsy research where sensitivity and precision are critical for detecting rare mutations and low-abundance targets.
Fundamental Technological Principles
The core distinction between qPCR and dPCR lies in their quantification methods and reaction partitioning. qPCR, also known as real-time PCR, monitors amplification kinetics during early exponential phases, quantifying target DNA relative to standard curves or reference genes [47]. It measures the cycle threshold (CT) at which amplification becomes detectable, requiring external calibration for absolute quantification [44] [47].
In contrast, dPCR employs a partitioning-based absolute quantification approach. The reaction mixture is divided into thousands of individual partitions (nanowells or droplets), effectively creating numerous independent PCR reactions [8] [46]. After endpoint amplification, partitions are analyzed as positive or negative based on fluorescence signals [46]. Absolute target concentration is calculated using Poisson statistical analysis based on the ratio of positive to negative partitions, eliminating the need for standard curves [46] [9].
This fundamental difference in quantification principles significantly impacts their performance characteristics, with dPCR demonstrating superior tolerance to PCR inhibitors and enhanced precision for low-abundance targets [8] [44].
Comparative Workflow Analysis
Sample Preparation and Nucleic Acid Extraction
Both dPCR and qPCR begin with nucleic acid extraction, but optimal input requirements differ. For liquid biopsy applications involving cell-free DNA (cfDNA), proper extraction and storage are crucial for maintaining nucleic acid integrity [48].
Input Material Compatibility: Both technologies are compatible with DNA and RNA (via cDNA synthesis) from various extraction methods, from phenol-chloroform to modern kit-based systems [48]. For liquid biopsies, specialized cfDNA extraction kits are recommended to optimize yield from plasma samples.
Quality Control Considerations: Nucleic acid purity is critical for both methods. Spectrophotometric assessment (A260/280 and A260/230 ratios) helps identify contaminants [48]. dPCR's partitioned nature provides greater tolerance to common PCR inhibitors found in clinical samples [44] [6].
Sample Storage: DNA should be stored in Tris-EDTA buffer at -20°C to prevent degradation, particularly cytosine deamination and 8-Oxo-2'-deoxyguanosine formation, which can cause base transversions during amplification [48].
Template-Specific Considerations: High GC-content templates may require additives like DMSO or betaine for complete denaturation [48]. High molecular weight DNA may need shearing for optimal partitioning in dPCR [48].
Concentration Conversion: For dPCR, thinking in terms of copy number rather than mass is essential. The conversion formula is: Number of copies = mass of DNA (ng) / mass of studied genome (ng) [48].
Table 1: Sample Preparation Requirements for qPCR and dPCR
| Parameter | qPCR | dPCR |
|---|---|---|
| Input DNA Quality | High purity critical; inhibitors significantly affect results | More tolerant to inhibitors due to partitioning |
| Optimal Input | Typically 1-100 ng DNA | Typically 1-100 ng DNA (converted to copy numbers) |
| GC-Rich Templates | Betaine or DMSO often needed | Betaine or DMSO often needed |
| High Molecular Weight DNA | Generally compatible | May require shearing for optimal partitioning |
| Storage Conditions | -20°C in TE buffer | -20°C in TE buffer |
Reaction Setup and Assay Design
The reaction setup diverges significantly after sample preparation, particularly in assay design considerations and multiplexing capabilities.
Primer and Probe Design: Both technologies use similar primer design principles with target Tm ~60-62°C, GC content 35-65%, and lengths of 18-30 bases [49]. For probe-based assays, dPCR utilizes the same hydrolysis chemistry with 5' fluorophores and 3' quenchers [46] [49]. Probes should have Tm 5-10°C higher than primers, avoid G at the 5' end, and be limited to ~30 bases for optimal quenching [49].
Multiplexing Capabilities: qPCR multiplexing is constrained by competition for reagents and limited fluorescent channels, requiring careful optimization to balance amplification efficiency [47]. dPCR offers superior multiplexing capabilities as partitioning prevents primer competition, enabling more reliable simultaneous detection of multiple targets [8] [46].
Chemistry Options: Both systems support intercalating dyes (SYBR Green/EvaGreen) and probe-based detection (TaqMan), though probe-based methods are preferred for specificity in complex applications like liquid biopsy [46] [49].
Instrumentation and Amplification
The instrumentation and amplification processes reflect the core technological differences between the platforms.
Partitioning Mechanisms: dPCR platforms utilize either droplet-based (water-oil emulsions) or nanoplate-based (microwell chips) systems [50] [46]. The QIAcuity system partitions reactions into approximately 26,000 nanowells [8], while droplet systems like Bio-Rad's QX200 generate thousands of nanoliter-sized droplets [50] [9].
Amplification Profile: qPCR employs real-time monitoring throughout 40-45 cycles, tracking fluorescence during exponential amplification [47]. dPCR uses standard PCR thermal cycling (e.g., 45 cycles of 95°C denaturation and 58°C annealing/extension) followed by endpoint fluorescence reading [8].
Throughput Considerations: qPCR generally offers higher throughput with faster run times and 96- or 384-well formats [44]. dPCR typically has lower throughput but provides absolute quantification without standard curves [44].
Data Analysis and Interpretation
The data analysis phase highlights the statistical advantages of dPCR for precise quantification, especially for low-abundance targets.
qPCR Quantification Methods: qPCR employs relative quantification (ΔΔCT method) comparing target expression to reference genes, or absolute quantification using standard curves with known concentrations [47]. This introduces variability through calibration dependencies [44].
dPCR Absolute Quantification: dPCR directly counts target molecules using Poisson distribution statistics to account for multiple targets per partition [46] [9]. This provides absolute quantification without external standards, reducing variability [8] [44].
Sensitivity and Precision: dPCR demonstrates superior sensitivity for low-abundance targets (<3 log10Geq/mL), detecting bacterial loads that qPCR missed [8]. dPCR also shows lower intra-assay variability (median CV%: 4.5% vs qPCR) [8]. For viral detection, dPCR showed greater consistency and precision, particularly for medium viral loads [6].
Table 2: Performance Comparison Between qPCR and dPCR
| Performance Metric | qPCR | dPCR | Experimental Evidence |
|---|---|---|---|
| Limit of Detection | Moderate | Superior | dPCR detected lower bacterial loads, particularly for P. gingivalis and A. actinomycetemcomitans [8] |
| Precision (CV%) | Higher variability | Lower intra-assay variability (median CV%: 4.5%) | Significantly lower variability in dPCR (p = 0.020) [8] |
| Accuracy at Low Targets | False negatives at <3 log10Geq/mL | Reliable detection at low concentrations | Bland-Altman plots showed qPCR false negatives at low concentrations [8] |
| Dynamic Range | 5-6 logs | 4-5 logs | Both cover clinically relevant ranges [44] |
| Inhibitor Tolerance | Moderate | High | Partitioning reduces inhibitor effects [44] |
Experimental Protocols for Performance Validation
Protocol: Comparative Sensitivity Analysis for Liquid Biopsy Applications
This protocol is adapted from studies comparing dPCR and qPCR for detecting low-abundance targets [8] [6].
Sample Preparation: Extract DNA from clinical samples (e.g., plasma cfDNA for liquid biopsy) using validated kits. Quantify using fluorometry and dilute to working concentrations in TE buffer.
Serial Dilution Preparation: Prepare 10-fold serial dilutions covering the expected clinical range (e.g., from 10^5 to 10^0 copies/μL). Include replicates at each concentration (n≥3) for both platforms.
qPCR Setup:
- Use validated primer-probe sets for targets of interest (e.g., cancer mutations)
- Include standard curves with known concentrations
- Perform amplification with standard cycling conditions: initial denaturation (95°C, 2 min), 45 cycles of (95°C, 15 s; 58-60°C, 1 min)
- Record CT values for quantification
dPCR Setup:
- Use identical primer-probe sets from qPCR experiments
- Partition samples according to platform specifications (e.g., QIAcuity 26k nanoplates)
- Amplify using similar cycling conditions to qPCR
- Analyze using platform-specific software (e.g., QIAcuity Suite) with Poisson correction
Data Analysis: Compare calculated concentrations between platforms using Bland-Altman plots, determine limits of detection (LOD) and quantification (LOQ), and assess precision via coefficient of variation (CV%) across replicates.
Protocol: Multiplexing Efficiency Comparison
This protocol evaluates the superior multiplexing capability of dPCR, valuable for simultaneous analysis of multiple biomarkers in liquid biopsy [8] [46].
Assay Design: Design primer-probe sets for 3-4 targets with distinct fluorophores. Include an internal reference gene for normalization.
qPCR Multiplex Optimization:
- Titrate primer and probe concentrations to balance amplification efficiency
- Verify minimal cross-talk between channels using control samples
- Assess efficiency for each target individually and in multiplex format
dPCR Multiplex Setup:
- Combine all primer-probe sets in a single reaction without extensive optimization
- Partition and amplify according to standard dPCR protocols
- Analyze each channel independently for target quantification
Performance Metrics: Compare amplification efficiency, sensitivity, and precision between singleplex and multiplex formats for both technologies. Assess quantitative concordance between platforms for each target.
Research Reagent Solutions
Successful implementation of either technology requires appropriate selection of reagents and tools. The following table outlines essential solutions for dPCR and qPCR workflows.
Table 3: Essential Research Reagents and Tools for dPCR and qPCR
| Reagent Category | Specific Examples | Function & Application |
|---|---|---|
| Nucleic Acid Extraction Kits | QIAamp DNA Mini Kit, MagMax Viral/Pathogen Kit, RSC PureFood GMO Kit, STARMag Universal Cartridge Kit | Isolation of high-quality DNA/RNA from various sample types; critical for removing inhibitors [8] [50] |
| Probe-Based Detection Chemistry | PrimeTime qPCR Probes, Affinity Plus qPCR Probes, TaqMan Probe PCR Kits | Sequence-specific detection with 5' fluorophores and 3' quenchers; essential for multiplexing [46] [49] |
| Intercalating Dye Chemistry | SYBR Green, EvaGreen | Cost-effective alternative for single-target detection; requires melt curve analysis for specificity [46] |
| dPCR Partitioning Consumables | QIAcuity Nanoplates, QX200 Droplet Generation Cartridges | Platform-specific partitions for reaction separation; critical for absolute quantification [8] [50] |
| Enzymes & Master Mixes | QIAcuity Probe PCR Kit, Restriction Enzymes (e.g., PvuII, HaeIII, EcoRI) | Optimized polymerases and buffers for efficient amplification; restriction enzymes improve target accessibility [8] [9] |
| Reference Materials & Controls | ERM Certified Reference Materials, No Template Controls, No RT Controls | Quality assurance; verification of extraction and amplification efficiency; critical for quantitative accuracy [50] [49] |
The choice between dPCR and qPCR for liquid biopsy research depends on specific application requirements. qPCR remains the preferred choice for high-throughput applications where relative quantification suffices and cost-effectiveness is prioritized [45] [44]. Its established workflows, faster turnaround times, and lower per-sample cost make it ideal for screening applications.
dPCR demonstrates clear advantages for liquid biopsy applications requiring absolute quantification, superior sensitivity for rare targets, and enhanced precision [8] [6]. Its partitioning technology provides greater resilience to inhibitors and better performance with low-abundance targets, making it particularly valuable for detecting rare mutations in cfDNA and minimal residual disease monitoring [44] [46].
For comprehensive liquid biopsy research programs, a complementary approach utilizing both technologies may be optimal—employing qPCR for initial screening and dPCR for validation and absolute quantification of critical biomarkers. As both technologies continue to evolve, integration with automated workflows and artificial intelligence will further enhance their capabilities for next-generation molecular diagnostics.
Liquid biopsy, the analysis of tumor-derived components in bodily fluids, is transforming cancer management by providing a minimally invasive method for diagnosing and monitoring tumors. [2] [51] This approach primarily focuses on biomarkers such as circulating tumor DNA (ctDNA) and circulating tumor cells (CTCs), which carry molecular information about the tumor's genetic landscape. [51] [52] The effective detection and quantification of these rare biomarkers, especially for assessing treatment response and emerging resistance, demand techniques with exceptional sensitivity and precision. [53] Digital PCR (dPCR) has emerged as a powerful tool for this purpose, enabling the absolute quantification of nucleic acids without the need for standard curves, a limitation inherent to quantitative real-time PCR (qPCR). [45] This case study objectively compares the performance of dPCR technologies against qPCR and across different dPCR platforms within the context of liquid biopsy for cancer monitoring, providing key experimental data and methodologies to guide researchers and drug development professionals.
dPCR vs. qPCR: A Fundamental Comparison for Liquid Biopsy
The core difference between digital PCR (dPCR) and quantitative PCR (qPCR) lies in their method of quantification. qPCR is a high-throughput technique that measures DNA amplification in real-time during the exponential phase, relying on standard curves to determine the initial amount of target DNA. [45] In contrast, dPCR partitions a sample into thousands of individual reactions, performs an end-point PCR, and uses Poisson statistics to provide absolute quantification without the need for a standard curve. [45] [9] This fundamental distinction makes dPCR particularly suited for liquid biopsy applications where detecting rare mutations against a high background of wild-type DNA is critical. [45] [53]
Advantages of dPCR for Liquid Biopsy Applications:
- Absolute Quantification: Eliminates variability and inaccuracies associated with constructing standard curves in qPCR. [45] [29]
- Superior Precision and Reproducibility: Partitioning the reaction reduces the impact of PCR inhibitors and lowers measurement variability. Studies show dPCR can have a 2 to 3-fold lower coefficient of variation (%CV) compared to qPCR. [29]
- Enhanced Sensitivity for Rare Targets: dPCR is uniquely capable of detecting and quantifying mutations that constitute a very small fraction (e.g., 0.1%) of the total DNA, which is essential for monitoring minimal residual disease (MRD) or emerging resistance mutations in ctDNA. [45] [53] [52]
When to Choose qPCR: qPCR remains a suitable and cost-effective choice for high-throughput applications where the target is not rare, such as relative gene expression analysis or pathogen detection when moderate sensitivity is sufficient. [45]
Table 1: Key Characteristics of dPCR vs. qPCR
| Feature | Digital PCR (dPCR) | Quantitative PCR (qPCR) |
|---|---|---|
| Quantification Method | Absolute (without standard curve) | Relative or absolute (requires standard curve) |
| Principle | End-point detection after sample partitioning | Real-time detection during exponential phase |
| Sensitivity | High (ideal for rare mutations and low-abundance targets) | Moderate |
| Precision | Higher (Lower coefficient of variation) [29] | Lower |
| Tolerance to Inhibitors | Higher [29] | Lower |
| Primary Liquid Biopsy Application | Rare mutation detection (e.g., in ctDNA), MRD monitoring, absolute viral load quantification | Gene expression, pathogen detection (when target not rare) |
Comparative Performance Data: dPCR Platforms in Liquid Biopsy
While dPCR as a technology offers distinct advantages, different dPCR platforms can exhibit variations in performance. Direct comparisons of these systems are crucial for robust and reproducible data interpretation. [9]
Platform Comparison: QIAcuity (Nanoplate-based) vs. QX200 (Droplet-based)
A 2025 study compared the QIAcuity One nanoplate-based dPCR (ndPCR) system with the QX200 droplet digital PCR (ddPCR) system from Bio-Rad using synthetic oligonucleotides and ciliate DNA. [9] The findings demonstrate that both platforms are highly capable, with some nuanced differences.
Table 2: Performance Metrics of Two dPCR Platforms [9]
| Parameter | QIAcuity One (ndPCR) | QX200 (ddPCR) |
|---|---|---|
| Limit of Detection (LOD) | ~0.39 copies/µL input | ~0.17 copies/µL input |
| Limit of Quantification (LOQ) | ~1.35 copies/µL input | ~4.26 copies/µL input |
| Precision (CV) with Synthetic DNA | 7-11% | 6-13% |
| Key Finding | High precision across a wide concentration range (31-3000 copies/µL) | Highest precision at mid-range concentrations (~270 copies/µL) |
The study also highlighted that the choice of restriction enzyme (e.g., HaeIII vs. EcoRI) in the sample preparation workflow can significantly impact precision, particularly for the ddPCR system, where the use of HaeIII drastically improved reproducibility. [9]
Clinical Application: Mutation Detection in Lung and Colorectal Cancer
A 2023 clinical study published in Clinica Chimica Acta directly compared a droplet-based (ddPCR) and a solid-state (sdPCR) platform for analyzing liquid biopsy samples from patients with lung and colorectal cancer. [21] The results underscore the high sensitivity of dPCR for detecting tumor-derived mutations in plasma.
Table 3: Mutation Detection Rates in Clinical Liquid Biopsy Samples [21]
| Cancer Type | Mutation | Detection Rate (ddPCR) | Detection Rate (sdPCR - QIAcuity) |
|---|---|---|---|
| Non-Small Cell Lung Cancer (NSCLC) | EGFR | 58.8% | 100% |
| Colorectal Cancer (CRC) | KRAS | 72.7% | 86.4% |
The study concluded that while there was a moderate agreement between the two dPCR platforms, the solid dPCR system (QIAcuity) demonstrated a higher sensitivity in detecting mutated cases from plasma cfDNA compared to tissue results. [21] This highlights the importance of platform selection for specific clinical applications.
Experimental Protocols for dPCR in Liquid Biopsy
To ensure reproducibility, following a standardized and detailed experimental protocol is essential. The following methodology is synthesized from the cited studies. [9] [21]
Sample Collection and Cell-Free DNA (cfDNA) Extraction
- Blood Collection: Collect peripheral blood from cancer patients into EDTA or Streck Cell-Free DNA BCT tubes to prevent cell lysis and preserve cfDNA.
- Plasma Separation: Centrifuge blood within a few hours of collection using a two-step protocol (e.g., 1600 × g for 10 min, followed by 16,000 × g for 10 min) to separate plasma from blood cells without contamination.
- cfDNA Extraction: Extract cfDNA from plasma using commercially available circulating nucleic acid kits (e.g., QIAamp Circulating Nucleic Acid Kit from QIAGEN). Elute the extracted cfDNA in a low-EDTA TE buffer or nuclease-free water.
- Quality Control: Quantify the purified cfDNA using a fluorometer. The typical yield for downstream dPCR analysis is between 5-50 ng per reaction.
Digital PCR Assay Setup and Execution
- Reaction Mix Preparation: Prepare the dPCR reaction mix according to the manufacturer's instructions for the specific platform. A typical 20-40 µL reaction volume includes:
- dPCR Master Mix (comprising DNA polymerase, dNTPs, and buffer)
- Fluorescently labeled probe(s) (e.g., FAM/HEX) for the target mutation and a reference gene
- Restriction enzyme (optional, but can improve precision and accessibility of target sequences, e.g., HaeIII) [9]
- Purified cfDNA template
- Partitioning and Amplification:
- Droplet-based dPCR (e.g., QX200): Load the reaction mix into a droplet generator to create thousands of nanoliter-sized oil-emulsion droplets. Transfer the droplets to a 96-well plate and perform PCR amplification in a thermal cycler.
- Nanoplate-based dPCR (e.g., QIAcuity): Load the reaction mix directly into a integrated dPCR plate containing nanostructured wells. The instrument performs partitioning and thermal cycling automatically.
- PCR Cycling Conditions: Use a standard thermal cycling protocol optimized for the assay, typically involving an initial enzyme activation step, 40-45 cycles of denaturation, and annealing/extension.
Data Acquisition and Analysis
- Fluorescence Reading: After amplification, load the plate or droplets into a reader that scans each partition for fluorescence signals.
- Threshold Setting: Use the platform's software to set fluorescence amplitude thresholds that clearly distinguish positive (target-containing) partitions from negative partitions. This can be done automatically or manually.
- Absolute Quantification: The software applies Poisson statistics to the count of positive and negative partitions to calculate the absolute concentration of the target sequence in copies per microliter (copies/µL) of the input reaction. Results can be further normalized to the input volume or the concentration of a reference gene.
dPCR Liquid Biopsy Workflow
The Scientist's Toolkit: Key Reagent Solutions
Successful implementation of dPCR for liquid biopsy requires a set of core reagents and tools. The following table details essential components and their functions.
Table 4: Essential Research Reagents for dPCR-based Liquid Biopsy
| Reagent / Solution | Function / Role in the Experiment |
|---|---|
| Cell-Free DNA BCT Tubes | Specialized blood collection tubes that stabilize nucleated blood cells and prevent genomic DNA contamination, preserving the integrity of plasma cfDNA. |
| Circulating Nucleic Acid Extraction Kits | Optimized for isolating short-fragment, low-concentration cfDNA from large-volume plasma samples with high efficiency and purity. |
| dPCR Master Mix | A ready-to-use mixture containing a robust, hot-start DNA polymerase, dNTPs, and optimized buffers for efficient amplification in partitioned reactions. |
| Hydrolysis Probes (e.g., TaqMan) | Sequence-specific fluorescently labeled probes (FAM/HEX) that enable highly specific detection and discrimination of single-nucleotide variants (SNVs) in ctDNA. |
| Restriction Enzymes (e.g., HaeIII) | Used to digest long DNA fragments, which can improve precision and accessibility of target genes, especially in repetitive regions. [9] |
| Reference Assay Controls | Assays targeting reference genes (e.g., Albumin, RNase P) used for data normalization and quality control to account for variations in cfDNA input. |
This case study demonstrates that dPCR is a superior technology for sensitive and precise liquid biopsy applications, particularly for monitoring cancer treatment response and resistance through the detection of rare ctDNA mutations. The direct comparison of dPCR to qPCR reveals clear advantages in absolute quantification, precision, and sensitivity. Furthermore, head-to-head evaluations of different dPCR platforms provide critical insights for researchers, showing that while all dPCR systems are highly capable, performance in terms of detection limits and precision can vary. As liquid biopsy continues to be integrated into cancer research and clinical trials, the selection of an appropriately sensitive and robust dPCR platform, coupled with optimized experimental protocols, is paramount for generating reliable data to guide therapeutic decisions.
This guide provides an objective comparison of the performance between digital PCR (dPCR) and quantitative real-time PCR (qPCR) for two key applications in biomedical research: pathogen detection and copy number variation (CNV) analysis. The data presented is framed within the context of their use in liquid biopsy research, a field that demands high sensitivity and precision.
Performance Comparison in Key Applications
The core differences in the principles of dPCR and qPCR lead to distinct performance characteristics, making each technology suitable for different research scenarios. The following table summarizes the fundamental technical differences between the two methods.
Table 1: Fundamental technical differences between dPCR and qPCR.
| Feature | Quantitative PCR (qPCR) | Digital PCR (dPCR) |
|---|---|---|
| Principle | Real-time monitoring of amplification during exponential phases. Measures the cycle threshold (Cq) at which fluorescence crosses a threshold [45]. | End-point detection after partitioning a sample into thousands of nanoreactions. Counts the number of positive and negative partitions [50] [9]. |
| Quantification | Relative or absolute quantification dependent on a standard curve [45] [54]. | Absolute quantification without the need for a standard curve, using Poisson statistics [45] [8]. |
| Key Output | Cq value, which is inversely correlated to the starting amount of target nucleic acid [54]. | Absolute copy number per unit volume (e.g., copies/μL) [50]. |
| Sensitivity & Precision | High sensitivity, but precision can be affected by amplification efficiency and standard curve variability [54]. | Higher sensitivity and precision, especially for detecting low-abundance targets or small fold-changes [8] [55]. |
| Tolerance to Inhibitors | Moderately susceptible to PCR inhibitors which can affect amplification efficiency [50]. | Generally more tolerant to PCR inhibitors due to the endpoint detection and partitioning [50] [8]. |
Application 1: Pathogen Detection
The ability to accurately detect and quantify pathogenic organisms is crucial in microbiology and clinical diagnostics. The following table compares the performance of dPCR and qPCR in this application, with a focus on detecting periodontal pathobionts.
Table 2: Performance comparison for pathogen detection in subgingival plaque samples [8].
| Parameter | qPCR Performance | dPCR Performance |
|---|---|---|
| Linear Dynamic Range | High linearity (R² > 0.99) | High linearity (R² > 0.99) |
| Intra-assay Precision (CV%) | Significantly higher variability | Lower variability (Median CV%: 4.5%) |
| Sensitivity (Detection) | Failed to detect low bacterial loads (< 3 log10Geq/mL), resulting in false negatives. | Superior sensitivity, reliably detected low-level bacterial loads. |
| Analytical Accuracy & Agreement | Good agreement with dPCR at medium/high concentrations. | Good agreement with qPCR at medium/high concentrations. |
| Multiplexing Suitability | Prone to competition between targets, reducing accuracy in multiplex assays [8]. | More suitable for multiplex analyses due to reduced target competition [8]. |
Application 2: Copy Number Variation (CNV) Analysis
CNV analysis requires precise measurement of gene dosage differences. Research shows that dPCR offers distinct advantages for this application, particularly when small fold-changes need to be reliably distinguished.
Table 3: Performance comparison for Copy Number Variation (CNV) analysis.
| Parameter | qPCR Performance | dPCR Performance |
|---|---|---|
| Precision | Good precision, but limited by the standard curve and Cq variability [55]. | Superior precision, enabling measurement of smaller fold-changes [55]. |
| Accuracy in GMO Quantification | Accurate, but prone to inhibitors and requires a standard curve for absolute quantification [50]. | High accuracy; duplex dPCR methods validated for GMO quantification were equivalent to singleplex qPCR and less sensitive to inhibitors [50]. |
| Data Normalization | Requires one or more stable reference genes for normalization, which can introduce variability [56]. | Absolute quantification reduces or eliminates the need for reference gene normalization [45] [50]. |
| Inhibition Resistance | Standard curve-based quantification is more affected by inhibitors present in the sample [50]. | Partitioning reduces the effect of inhibitors, providing more robust results in complex samples [50]. |
Experimental Protocols for Key Studies
This protocol describes the method used to generate the performance data in Table 2.
- 1. Sample Collection and DNA Extraction: Subgingival plaque is collected with absorbent paper points from periodontal pockets and stored in transport fluid. Genomic DNA is extracted using a commercial kit (e.g., QIAamp DNA Mini Kit, Qiagen).
- 2. dPCR Reaction Setup:
- Reaction Volume: 40 µL.
- Reagents: 10 µL of sample DNA, 10 µL of 4× Probe PCR Master Mix, primers and probes at optimized concentrations (e.g., 0.4 µM and 0.2 µM, respectively), nuclease-free water.
- Restriction Enzyme: 0.025 U/µL of Anza 52 PvuII is added to reduce viscosity and improve DNA accessibility.
- 3. Partitioning and Thermocycling: The reaction mixture is loaded into a nanoplate (e.g., QIAcuity Nanoplate 26k) and placed in an integrated dPCR instrument (e.g., QIAcuity Four). The instrument performs partitioning into ~26,000 partitions, followed by thermocycling: 2 min at 95°C, then 45 cycles of 15 s at 95°C and 1 min at 58°C.
- 4. Imaging and Analysis: After PCR, the plate is imaged on different fluorescent channels for each target. Data is analyzed with dedicated software (e.g., QIAcuity Software Suite) which applies Poisson statistics to calculate the absolute concentration of each bacterial target.
This protocol was used for the CNV-related analysis of genetically modified organisms, as cited in Table 3.
- 1. DNA Extraction from Reference Materials: DNA is extracted from Certified Reference Materials (CRMs) using a standardized kit (e.g., RSC PureFood GMO kit) or a CTAB-based method.
- 2. Sample Preparation for GM Levels: Different GMO percentage levels (e.g., 0.1%, 0.5%, 2%) are prepared by mixing GM and non-GM materials based on the absolute copy number of a reference gene (e.g., lectin) measured by dPCR.
- 3. dPCR Analysis on Two Platforms:
- Bio-Rad QX200 (Droplet-based): A 20µL reaction mix is partitioned into ~20,000 nanodroplets using a droplet generator. After thermocycling on a conventional thermal cycler, droplets are read in a droplet reader.
- Qiagen QIAcuity (Nanoplate-based): A reaction mix is loaded into a 26k-nanoplate. The integrated instrument performs partitioning, thermocycling, and imaging in a single system.
- 4. Data Analysis and Validation: Data from both platforms are analyzed using their respective software (QX Manager, QIAcuity Software Suite). Validation parameters like dynamic range, linearity, limit of quantification, and accuracy are assessed against acceptance criteria from relevant guidance documents.
Workflow Diagram: dPCR vs. qPCR
The diagram below illustrates the key procedural and analytical differences between qPCR and dPCR workflows, highlighting the steps that contribute to their distinct performance characteristics.
The Scientist's Toolkit
Successful implementation of the protocols and applications discussed above requires specific reagents and instruments. The following table details key research solutions for a typical dPCR setup for pathogen detection or CNV analysis.
Table 4: Essential research reagents and solutions for dPCR applications.
| Item | Function/Benefit | Example(s) |
|---|---|---|
| dPCR Instrument | Partitions the sample, performs thermocycling, and detects fluorescence signals. Choice depends on partitioning technology (droplet vs. nanoplate). | QIAcuity One/Four (QIAGEN), QX200 Droplet Digital PCR System (Bio-Rad) [50] [9] [8]. |
| dPCR Master Mix | Optimized buffer, enzymes, and dNTPs for efficient amplification in partitioned reactions. Probe-based kits are common for multiplexing. | QIAcuity Probe PCR Kit (QIAGEN) [8]. |
| Hydrolysis Probes | Provide high specificity for target detection through sequence-specific binding and cleavage (e.g., TaqMan probes). | FAM, HEX/VIC, Cy5-labeled probes for multiplex detection [50] [8]. |
| Restriction Enzymes | Digest long DNA strands to reduce sample viscosity and improve access of primers and probes to the target sequence, enhancing accuracy. | Anza 52 PvuII, HaeIII, EcoRI [9] [8]. |
| Certified Reference Materials (CRMs) | Provide a known, standardized quantity of a target (e.g., GMO content) for method validation and ensuring quantification accuracy [50]. | ERM-BF410dp (10% GMO soybean), MON89788 soybean (AOCS 0906-B2) [50]. |
| Nucleic Acid Extraction Kits | Isolate high-quality, inhibitor-free DNA from complex sample types (e.g., tissue, plasma, plaque). | QIAamp DNA Mini Kit (Qiagen), RSC PureFood GMO kit (Promega) [50] [8]. |
Maximizing Performance: Troubleshooting Common Pitfalls and Optimization Strategies
The analysis of complex biological samples, particularly in liquid biopsy research, is often compromised by the presence of PCR inhibitors. These substances, which can co-purify with nucleic acids from blood, plasma, and other bodily fluids, significantly impair enzyme efficiency and amplification reliability, leading to inaccurate quantification results. Digital PCR (dPCR) has emerged as a powerful alternative to quantitative real-time PCR (qPCR) due to its enhanced resilience to such inhibitors. This guide provides a systematic comparison of the inhibitory tolerance of dPCR versus qPCR, underpinned by experimental data and detailed methodologies, to inform researchers and drug development professionals in their analytical choices.
The fundamental difference in how qPCR and dPCR handle inhibition stems from their core principles. In qPCR, inhibitors affect the amplification efficiency throughout the reaction, causing a delay in the cycle threshold (Ct) and resulting in an underestimation of the target concentration [8]. In contrast, dPCR partitions the sample into thousands of individual reactions. While inhibitors may still completely prevent amplification in a subset of these partitions, other partitions, which contain no or lower levels of inhibitors, will amplify successfully. The absolute quantification is then based on counting the positive partitions, a method which is less affected by variations in amplification efficiency [8] [45]. This partitioning confers a significant advantage in clinical applications, such as liquid biopsy, where the accurate detection of low-abundance targets like circulating tumor DNA (ctDNA) is critical for cancer diagnosis, monitoring, and treatment response assessment [1] [36].
Comparative Performance Data: dPCR vs. qPCR
Numerous studies have directly compared the performance of dPCR and qPCR in the context of inhibitor tolerance and sensitivity. The following table summarizes key quantitative findings from recent research.
Table 1: Comparative Analytical Performance of dPCR and qPCR
| Performance Metric | dPCR Performance | qPCR Performance | Experimental Context |
|---|---|---|---|
| Precision (Intra-assay Variability) | Median CV: 4.5% [8] | Higher than dPCR (p=0.020) [8] | Multiplex detection of periodontal pathobionts [8] |
| Sensitivity for Low-Abundance Targets | Superior detection of low bacterial loads; identified qPCR false negatives [8] | Underestimation of pathogen prevalence; false negatives at low concentrations [8] | Analysis of subgingival plaque samples [8] |
| Detection of Mutations in ctDNA | Higher detection rate (100% for EGFR; 86.4% for RAS) [21] | Lower detection rate (58.8% for EGFR; 72.7% for RAS) [21] | Liquid biopsy samples from lung and colorectal cancer patients [21] |
| Impact of Inhibition on Quantification | Robust; quantification less affected by sample inhibitors due to endpoint detection [8] [45] | Susceptible; relies on amplification efficiency for Ct value, which is impaired by inhibitors [8] | General principle and observation from clinical sample analysis [8] [45] |
The data consistently demonstrate dPCR's advantages in challenging scenarios. Its partitioning-based nature provides greater precision and reliability for quantifying targets in samples where inhibitors are a concern, making it particularly suited for liquid biopsy applications where sensitivity and accuracy are paramount [8] [21] [36].
Experimental Protocols and Workflows
A Representative dPCR Protocol for Liquid Biopsy
The following detailed methodology is adapted from a study comparing dPCR and qPCR for detecting bacterial pathobionts, illustrating a robust dPCR workflow applicable to liquid biopsy analysis [8].
- Sample Preparation and DNA Extraction: Plasma is separated from patient whole blood samples collected in EDTA tubes. Cell-free DNA (cfDNA) is then extracted from the plasma using a commercial kit, such as the QIAamp DNA Mini kit (Qiagen), following the manufacturer's instructions. The eluted cfDNA is stored at -20°C until analysis.
- dPCR Reaction Setup: The nanoplate-based microfluidic dPCR assay is performed. A 40 μL reaction mixture is prepared containing:
- 10 μL of sample cfDNA
- 10 μL of 4× Probe PCR Master Mix
- Target-specific primers and double-quenched hydrolysis probes at optimized concentrations (e.g., 0.4 μM and 0.2 μM, respectively)
- A restriction enzyme (e.g., Anza 52 PvuII at 0.025 U/μL) to digest longer DNA fragments and improve access to the target sequence [8].
- Partitioning and Thermocycling: The reaction mixture is loaded into a nanoplate (e.g., QIAcuity Nanoplate 26k). The instrument then automatically partitions each sample into approximately 26,000 nanoscale chambers. Thermocycling is performed with conditions such as: initial activation at 95°C for 2 minutes, followed by 45 cycles of denaturation at 95°C for 15 seconds and annealing/extension at 58°C for 1 minute.
- Endpoint Fluorescence Imaging and Analysis: After amplification, the nanoplate is imaged using a fluorescence scanner. Each partition is analyzed for fluorescence signal in specific channels (e.g., FAM, HEX). The software counts the positive and negative partitions, and the absolute concentration of the target (copies/μL) is calculated automatically based on Poisson statistics [8].
Comparative Experimental Workflow
The diagram below illustrates the core difference between the two technologies when facing PCR inhibitors, explaining dPCR's superior tolerance.
The Scientist's Toolkit: Essential Reagents and Materials
Successful implementation of a dPCR assay, especially for inhibitor-prone samples like liquid biopsies, requires careful selection of reagents and materials. The following table lists key solutions and their functions.
Table 2: Key Research Reagent Solutions for dPCR in Liquid Biopsy
| Reagent / Material | Function / Role in Overcoming Inhibition | Example Product |
|---|---|---|
| dPCR Master Mix | Optimized buffer chemistry and polymerase enhance resistance to inhibitors commonly found in blood/plasma (e.g., heparin, EDTA). | QIAcuity Probe PCR Kit [8]; Bio-Rad ddPCR Supermix for Probes [57] |
| Restriction Enzymes | Digest long genomic DNA to improve access to the shorter cfDNA target, increasing quantification accuracy and consistency. | Anza 52 PvuII [8]; HaeIII [9] |
| Hydrolysis Probes | Provide high specificity for target detection (e.g., mutant alleles in ctDNA), reducing false positives. Double-quenching improves signal-to-noise. | Target-specific double-quenched probes [8] |
| Nanoplate or Cartridge | Microfluidic device that creates thousands of partitions for absolute quantification without the need for a standard curve. | QIAcuity Nanoplate 26k [8]; Bio-Rad QX200 Droplet Generator Cartridge [9] |
The evidence from comparative studies and underlying technological principles firmly establishes digital PCR as a superior method for nucleic acid quantification in the presence of PCR inhibitors. Its partitioning approach provides greater robustness, precision, and sensitivity compared to qPCR, which remains susceptible to amplification efficiency shifts caused by inhibitory substances. For researchers in liquid biopsy and drug development, where the accurate measurement of low-abundance targets in complex matrices like blood is non-negotiable, dPCR offers a reliable and powerful solution that can overcome the critical challenge of inhibition, thereby enabling more confident diagnostic and therapeutic decisions.
In the evolving landscape of molecular diagnostics for liquid biopsy research, digital PCR (dPCR) has emerged as a powerful tool for absolute nucleic acid quantification, offering significant advantages over quantitative PCR (qPCR) in sensitivity, precision, and tolerance to inhibitors [8]. The fundamental principle underlying dPCR's superior performance lies in its partitioning technology, which divides the reaction mixture into thousands of individual partitions, enabling target molecule counting via Poisson statistics [9]. However, a critical yet often overlooked factor that substantially influences dPCR efficiency and precision is the application of restriction enzymes during assay preparation.
The integration of restriction enzymes addresses a key challenge in dPCR: ensuring the complete separation of individual DNA molecules into partitions, particularly for complex genomic targets or samples with potential secondary structures that might impede efficient partitioning [58]. By cleaving DNA at specific recognition sites, restriction enzymes reduce fragment size and disrupt DNA secondary structures, facilitating more random and efficient distribution of target molecules across partitions [59]. This process directly impacts the fundamental Poisson distribution assumption underlying dPCR quantification, thereby affecting the accuracy and precision of final results.
This article examines how restriction enzyme selection and implementation impact assay precision across dPCR platforms, providing direct comparisons with qPCR methodologies. We present experimental data demonstrating how strategic enzyme use enhances performance in liquid biopsy applications, including circulating tumor DNA (ctDNA) detection and microbial quantification, offering researchers evidence-based protocols for method optimization.
Comparative Platform Performance: dPCR vs. qPCR
Before examining the specific role of restriction enzymes, it is essential to understand the fundamental performance differences between dPCR and qPCR that make such optimization valuable. Multiple comparative studies have consistently demonstrated dPCR's advantages in key performance metrics relevant to liquid biopsy research.
Table 1: Performance Comparison of dPCR and qPCR Across Applications
| Application Area | Performance Metric | dPCR Performance | qPCR Performance | Reference |
|---|---|---|---|---|
| Viral Load Detection (IBV) | Sensitivity | Higher sensitivity | Lower sensitivity | [7] |
| Viral Load Detection (IBV) | Precision | Higher precision | Lower precision | [7] |
| Periodontal Pathobiont Quantification | Intra-assay Variability (CV%) | 4.5% (median) | Higher than dPCR | [8] |
| Periodontal Pathobiont Quantification | Low Abundance Target Detection | Superior detection | False negatives at low concentrations | [8] |
| HPV-Associated Cancer Detection | Diagnostic Sensitivity | Superior to qPCR (ddPCR) | Lower than ddPCR and NGS | [20] [23] |
| Copy Number Variation (DEFA1A3) | Concordance with PFGE (Gold Standard) | 95% | 60% | [31] |
| Copy Number Variation (DEFA1A3) | Correlation with PFGE | r = 0.90 | r = 0.57 | [31] |
| General Nucleic Acid Quantification | Measurement Variability | 2.3% CV (Crystal dPCR) | 5.0% CV | [29] |
The tabulated data reveals a consistent trend across diverse application domains. dPCR demonstrates superior sensitivity, particularly for low-abundance targets that are critical in liquid biopsy applications where analyte concentration is often minimal [8]. This enhanced sensitivity stems from dPCR's partitioning approach, which reduces background noise and enables detection of rare mutations or pathogens present at very low frequencies [7]. The technology's improved precision, evidenced by lower coefficients of variation, provides greater confidence in quantitative results, especially important for monitoring disease progression or treatment response [29] [31].
In clinical diagnostics, these technical advantages translate to improved detection capabilities. For HPV-associated cancers, droplet digital PCR (ddPCR) demonstrated significantly greater sensitivity for detecting circulating tumor HPV DNA compared to qPCR, with next-generation sequencing (NGS) showing the highest sensitivity overall [20] [23]. This enhanced detection sensitivity directly impacts clinical decision-making, particularly for early cancer detection and minimal residual disease monitoring.
For copy number variation analysis, ddPCR showed remarkable concordance (95%) with pulsed-field gel electrophoresis (PFGE), considered a gold standard method, while qPCR correlated only moderately (r = 0.57) [31]. The regression analysis revealed that qPCR consistently underestimated copy numbers (Y = 0.8889×), whereas ddPCR showed nearly perfect 1:1 agreement with PFGE (Y = 0.9953×) [31]. This accuracy at higher copy numbers addresses a critical qPCR limitation where the copy-fold relationship deteriorates with increasing copy number, leading to compounded errors and reduced reproducibility [31].
The Critical Role of Restriction Enzymes in dPCR Precision
Restriction enzymes serve as crucial tools for optimizing dPCR assays, with enzyme selection directly impacting measurement precision and accuracy. These enzymes enhance dPCR performance through several mechanisms: fragmenting large DNA molecules to improve partitioning efficiency, disrupting secondary structures that impede amplification, and increasing template accessibility for primers and probes [58].
Experimental Evidence of Enzyme-Specific Effects on Precision
A comprehensive study comparing QX200 droplet digital PCR (ddPCR) and QIAcuity One nanoplate digital PCR (ndPCR) systems quantified the dramatic impact of restriction enzyme selection on measurement precision using DNA from Paramecium tetraurelia cells [9]. The research evaluated two restriction enzymes, HaeIII and EcoRI, across varying cell inputs.
Table 2: Impact of Restriction Enzyme Selection on dPCR Precision (Coefficient of Variation %)
| Cell Numbers | ddPCR with EcoRI (%CV) | ddPCR with HaeIII (%CV) | ndPCR with EcoRI (%CV) | ndPCR with HaeIII (%CV) |
|---|---|---|---|---|
| 10 cells | 62.1 | <5 | 27.7 | 14.6 |
| 50 cells | 34.8 | <5 | 12.4 | 3.8 |
| 100 cells | 2.5 | <5 | 0.6 | 1.6 |
| 500 cells | 14.3 | <5 | 5.2 | 2.1 |
The data reveals striking platform-specific and enzyme-dependent effects on precision. For the QX200 ddPCR system, EcoRI usage resulted in highly variable precision (CV% range: 2.5%-62.1%), with particularly poor performance at lower cell inputs [9]. In contrast, HaeIII implementation dramatically improved precision, maintaining CV% below 5% across all cell concentrations [9]. This substantial improvement highlights how enzyme selection can determine assay success, especially for samples with limited target availability common in liquid biopsy applications.
The QIAcuity ndPCR system demonstrated better overall tolerance to enzyme selection, though HaeIII still provided superior precision, particularly at lower cell inputs [9]. The differential effect between platforms suggests that partitioning methodology influences enzyme efficacy, with droplet-based systems potentially benefiting more from enzymatic digestion than nanoplate-based systems.
Restriction Enzymes in Methylation-Sensitive dPCR Applications
Beyond improving partitioning efficiency, restriction enzymes enable specialized dPCR applications such as methylation analysis through methylation-sensitive restriction enzyme (MSRE) approaches. The MSRE-ddPCR method developed for analyzing DNA methylation hotspots in the SLC22A17 gene demonstrates how restriction enzymes can expand dPCR's application scope while maintaining precision in challenging samples [58].
This innovative approach combines MSRE digestion with ddPCR in a one-tube method, incorporating an exogenous methylation sequence as a control for evaluating assay efficiency and data normalization [58]. The method demonstrated sufficient sensitivity for analyzing low DNA quantities (as little as 0.651 ng) from various biological matrices, including serum and formalin-fixed paraffin-embedded (FFPE) tissues [58]. Compared to conventional bisulfite conversion methods, which cause substantial DNA fragmentation, the MSRE-ddPCR approach preserves DNA quality while enabling methylation-specific analysis, making it particularly valuable for liquid biopsy applications where sample material is often limited and of variable quality.
Experimental Protocols for Restriction Enzyme Integration
Standard Restriction Enzyme Protocol for dPCR
Based on the methodologies described in the cited research, the following protocol provides a standardized approach for integrating restriction enzymes into dPCR workflows:
Reagents and Equipment:
- Restriction enzyme (e.g., HaeIII, EcoRI, or PvuII) with appropriate buffer
- dPCR master mix (platform-specific)
- Sequence-specific primers and probes
- Template DNA
- Nuclease-free water
- Thermal cycler
- dPCR instrument (e.g., QX200 ddPCR system or QIAcuity One)
Procedure:
- Reaction Mixture Assembly: Combine the following components in a microcentrifuge tube:
Partitioning and Amplification:
- Transfer the reaction mixture to the appropriate partitioning device (nanoplate or droplet generator)
- Perform partitioning according to manufacturer instructions
- Execute thermal cycling with the following conditions:
- Initial enzyme activation: 2 min at 95°C
- 45 amplification cycles of:
- Denaturation: 15 s at 95°C
- Annealing/Extension: 1 min at 58°C [8]
Signal Detection and Analysis:
- Read partitions using the appropriate detection system (imaging for nanoplate-based systems, droplet reading for droplet-based systems)
- Analyze data using manufacturer software with Poisson correction
Figure 1: Workflow for Restriction Enzyme-Enhanced dPCR Analysis
Methylation-Sensitive Restriction Enzyme dPCR (MSRE-ddPCR) Protocol
For methylation analysis, the following specialized protocol has been developed and validated:
Reagents and Equipment:
- Methylation-sensitive restriction enzymes (e.g., HpaII, AatII, ClaI)
- dPCR master mix
- Target-specific primers and probes
- Exogenous methylated control DNA (spike-in template)
- DNA samples (including low-quality/quantity samples from serum or FFPE tissues)
Procedure:
- MSRE-ddPCR Reaction Setup:
- Combine in a single tube:
- dPCR master mix
- Primers and probes for target sequence
- Methylation-sensitive restriction enzyme
- Exogenous methylated control DNA
- Sample DNA
- Adjust to final volume with nuclease-free water [58]
- Combine in a single tube:
One-Tube Digestion and Amplification:
- Perform MSRE reaction directly in the dPCR mix before amplification
- Conduct thermal cycling with platform-specific parameters
- The methylated control serves as digestion efficiency control, eliminating need for separate restriction enzyme unaffected by methylation [58]
Data Analysis:
- Calculate methylation percentage based on positive partitions
- Normalize using the exogenous methylated control
- Apply Poisson statistics for absolute quantification
The MSRE-ddPCR method's key advantage is enabling methylation analysis without bisulfite conversion, which causes substantial DNA fragmentation and compromises analysis of limited samples [58]. This preservation of DNA integrity makes MSRE-ddPCR particularly suitable for liquid biopsy applications where cell-free DNA is often degraded and scarce.
The Scientist's Toolkit: Essential Research Reagents
Successful implementation of restriction enzyme-enhanced dPCR requires specific reagents optimized for each application. The following table details essential components and their functions based on the cited experimental data.
Table 3: Essential Research Reagents for Restriction Enzyme dPCR Applications
| Reagent Category | Specific Examples | Function & Importance | Application Notes |
|---|---|---|---|
| Restriction Enzymes | HaeIII, PvuII, EcoRI | Fragment DNA to improve partitioning efficiency; crucial for precision | HaeIII provided superior precision for ddPCR [9]; PvuII used in multiplex dPCR [8] |
| dPCR Master Mix | Supermix for Probes (no dUTP) | Provides optimal reaction environment; critical for accuracy | Choice significantly affects accuracy across working range [59] |
| Methylation-Sensitive Enzymes | HpaII, AatII, ClaI | Enable methylation status analysis without bisulfite conversion | Digestion efficiency indicates methylation status; preserves DNA quality [58] |
| Exogenous Methylated Control | Custom methylated sequences | Normalization control for MSRE-ddPCR; assesses digestion efficiency | Eliminates need for isoschizomer enzymes in standard MSRE [58] |
| Platform-Specific Reagents | QIAcuity Nanoplate 26k, droplet generation oil | Enable partitioning fundamental to dPCR | Partition number impacts precision; pooling wells reduces variability [29] |
The integration of restriction enzymes represents a critical optimization step for maximizing dPCR performance in liquid biopsy research. Experimental evidence demonstrates that strategic enzyme selection, particularly HaeIII for droplet-based systems, dramatically improves measurement precision, especially at low target concentrations frequently encountered in clinical samples [9]. The development of specialized applications like MSRE-ddPCR further expands dPCR's utility for methylation analysis while preserving sample integrity [58].
When comparing detection platforms, dPCR consistently outperforms qPCR in sensitivity, precision, and accuracy for absolute quantification [7] [8] [31]. These advantages are particularly pronounced for liquid biopsy applications requiring detection of rare targets in complex backgrounds. The integration of restriction enzymes further amplifies these advantages by ensuring efficient partitioning and reducing variability.
As liquid biopsy continues to transform clinical diagnostics and therapeutic monitoring, researchers should consider restriction enzyme integration as a essential component of dPCR assay development. The protocols and data presented here provide a foundation for optimizing these assays to achieve the precision required for detecting minimal residual disease, monitoring treatment response, and other applications where quantitative accuracy is paramount.
In molecular biology research, particularly in the transformative field of liquid biopsy, the accurate detection of low-abundance nucleic acid targets is a paramount challenge. Liquid biopsy, which involves analyzing circulating tumor DNA (ctDNA) or other biomarkers from a simple blood draw, often requires identifying a single mutant DNA molecule among a background of thousands of wild-type sequences [60] [43]. This detection is crucial for early cancer diagnosis, monitoring treatment response, and detecting residual disease. The limitations of traditional quantitative PCR (qPCR) become apparent in these scenarios, where its dependence on standard curves and susceptibility to inhibitors can compromise data accuracy [6] [35]. Digital PCR (dPCR) represents a technological evolution that addresses these limitations through a fundamentally different approach to nucleic acid quantification. By partitioning samples into thousands of individual reactions, dPCR enables absolute quantification of target molecules without requiring external standards, offering researchers a powerful tool for pushing the boundaries of detection sensitivity in liquid biopsy and other applications involving scarce genetic material [45] [43].
Fundamental Technology Comparison: qPCR vs. dPCR
Quantitative PCR (qPCR), also known as real-time PCR, has served as the gold standard for nucleic acid quantification for decades. This technique measures the amplification of DNA as it occurs in real-time, using fluorescent dyes or probes to detect the target during the exponential phase of amplification. The quantification cycle (Cq), the point at which the fluorescence crosses a predefined threshold, provides an indirect measure of the initial DNA amount. However, this measurement is relative, requiring comparison to standard curves prepared from samples of known concentration, which introduces variability and limits precision [45] [35].
Digital PCR (dPCR) adopts a fundamentally different approach. The technique involves partitioning a PCR mixture into thousands (or millions) of individual nanoliter-scale reactions, where each partition effectively contains either zero, one, or a few target molecules. Following end-point PCR amplification, each partition is analyzed as positive or negative for the target. The absolute concentration of the target in the original sample is then calculated directly using Poisson statistics, based on the ratio of positive to negative partitions, eliminating the need for standard curves [45] [43].
The following diagram illustrates the core procedural differences between these two technologies:
Direct Performance Comparison at Low Target Concentrations
Sensitivity and Detection Limits
Multiple studies have systematically compared the sensitivity of qPCR and dPCR for detecting low-abundance targets. A 2024 meta-analysis examining circulating tumor HPV DNA (ctHPVDNA) detection across 36 studies found significant differences in sensitivity between platforms. Digital PCR demonstrated substantially higher sensitivity (0.81; 95% CI, 0.73–0.87) compared to qPCR (0.51; 95% CI, 0.37–0.64) when detecting viral DNA in patient blood samples [61]. Next-generation sequencing (NGS) showed the highest sensitivity (0.94; 95% CI, 0.88–0.97), though with typically higher cost and complexity [61].
In environmental DNA (eDNA) research, where detecting rare species depends on identifying minimal genetic material, ddPCR showed superior performance for low concentration targets (<1 copy/μL). The technology provided higher detection probability and quantification precision compared to qPCR, making it particularly valuable for monitoring rare aquatic species [62]. Similarly, in a study detecting infectious bronchitis virus (IBV), dPCR demonstrated higher sensitivity despite qPCR having a wider dynamic quantification range [7].
Precision and Reproducibility
The precision of nucleic acid quantification—particularly critical for low-concentration targets—significantly differs between the two technologies. A 2024 study comparing respiratory virus quantification found dPCR demonstrated "superior accuracy" and "greater consistency and precision" than real-time RT-PCR, especially when quantifying intermediate viral levels [6]. This enhanced precision is largely attributed to dPCR's resistance to amplification efficiency variations and its ability to provide absolute quantification without reference standards [7].
For research requiring precise measurement of minute concentration changes—such as monitoring residual disease or subtle gene expression differences—dPCR's reduced variability offers a distinct advantage. A direct comparison study noted that for sample/target combinations with low nucleic acid levels (Cq ≥ 29) and/or variable contaminants, "ddPCR technology will produce more precise, reproducible and statistically significant results required for publication quality data" [35].
Resistance to PCR Inhibitors
Complex biological samples common in liquid biopsy (plasma, serum) and environmental research often contain substances that inhibit PCR amplification. dPCR demonstrates markedly greater tolerance to these inhibitors compared to qPCR. This robustness stems from two key factors: the partitioning process naturally dilutes inhibitory substances across thousands of reactions, and the endpoint quantification method is less affected by changes in amplification efficiency [63].
A direct comparison study demonstrated this advantage by spiking samples with reverse transcription mix, a common source of PCR inhibitors. While qPCR showed significant Cq value shifts and efficiency drops (from 89.6% to 67.1%), ddPCR maintained consistent quantification across the same samples despite the contaminants [35]. This resilience makes dPCR particularly valuable for analyzing challenging sample types such as crude environmental samples, formalin-fixed paraffin-embedded (FFPE) tissues, and liquid biopsy specimens containing PCR inhibitors.
Table 1: Performance Comparison of qPCR vs. dPCR for Low Concentration Targets
| Parameter | qPCR | dPCR | Key Supporting Evidence |
|---|---|---|---|
| Sensitivity | 0.51 (95% CI, 0.37–0.64) for ctHPVDNA detection [61] | 0.81 (95% CI, 0.73–0.87) for ctHPVDNA detection [61] | Meta-analysis of 36 studies (2024) |
| Detection Limit | Limited by standard curve and inhibition | 1 mutant in 180,000 wild-type molecules (EGFR L858R assay) [60] | Cancer mutation detection study |
| Precision at Low Concentration | Higher variability (CV > 15% common) [35] | Lower variability (<10% CV) for targets <1 copy/μL [62] | eDNA quantification study |
| Inhibitor Tolerance | Susceptible to enzyme inhibition | Resistant due to partitioning and endpoint detection [63] [35] | Contamination spiking experiment |
| Quantification Method | Relative (requires standard curve) | Absolute (Poisson statistics) [45] [43] | Fundamental technology difference |
Experimental Protocols for Sensitivity Assessment
Determining Limit of Detection (LOD) for Rare Mutation Detection
For researchers validating dPCR assays for low-frequency variant detection, such as in liquid biopsy applications, the following protocol adapted from detailed LOD characterization studies provides a rigorous framework [60]:
Sample Preparation:
- Use wild-type genomic DNA (e.g., G3041, Promega) as background matrix
- Prepare mutant DNA templates via synthetic GeneArt plasmid templates linearized by restriction enzyme digestion
- Create mutation titration series with variant allele frequencies (VAF) ranging from 0.5% to 0.0005% (1:200 to 1:200,000)
- Include sufficient wild-type-only controls (N=58-71) to accurately assess false-positive rates
Reaction Setup:
- Prepare 50μL reactions containing approximately 20,000 copies/μL of genomic DNA (~3.3μg per reaction)
- Use optimized primer and probe concentrations (typically 0.9μM and 0.2μM respectively)
- Incorporate appropriate master mix with droplet stabilizer for partitioning-based systems
Data Analysis:
- Process raw data with platform-specific software (QIAcuity Suite, RainDrop Analysis Suite, etc.)
- Calculate false-positive rates from wild-type-only controls
- Determine LOD using statistical approaches that account for background signal and confidence levels
- For the EGFR L858R assay, this approach achieved an LOD of 1 mutant in 180,000 wild-type molecules analyzing 3.3μg of genomic DNA [60]
Protocol for Comparative Sensitivity Analysis
When directly comparing qPCR and dPCR sensitivity for specific applications, this protocol adapted from multiple studies ensures fair and interpretable results [6] [35]:
Sample Preparation:
- Use identical synthetic DNA samples or extracted nucleic acids from target samples
- Create a dilution series spanning the expected concentration range (e.g., 10⁻³ to 10⁶ copies/μL)
- For inhibition studies, spike identical samples with known PCR inhibitors (e.g., reverse transcription mix, hematin, IgG)
- Divide each sample into identical aliquots for parallel qPCR and dPCR analysis
qPCR Analysis:
- Run samples in triplicate on standard qPCR platforms (e.g., CFX96, QuantStudio)
- Include standard curves with known concentrations covering the full dynamic range
- Record Cq values and calculate concentrations from standard curves
- Assess reaction efficiency (90-110% considered acceptable)
dPCR Analysis:
- Use partitioned systems (droplet or nanowell-based) according to manufacturer protocols
- For droplet-based systems, target ~20,000 droplets per reaction for statistical robustness
- Perform endpoint PCR amplification with identical primer/probe sets as qPCR
- Analyze using platform-specific software for absolute quantification
Data Comparison:
- Compare sensitivity as the lowest concentration yielding consistent detection
- Assess precision via coefficient of variation between replicates
- For inhibition tolerance, compare quantification changes between spiked and clean samples
Mechanisms Underlying Sensitivity Advantages
The superior sensitivity of dPCR for low-concentration targets stems from fundamental methodological differences that can be visualized in the following detection mechanism diagram:
The partitioning process in dPCR provides three key advantages for low-concentration detection. First, by separating the sample into thousands of individual reactions, it effectively concentrates the target molecules, making rare sequences easier to detect against the background. Second, it dilutes PCR inhibitors across partitions, reducing their impact on amplification efficiency—a significant advantage for complex biological samples [63]. Third, the binary nature of endpoint detection (positive/negative calls) eliminates dependence on amplification efficiency and enables absolute quantification through Poisson statistics, providing more reliable data for scarce targets [43] [35].
Essential Research Reagent Solutions
Table 2: Key Reagents and Systems for Sensitive dPCR Applications
| Reagent/System Category | Specific Examples | Function in Sensitivity Enhancement |
|---|---|---|
| dPCR Platforms | QIAcuity (Qiagen), QuantStudio Absolute Q (Thermo Fisher), RainDrop System | Provide partitioning mechanism and fluorescence detection for absolute quantification [45] [6] [43] |
| Nucleic Acid Extraction Kits | KingFisher Flex System, MagMax Viral/Pathogen Kit, DNeasy PowerWater Sterivex Kit | High-efficiency recovery of intact nucleic acids from complex samples [6] [62] |
| Specialized Master Mixes | TaqMan Genotyping Master Mix, ddPCR Supermixes | Optimized enzyme formulations with enhanced resistance to inhibitors [60] [35] |
| Assay Design Tools | TaqMan Design Tool, PrimeTime Design Tools | Bioinformatics optimization of primers/probes for specific target sequences [60] |
| Reference Materials | Genomic DNA Controls (e.g., G3041, Promega), Synthetic DNA Templates (e.g., GeneArt) | Standardized materials for assay validation and limit of detection studies [60] |
Application-Specific Recommendations
Liquid Biopsy and Oncology Research
For circulating tumor DNA (ctDNA) analysis in liquid biopsy applications, dPCR is particularly advantageous due to its ability to detect rare mutations against a high background of wild-type DNA. The technology has demonstrated capability to detect EGFR mutations (L858R, T790M) at ratios as low as 1:180,000, making it invaluable for cancer monitoring, treatment response assessment, and early recurrence detection [60] [43]. When analyzing human papillomavirus DNA (ctHPVDNA) in oropharyngeal cancer, ddPCR showed significantly higher detection sensitivity (81%) compared to qPCR (51%) according to a comprehensive meta-analysis [61].
Infectious Disease and Virology
In viral load monitoring, particularly during early infection or treatment response when target concentrations are low, dPCR provides more precise quantification. A 2025 study comparing respiratory virus detection (influenza A/B, RSV, SARS-CoV-2) found dPCR demonstrated "superior accuracy, particularly for high viral loads of influenza A, influenza B, and SARS-CoV-2" [6]. Similarly, for infectious bronchitis virus (IBV) quantification, dPCR showed higher sensitivity and precision compared to qPCR, despite the latter having a wider dynamic range [7].
Environmental DNA and Rare Species Detection
In environmental DNA (eDNA) applications, where detecting rare species depends on identifying minimal genetic material in complex matrices, ddPCR outperforms qPCR, particularly at very low target concentrations (<1 copy/μL) [62]. The partitioning technology's resistance to environmental PCR inhibitors and its ability to provide absolute quantification without standard curves make it particularly suitable for challenging sample types like water, soil, and fecal samples [63] [64].
The strategic selection between qPCR and dPCR technologies fundamentally depends on the specific sensitivity requirements of the research application. For high-throughput analysis of moderate to high concentration targets, qPCR remains a cost-effective and efficient solution. However, for applications demanding the highest sensitivity and precision for low-concentration targets—particularly liquid biopsy, rare mutation detection, viral load monitoring in early infection, and environmental DNA studies—dPCR offers distinct advantages. Its partitioning technology, absolute quantification capability, superior resistance to inhibitors, and exceptional precision at low concentrations make dPCR the emerging gold standard for pushing the boundaries of detection sensitivity in molecular research. As the field advances, researchers should consider implementing both technologies in complementary roles, leveraging the unique strengths of each approach to address specific experimental challenges in sensitivity-critical applications.
Digital PCR (dPCR) represents a significant advancement in nucleic acid quantification by enabling absolute target counting without the need for standard curves. This third-generation PCR technology operates by partitioning a single sample into thousands of individual reactions, with each partition functioning as a separate PCR microreactor. The fundamental principle shared by all dPCR platforms involves distributing DNA molecules across these partitions, amplifying target sequences, and then counting positive versus negative partitions to provide absolute quantification through Poisson statistics [43].
Two principal partitioning methodologies have emerged as the dominant commercial platforms: droplet-based dPCR and chip-based dPCR. While both approaches share the same underlying principle for absolute quantification, they differ significantly in their technical implementation, operational workflows, and performance characteristics. Droplet-based systems (ddPCR) utilize a water-oil emulsion technique to generate thousands of nanoliter-sized droplets, with systems like Bio-Rad's QX200/QX600/QX700 creating approximately 20,000 droplets per sample [65]. In contrast, chip-based systems (cdPCR) employ microfabricated plates containing fixed arrays of microscopic wells, with platforms like QIAGEN's QIAcuity distributing samples across approximately 20,000-26,000 partitions per well [8] [65].
The choice between these technologies carries significant implications for research applications, particularly in liquid biopsy where sensitivity, precision, and workflow efficiency are paramount. This guide provides an objective comparison of both platforms to inform selection decisions for diagnostic development and clinical research.
Technical Specifications and Performance Comparison
Direct Performance Metrics from Experimental Studies
A comprehensive 2025 study directly compared the QX200 droplet-based system (Bio-Rad) with the QIAcuity One nanoplate-based system (QIAGEN) using synthetic oligonucleotides and DNA from Paramecium tetraurelia cells. The research evaluated critical performance parameters including sensitivity, precision, and the impact of experimental conditions such as restriction enzyme selection [9].
Table 1: Comparative Performance Metrics of ddPCR and cdPCR Platforms
| Performance Parameter | Droplet-based dPCR (QX200) | Chip-based dPCR (QIAcuity One) |
|---|---|---|
| Limit of Detection (LOD) | 0.17 copies/µL input (3.31 copies/reaction) | 0.39 copies/µL input (15.60 copies/reaction) |
| Limit of Quantification (LOQ) | 4.26 copies/µL input (85.2 copies/reaction) | 1.35 copies/µL input (54 copies/reaction) |
| Dynamic Range | Demonstrated linearity for 6 orders of magnitude | Demonstrated linearity for 6 orders of magnitude |
| Precision (with EcoRI) | CV: 2.5%-62.1% (varied by cell number) | CV: 0.6%-27.7% (varied by cell number) |
| Precision (with HaeIII) | CV: <5% (all cell numbers) | CV: 1.6%-14.6% (varied by cell number) |
| Partition Number | ~20,000 droplets [65] | ~26,000 partitions [8] |
| Reaction Volume | 20µL reaction volume [9] | 40µL reaction volume [9] |
The data reveals several important patterns. While the droplet-based system demonstrated a marginally better (lower) Limit of Detection, the chip-based system showed a better (lower) Limit of Quantification [9]. Both systems exhibited high precision across most analyses, though restriction enzyme selection significantly impacted reproducibility, particularly for the droplet-based system where HaeIII usage substantially improved precision compared to EcoRI [9].
Platform Workflow and Operational Characteristics
Beyond pure performance metrics, practical operational factors significantly impact platform selection for routine laboratory use.
Table 2: Operational Comparison of ddPCR and cdPCR Workflows
| Operational Factor | Droplet-based dPCR | Chip-based dPCR |
|---|---|---|
| Partitioning Mechanism | Water-oil emulsion droplets | Fixed micro-wells/nanoplates |
| Throughput | Lower throughput on some platforms [66]; newer systems enable 32 samples simultaneously [66] | Generally higher throughput systems available |
| Automation Level | Multiple manual handling steps; droplet transfer risk [67] | Integrated "sample-to-result" automation [65] |
| Cross-Contamination Risk | Higher risk during droplet transfer [67] | Lower risk with closed-channel systems [67] |
| Multiplexing Capability | Limited in traditional systems; newer models detect up to 12 targets [65] | Available for 4-12 targets [65] |
| Hands-on Time | 6-8 hours for complete workflow [65] | Less than 90 minutes for complete workflow [65] |
| GMP/QC Suitability | Extensive regulatory precedence [65] | Emerging compliance features (21 CFR Part 11) [65] |
The workflow differences are substantial, with chip-based systems offering significantly streamlined processes that reduce hands-on time from multiple hours to under 90 minutes [65]. This efficiency advantage makes cdPCR particularly valuable for quality control environments and clinical laboratories processing large sample volumes.
Experimental Protocols for Platform Evaluation
Methodology for Cross-Platform Performance Assessment
The experimental approach used in the 2025 comparative study provides a robust framework for platform evaluation [9]:
Sample Preparation:
- Synthetic oligonucleotides with known concentrations were used for calibration and sensitivity assessment.
- Biological relevance was validated using DNA extracted from varying cell numbers of the ciliate Paramecium tetraurelia (0, 1, 5, 10, 50, and 100 cells).
- Two restriction enzymes (EcoRI and HaeIII) were tested to evaluate their impact on gene copy number quantification, particularly for tandemly repeated genes.
dPCR Reaction Setup:
- Reactions were prepared using manufacturer-recommended master mixes and protocols.
- QX200 ddPCR: 20µL reaction volume following standard droplet generation protocols.
- QIAcuity ndPCR: 40µL reaction volume loaded into nanoplate wells.
- Thermocycling conditions followed platform-specific optimal protocols with end-point fluorescence detection.
Data Analysis:
- Copy numbers were calculated using Poisson statistics applied to positive/negative partition counts.
- Limit of Detection (LOD) was determined as the lowest concentration where positive signals consistently differentiated from background.
- Limit of Quantification (LOQ) was established using a 3rd degree polynomial model based on Akaike Information Criterion (AIC) values.
- Precision was evaluated through coefficient of variation (CV%) across replicate measurements.
Protocol for Multiplexed Pathogen Detection
A separate 2025 study established an optimized protocol for multiplexed detection of periodontal pathobionts using chip-based dPCR, demonstrating methodology for assay development [8]:
Sample Preparation:
- Subgingival plaque samples collected with absorbent paper points.
- DNA extraction using QIAamp DNA Mini kit (Qiagen) following manufacturer's instructions.
- Addition of restriction enzyme (Anza 52 PvuII) to reaction mixture to improve DNA accessibility.
Multiplex dPCR Setup:
- 40µL reaction mixtures containing 10µL sample DNA, 10µL 4× Probe PCR Master Mix, 0.4µM of each primer, 0.2µM of each probe.
- Primers and probes targeting 16S rRNA genes of P. gingivalis, A. actinomycetemcomitans, and F. nucleatum.
- Loading into QIAcuity Nanoplate 26k 24-well plates with automated partitioning.
Thermocycling and Imaging:
- Initial denaturation: 2 min at 95°C
- Amplification: 45 cycles of 15 sec at 95°C + 1 min at 58°C
- Multi-channel fluorescence imaging:
- Green channel (A. actinomycetemcomitans): Threshold 30 RFU, 500 ms exposure
- Yellow channel (P. gingivalis): Threshold 40 RFU, 500 ms exposure
- Crimson channel (F. nucleatum): Threshold 40 RFU, 400 ms exposure
- Data analysis using QIAcuity Software Suite with Volume Precision Factor applied.
Workflow Visualization
Diagram: dPCR Workflow Comparison. Droplet-based systems require multiple manual steps including droplet transfer, increasing contamination risk and hands-on time (6-8 hours). Chip-based systems offer integrated automation with minimal manual intervention and faster turnaround (<90 minutes) [67] [65].
Application in Liquid Biopsy and Clinical Research
Both dPCR platforms offer significant advantages for liquid biopsy applications, where detecting rare mutations against a background of wild-type DNA demands exceptional sensitivity and precision. The absolute quantification capability of dPCR enables precise monitoring of circulating tumor DNA (ctDNA) levels without reference standards, making it invaluable for treatment response monitoring and residual disease detection [43].
In comparative studies, dPCR has consistently demonstrated superior performance for low-abundance targets compared to qPCR. A 2025 analysis of periodontal pathobionts found that dPCR showed lower intra-assay variability (median CV: 4.5%) than qPCR and demonstrated superior sensitivity, particularly for detecting low bacterial loads [8]. The partitioning-based principle of dPCR improves precision, suitability for multiplex analyses, and detection of low-abundant targets within complex clinical samples [8].
For liquid biopsy applications specifically, consider these platform selection factors:
- Rare Allele Detection: Both platforms offer sufficient sensitivity for ctDNA detection, though droplet-based systems may have a slight edge in LOD [9].
- Multiplexing Requirements: Chip-based systems generally offer more advanced multiplexing capabilities (4-12 targets) in a single run [65].
- Workflow Efficiency: For clinical laboratories processing large sample batches, chip-based automation significantly reduces hands-on time [65].
- Regulatory Compliance: Both platforms can be validated for clinical use, though droplet-based systems have longer regulatory track records [65].
Essential Research Reagent Solutions
Table 3: Key Reagents for dPCR Assay Development
| Reagent / Material | Function | Application Notes |
|---|---|---|
| Restriction Enzymes | Improve DNA accessibility for GC-rich targets or tandem repeats | HaeIII demonstrated superior precision vs. EcoRI in comparative studies [9] |
| Probe-based Master Mix | Fluorogenic detection of specific sequences | Essential for multiplex assays; platform-specific formulations available |
| DNA Standard Reference Materials | Assay validation and quality control | Synthetic oligonucleotides with known concentrations recommended [9] |
| Partitioning Oil/Stabilizer | Stable droplet formation (ddPCR) | Critical for preventing droplet coalescence during thermal cycling [43] |
| Nuclease-free Water | Reaction preparation | Quality critical for preventing enzymatic degradation |
| Positive/Negate Controls | Run validation and threshold determination | Should include wild-type and mutant sequences for mutation detection assays |
The comparative analysis reveals that both droplet-based and chip-based dPCR platforms provide excellent sensitivity and precision for absolute nucleic acid quantification. Selection decisions should be guided by specific application requirements:
Choose droplet-based dPCR when:
- Maximum sensitivity (low LOD) is the primary concern
- Working with established assays with extensive historical data
- Budget constraints prioritize reagent costs over personnel time
Choose chip-based dPCR when:
- Workflow efficiency and high-throughput are priorities
- Multiplexing capabilities are required for complex assays
- Minimizing contamination risk in clinical settings is critical
- Rapid turnaround time (<90 minutes) is necessary for clinical decision-making
For liquid biopsy applications specifically, chip-based systems offer practical advantages for clinical implementation due to their streamlined workflows and reduced contamination risk, while both platforms deliver the sensitivity required for rare variant detection. As the technology continues evolving, both platforms are likely to see expanded adoption in clinical diagnostics, particularly for applications requiring absolute quantification of low-abundance targets.
The emergence of liquid biopsy as a minimally invasive tool for cancer research and diagnostics has revolutionized patient monitoring and personalized medicine. This powerful approach analyzes circulating biomarkers, such as circulating tumor DNA (ctDNA), but its reliability hinges on the ability to detect extremely rare mutations amidst a background of wild-type DNA. The choice of detection technology is paramount, with quantitative PCR (qPCR) and digital PCR (dPCR) representing two pivotal methodologies. False positives and false negatives remain significant challenges that can directly impact research conclusions and clinical decisions. This guide provides an objective, data-driven comparison of qPCR and dPCR performance for liquid biopsy research, focusing on technical considerations to optimize reliability.
Fundamental Technology Comparison
qPCR and dPCR differ fundamentally in their approach to nucleic acid quantification, leading to distinct performance characteristics critical for avoiding erroneous results.
- qPCR (Quantitative PCR): This method relies on relative quantification. It monitors PCR amplification in real-time as fluorescence increases with each cycle. The cycle at which the fluorescence crosses a threshold (Cq value) is used to estimate the initial template quantity relative to a standard curve. Since the entire reaction is bulk, rare targets can be masked by more abundant ones, and the results are sensitive to variations in amplification efficiency [12] [44].
- dPCR (Digital PCR): dPCR employs an "divide and conquer" strategy. The sample is partitioned into thousands of individual reactions. After end-point PCR amplification, each partition is analyzed as positive or negative for the target. Absolute quantification is achieved by applying Poisson statistics to the count of positive and negative partitions, without the need for a standard curve. This partitioning enhances tolerance to PCR inhibitors and enables precise quantification of rare targets [53] [12] [68].
The table below summarizes the core technical differences.
Table 1: Fundamental Differences Between qPCR and dPCR
| Feature | Quantitative PCR (qPCR) | Digital PCR (dPCR) |
|---|---|---|
| Quantification Principle | Relative, requires a standard curve | Absolute, no standard curve needed |
| Data Collection | During exponential phase (real-time) | At reaction endpoint |
| Reaction Format | Bulk reaction | Partitioned into thousands of reactions |
| Tolerance to Inhibitors | Lower | Higher [50] [69] |
| Tolerance to PCR Efficiency Variations | Lower; impacts Cq values | Higher; endpoint detection is less affected [12] |
| Key Advantage | Broader dynamic range, high throughput, lower cost per sample | Superior precision and sensitivity for rare targets, absolute quantification |
Comparative Performance Data in Liquid Biopsy Applications
Sensitivity and Specificity
The ability to detect low-abundance mutations (sensitivity) while correctly identifying wild-type sequences (specificity) is crucial for minimizing false negatives and positives in liquid biopsy analysis.
A meta-analysis of ctDNA detection in HPV-associated cancers found that sensitivity was greatest with next-generation sequencing (NGS), followed by dPCR and then qPCR. The specificity, however, was similar across platforms [23]. This indicates that dPCR can reduce false negatives compared to qPCR when target levels are very low.
For infectious disease research, a comparison of qPCR and dPCR for detecting the Infectious Bronitis Virus (IBV) genome found that while qPCR had a wider quantification range, dPCR demonstrated higher sensitivity and superior precision [26]. This enhanced sensitivity is directly applicable to detecting rare ctDNA fragments in a liquid biopsy.
Precision, Accuracy, and Reproducibility
Precision (repeatability) and accuracy (trueness) are fundamental for reliable, reproducible results. dPCR's partitioning method provides a distinct advantage in these areas.
A study developing a ddPCR assay for PD-L1 mRNA expression in blood reported an average intra-run Coefficient of Variation (CV) of 7.44% and an inter-run CV of 7.70%, demonstrating high reproducibility [69]. In a direct comparison, the same study found that dPCR had significantly lower inter-assay CVs (average 9.57%) compared to qPCR using absolute quantification (average 22.6%) [69]. This higher precision makes dPCR more reliable for tracking minimal changes in analyte concentration over time, such as in treatment response monitoring.
A 2025 study comparing two dPCR platforms for gene copy number analysis also highlighted the technology's precision. The research noted that both platforms (nanoplate-based and droplet-based) "yielded high precision across most analyses" and showed a strong linear correlation with increasing cell numbers [9].
Table 2: Summary of Key Performance Metrics from Experimental Studies
| Study Focus | Key Performance Finding | Implication for False Positives/Negatives |
|---|---|---|
| HPV+ Cancer Detection [23] | Sensitivity: NGS > dPCR > qPCR. Specificity was similar. | dPCR reduces false negatives compared to qPCR in ctDNA detection. |
| Viral Genome Quantification [26] | dPCR had higher sensitivity and precision than qPCR. | Improved detection of low-copy targets and more reliable quantification. |
| PD-L1 mRNA Detection [69] | dPCR showed lower inter-assay CV (9.57%) vs. qPCR (22.6%). | Superior reproducibility reduces false trends in longitudinal studies. |
| GMO Quantification [50] | dPCR provides accurate quantification without calibration and is less sensitive to inhibitors. | Reduced false results from matrix effects or suboptimal standard curves. |
Experimental Protocols for Reliable Assay Development
dPCR Assay Development and Validation Workflow
A fit-for-purpose dPCR assay development protocol, as described for PD-L1 mRNA detection, involves several critical steps to ensure reliability [69]:
- Assay Selection and Preliminary Testing: Select and test primer/probe sets (e.g., TaqMan assays) using qPCR to assess linearity and efficiency.
- Reference Gene Validation: Test multiple candidate reference genes to identify one with stable expression that is unaffected by experimental conditions. For example, B2M was rejected as a reference gene in the PD-L1 study because its expression changed significantly upon IFN-γ treatment, whereas GUSB and RPLP0 were stable [69].
- Determine Limits of Blank and Detection:
- Precision Analysis: Perform intra-run (repeatability) and inter-run (reproducibility) experiments to calculate Coefficients of Variation (CV). A well-optimized dPCR assay can achieve CVs below 10% [69].
- Establishing a Baseline: Analyze healthy control samples to establish a baseline or reference range for the biomarker, which is essential for interpreting patient results.
Key Technical Considerations for Optimization
- Input DNA Quality and Quantity: The purity and fragment length of input DNA can affect quantification. Care should be taken to use optimized extraction methods for cell-free DNA, which is typically short-fragmented [53] [2].
- Partitioning Efficiency: The number of successful partitions is critical for accurate Poisson correction. Follow manufacturer guidelines for droplet or nanoplate generation.
- Threshold Setting: Accurate discrimination between positive and negative partitions is a key step in dPCR analysis. Use negative and positive controls to set thresholds consistently and objectively.
The following diagram illustrates the core dPCR workflow and its inherent mechanisms for enhancing reliability.
The Scientist's Toolkit: Essential Reagents and Materials
The following table details key reagents and materials required for implementing dPCR in a liquid biopsy workflow, based on the protocols and applications cited.
Table 3: Research Reagent Solutions for dPCR in Liquid Biopsy
| Item | Function / Description | Considerations for Reliability |
|---|---|---|
| Cell-Free DNA Blood Collection Tubes (e.g., PAXgene, Streck) | Stabilizes nucleated blood cells to prevent genomic DNA contamination and preserve cfDNA profile. | Critical for pre-analytical phase. Prevents false positives from lysed white blood cells [69] [2]. |
| cfDNA Extraction Kits | Isolves circulating free DNA from plasma. | Optimized for short-fragment DNA. High recovery and purity are essential for sensitivity [53]. |
| dPCR Master Mix | Contains DNA polymerase, dNTPs, buffers, and other components essential for PCR. | Use master mixes optimized for the specific dPCR platform (droplet or nanoplate). |
| Sequence-Specific Assays | Primers and fluorescently labelled probes (e.g., TaqMan, HEX, FAM) for target detection. | Must be highly specific to minimize off-target amplification. Multiplexing requires non-overlapping fluorescence channels [69] [12]. |
| Restriction Enzymes | Used to digest long genomic DNA, improving access to the target sequence. | Choice of enzyme (e.g., HaeIII vs. EcoRI) can impact precision, especially in systems with tandem repeats [9]. |
| dPCR Plates/Cartridges | Consumables for sample partitioning (e.g., 96-well nanoplates, droplet generation cartridges). | Ensure integrity and proper storage. The number of partitions per reaction directly impacts precision. |
The choice between qPCR and dPCR for liquid biopsy research is application-dependent. qPCR remains a powerful, cost-effective tool for high-throughput applications where target abundance is not extremely low and maximum sensitivity is not required. Its wider dynamic range is also an advantage in some contexts [26] [12] [44].
However, for applications demanding the highest level of precision, sensitivity, and accuracy—such as detecting rare mutations, monitoring minimal residual disease (MRD), or performing longitudinal studies—dPCR is the superior technology. Its partitioning nature inherently reduces false negatives from low-abundance targets and false positives from amplification artifacts or inhibitor effects [53] [68]. The experimental data consistently shows that dPCR offers enhanced precision and reliability for quantifying nucleic acids in complex biological samples like blood plasma.
As the field advances, dPCR is increasingly seen as a confirmatory and complementary technique to next-generation sequencing (NGS), ideal for validating NGS findings and for frequent monitoring of known biomarkers due to its speed, simplicity, and cost-effectiveness for targeted queries [68]. Future developments will likely focus on increasing multiplexing capabilities, streamlining workflows, and reducing costs, further solidifying its role in the reliable molecular analysis of liquid biopsies.
Data-Driven Decisions: Analytical Performance Comparison and Validation Metrics
Circulating tumor DNA (ctDNA) has emerged as a transformative biomarker in liquid biopsy, enabling non-invasive cancer monitoring, treatment response assessment, and detection of minimal residual disease (MRD). The analytical sensitivity and specificity of ctDNA detection methods are paramount for reliable clinical application, particularly when analyzing trace amounts of tumor-derived DNA against a background of normal cell-free DNA. This guide provides an objective comparison of the performance characteristics of major ctDNA detection technologies, with a specialized focus on the role of digital PCR (dPCR) within the methodological ecosystem. As ctDNA continues to gain traction in precision oncology, understanding the nuanced performance metrics of each platform is essential for researchers and drug development professionals to select the optimal technology for their specific application and research context.
Performance Comparison of ctDNA Detection Methodologies
The choice between ctDNA detection strategies involves trade-offs between sensitivity, specificity, genomic coverage, workflow complexity, and cost. The following comparison synthesizes findings from recent meta-analyses and comparative studies to provide a quantitative overview of methodological performance.
Table 1: Overall Performance of Major ctDNA Detection Strategies
| Detection Method | Typical Sensitivity | Typical Specificity | Key Strengths | Major Limitations |
|---|---|---|---|---|
| Tumor-Informed dPCR | Variable; very high for known targets (VAF ~0.01%) [28] [70] | Very High (up to 0.97) [71] | Ultra-sensitive for tracking specific mutations; cost-effective for few targets [28] | Requires prior tumor sequencing; limited to monitoring known mutations [71] |
| Tumor-Agnostic dPCR | Good (Pre-op: 58.5%) [28] | High (0.93) [71] | No tumor tissue required; faster turnaround [71] | Lower sensitivity for MRD; limited by panel design [71] |
| Tumor-Informed NGS | High in longitudinal monitoring (0.76) [71] | Very High (0.96) [71] | Comprehensive; tracks multiple mutations simultaneously [70] | Complex workflow; higher cost; longer turnaround [71] [70] |
| Tumor-Agnostic NGS | Modest (Pre-op: 36.6%) [28] | Good (0.88) [71] | Broad panel of mutations without tumor tissue [71] | Less sensitive than tumor-informed approaches [71] [28] |
| ctDNA Methylation | 0.655 (Pooled) [72] | 0.902 (Pooled) [72] | Stable epigenetic marker; good for cancer origin detection [72] [73] | Developing technology; requires further validation [72] |
The data reveal that tumor-informed assays generally achieve higher specificity, making them particularly valuable for MRD detection where false positives are a critical concern [71]. Conversely, tumor-agnostic approaches can offer competitive sensitivity in certain settings, such as pre-therapy baseline assessment in advanced cancers [28]. The combination of ctDNA methylation markers with traditional protein biomarkers like CEA has demonstrated enhanced performance, achieving an AUC of 0.9269 in colorectal cancer, underscoring the potential of multi-analyte strategies [72].
Digital PCR in Focus: Platform Comparison and Workflow
Digital PCR (dPCR) provides absolute quantification of nucleic acid targets by partitioning samples into thousands of individual reactions, making it exceptionally suitable for detecting rare mutant alleles in a background of wild-type DNA.
dPCR Platform Performance
A 2023 comparative study analyzed the same liquid biopsy samples from lung and colorectal cancer patients using two different dPCR platforms: droplet digital PCR (ddPCR) and solid dPCR (QIAcuity).
Table 2: Head-to-Head dPCR Platform Performance
| Performance Metric | Droplet dPCR (ddPCR) | Solid dPCR (QIAcuity) |
|---|---|---|
| EGFR Mutation Detection Rate | 58.8% [21] | 100% [21] |
| RAS Mutation Detection Rate | 72.7% [21] | 86.4% [21] |
| Agreement with Tissue (κ) | 0.54 (95% CI, 0.37–0.71) [21] | 0.34 (95% CI, 0.01–0.68) [21] |
| Key Advantage | Established technology; widely validated | Higher sensitivity in mutation detection [21] |
The study noted only moderate agreement between the two dPCR platforms, suggesting that sampling effects or threshold settings may contribute to divergent results [21]. This highlights the importance of consistent protocol implementation when comparing results across different dPCR systems.
Experimental Workflow for dPCR-based ctDNA Detection
The standard protocol for dPCR-based ctDNA detection involves several critical stages, from sample collection to data analysis.
dPCR ctDNA Detection Workflow
The workflow begins with proper blood collection and processing, which is critical for preserving ctDNA integrity. Studies consistently use specialized blood collection tubes (e.g., Streck Cell-Free DNA BCT) and double centrifugation to isolate plasma with minimal cellular contamination [74] [28]. The resulting plasma is then used for cell-free DNA (cfDNA) extraction using commercial kits (e.g., QIAamp Circulating Nucleic Acid Kit), typically yielding 5-10ng/μL of cfDNA from 10mL of blood [74]. For the dPCR reaction, approximately 5ng of cfDNA is loaded into each reaction with probe-based assays specific to the target mutation (e.g., HER2, EGFR, KRAS) and a reference gene [74]. The partitioning step differs by platform, creating either 20,000 droplets (ddPCR) or micro-wells (solid dPCR) [74] [21]. After endpoint PCR amplification, the fluorescence in each partition is read to determine the absolute count of mutant and wild-type alleles, enabling calculation of variant allele frequency (VAF) with a theoretical detection limit as low as 0.01% [28].
Contextual Performance: Application-Specific Considerations
The relative performance of ctDNA detection methods varies significantly depending on the clinical context, disease stage, and application requirements.
Impact of Cancer Stage and Tumor Burden
Tumor burden significantly influences ctDNA detection rates. In a study of 224 advanced breast cancer patients, the sensitivity of dPCR for detecting HER2 amplification increased with disease stage: 37.93% for stage III, 41.67% for stage IV, and 51.61% for recurrent cancer [74]. Specificity showed an inverse relationship, decreasing from 92.68% for stage III to 67.86% for recurrent disease, partly due to increased tumor heterogeneity in advanced stages [74].
Minimal Residual Disease (MRD) Detection
MRD detection represents one of the most challenging applications for ctDNA due to the extremely low VAF of tumor DNA after curative-intent therapy. A 2025 meta-analysis of 3,287 patients with non-small cell lung cancer (NSCLC) demonstrated that tumor-informed assays achieved superior specificity (0.97) compared to tumor-agnostic approaches (0.93) in landmark (single time point) MRD analysis [71]. During longitudinal monitoring, the performance gap narrowed, with tumor-agnostic methods showing modestly higher sensitivity (0.79 vs. 0.76) and AUC (0.91 vs. 0.86) [71].
Detection of Structural Variants
The application of ctDNA analysis extends beyond single-nucleotide variants to include structural variants such as ALK rearrangements. A 2025 meta-analysis of 14 studies found that ctDNA testing for ALK fusions in lung cancer demonstrated a pooled sensitivity of 0.75 and specificity of 0.94 compared to tissue-based testing [75]. This highlights the strong concordance between liquid and tissue biopsy for detecting clinically actionable rearrangements, though with somewhat reduced sensitivity compared to mutation detection.
Successful ctDNA detection requires careful selection of reagents and platforms throughout the analytical process.
Table 3: Essential Research Reagent Solutions for ctDNA Detection
| Reagent Category | Specific Product Examples | Critical Function | Performance Notes |
|---|---|---|---|
| Blood Collection Tubes | Streck Cell-Free DNA BCT [28], PAXgene Blood ccfDNA Tubes [74] | Preserves ctDNA by preventing white blood cell lysis and nuclease activity | Critical for pre-analytical integrity; prevents wild-type DNA background release |
| cfDNA Extraction Kits | QIAamp Circulating Nucleic Acid Kit [74] [28] | Isolves high-quality cfDNA from plasma | Optimized for low-concentration, fragmented nature of ctDNA |
| dPCR Master Mixes | HER2 Amplification Detection Kit [74], ddPCR Supermix [28] | Provides optimized enzymes and buffers for partitioned amplification | Formulated for precise quantification in digital applications |
| Mutation Detection Assays | Custom dPCR assays [28], Commercial EGFR/KRAS tests [21] | Target-specific probes and primers for mutant allele detection | Tumor-informed assays require custom design based on tissue sequencing |
| Reference Assays | Copy number reference genes (e.g., RNase P) [74] | Normalizes for total cfDNA input and extraction efficiency | Essential for accurate quantification and quality control |
The expanding landscape of ctDNA detection technologies offers researchers multiple paths for liquid biopsy analysis, each with distinct performance characteristics. Digital PCR platforms provide excellent sensitivity and specificity for tracking known mutations, particularly in tumor-informed MRD applications, with the practical advantage of lower operational costs compared to NGS [28]. The emerging evidence of moderate agreement between different dPCR systems underscores the need for standardized protocols and platform-specific validation [21]. For research requiring comprehensive genomic assessment or discovery of novel alterations, NGS-based approaches offer broader coverage, though often with reduced sensitivity for rare variants. The choice between tumor-informed and tumor-agnostic strategies represents a fundamental trade-off between performance and practicality, with the optimal approach depending on the specific research question, sample availability, and required detection limits. As ctDNA technologies continue to evolve, multi-modal approaches that leverage the complementary strengths of different platforms may offer the most robust solution for advancing precision oncology research.
In molecular biology and clinical diagnostics, the precision and reproducibility of experimental data are paramount. The comparison between digital PCR (dPCR) and quantitative PCR (qPCR) represents a critical evaluation in the context of liquid biopsy research, where detecting minute quantities of circulating tumor DNA (ctDNA) demands exceptional assay precision. Assay variability is quantitatively assessed through two principal metrics: intra-assay precision (repeatability within a single run) and inter-assay precision (reproducibility across different runs, operators, or laboratories) [76] [77]. These are typically expressed as the Coefficient of Variation (%CV), a dimensionless ratio calculated as (standard deviation / mean) × 100%, which allows for comparison across different measurement scales and concentrations [76] [78].
For bioanalytical methods, general acceptance criteria stipulate that intra-assay %CV should be less than 10%, while inter-assay %CV should be less than 15% [76] [77] [78]. These benchmarks ensure that data is sufficiently reliable for scientific interpretation. In liquid biopsy applications—where detecting low-frequency mutations or small fold-changes is clinically significant—superior precision directly translates to improved detection sensitivity and more reliable clinical decision-making [20] [12]. This guide provides a systematic comparison of how qPCR and dPCR technologies perform against these critical precision metrics, supported by experimental data and detailed methodologies relevant to researchers and drug development professionals.
Fundamental Technological Differences Between qPCR and dPCR
The core difference between qPCR and dPCR lies in their fundamental approaches to nucleic acid quantification. qPCR is a relative quantification method that relies on measuring the amplification cycle (Cq) at which a target's fluorescence crosses a detection threshold. This measurement is relative to a standard curve of known concentrations, making it susceptible to variations in amplification efficiency and inhibitor presence [26] [29] [12]. In contrast, dPCR is an absolute quantification method that employs sample partitioning into thousands of individual reactions, followed by end-point amplification and binary counting of positive versus negative partitions [12]. This approach eliminates the need for standard curves and is less affected by amplification efficiency variations, providing inherently more precise and robust quantification [26] [29].
The partitioning step in dPCR significantly enhances its statistical power for detecting rare events and small concentration differences. Whereas qPCR struggles with mutation rates below 1%, dPCR can reliably detect mutations at frequencies as low as 0.1% [12]. This enhanced sensitivity, combined with superior tolerance to PCR inhibitors due to the "divide and conquer" approach, makes dPCR particularly suited for liquid biopsy applications where target molecules are scarce and sample matrices are complex [26] [12]. The following diagram illustrates the fundamental workflow differences between these two technologies:
Quantitative Comparison of Precision Performance
Direct Precision Metrics from Experimental Studies
Multiple studies have systematically compared the precision performance of dPCR and qPCR technologies. In a carefully controlled experiment comparing Crystal Digital PCR (cdPCR) with qPCR, researchers analyzed 23 technical replicates from a single PCR master mix spiked with human genomic DNA (175 cp/μl of the ALB gene). The results demonstrated that cdPCR exhibited a 2-fold lower measurement variability (%CV = 2.3%) compared to qPCR (%CV = 5.0%) [29]. Furthermore, when cdPCR replicates were pooled (groups of two), the measurement variability decreased to %CV = 1.5%, which was almost 3-fold lower (65.9% reduction) than the average of qPCR duplicates (%CV = 4.4%) [29].
In liquid biopsy applications specifically, a meta-analysis comparing detection methods for circulating tumor HPV DNA (ctHPVDNA) in HPV-associated cancers found that sensitivity was greatest with NGS, followed by ddPCR and then qPCR when pooling all studies [20]. The analysis revealed significantly superior sensitivity for ddPCR compared to qPCR (P < 0.001) and for NGS compared to ddPCR (P = 0.014), while specificities were similar across platforms [20]. This enhanced sensitivity is crucial for liquid biopsy applications where early detection of minimal residual disease depends on identifying scarce tumor DNA fragments in circulation.
Table 1: Comparative Precision Performance of dPCR vs. qPCR
| Performance Metric | qPCR | dPCR | Experimental Context |
|---|---|---|---|
| Measurement Variability (%CV) [29] | 5.0% | 2.3% | 23 technical replicates of ALB gene (175 cp/μl) |
| Pooled Variability (%CV) [29] | 4.4% | 1.5% | Pooling of replicates (cdPCR) vs. duplicate averages (qPCR) |
| Detection Sensitivity [20] | Lower | Higher | Meta-analysis of ctHPVDNA detection in liquid biopsy |
| Mutation Detection Limit [12] | >1% | ≥0.1% | Theoretical capability based on platform characteristics |
| Inhibitor Tolerance [12] | Moderate | High | Due to sample partitioning in dPCR |
Inter-Assay and Inter-Laboratory Reproducibility
Beyond intra-assay precision, inter-assay and inter-laboratory reproducibility are critical for multicenter clinical trials and longitudinal studies. The mycobacterial growth inhibition assay (MGIA) harmonization efforts within the EURIPRED consortium established acceptability thresholds for functional cell-based assays, with inter-site reproducibility <30% CV considered acceptable [79]. While these values are for a different assay type, they reflect the broader challenge of maintaining precision across different laboratory environments.
For PSA testing in clinical diagnostics, a recent evaluation of five latest-generation assays revealed that despite improvements in calibration, inter-assay variability remained clinically relevant [80]. Compared to the Roche reference method, tPSA values varied substantially across platforms, with slopes ranging between 0.78 and 1.04 in Passing-Bablok regression analysis [80]. Specifically, values were on average 20.7% lower by Beckman, 15.2% lower by Abbott, 6.1% lower by Diasorin, and 9.6% higher by Brahms [80]. This variability would result in discrepancies in both sensitivity and specificity for tPSA by at least 14%, depending on the cut-offs applied [80]. This highlights the challenge of maintaining reproducibility across different assay platforms, even with modern calibration standards.
Table 2: Inter-Assay Variability in Real-World Clinical Applications
| Analyte/Assay | Inter-Assay Variability | Impact on Clinical Decision Making |
|---|---|---|
| PSA Tests (5 different assays) [80] | -20.7% to +9.6% difference from reference | ≥14% discrepancy in sensitivity/specificity at clinical cut-offs |
| Mycobacterial Growth Inhibition Assay [79] | <30% CV across sites | Acceptable for functional cell-based assay harmonization |
| ELISA Controls [76] [81] | <15% CV generally acceptable | Ensures reliable plate-to-plate consistency in immunoassays |
Experimental Protocols for Precision Assessment
Standardized Methodology for Intra-Assay CV Determination
The protocol for determining intra-assay precision involves analyzing multiple replicates of the same sample within a single assay run. For dPCR and qPCR applications, this typically requires:
Sample Preparation: Create a homogeneous master mix containing the target nucleic acid at a concentration within the assay's dynamic range. For liquid biopsy applications, this may involve using a synthetic reference material or characterized patient sample with known mutation status [29] [12].
Replicate Distribution: Aliquot a minimum of 10-16 technical replicates for robust statistical analysis [29] [81]. Ensure consistent matrix composition across all replicates to minimize introduction of extrinsic variability.
Parallel Processing: Process all replicates simultaneously using identical reagent lots, equipment, and operators to isolate measurement variability from other sources of variation.
Data Analysis: Calculate the mean concentration, standard deviation, and %CV for the replicate measurements. The formula for %CV is (standard deviation / mean) × 100% [76] [78].
Interpretation: For precision to be considered acceptable, the intra-assay %CV should generally be less than 10% [76] [77] [78].
This methodology was applied in the comparison between cdPCR and qPCR, where 23 technical replicates from a single master mix were analyzed on both platforms, clearly demonstrating the superior precision of the dPCR platform [29].
Comprehensive Protocol for Inter-Assay CV Assessment
Evaluating inter-assay precision measures consistency across different runs and is essential for establishing assay robustness:
Sample Selection: Prepare samples spanning the assay's measuring range—typically including low, medium, and high concentrations of the analyte. For liquid biopsy assays, this should include concentrations near the clinical decision point [80] [81].
Experimental Design: Analyze each sample in triplicate across a minimum of three independent assay runs conducted on different days [81]. For regulatory applications, inclusion of different operators and equipment may be necessary.
Consistent Calibration: For qPCR assays, use the same standard curve material across all runs, or ideally, utilize dPCR which eliminates the need for standard curves [29] [12].
Statistical Analysis: For each concentration level, calculate the mean, standard deviation, and %CV across all measurements from different runs. The inter-assay %CV should generally be less than 15% for acceptance [77] [78].
Additional Validation: For method comparisons, apply statistical analyses such as Passing-Bablok regression and Bland-Altman plots to assess both constant and proportional biases between platforms [80].
The following workflow diagram illustrates the parallel processes for assessing both intra-assay and inter-assay precision:
The Scientist's Toolkit: Essential Research Reagent Solutions
Table 3: Key Reagents and Materials for Precision Analysis in Nucleic Acid Detection
| Reagent/Material | Function | Considerations for Precision |
|---|---|---|
| Master Mix | Contains enzymes, dNTPs, and buffer for amplification | Use single, homogeneous lot across experiments; pre-aliquot to minimize freeze-thaw cycles [29] |
| Reference Standards | Calibrate qPCR assays; validate dPCR performance | Use WHO-calibrated standards; characterize against international reference materials [80] |
| Probes/Primers | Target-specific detection components | Validate specificity and efficiency; use consistent aliquoting to minimize variability [12] |
| Partitioning Oil/Reagents | Create nanodroplets or partitions in dPCR | Ensure consistency in droplet generation; monitor droplet size distribution [29] [12] |
| Positive Controls | Monitor assay performance across runs | Include at multiple concentrations (low, medium, high); use stable, well-characterized materials [80] [81] |
| Matrix Materials | Mimic sample background for standardization | Use consistent matrix matching; account for inhibitor effects on amplification efficiency [12] |
Implications for Liquid Biopsy Research and Clinical Applications
The superior precision of dPCR has significant implications for liquid biopsy research and clinical applications. The enhanced ability to detect small fold-changes (as low as 10% precision) and rare mutations (down to 0.1% fractional abundance) makes dPCR particularly valuable for monitoring minimal residual disease, assessing treatment response, and detecting emerging resistance mutations [20] [12]. In the context of HPV-associated cancers, the detection sensitivity of circulating tumor HPV DNA was significantly greater with more precise methods, directly impacting early detection capabilities [20].
For longitudinal monitoring of cancer patients through liquid biopsies, the reduced inter-assay variability of dPCR ensures that observed changes in ctDNA levels reflect true biological changes rather than technical noise. This is particularly important when tracking response to therapy or early signs of recurrence, where small changes in ctDNA concentration may have significant clinical implications. The absolute quantification capability of dPCR further enhances its utility in multicenter trials where standardization across different laboratories is challenging [12]. While qPCR remains suitable for applications requiring broad dynamic range, dPCR offers distinct advantages for applications demanding high precision, sensitivity, and reproducibility across laboratories [26] [12].
The assessment of intra-assay and inter-assay variability provides a critical framework for evaluating the performance of molecular detection platforms. For liquid biopsy research, where targets are often scarce and clinical decisions depend on detecting small changes, dPCR demonstrates superior precision with approximately 2-3 fold lower variability compared to qPCR [29]. This enhanced precision, combined with absolute quantification, higher tolerance to inhibitors, and improved sensitivity for rare mutations, positions dPCR as a powerful tool for advanced liquid biopsy applications [26] [20] [12]. However, researchers should consider that qPCR offers a wider dynamic range and more established protocols, making it suitable for applications where extreme precision is less critical [12]. The choice between platforms should be guided by the specific precision requirements of the research question or clinical application, with dPCR offering distinct advantages for detecting small fold-changes, rare mutations, and applications requiring high reproducibility across laboratories.
In the field of precision oncology, liquid biopsy has emerged as a transformative, minimally invasive approach for cancer detection, monitoring, and management. This technique analyzes circulating tumor biomarkers, such as circulating tumor DNA (ctDNA), from blood and other bodily fluids, providing real-time insights into tumor dynamics and treatment response [1] [2]. The reliable detection of often scarce tumor-derived material necessitates highly sensitive and accurate molecular technologies, with polymerase chain reaction (PCR) methods standing as fundamental tools.
Among these, quantitative PCR (qPCR) and digital PCR (dPCR) represent different generations of PCR technology, each with distinct advantages and limitations [43]. This guide provides a direct objective comparison of qPCR versus dPCR performance specifically within two challenging clinical contexts: HPV-associated head and neck cancers and early-stage breast cancer. We synthesize current experimental data, detail essential methodologies, and provide structured comparisons to inform researchers and drug development professionals in their assay selection and implementation.
Quantitative PCR (qPCR), also known as real-time PCR, monitors the amplification of a targeted DNA molecule during each PCR cycle via fluorescence. Quantification is achieved by comparing the amplification cycle threshold (Ct) of a sample to a standard curve generated from samples of known concentration, providing a relative measure of the target's abundance [43].
Digital PCR (dPCR), the third generation of PCR, takes an absolute quantification approach. The PCR reaction mixture is partitioned into thousands of individual nanoliter-volume reactions, so that each partition contains either zero, one, or a few target molecules. Following end-point amplification, the fraction of positive partitions is counted, and the absolute concentration of the target is calculated directly using Poisson statistics, without the need for a standard curve [43] [9]. This fundamental difference in methodology underpins the performance disparities explored in this guide.
Performance Comparison in HPV-Associated Cancers
Human papillomavirus (HPV)-associated head and neck squamous cell carcinoma (HPV+HNSCC) presents a compelling use case for liquid biopsy due to the consistent presence of viral DNA as a tumor-specific marker. A 2025 head-to-head study directly compared a whole-genome sequencing (WGS) approach for circulating tumor HPV DNA (ctHPVDNA) with dPCR- and antibody-based methods [82].
Table 1: Performance Metrics of Different Blood-Based Assays for HPV+HNSCC Detection
| Assay Method | Sensitivity (%) | Specificity (%) | Youden Index | Key Application Note |
|---|---|---|---|---|
| HPV Whole-Genome Sequencing | 98.7 | 98.7 | 0.99 | Highest diagnostic accuracy; optimal for screening |
| Single-plex Droplet Digital PCR (ddPCR) | 94.2 | 98.6 | 0.90 | High performance for targeted detection |
| Multiplex Droplet Digital PCR (ddPCR) | 90.6 | 96.3 | - | Good performance with multi-target capability |
| HPV Early Protein Antibodies (HPV Ab) | 86.4 | 96.3 | 0.83 | Indirect detection of immune response |
Key Experimental Findings
The study tested blood samples from 152 patients with untreated HPV+HNSCC (77% stage I) and 152 control patients. The results demonstrated that dPCR-based methods (ddPCR) achieved excellent sensitivity and specificity, exceeding 90% and 96%, respectively. However, the WGS-based ctHPVDNA detection was statistically superior in diagnostic accuracy (Youden Index: 0.99 for WGS vs. 0.90 for ddPCR; P < 0.001) [82]. This highlights dPCR's high performance for targeted detection, though emerging sequencing methods may offer enhanced capabilities.
Experimental Protocol: ctHPVDNA Detection by ddPCR
The following workflow was used for the direct detection of circulating tumor HPV DNA using droplet digital PCR [82]:
- Sample Collection and Processing: Collect peripheral blood into EDTA or cell-stabilization tubes. Process within a few hours to prevent lysis of white blood cells. Centrifuge to separate plasma from cellular components. Carefully aliquot the plasma for DNA extraction.
- Cell-Free DNA (cfDNA) Extraction: Extract cfDNA from the plasma component (typically 2-4 mL) using commercially available circulating nucleic acid kits (e.g., QIAamp Circulating Nucleic Acid Kit from Qiagen or the Circulating DNA Extraction Kit from Thermo Fisher Scientific). Elute the DNA in a low elution volume (e.g., 20-50 µL) to maximize concentration.
- Droplet Digital PCR (ddPCR) Setup:
- Reaction Mix: Prepare a 20-22 µL PCR reaction mix containing ddPCR Supermix (Bio-Rad), primers and fluorescent probes (FAM/HEX) specific for the target HPV gene (e.g., E6/E7), and the extracted cfDNA (typically 2-5 µL).
- Droplet Generation: Load the reaction mix and droplet generation oil into a DG8 cartridge. Use the QX200 Droplet Generator (Bio-Rad) to create an emulsion of approximately 20,000 nanoliter-sized droplets per sample.
- PCR Amplification: Transfer the generated droplets to a 96-well PCR plate. Seal the plate and perform amplification on a conventional thermal cycler using optimized cycling conditions for the specific assay.
- Droplet Reading and Analysis: Place the PCR plate in the QX200 Droplet Reader (Bio-Rad). The reader flows droplets single-file past a two-color optical sensor that reads the fluorescence endpoint of each droplet. Analyze the data using the manufacturer's software (e.g., QuantaSoft from Bio-Rad), which applies Poisson statistics to provide an absolute concentration of the target HPV DNA in copies/µL.
Performance Comparison in Early-Stage Breast Cancer and MRD
The ability to detect minute amounts of tumor DNA is paramount for managing early-stage breast cancer, particularly in the context of minimal residual disease (MRD) after surgery or during therapy. Here, the superior sensitivity and precision of dPCR become critically important.
Table 2: qPCR vs. dPCR Performance in Key Analytical Parameters
| Performance Parameter | qPCR (Real-time PCR) | Digital PCR (dPCR) | Supporting Data Context |
|---|---|---|---|
| Principle of Quantification | Relative (requires standard curve) | Absolute (Poisson statistics) | Calibration-free [43] [50] |
| Precision & Robustness | Higher data variation (up to 20% CNV difference) [83] | Lower variability; more compact test array [83] | Critical for longitudinal MRD monitoring [70] |
| Sensitivity (LoD) | Good (e.g., RCR LoD: 32 copies) [83] | Excellent (e.g., RCR LoD: 10 copies) [83] | dPCR excels in low-abundance target detection [84] |
| Dynamic Range | Wider (up to 8 logs) [83] | Slightly narrower (6 logs) but highly accurate within it [83] | qPCR advantageous for quantifying highly variable targets |
| Multiplexing Potential | Lower; prone to inter-assay competition | Higher; robust multiplexing demonstrated [83] [50] | dPCR enables efficient multi-gene panels (e.g., PIK3CA, ESR1) [70] |
| Tolerance to PCR Inhibitors | Moderate | High; due to partitioning of inhibitors [50] | dPCR performs better with complex sample matrices |
Key Experimental Findings
In comparative studies for CAR-T manufacturing (a context requiring high precision akin to MRD detection), dPCR demonstrated significantly less variation in copy number ratio (up to 20% difference observed with qPCR) and a stronger correlation for genes linked in one construct (R² = 0.99 for dPCR vs. R² = 0.78 for qPCR) [83]. This enhanced precision makes dPCR exceptionally suited for tracking MRD, where small changes in ctDNA concentration are clinically meaningful. Furthermore, studies show that dPCR is less susceptible to PCR inhibitors present in DNA samples extracted from complex matrices, improving reliability [50].
Experimental Workflow Diagrams
Core qPCR Workflow
Core dPCR Workflow
The Scientist's Toolkit: Essential Research Reagents & Materials
The successful implementation of qPCR and dPCR assays relies on a suite of specialized reagents and instruments.
Table 3: Essential Research Reagents and Platforms
| Item Category | Specific Function | Example Products & Notes |
|---|---|---|
| Nucleic Acid Extraction Kits | Isolation of high-quality cfDNA from plasma. | QIAamp Circulating Nucleic Acid Kit (Qiagen), Circulating DNA Extraction Kit (Thermo Fisher) [82]. Critical for yield and purity. |
| dPCR Master Mixes | Optimized buffer, polymerase, and dNTPs for partitioning and amplification. | ddPCR Supermix (Bio-Rad), QIAcuity PCR Master Mix (Qiagen). Formulated for emulsion or nanoplate stability. |
| Assay Chemistry | Target-specific detection. | TaqMan hydrolysis probes (FAM/HEX/VIC). Essential for multiplexing and specific variant detection [82]. |
| Reference Materials | Assay validation and quality control. | gBlocks Gene Fragments (IDT), certified plasmid standards. Used for determining LOD/LOQ [83] [9]. |
| Partitioning Instruments | Physical separation of PCR reactions. | QX200 Droplet Generator (Bio-Rad), QIAcuity Nanoplate (Qiagen) [50] [9]. Core differentiator of dPCR platforms. |
| Thermal Cyclers | DNA amplification. | C1000 Touch (Bio-Rad), ProFlex (Thermo Fisher). Standard cyclers suffice for ddPCR; integrated in some dPCR systems. |
| Fluorescence Readers | Detection of amplified targets. | QX200 Droplet Reader (Bio-Rad), QIAcuity One Integrated System (Qiagen) [50]. Reads endpoints for quantification. |
The choice between qPCR and dPCR is dictated by the specific requirements of the liquid biopsy application. For HPV-associated cancers, dPCR provides a highly sensitive and specific tool for direct ctHPVDNA detection, suitable for monitoring and screening, though advanced WGS methods are showing promisingly high accuracy [82]. In early-stage breast cancer, particularly for MRD detection and monitoring recurrence via mutations in genes like ESR1 and PIK3CA, dPCR is the superior technology due to its enhanced sensitivity, absolute quantification without standards, and exceptional precision with low-abundance targets [83] [70].
qPCR remains a powerful, cost-effective tool for applications where target abundance is higher and a wide dynamic range is needed. However, for the demanding analytical challenges of modern liquid biopsy—where every molecule counts—dPCR offers the robustness, accuracy, and sensitivity required to drive forward precision oncology research and drug development.
In molecular diagnostics and life sciences research, the Limit of Detection (LOD) and Limit of Quantification (LOQ) are critical parameters for evaluating assay performance. The LOD represents the lowest concentration of an analyte that can be reliably detected but not necessarily quantified, while the LOQ is the lowest concentration that can be measured with acceptable precision and accuracy [9]. For researchers in fields such as liquid biopsy and cancer research, where detecting rare mutations amidst abundant wild-type DNA is paramount, these parameters determine the practical utility of an assay. Digital PCR (dPCR) and quantitative PCR (qPCR) differ fundamentally in their approach to nucleic acid quantification, leading to significant differences in their LOD and LOQ characteristics [44] [7].
qPCR provides relative quantification based on standard curves, while dPCR offers absolute quantification by partitioning samples into thousands of individual reactions and applying Poisson statistics [44] [12]. This technical distinction underpins the differential performance of these platforms, particularly for applications requiring high sensitivity and precision at low target concentrations. Understanding these metrics is especially crucial for liquid biopsy research, where accurately quantifying rare circulating tumor DNA (ctDNA) mutations can inform cancer diagnosis, treatment selection, and monitoring [60] [45].
Theoretical Foundations of LOD and LOQ
Defining the Performance Metrics
The LOD and LOQ are established through rigorous statistical analysis of assay performance. The Limit of Blank (LoB) is typically determined first by measuring replicates of a blank sample containing no analyte. The LOD is then established as the lowest concentration at which the analyte can be detected with a defined probability (often 95%), while the LOQ is determined as the concentration where measurements achieve a specified level of precision, commonly expressed as a coefficient of variation (CV) [9]. For dPCR, the LOD is influenced by both the false-positive rate of the assay and the total number of partitions analyzed, with the theoretical maximum sensitivity being determined by the inverse of the false-positive rate [60].
The fundamental difference between qPCR and dPCR emerges from their quantification methodologies. qPCR relies on standard curves generated from known reference materials, introducing potential variability, while dPCR provides absolute quantification without external calibration by dividing the sample into numerous partitions and counting positive and negative reactions [7] [12]. This partitioning approach provides dPCR with inherent advantages for detecting rare alleles and achieving precise quantification at low target concentrations, making it particularly suitable for liquid biopsy applications where target molecules may be exceedingly rare [60] [45].
Comparative Workflows: qPCR vs. dPCR
The procedural differences between qPCR and dPCR significantly impact their sensitivity profiles and application suitability. The following diagram illustrates the key stages in each workflow and how they lead to different quantification outcomes:
Experimental Comparisons of qPCR and dPCR Performance
Direct Performance Comparisons Across Applications
Multiple studies have directly compared the sensitivity and quantification capabilities of qPCR and dPCR across various applications. The following table summarizes key experimental findings from recent research:
Table 1: Comparative Performance of qPCR and dPCR Across Experimental Studies
| Application Context | qPCR Performance | dPCR Performance | Experimental Details | Citation |
|---|---|---|---|---|
| Infectious Bronchitis Virus (IBV) Detection | Wider quantification range | Higher sensitivity and precision | Testing on plasmid DNA and infected chicken samples; dPCR showed better repeatability and reproducibility | [7] |
| CAR-T Manufacturing Validation | 8-log dynamic range; LoD: 32 copies for RCR | 6-log dynamic range; LoD: 10 copies for RCR | Used gBlocks and sample matrices; dPCR showed less data variation (R² = 0.99 vs 0.78) | [83] |
| Porcine Detection in Food Products | High precision (R² = 0.9971); slightly lower sensitivity at low DNA concentrations | Higher sensitivity at low concentrations (<5 copies); high precision (R² = 0.9998) | Used recombinant pUC57 plasmid with porcine ATCB gene fragment | [85] |
| Respiratory Virus Detection | Variable quantification depending on inhibitors | Superior accuracy for high viral loads; greater consistency | 123 clinical samples; better performance for influenza A/B, RSV, SARS-CoV-2 | [6] |
| EGFR Mutation Detection (L858R) | Limited by background noise | LoD: 1 mutant in 180,000 wild-type (3.3μg DNA); 1 in 4 million with more DNA | False-positive rate: 1 in 14 million; enables rare mutation detection | [60] |
LOD and LOQ Values from Platform Comparisons
Specific LOD and LOQ values vary depending on the platform, assay design, and target application. A comparative study of two dPCR platforms provides insight into typical sensitivity ranges:
Table 2: LOD and LOQ Values for Different dPCR Platforms
| Platform | Partitioning Method | LOD (copies/μL input) | LOQ (copies/μL input) | Reaction Volume | Citation |
|---|---|---|---|---|---|
| QIAcuity One | Nanoplate-based | 0.39 | 1.35 | 40μL | [9] |
| QX200 | Droplet-based | 0.17 | 4.26 | 20μL | [9] |
The difference in LOD and LOQ values between platforms highlights the importance of considering both the partitioning technology and reaction volumes when selecting a dPCR system for sensitive applications. The QIAcuity system demonstrated a lower LOQ despite a higher LOD, suggesting better quantification precision at low concentrations, while the QX200 system showed superior detection capabilities [9].
Experimental Protocols for LOD/LOQ Determination
Establishing LOD and LOQ for dPCR Assays
A standardized approach for determining LOD and LOQ in dPCR involves analyzing a dilution series of the target nucleic acid. For the EGFR L858R assay, researchers processed 58-71 replicate wild-type samples to establish the false-positive rate and additional samples with mutation titrations ranging from 0.0005% to 1% mutant alleles [60]. Each PCR reaction contained approximately 20,000 copies/μL of genomic DNA (∼3.3 μg per 50 μL reaction), with mutant plasmid DNA spiked in at varying ratios [60].
The experimental workflow follows these critical steps:
- Sample Preparation: DNA is fragmented to approximately 3 kb in length via nebulization, quantified using spectrophotometry, and fragmentation length confirmed by gel electrophoresis [60].
- Reaction Assembly: PCR reactions are prepared in pre-PCR rooms to minimize contamination risk, containing 1× TaqMan Genotyping Master Mix, 0.2 μM probes, 0.9 μM primers, droplet stabilizer, and template DNA [60].
- Partitioning and Amplification: Samples are partitioned using the appropriate dPCR system (droplet- or nanoplate-based) and amplified to endpoint.
- Data Analysis: Positive and negative partitions are counted, and Poisson statistics applied to calculate absolute target concentrations. The LOD is determined based on the false-positive rate and the 95% confidence level for detection [60].
Key Reagent Solutions for dPCR Assays
Successful implementation of sensitive dPCR assays requires optimized reagent systems. The following table outlines essential components and their functions:
Table 3: Essential Research Reagent Solutions for dPCR Assays
| Reagent Component | Function | Example Products | Optimization Tips | |
|---|---|---|---|---|
| Polymerase Master Mix | DNA amplification foundation | TaqMan Genotyping Master Mix | Use hot-start enzymes to minimize non-specific amplification | [60] |
| Hydrolysis Probes | Target-specific detection | TaqMan MGB Probes, PrimeTime LNA Probes | LNA nucleotides improve allele discrimination; optimize concentrations (typically 0.2μM) | [60] [12] |
| Primers | Target amplification | Custom oligonucleotides | Design amplicons 50-100 bp; optimize concentration (typically 0.9μM) | [60] |
| Partitioning Reagents | Enable compartmentalization | Droplet Stabilizer (RainDance) | Critical for consistent partition formation | [60] |
| Restriction Enzymes | Enhance DNA accessibility | EcoRI, HaeIII | Improve precision, especially for high copy number targets; HaeIII showed better performance in some systems | [9] |
Application to Liquid Biopsy Research
Relevance for Circulating Tumor DNA Analysis
Liquid biopsy represents one of the most promising applications for dPCR due to the need to detect rare mutations in circulating tumor DNA (ctDNA) against a background of abundant wild-type DNA. In one study, dPCR achieved detection of one mutant EGFR molecule in 4 million wild-type molecules when processing 70 million DNA copies, with a false-positive rate of just 1 in 14 million [60]. This exceptional sensitivity enables monitoring of minimal residual disease and detection of resistance mutations such as EGFR T790M before clinical progression occurs [60] [45].
The absolute quantification capability of dPCR provides significant advantages for liquid biopsy applications where precise measurement of allele fractions is critical for treatment decisions. Unlike qPCR, which depends on standard curves that introduce variability, dPCR directly counts target molecules, enabling more reliable comparison across samples and time points [44] [7]. This feature is particularly valuable for longitudinal monitoring of treatment response in oncology patients, where consistent quantification is essential for assessing disease trajectory.
Practical Considerations for Implementation
When implementing dPCR for liquid biopsy applications, several practical factors influence LOD and LOQ:
- Input DNA Quantity: The LOD improves with more input DNA; in one study, analyzing 3.3 μg genomic DNA enabled detection of 1 mutant in 180,000 wild-type copies, while higher inputs pushed sensitivity to 1 in 4 million [60].
- Partition Number: Systems generating more partitions (typically 20,000-26,000) provide better precision and lower detection limits [9] [6].
- Assay Design: Amplicon size (51-78 bp in EGFR assays), probe chemistry (MGB, LNA), and careful primer design significantly impact performance [60].
- Restriction Enzyme Use: Enzymes like HaeIII can improve precision, especially for targets with high copy numbers or complex structures [9].
The comparative analysis of LOD and LOQ characteristics demonstrates that dPCR generally provides superior sensitivity and precision for detecting rare targets compared to qPCR. While qPCR maintains advantages in dynamic range and throughput for higher concentration applications [83], dPCR excels in scenarios requiring absolute quantification and detection of low-abundance targets [44] [7] [12]. For liquid biopsy research specifically, dPCR's ability to reliably detect mutant alleles at frequencies below 0.1% makes it an indispensable tool for advancing cancer diagnostics and monitoring [60] [45].
The choice between these technologies ultimately depends on the specific application requirements, with dPCR being particularly suited for liquid biopsy applications where maximum sensitivity is necessary to detect rare ctDNA mutations. As dPCR technologies continue to evolve with improvements in partitioning, multiplexing capabilities, and workflow automation, their implementation in clinical research settings is likely to expand, potentially enabling earlier disease detection and more precise monitoring of treatment response.
Concordance analysis is crucial for evaluating the reliability of molecular detection methods, particularly at low target concentrations where technological discrepancies become most apparent. In liquid biopsy research, the accurate detection of rare targets, such as circulating tumor DNA (ctDNA), is imperative for clinical decision-making. This guide provides an objective comparison of digital PCR (dPCR) and quantitative PCR (qPCR), focusing on their concordance, sensitivity, and precision. Supported by experimental data, we demonstrate that dPCR consistently outperforms qPCR in low-concentration scenarios, offering researchers a definitive resource for selecting the optimal methodology for their liquid biopsy applications.
In clinical and research diagnostics, concordance measures the agreement between two testing methods. High concordance indicates that different methods produce equivalent results for the same sample, which is vital for validating new technologies and ensuring consistent clinical interpretations. However, concordance often decreases at low target concentrations, a critical area for liquid biopsy applications where analytes like circulating tumor DNA (ctDNA) are rare and fragmented.
The emergence of liquid biopsy as a minimally invasive tool for cancer monitoring has intensified the need for highly sensitive detection methods. Liquid biopsy analyzes biomarkers, including ctDNA and circulating tumor cells (CTCs), present in blood or other bodily fluids. A significant challenge is that tumor-derived DNA can constitute less than 0.1% of the total cell-free DNA (cfDNA) in a sample, demanding exceptional sensitivity and precision from the detection platform.
This guide objectively compares two primary technologies for nucleic acid detection in this context: quantitative PCR (qPCR) and digital PCR (dPCR), with a specific focus on their performance at low target concentrations.
The fundamental difference between qPCR and dPCR lies in how they perform and quantify the amplification of nucleic acids.
Quantitative PCR (qPCR): Also known as real-time PCR, this method amplifies target DNA in a bulk reaction. Quantification relies on comparing the sample's amplification cycle threshold (Cq) to a standard curve generated from known concentrations. This indirect measurement can introduce variability, especially when the target is rare or inhibitors are present in the sample.
Digital PCR (dPCR): This method partitions a single PCR reaction into thousands of individual reactions (nanowells or droplets). Each partition contains either zero, one, or a few target molecules. After end-point PCR amplification, the partitions are read as positive or negative. Using Poisson statistics, dPCR provides an absolute quantification of the target nucleic acid without the need for a standard curve. This partitioning is the key to its enhanced sensitivity for rare targets.
The table below summarizes the core differences:
Table 1: Fundamental Differences Between qPCR and dPCR
| Feature | Quantitative PCR (qPCR) | Digital PCR (dPCR) |
|---|---|---|
| Quantification Method | Relative to a standard curve | Absolute, via Poisson statistics |
| Reaction Format | Single, bulk reaction | Partitioned into thousands of reactions |
| Sensitivity | Lower, typically around 1% mutant allele frequency | Higher, can detect below 0.01% mutant allele frequency [33] |
| Precision & Reproducibility | Lower; more susceptible to inhibition and standard curve errors | Higher; less susceptible to inhibitors and offers superior reproducibility [29] |
| Best Application | High-abundance target quantification | Rare allele detection, copy number variation, and low-fold change analysis |
Comparative Performance at Low Target Concentrations
Empirical data from multiple studies consistently reveals a performance gap between dPCR and qPCR as target concentration decreases.
Sensitivity and Limit of Detection (LOD)
The Limit of Detection (LOD) is the lowest concentration of an analyte that can be reliably detected. A meta-analysis comparing liquid biopsy methods for Human Papillomavirus-associated cancers found that the sensitivity of ctHPVDNA detection was significantly greater with next-generation sequencing (NGS), followed by dPCR, and then qPCR. The study reported: "sensitivity: ddPCR > qPCR, P < 0.001" [20] [23].
In monitoring CAR-T cell therapy, a study demonstrated that dPCR presented a sensitivity of 0.01%, which was 10-fold more sensitive than flow cytometry (0.1%) and 100-fold more sensitive than qPCR (1%) [33]. This ultra-sensitive detection is critical for monitoring minimal residual disease (MRD) and early treatment response.
Precision and Reproducibility
Precision, often measured by the Coefficient of Variation (%CV), indicates the reproducibility of measurements. Lower %CV values signify higher precision.
A direct technical comparison between Crystal dPCR (cdPCR) and qPCR, using 23 technical replicates of a single sample, found that the measurement variability of cdPCR (%CV = 2.3) was more than two-fold lower than that of qPCR (%CV = 5.0) [29]. The study further noted that pooling dPCR replicates could reduce variability almost three-fold compared to the average of qPCR duplicates.
Table 2: Precision Comparison Between dPCR and qPCR
| Technology | Coefficient of Variation (%CV) | Experimental Context |
|---|---|---|
| Crystal Digital PCR | 2.3% | 23 technical replicates of human genomic DNA [29] |
| Quantitative PCR | 5.0% | 23 technical replicates of the same sample [29] |
| Pooled Crystal dPCR | 1.5% | Two wells grouped during analysis [29] |
Another study comparing droplet dPCR (ddPCR) and nanoplate-based dPCR (ndPCR) highlighted that precision can be influenced by factors like the choice of restriction enzyme, but both dPCR platforms achieved high precision across most analyses [9].
Concordance with Gold-Standard Methods
Concordance analysis often involves comparing a newer technology to an established reference method. In a clinical microbiology setting, the BioFire Pneumonia Panel (a PCR-based test) was compared to traditional culture. While overall organism identification concordance was 97%, the probability of growth in culture was highly dependent on the semiquantitative PCR result [86]. At a low concentration of 10^4 copies/mL, only 4% of PCR-detected organisms grew in culture. This disparity increased to 53% at 10^7 copies/mL, illustrating that culture (often considered a reference) lacks sensitivity at low microbial burdens, and molecular methods like PCR can detect non-viable or colonizing organisms that are still clinically relevant [86].
Experimental Protocols for Concordance Assessment
To ensure reliable and reproducible concordance data, a rigorous experimental protocol is essential. The following methodology, drawn from cited studies, can be adapted for comparing dPCR and qPCR performance.
Sample Preparation and DNA Extraction
- Sample Collection: Collect liquid biopsy samples (e.g., blood plasma, serum) in appropriate tubes (e.g., EDTA for plasma). Store at -80°C until processing [25].
- cfDNA Extraction: Use a commercial cfDNA extraction kit, such as the QIAamp Circulating Nucleic Acid Kit. To maximize yield and concentration, consider eluting the purified cfDNA in a smaller volume than recommended (e.g., a 1:50 volume ratio of eluent to original liquid biopsy volume) [25].
- Alternative Direct Detection: To save time and cost, a "direct" dPCR assay can be developed. This involves using heat-treated and centrifuged samples without prior cfDNA purification, though this may result in slightly lower concordance rates compared to purified cfDNA [25].
Assay Design and Optimization
- Primers and Probes: Design TaqMan-based assays targeting the gene of interest (e.g., the E6 region for HPV16 detection). Example sequences include:
- Forward Primer: 5′-TGTTTCAGGACCCACAGGAG-3′
- Reverse Primer: 5′-TGTTGCTTGCAGTACACACA-3′
- Probe: FAM-5′-ACCACAGTTATGCACAGAGCTGCAAAC-3′-HEX [25]
- Annealing Temperature Optimization: Perform a temperature gradient PCR to determine the optimal annealing temperature based on the fluorescence difference between positive and negative controls and the number of target molecules detected [25].
PCR Workflow and Data Analysis
- qPCR Protocol: Prepare reactions according to manufacturer instructions. Include a standard curve with known concentrations covering the expected dynamic range. The reaction is run on a real-time PCR instrument, and Cq values are used for quantification relative to the standard curve.
- dPCR Protocol: Prepare the reaction mix similarly but with a mastermix designed for dPCR. The mixture is then partitioned into droplets (ddPCR) or nanowells (ndPCR). The PCR amplification is run to endpoint, and the partitions are read to count positive and negative events.
- Concordance Calculation: Quantify the same set of samples, ideally with a range of concentrations and multiple replicates, using both qPCR and dPCR. Use statistical methods like Lin’s concordance correlation coefficient (ccc) and Passing-Bablok regression to assess the strength of agreement and identify any constant or proportional bias between the two methods [87].
Diagram 1: Experimental workflow for PCR concordance analysis.
The Scientist's Toolkit: Essential Reagents and Materials
Successful concordance analysis requires specific reagents and instruments. Below is a list of key solutions used in the featured experiments.
Table 3: Key Research Reagent Solutions for dPCR Concordance Studies
| Item | Function/Description | Example Product/Catalog |
|---|---|---|
| cfDNA Extraction Kit | For purification of cell-free DNA from liquid biopsies. Critical for obtaining clean, amplifiable DNA. | QIAamp Circulating Nucleic Acid Kit (Qiagen, 55114) [25] |
| dPCR Supermix | Optimized reaction mix for digital PCR, containing polymerase, dNTPs, and buffer. | ddPCR Supermix for Probes (Bio-Rad, 1863024) [25] |
| Droplet Generator & Reader | Instrument system for creating water-in-oil droplets and reading fluorescence post-PCR. | QX200 Droplet Digital PCR System (Bio-Rad) [25] [9] |
| Nanoplate dPCR System | Instrument system that partitions reactions into nanoscale chambers for quantification. | QIAcuity One (QIAGEN) [9] |
| Assay-Specific Primers/Probes | Custom-designed oligonucleotides for fluorescent detection of a specific DNA target. | e.g., HPV16 E6 target primers and FAM/HEX probe [25] |
The body of evidence unequivocally demonstrates that digital PCR achieves higher concordance with true target concentration at low abundance levels compared to quantitative PCR. Its superior sensitivity, precision, and ability for absolute quantification without a standard curve make it particularly suited for liquid biopsy applications where targets are rare, such as monitoring minimal residual disease, early treatment response, and tumor heterogeneity.
While qPCR remains a robust and cost-effective tool for quantifying higher-abundance targets, researchers focusing on the challenging low-concentration end of the spectrum should prioritize dPCR. The choice between droplet-based and nanoplate-based dPCR systems may depend on specific needs for throughput, precision, and ease of use, as both platforms offer significant advantages over qPCR. As liquid biopsy continues to evolve and demand higher sensitivity, dPCR is poised to become an indispensable technology in molecular diagnostics and oncology research.
Conclusion
The choice between digital PCR and qPCR for liquid biopsy is not a matter of one being universally superior, but rather depends on the specific application requirements. qPCR remains a powerful, cost-effective tool for high-throughput applications where extreme sensitivity is not critical. In contrast, dPCR excels in scenarios demanding high precision, absolute quantification without standard curves, and superior sensitivity for detecting rare mutations and low-abundance targets like ctDNA in early-stage cancers. The growing body of evidence, including recent meta-analyses, consistently demonstrates dPCR's enhanced performance for liquid biopsy applications, particularly in oncology. Future directions will likely see dPCR becoming increasingly integrated into clinical workflows for minimal residual disease monitoring, early cancer detection, and personalized therapy guidance, especially as the technology continues to evolve with greater automation and multiplexing capabilities. Researchers and clinicians must weigh factors including required sensitivity, throughput, cost, and the need for absolute quantification when selecting the optimal technology for their liquid biopsy applications.
References
- 1. Liquid biopsy – a narrative review with an update on current ... [https://pmc.ncbi.nlm.nih.gov/articles/PMC12333414/]
- 2. Liquid biopsy in cancer: current status, challenges and ... [https://www.nature.com/articles/s41392-024-02021-w]
- 3. SABCS 2025 to highlight dynamic landscape of liquid biopsy [https://www.sabcsmeetingnews.org/sabcs-2025-to-highlight-dynamic-landscape-of-liquid-biopsy/]
- 4. Liquid biopsy- A pivotal test to help navigate clinical ... [https://www.sciencedirect.com/science/article/pii/S2950195425000396]
- 5. Cancer in a drop: Liquid biopsy highlights from the ... [https://www.sciencedirect.com/science/article/pii/S2950195425000360]
- 6. Comparative Performance of Digital PCR and Real-Time RT ... [https://pmc.ncbi.nlm.nih.gov/articles/PMC12474457/]
- 7. Comparison of quantitative PCR and digital PCR assays ... [https://www.sciencedirect.com/science/article/pii/S0166093423001842]
- 8. Digital PCR outperforms quantitative real-time PCR for the ... [https://pmc.ncbi.nlm.nih.gov/articles/PMC12288185/]
- 9. Comparing the precision of two digital PCR applications for ... [https://www.nature.com/articles/s41598-025-13143-8]
- 10. Could a Liquid Biopsy Lead to Earlier Diagnoses for ... [https://ascopost.com/news/november-2025/could-a-liquid-biopsy-lead-to-earlier-diagnoses-for-numerous-cancer-types/]
- 11. Real-Time qRT-PCR - NCBI - NIH [https://www.ncbi.nlm.nih.gov/probe/docs/techqpcr/]
- 12. dPCR vs qPCR [https://www.qiagen.com/us/applications/digital-pcr/beginners/dpcr-vs-qpcr]
- 13. Basic Principles of RT-qPCR [https://www.thermofisher.com/us/en/home/brands/thermo-scientific/molecular-biology/molecular-biology-learning-center/molecular-biology-resource-library/spotlight-articles/basic-principles-rt-qpcr.html]
- 14. Comparison of Digital PCR and Quantitative PCR with ... [https://pmc.ncbi.nlm.nih.gov/articles/PMC9705847/]
- 15. Absolute vs. Relative Quantification for qPCR [https://www.thermofisher.com/us/en/home/life-science/pcr/real-time-pcr/real-time-pcr-learning-center/real-time-pcr-basics/absolute-vs-relative-quantification-real-time-pcr.html]
- 16. What is the standard curve method for qPCR assay data ... [https://www.qiagen.com/us/resources/faq/2691]
- 17. Droplet digital PCR-based detection of circulating tumor DNA ... [https://pmc.ncbi.nlm.nih.gov/articles/PMC8218704/]
- 18. dPCR: A Technology Review - PMC - PubMed Central [https://pmc.ncbi.nlm.nih.gov/articles/PMC5948698/]
- 19. Digital PCR vs. Real-Time PCR: Understanding the Key ... [https://www.labmanager.com/digital-pcr-vs-real-time-pcr-understanding-the-key-differences-33665]
- 20. Comparing the Diagnostic Performance of Quantitative PCR ... [https://pubmed.ncbi.nlm.nih.gov/38103593/]
- 21. Comparison of digital PCR systems for the analysis ... [https://www.sciencedirect.com/science/article/pii/S0009898123000414]
- 22. Poisson Law Computation for Digital PCR [https://www.stillatechnologies.com/digital-pcr/primer-design/poisson-law-computation/]
- 23. Comparing the Diagnostic Performance of Quantitative ... [https://www.sciencedirect.com/science/article/pii/S1525157823002921]
- 24. Comparison of Analytic Methods for Quantitative Real-Time ... [https://pmc.ncbi.nlm.nih.gov/articles/PMC4642823/]
- 25. Rapid and Sensitive Digital Droplet PCR Assays for ... [https://pmc.ncbi.nlm.nih.gov/articles/PMC11683180/]
- 26. Comparison of quantitative PCR and digital PCR assays ... [https://pubmed.ncbi.nlm.nih.gov/38061673/]
- 27. Accurate Quantification and Characterization of Adeno- ... [https://www.frontiersin.org/journals/microbiology/articles/10.3389/fmicb.2019.01570/full]
- 28. Performance Comparison of Droplet Digital PCR and Next ... [https://pmc.ncbi.nlm.nih.gov/articles/PMC12062871/]
- 29. Precision performance of Crystal Digital PCR vs. ... [https://www.stillatechnologies.com/digital-pcr/naica-system-analysis/precision-performance-of-crystal-digital-pcr-vs-quantitative-pcr/]
- 30. Analyzing qPCR data: Better practices to facilitate rigor and ... [https://www.sciencedirect.com/science/article/pii/S2405580825004431]
- 31. Digital droplet PCR is an accurate and precise method to ... [https://www.nature.com/articles/s41598-025-20944-4]
- 32. A comparison of DNA methylation specific droplet digital ... [https://pmc.ncbi.nlm.nih.gov/articles/PMC4622657/]
- 33. Digital PCR Improves Sensitivity and Quantification in ... [https://www.sciencedirect.com/science/article/pii/S2666636723024119]
- 34. High-Throughput Gene Expression Analysis of Real-Time ... [https://pubmed.ncbi.nlm.nih.gov/24260380/]
- 35. Droplet Digital PCR versus qPCR for gene expression ... [https://www.nature.com/articles/s41598-017-02217-x]
- 36. How your sneakers tie into digital PCR and liquid biopsy [https://www.qiagen.com/us/knowledge-and-support/knowledge-hub/science-matters/pcr-solutions/how-your-sneakers-tie-into-digital-pcr-and-liquid-biopsy]
- 37. NGS vs qPCR [https://www.illumina.com/science/technology/next-generation-sequencing/beginners/advantages/ngs-vs-qpcr.html]
- 38. Digital PCR and Real-time PCR(qPCR) 2025-2033 Analysis [https://www.marketreportanalytics.com/reports/digital-pcr-and-real-time-pcrqpcr-314646]
- 39. Comparison of digital PCR systems for the analysis ... [https://pubmed.ncbi.nlm.nih.gov/36736684/]
- 40. Monitoring and Assessment of Circulating Tumor DNA in ... [https://pmc.ncbi.nlm.nih.gov/articles/PMC12550271/]
- 41. Strategies for improving detection of circulating tumor DNA ... [https://www.sciencedirect.com/science/article/pii/S0305737223000889]
- 42. Performance Comparison of Droplet Digital PCR and Next- ... [https://pubmed.ncbi.nlm.nih.gov/40346007/]
- 43. Digital PCR: from early developments to its future application ... [https://pubs.rsc.org/en/content/articlehtml/2025/lc/d5lc00055f]
- 44. Quantitative or digital PCR? A comparative analysis for ... [https://www.sciencedirect.com/science/article/abs/pii/S0165993624001584]
- 45. Digital PCR (dPCR) vs Real-Time PCR (qPCR) [https://firalismolecularprecision.com/2025/04/09/dpcr-qpcr-differences/]
- 46. Digital PCR | IDT [https://www.idtdna.com/pages/technology/qpcr-and-pcr/digital-pcr]
- 47. Introduction to Quantitative PCR (qPCR) Gene Expression ... [https://www.thermofisher.com/us/en/home/life-science/pcr/real-time-pcr/real-time-pcr-learning-center/gene-expression-analysis-real-time-pcr-information/introduction-gene-expression.html]
- 48. How Proper Digital PCR Techniques Helps DNA Preparation [https://www.stillatechnologies.com/digital-pcr/primer-design/digital-pcr-technique/]
- 49. qPCR Steps: Creating a Successful Experiment | IDT [https://www.idtdna.com/page/support-and-education/decoded-plus/successful-qpcr/]
- 50. Comparison of two digital PCR platforms for quantification ... [https://pmc.ncbi.nlm.nih.gov/articles/PMC12622311/]
- 51. Liquid biopsy for human cancer: cancer screening, monitoring ... [https://pmc.ncbi.nlm.nih.gov/articles/PMC11130638/]
- 52. Liquid Biopsy-Based Biomarkers of Treatment Response ... [https://www.sciencedirect.com/science/article/pii/S1535610820301525]
- 53. Digital PCR Applications: Liquid Biopsy [https://www.thermofisher.com/us/en/home/life-science/pcr/digital-pcr/education/cancer-research/liquid-biopsy.html]
- 54. The Impact of the Variability of RT-qPCR Standard Curves ... [https://pmc.ncbi.nlm.nih.gov/articles/PMC12029521/]
- 55. Comparison of microfluidic digital PCR and conventional ... [https://pubmed.ncbi.nlm.nih.gov/22373922/]
- 56. Evaluation of normalisation strategies for qPCR data ... [https://www.nature.com/articles/s41598-025-06657-8]
- 57. In-house validation of a droplet digital PCR system using ... [https://www.sciencedirect.com/science/article/abs/pii/S0003267025005665]
- 58. Methylation-sensitive restriction enzyme-droplet digital ... [https://pmc.ncbi.nlm.nih.gov/articles/PMC10998716/]
- 59. In-house validation of a droplet digital PCR system using ... [https://www.sciencedirect.com/science/article/pii/S0003267025005665]
- 60. Determining lower limits of detection of digital PCR assays ... [https://pmc.ncbi.nlm.nih.gov/articles/PMC5129438/]
- 61. Comparing the Diagnostic Performance of Quantitative ... [https://pmc.ncbi.nlm.nih.gov/articles/PMC10918646/]
- 62. Quantifying the Detection Sensitivity and Precision of ... [https://pmc.ncbi.nlm.nih.gov/articles/PMC11634988/]
- 63. Digital PCR Applications: Environmental Pathogen ... [https://www.thermofisher.com/us/en/home/life-science/pcr/digital-pcr/education/basic-research/environmental-pathogen-quantification.html]
- 64. Detection limits of quantitative and digital PCR assays and ... [https://pubs.usgs.gov/publication/70178218]
- 65. dPCR vs. ddPCR: Why Precision Matters in Cell and Gene ... [https://www.roslinct.com/insights/dpcr-vs-ddpcr/]
- 66. Comparison of dPCR and ddPCR: advantages and ... [https://www.linkedin.com/posts/pilot-gene_ddpcr-pcr-qpcr-activity-7373670714408652800-db0D]
- 67. Digital PCR Market Share, Growth Analysis | Forecast [2032] [https://www.fortunebusinessinsights.com/digital-pcr-market-102014]
- 68. dPCR application in liquid biopsies: divide and conquer [https://pubmed.ncbi.nlm.nih.gov/33305634/]
- 69. Fit-for-purpose quantitative liquid biopsy based droplet digital PCR assay development for detection of programmed cell death ligand-1 (PD-L1) RNA expression in PAXgene blood samples - PMC [https://www.ncbi.nlm.nih.gov/pmc/articles/PMC8109819/]
- 70. Circulating tumor DNA to monitor treatment response in ... [https://www.nature.com/articles/s41698-025-00876-y]
- 71. Predictive Effectiveness of Circulating Tumor DNA in ... [https://pmc.ncbi.nlm.nih.gov/articles/PMC12513050/]
- 72. Circulating tumor DNA methylation in colorectal cancer [https://www.sciencedirect.com/science/article/abs/pii/S000989812500422X]
- 73. Application of Data Science in Circulating Tumor DNA ... [https://www.frontiersin.org/journals/oncology/articles/10.3389/fonc.2021.692322/full]
- 74. Liquid Biopsy and Tissue Biopsy Comparison with Digital ... [https://pmc.ncbi.nlm.nih.gov/articles/PMC8824896/]
- 75. Diagnostic accuracy of circulating tumor DNA for detection of ... [https://journals.plos.org/plosone/article?id=10.1371/journal.pone.0330855]
- 76. Calculating Inter- and Intra-Assay Coefficients of Variability [https://salimetrics.com/calculating-inter-and-intra-assay-coefficients-of-variability/]
- 77. ELISA Assay Qualification: Precision & Reproducibility Tips [https://www.cygnustechnologies.com/evaluating-precision-and-reproducibility-in-your-elisa?srsltid=AfmBOoqhGUbvZXTKARmDD8HoimL1sgWOqml2XBeo7pg2MqDckHHZctzG]
- 78. %CV in ELISA: How to Reduce Them and Why They're ... [https://www.enzo.com/note/cv-in-elisa-how-to-reduce-them-and-why-theyre-important/]
- 79. Optimisation, harmonisation and standardisation of the direct ... [https://pmc.ncbi.nlm.nih.gov/articles/PMC7926177/]
- 80. Interassay Variability and Clinical Implications of Five Different ... [https://pmc.ncbi.nlm.nih.gov/articles/PMC10981008/]
- 81. Why is ELISA lot-to-lot Reproducibility Critical for your ... [https://www.enzo.com/note/why-is-elisa-lot-to-lot-reproducibility-critical-for-your-research/]
- 82. Direct Comparison of Alternative Blood-Based Approaches for ... [https://pubmed.ncbi.nlm.nih.gov/40392113/]
- 83. A Comparative Study of qPCR and dPCR [https://www.sciencedirect.com/science/article/abs/pii/S1465324925004992]
- 84. Liquid biopsy: current technology and clinical applications [https://jhoonline.biomedcentral.com/articles/10.1186/s13045-022-01351-y]
- 85. Droplet digital PCR versus real-time PCR for in-house ... [https://journals.plos.org/plosone/article?id=10.1371/journal.pone.0287712]
- 86. Clinical utilization and culture concordance of categorical ... [https://pmc.ncbi.nlm.nih.gov/articles/PMC12026127/]
- 87. Concordance between low density lipoprotein cholesterol ... [https://ijcbr.in/article-details/20214]