Decoding Cancer Complexity: How Next-Generation Sequencing Unravels Tumor Heterogeneity for Precision Oncology
Next-generation sequencing (NGS) has fundamentally transformed our understanding and investigation of cancer heterogeneity, moving beyond organ-based classification to a molecular-level understanding of tumor evolution, resistance, and metastasis.
Decoding Cancer Complexity: How Next-Generation Sequencing Unravels Tumor Heterogeneity for Precision Oncology
Abstract
Next-generation sequencing (NGS) has fundamentally transformed our understanding and investigation of cancer heterogeneity, moving beyond organ-based classification to a molecular-level understanding of tumor evolution, resistance, and metastasis. This article provides a comprehensive resource for researchers and drug development professionals, exploring the foundational principles of NGS in characterizing genomic diversity. It delves into advanced methodological applications like single-cell sequencing and liquid biopsy, addresses critical troubleshooting and optimization challenges in clinical implementation, and validates NGS findings through comparative analyses with real-world data. By synthesizing current evidence and future directions, this review underscores the indispensable role of NGS in advancing personalized cancer therapeutics and overcoming the clinical challenges posed by tumor heterogeneity.
The Genomic Landscape of Cancer: Foundational Concepts of Heterogeneity and NGS
Cancer is not a single disease but a collection of genetically and phenotypically diverse malignancies characterized by extensive heterogeneity at multiple levels. This heterogeneity presents the most significant challenge in oncology today, influencing diagnosis, treatment selection, and ultimately, patient outcomes. Intratumoral heterogeneity (ITH) refers to the genetic, epigenetic, and phenotypic diversity observed within a single tumor, where distinct cellular sub-populations coexist and evolve [1]. In contrast, intertumoral heterogeneity describes the variations observed between tumors of the same histological type from different patients, driven by differences in genetic background, environmental exposures, and etiological factors [2]. Together, these dimensions of heterogeneity create a complex biological landscape that confounds traditional therapeutic approaches and drives drug resistance, metastasis, and disease recurrence.
The clinical implications of tumor heterogeneity are profound. ITH enables Darwinian selection within the tumor ecosystem, where pre-existing resistant subclones or newly evolved variants can survive therapy and initiate relapse [1]. From a diagnostic perspective, heterogeneity challenges the representativeness of single biopsies, as they may miss critical subclonal populations that dictate therapeutic response. Furthermore, heterogeneity complicates biomarker development, as molecular signatures may vary spatially within a tumor and temporally throughout disease progression and treatment [3]. Understanding and addressing these heterogeneities is therefore paramount for advancing precision oncology and improving patient outcomes.
Molecular Mechanisms Driving Heterogeneity
Genetic and Non-Genetic Mechanisms
Tumor heterogeneity arises through multiple interconnected mechanisms that operate at different molecular levels. The primary drivers can be categorized into genetic, epigenetic, and microenvironmental factors that collectively shape the tumor's evolutionary trajectory.
Genetic instability forms the foundation of ITH, generating diverse subclonal populations through various mechanisms. This includes an elevated point mutation rate, chromosomal segregation errors, and copy number alterations that accumulate during tumor progression [1]. The tolerance for genomic instability in cancer cells allows them to withstand increased mutational burdens, with certain therapies even exacerbating this process by inducing a hypermutator phenotype [1].
Epigenetic modifications represent another crucial layer of heterogeneity, independent yet often complementary to genetic changes. These include DNA methylation patterns, histone modifications, and chromatin remodeling that create phenotypic diversity without altering the underlying DNA sequence [1]. Epigenetic plasticity enables rapid adaptation to therapeutic pressures and microenvironmental changes, contributing to functional heterogeneity among cancer cells.
Microenvironmental influences further shape heterogeneity through dynamic interactions between tumor cells and their surrounding stroma. The tumor microenvironment (TME) comprises various cell types, including immune cells, cancer-associated fibroblasts, and endothelial cells, which secrete signaling molecules, create metabolic gradients, and exert selective pressures that influence tumor evolution [1]. Spatial variations in oxygen tension, nutrient availability, and mechanical forces within the TME create distinct ecological niches that support and maintain phenotypic diversity.
Spatial and Temporal Dimensions of Heterogeneity
Heterogeneity manifests across both spatial and temporal dimensions, each with distinct clinical implications. Spatial heterogeneity refers to the regional variations observed within a single tumor mass, between primary and metastatic lesions, and among different metastatic sites [1]. For instance, significant genetic discordance often exists between primary tumors and their metastases, with site-specific factors driving genetic divergence after initial colonization [1]. Even within a single tumor tissue block, coexisting subpopulations with different genotypes (e.g., EGFR mutant and wild-type cells in NSCLC) can demonstrate varied responses to targeted therapies [1].
Temporal heterogeneity reflects the dynamic evolution of tumors over time, particularly under therapeutic pressure. successive biopsies have revealed that chemotherapy can alter the mutational spectrum and induce molecular changes, with targeted therapies exerting particularly strong selective pressures that enrich for resistant subclones [1]. The genomic instability of cancer cells, combined with the asymmetric distribution of extrachromosomal DNA to daughter cells, results in continuous evolution and accumulated variation, producing molecular and phenotypic profiles that diverge from the original primary tumor [1].
Table 1: Mechanisms Driving Tumor Heterogeneity
| Mechanism Category | Specific Processes | Impact on Heterogeneity |
|---|---|---|
| Genetic Instability | Point mutations, chromosomal rearrangements, copy number alterations, extrachromosomal DNA amplification | Generates diverse subclones with varying genetic backgrounds and selective advantages |
| Epigenetic Modulation | DNA methylation changes, histone modifications, chromatin remodeling, non-coding RNA regulation | Creates phenotypic plasticity and adaptive responses without genetic changes |
| Microenvironmental Influences | Hypoxia, nutrient gradients, stromal interactions, immune pressure | Creates selective niches that maintain and shape phenotypic diversity |
| Tumor Evolution | Branched evolution, clonal selection, therapy-induced mutagenesis | Drives temporal changes and therapy resistance through Darwinian selection |
Advanced Technologies for Mapping Heterogeneity
Next-Generation Sequencing and Its Applications
Next-generation sequencing (NGS) has emerged as a transformative technology for dissecting tumor heterogeneity at unprecedented resolution. Unlike traditional Sanger sequencing, which processes DNA fragments individually, NGS enables massive parallel sequencing of millions of fragments simultaneously, significantly reducing time and cost while providing comprehensive genomic data [4]. This technological advancement has made large-scale genomic profiling feasible in clinical settings, enabling detailed characterization of heterogeneity patterns.
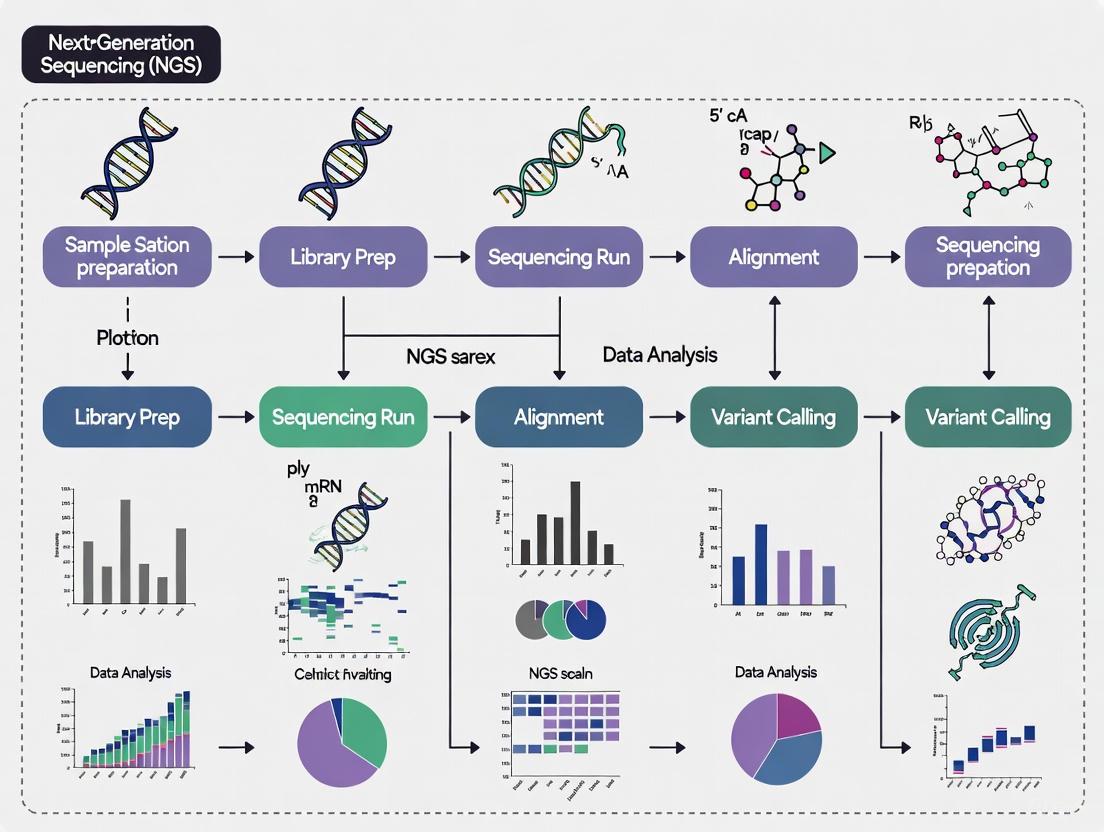
The core NGS workflow involves several critical steps: sample preparation, library construction, sequencing, and data analysis [4]. For tumor heterogeneity studies, sample preparation often requires careful microdissection of distinct morphological regions or single-cell isolation to resolve spatial heterogeneity [5]. Library construction fragments the genomic DNA and attaches adapters for sequencing, with targeted enrichment strategies often employed to focus on cancer-relevant genes [4]. The sequencing phase then generates massive datasets that undergo sophisticated bioinformatic processing for variant calling, copy number analysis, and phylogenetic reconstruction [6].
Various NGS approaches offer complementary insights into heterogeneity. Whole-genome sequencing (WGS) provides the most comprehensive view of genetic alterations, including non-coding regions, while whole-exome sequencing (WES) focuses on protein-coding regions at higher depth [4]. Targeted sequencing panels offer cost-effective profiling of established cancer genes with enhanced sensitivity for detecting low-frequency subclones [7]. Beyond DNA sequencing, RNA sequencing reveals transcriptional heterogeneity and can identify expressed gene fusions, while single-cell RNA sequencing (scRNA-seq) resolves cellular hierarchies and rare subpopulations within tumors [5].
Table 2: NGS Approaches for Studying Tumor Heterogeneity
| NGS Method | Resolution | Key Applications in Heterogeneity | Limitations |
|---|---|---|---|
| Whole-Genome Sequencing (WGS) | Base pair to chromosomal level | Comprehensive identification of SNVs, indels, structural variations, CNVs across entire genome | Higher cost, computational burden, lower depth for rare subclones |
| Whole-Exome Sequencing (WES) | Coding regions at ~100-200x depth | Detection of coding mutations across tumor subclones | Misses non-coding and regulatory alterations |
| Targeted Gene Panels | Selected genes at >500x depth | High-sensitivity detection of low-frequency subclones, clinical utility | Limited to predefined gene set |
| Single-Cell DNA/RNA Sequencing | Individual cell level | Resolution of cellular hierarchies, rare subpopulations, phylogenetic relationships | Technical noise, high cost, computational complexity |
| Spatial Transcriptomics | Tissue context with gene expression | Mapping gene expression patterns to histological locations, revealing microenvironmental niches | Lower resolution than scRNA-seq, specialized equipment |
Spatial Profiling and Artificial Intelligence Approaches
While NGS provides detailed molecular information, preserving spatial context is essential for understanding the architectural organization of heterogeneity. Spatial transcriptomics has emerged as a powerful innovation that enables precise allocation of gene expression to distinct histological features within tissue sections [5]. This technology bridges the gap between traditional histopathology and molecular profiling by capturing transcriptomic data while maintaining spatial coordinates.
In a landmark study investigating mixed neuroendocrine-nonneuroendocrine neoplasms (MiNEN), spatial transcriptomics revealed distinct transcriptional profiles aligned with histologically annotated compartments (e.g., adenocarcinoma, neuroendocrine carcinoma, precursor lesions) [5]. Notably, the study uncovered transcriptomic subclusters within morphologically homogeneous neuroendocrine carcinoma regions in two of three cases, demonstrating that heterogeneity often extends beyond morphological recognition [5]. These subclusters exhibited significant differences in immune regulation, proliferation signaling, and cell-cycle control, with associated divergent predicted chemotherapy-response signatures [5].
Artificial intelligence (AI) and deep learning approaches complement molecular profiling by extracting quantitative morphological features from digital pathology images. In a comprehensive study of breast cancer intra-tumor heterogeneity, researchers developed an AI-based algorithm that extracted and quantified 162 morphological features from whole-slide images [8]. These features demonstrated significant association with patient outcomes, and when combined into an overall heterogeneity score, stratified luminal breast cancer patients into low- and high-risk groups [8]. The AI approach revealed associations between high heterogeneity scores and aggressive tumor characteristics, including larger tumor size, poor differentiation, high proliferation, and low estrogen receptor expression [8].
Experimental Protocols for Heterogeneity Analysis
Multi-Region Sequencing Protocol
Comprehensive assessment of ITH requires sophisticated sampling strategies and analytical approaches. The following protocol outlines a standardized method for multi-region sequencing to resolve spatial heterogeneity:
Sample Collection and Processing:
- Macrodissection of Tumor Regions: Following pathological review of H&E-stained slides, distinct morphological regions are marked by an experienced pathologist for separate analysis [5]. Regions should include various histological patterns and suspected precursor lesions when present.
- DNA Extraction: Using the Maxwell RSC FFPE Plus DNA Kit or equivalent, extract genomic DNA from each macrodissected region. Quantify DNA concentration using fluorometric methods (e.g., Qubit dsDNA HS Assay) and assess purity via spectrophotometry (A260/A280 ratio between 1.7-2.2) [7].
- Quality Control: Ensure minimum DNA input of 20ng with minimal fragmentation. For heavily degraded FFPE samples, consider specialized repair protocols before library preparation.
Library Preparation and Sequencing:
- Library Construction: Using the Agilent SureSelectXT Target Enrichment System or equivalent, prepare sequencing libraries with unique dual indices for each sample to enable multiplexing [7].
- Target Enrichment: Hybridize libraries to custom bait panels (e.g., SNUBH Pan-Cancer v2.0 targeting 544 genes) to enrich for cancer-relevant genomic regions [7].
- Sequencing: Pool libraries in equimolar ratios and sequence on Illumina platforms (NextSeq 550Dx or NovaSeq 6000) to achieve minimum mean coverage of 500x with >80% of bases at 100x coverage [7].
Bioinformatic Analysis:
- Variant Calling: Align reads to reference genome (hg19/GRCh37) using BWA-MEM, then call somatic variants using Mutect2 with minimum variant allele frequency threshold of 2% [7].
- Clonal Decomposition: Use computational tools such as PyClone or SciClone to infer subclonal architecture and cellular prevalences across tumor regions based on variant allele frequencies and copy number profiles.
- Phylogenetic Reconstruction: Construct phylogenetic trees representing evolutionary relationships between tumor regions using tools such as PhyloWGS or CITUP, based on shared and private mutations.
Spatial Transcriptomics Protocol
For integrating gene expression with histological context, the following spatial transcriptomics protocol enables mapping of transcriptional heterogeneity:
Tissue Preparation and Processing:
- Sample Selection: Identify FFPE tissue blocks containing representative tumor regions with diverse morphological patterns. Verify RNA integrity meets quality threshold (DV200 > 50%) [5].
- Sectioning: Cut 5μm sections onto Visium Spatial Gene Expression slides (10x Genomics) containing 6.5mm × 6.5mm capture areas with spatially barcoded oligo-dT primers [5].
- H&E Staining and Imaging: Deparaffinize sections, perform H&E staining, and image at high resolution using a brightfield slide scanner to document tissue morphology and spatial context [5].
Library Construction and Sequencing:
- mRNA Capture: Permeabilize tissue to release mRNA, which binds to spatially barcoded primers on the slide surface [5].
- cDNA Synthesis: Reverse transcribe bound mRNA to create cDNA with spatial barcodes and unique molecular identifiers (UMIs).
- Library Preparation: Amplify cDNA and construct sequencing libraries following the Visium Spatial Gene Expression for FFPE protocol (10x Genomics) [5].
- Sequencing: Sequence libraries on Illumina platforms (NextSeq 550 or equivalent) to achieve minimum depth of 25,000 read pairs per spot [5].
Data Integration and Analysis:
- Alignment and Processing: Process sequencing data through the SpaceRanger pipeline (10x Genomics) to align reads to the reference transcriptome (GRCh38) and assign gene counts to spatial barcodes [5].
- Pathologist Annotation: Annotate histological regions of interest (e.g., adenocarcinoma, neuroendocrine carcinoma, stroma) on the H&E image using Loupe Browser or equivalent software [5].
- Differential Expression: Perform differential gene expression analysis between annotated regions using Seurat or equivalent packages in R [5].
- Gene Set Enrichment: Conduct gene set enrichment analysis (GSEA) to identify pathway-level differences between tumor compartments and subclusters [5].
The Scientist's Toolkit: Essential Research Reagents and Materials
Table 3: Essential Research Reagents for Heterogeneity Studies
| Reagent/Material | Specific Examples | Function in Heterogeneity Research |
|---|---|---|
| Nucleic Acid Extraction Kits | QIAamp DNA FFPE Tissue Kit, Maxwell RSC RNA FFPE Kit | Isolate high-quality DNA/RNA from challenging FFPE specimens for reliable sequencing results |
| Target Enrichment Systems | Agilent SureSelectXT, Illumina TruSight Oncology | Enrich cancer-relevant genomic regions for efficient sequencing and sensitive variant detection |
| Library Preparation Kits | Illumina DNA Prep, NEBNext Ultra II DNA | Prepare sequencing libraries with high complexity and minimal bias for accurate representation of subclones |
| Spatial Transcriptomics Kits | 10x Genomics Visium Spatial Gene Expression for FFPE | Capture transcriptomic data while preserving spatial information in tissue sections |
| Single-Cell Isolation Platforms | 10x Genomics Chromium, BD Rhapsody | Partition individual cells for high-resolution profiling of cellular heterogeneity |
| Multiplex Immunofluorescence Kits | Akoya Biosciences OPAL, Fluidigm Maxpar | Simultaneously detect multiple protein markers in situ to characterize phenotypic heterogeneity |
| Cell Culture Matrices | Cultrex BME, Matrigel | Support 3D organoid growth to model tumor heterogeneity and microenvironment interactions ex vivo |
| NGS Validation Reagents | IDT xGen Lockdown Probes, Archer VariantPlex | Orthogonal validation of discovered variants to confirm heterogeneity patterns |
Clinical Implications and Therapeutic Applications
Impact on Treatment Resistance and Prognosis
Tumor heterogeneity directly enables therapeutic resistance through multiple mechanisms. Pre-existing resistant subclones present within heterogeneous tumors can be selected under therapeutic pressure, leading to outgrowth and clinical relapse [1]. Additionally, functional heterogeneity and cellular plasticity allow tumors to adapt to targeted therapies through non-genetic mechanisms, including epigenetic reprogramming and phenotype switching [1]. The presence of multiple resistance mechanisms within different subclones often necessitates combination therapies that simultaneously target multiple vulnerabilities.
Clinical evidence consistently demonstrates the prognostic significance of heterogeneity metrics. In a real-world study of NGS implementation involving 990 patients with advanced solid tumors, 26.0% harbored tier I variants (strong clinical significance), while 86.8% carried tier II variants (potential clinical significance) [7]. Among patients with tier I variants, 13.7% received NGS-based therapy, with response rates varying by cancer type [7]. This highlights both the clinical actionability of heterogeneity characterization and the current limitations in matching patients to effective therapies based on genomic findings.
Novel Therapeutic Strategies Addressing Heterogeneity
Emerging therapeutic approaches specifically aim to overcome heterogeneity-driven resistance. Combination therapies targeting multiple pathways simultaneously address co-existing driver alterations in different subclones [1]. Evolutionary-informed therapies apply principles from evolutionary biology to suppress resistance development, including adaptive therapy approaches that maintain sensitive cells to compete with resistant populations [1]. Immunotherapeutic strategies leverage the immune system's capacity to recognize diverse neoantigens presented by heterogeneous tumor populations, though heterogeneity can also enable immune escape through various mechanisms [1].
Patient-derived organoids (PDOs) represent a powerful platform for addressing heterogeneity in personalized therapy development. These three-dimensional structures derived from patient tumors retain genetic, epigenetic, and phenotypic features of the primary malignancy, including its heterogeneity patterns [2]. PDOs can be used for high-throughput drug screening to identify effective therapeutic combinations that address the complete spectrum of subclonal populations within an individual's tumor [2]. Co-culture systems incorporating immune cells further enable evaluation of immunotherapeutic approaches in a patient-specific context [2].
The comprehensive characterization of intra- and intertumoral heterogeneity represents both a central challenge and promising frontier in oncology. While NGS technologies have dramatically advanced our understanding of heterogeneity patterns and their clinical implications, translating these insights into improved patient outcomes requires continued methodological innovation. Future progress will depend on several key developments: the integration of multi-omics data across spatial and temporal dimensions; the refinement of single-cell and spatial profiling technologies to enhance resolution and accessibility; the development of sophisticated computational models to predict evolutionary dynamics and therapeutic responses; and the implementation of clinical trial designs that account for and target tumor heterogeneity.
As these advancements mature, they promise to transform oncology from a discipline often confounded by heterogeneity to one that leverages understanding of tumor diversity for more effective, personalized cancer care. The ongoing convergence of sequencing technologies, spatial profiling, artificial intelligence, and functional modeling approaches will ultimately enable clinicians to navigate the complex landscape of tumor heterogeneity and design therapeutic strategies that preempt resistance and improve long-term outcomes for cancer patients.
Next-generation sequencing (NGS) has revolutionized oncology research by enabling comprehensive genomic analysis that transcends traditional single-gene approaches. This transformation has been particularly profound in cancer heterogeneity studies, where pan-cancer genomic profiling provides unprecedented insights into shared molecular pathways across diverse malignancies. The evolution from targeted gene investigations to comprehensive genomic profiling (CGP) has revealed common driver mutations and molecular signatures that operate independently of tumor origin, fundamentally reshaping cancer classification systems. This technical review examines the experimental frameworks, computational methodologies, and research applications of NGS technologies in characterizing tumor heterogeneity, with specific emphasis on their implications for drug discovery and development. We detail standardized protocols for pan-cancer analysis and demonstrate how CGP identifies actionable alterations across cancer types, facilitating biomarker-driven therapeutic development and enabling a more nuanced understanding of treatment resistance mechanisms.
The advent of next-generation sequencing technologies has fundamentally transformed cancer research methodologies, enabling a systematic transition from single-gene investigations to genome-wide analyses. This technological evolution has positioned NGS as a cornerstone of precision oncology, providing researchers with powerful tools to decipher the complex genomic architecture of human malignancies [4]. Pan-cancer analysis approaches leverage NGS to assess frequently mutated genes and genomic abnormalities common to many different cancers, regardless of tumor origin, revealing that although all cancers are molecularly distinct, many share common driver mutations [9].
The implications for cancer heterogeneity research are profound, as NGS facilitates the comprehensive molecular characterization of tumors across traditional histopathological classifications. Large-scale pan-tumor projects such as The Cancer Genome Atlas have made significant contributions to our understanding of DNA and RNA variants across many cancer types, establishing new frameworks for classifying cancers based on molecular signatures rather than solely on tissue of origin [9]. This paradigm shift has been particularly valuable for understanding the molecular basis of therapeutic response and resistance, enabling drug development professionals to identify targetable pathways operating across multiple cancer types.
Technological Evolution: From Single-Gene Assays to Comprehensive Genomic Profiling
The Limitation of Traditional Sequencing Approaches
Traditional approaches to cancer genomic analysis relied heavily on single-gene assays and Sanger sequencing, which presented significant limitations for comprehensive tumor profiling. Single-gene assays typically focus on a small set of genes and ignore the genomic complexity of the tumor from a genetic perspective [4]. These methods cannot detect mutations in non-coding regions that may contribute to cancer development and may miss opportunities for early detection and optimization of treatments [4]. Furthermore, an iterative single-gene testing approach can lead to tissue depletion and repeat biopsies, creating practical challenges in research settings [10].
Sanger sequencing, while groundbreaking for its time, processes one DNA fragment at a time, making it laborious, costly, and time-consuming for large-scale analysis [11]. It exhibits lower sensitivity, with a detection limit typically around 15-20%, and is not cost-effective for analyzing more than 20 targets [11]. While Sanger sequencing offers a familiar workflow and can sequence up to 1000 base pairs, its limited throughput and scalability make it less suitable for comprehensive genomic analyses required for understanding cancer heterogeneity [11].
The NGS Revolution: Principles and Advantages
Next-generation sequencing represents a revolutionary leap in genomic technology, enabling the rapid sequencing of entire genomes or targeted genomic regions with unprecedented speed and accuracy [4]. Unlike traditional Sanger sequencing, NGS allows for massively parallel sequencing, processing millions of fragments simultaneously, which has significantly reduced the time and cost associated with sequencing [4]. This technological advancement has made comprehensive genomic analysis accessible for widespread research use.
The core NGS workflow involves several key steps: sample preparation, library construction, sequencing, and data analysis [4]. During library preparation, genomic samples (DNA or cDNA) are fragmented, and adapters are attached to these fragments [4]. These adapters are essential for attaching the DNA fragments to the sequencing platform and for subsequent amplification and sequencing [4]. The sequencing reaction then converts the library to single-stranded DNA, which is amplified to generate sufficient signal for sequence identification [4]. Various technologies are used for NGS, with Illumina sequencing being the most common, involving library fragments immobilized on a solid surface (flow cell) and amplified to form clusters of identical sequences [4].
Table 1: Comparison of Sequencing Technologies
| Feature | Next-Generation Sequencing | Sanger Sequencing |
|---|---|---|
| Cost-effectiveness | Higher for large-scale projects | Lower for small-scale projects |
| Speed | Rapid sequencing | Time-consuming |
| Application | Whole-genome sequencing, targeted sequencing | Ideal for sequencing single genes |
| Throughput | Multiple sequences simultaneously | Single sequence at a time |
| Data output | Large amount of data | Limited data output |
| Clinical utility | Detects mutations, structural variants | Identifies specific mutations |
NGS provides several critical advantages for cancer research:
- Massively parallel sequencing enables concurrent analysis of millions of DNA fragments [4]
- Markedly increased sequencing depth and sensitivity, detecting low-frequency variants down to ~1% variant allele frequency [11]
- Superior discovery power, detecting novel or rare variants, structural rearrangements, and large chromosomal abnormalities at single-nucleotide resolution [11]
- Comprehensive genomic coverage with sample multiplexing makes NGS cost-effective for screening large numbers of samples [11]
Diagram 1: NGS Workflow for Genomic Profiling
Pan-Cancer Genomic Profiling: Methodologies and Applications
Comprehensive Genomic Profiling Platforms
Comprehensive genomic profiling represents the most advanced application of NGS technology in cancer research, enabling simultaneous analysis of multiple genomic alteration classes across hundreds of cancer-related genes. CGP can detect biomarkers at nucleotide-level resolution and typically comprises all major genomic variant classes - single nucleotide variants (SNVs), indels, copy number variants (CNVs), fusions, and splice variants [10]. Additionally, CGP can detect genomic signatures such as tumor mutational burden (TMB) and microsatellite instability (MSI), maximizing the ability to find clinically actionable alterations [10].
The research utility of CGP is particularly valuable for consolidating biomarker detection into a single multiplex assay, eliminating the need for iterative testing [10]. With a single test, researchers can simultaneously detect both common and rare biomarkers to increase the likelihood of identifying actionable alterations, potentially providing faster results and limiting the input of precious biopsy samples [10]. This approach is especially valuable for rare cancers or limited samples, where tissue availability is a significant constraint.
Table 2: Major NGS Platforms and Their Research Applications
| Platform | Sequencing Technology | Amplification Type | Read Length (bp) | Primary Research Applications |
|---|---|---|---|---|
| Illumina | Sequencing by synthesis | Bridge PCR | 36-300 | Whole-genome sequencing, transcriptome analysis, targeted sequencing |
| Ion Torrent | Sequencing by synthesis | Emulsion PCR | 200-400 | Targeted sequencing, gene expression profiling |
| PacBio SMRT | Single molecule real-time | Without PCR | 10,000-25,000 | Full-length transcript sequencing, complex structural variation |
| Nanopore | Electrical impedance detection | Without PCR | 10,000-30,000 | Real-time sequencing, direct RNA sequencing, epigenetics |
| 454 Pyrosequencing | Pyrosequencing | Emulsion PCR | 400-1000 | Targeted gene sequencing, metagenomics |
Experimental Design and Protocol Implementation
Sample Preparation and Quality Control
Robust sample preparation is fundamental to successful pan-cancer genomic profiling. The first step in NGS involves the extraction and preparation of DNA or RNA from the sample of interest, with quality and quantity of nucleic acids assessed to ensure they meet sequencing requirements [4]. For DNA sequencing, this typically involves extracting genomic DNA from cells or tissues, while RNA sequencing requires isolation of total RNA followed by reverse transcription to generate complementary DNA (cDNA) [4].
For formalin-fixed paraffin-embedded (FFPE) samples - common in cancer research - specific protocols have been established. In validated pan-cancer approaches, manual microdissection of representative tumor areas with sufficient tumor cellularity is performed [7]. Genomic DNA is extracted using specialized kits (e.g., QIAamp DNA FFPE Tissue kit), with concentration quantified using fluorometric methods (e.g., Qubit dsDNA HS Assay) and purity measured by spectrophotometry (e.g., NanoDrop) [7]. Minimum input requirements are typically at least 20 ng of DNA with A260/A280 ratio between 1.7 and 2.2 [7].
Library Preparation and Target Enrichment
Library preparation for pan-cancer profiling typically uses hybrid capture-based methods for target enrichment. The process involves fragmenting genomic DNA, followed by adapter ligation [4] [7]. The hybrid capture method is performed according to standardized protocols using kits such as the Agilent SureSelectXT Target Enrichment System [7]. Final library size and quantity are assessed using bioanalyzer systems (e.g., Agilent 2100 Bioanalyzer) with cutoff parameters typically set at 250-400 bp for size and specific concentration thresholds (e.g., 2nM) [7].
For pan-cancer panels targeting hundreds of genes, quality control throughout library preparation is critical. In the validation of the CANSeqTMKids pan-cancer panel, conditions were optimized to use as low as 20% neoplastic content with 5 ng of nucleic acid input, demonstrating the sensitivity achievable with optimized protocols [13]. The validation established a limit of detection at 5% allele fraction for SNVs and INDELs, 5 copies for gene amplifications, and 1,100 reads for gene fusions [13].
Sequencing and Data Analysis
Pan-cancer profiling utilizes various sequencing platforms depending on research needs. The Illumina sequencing platform is most commonly used, where library fragments are immobilized on a flow cell and amplified through bridge PCR to form clusters [4]. Sequencing-by-synthesis then occurs with fluorescently labeled nucleotides incorporated into growing DNA strands, with the instrument detecting fluorescence in real-time [4]. Other platforms such as Ion Torrent and Pacific Biosciences use different sequencing chemistries and detection methods, such as semiconductor-based detection and single-molecule real-time (SMRT) sequencing, respectively [4].
Bioinformatic analysis represents a critical component of pan-cancer profiling. The enormous data volume generated by NGS presents significant interpretation challenges [4]. Standardized pipelines typically include:
- Sequence alignment to reference genomes (e.g., hg19, GRCh38)
- Variant calling using specialized tools (e.g., Mutect2 for SNVs and small INDELs)
- Annotation of identified variants (e.g., using SnpEff)
- Copy number analysis (e.g., using CNVkit)
- Fusion detection (e.g., using LUMPY) [7]
For comprehensive profiling, additional analyses include microsatellite instability status detection (using tools like mSINGs) and tumor mutational burden calculation [7].
Diagram 2: Pan-Cancer Analysis Framework
Research Applications in Cancer Heterogeneity Studies
Revealing Shared Molecular Pathways Across Cancers
Pan-cancer genomic profiling has enabled the discovery of molecular commonalities across histologically distinct cancer types, revealing that tumors originating from different tissues often share fundamental molecular pathways. The Cancer Genome Atlas (TCGA) Research Network has demonstrated through pan-cancer analysis that molecular similarities among tumors can transcend tissue-of-origin classifications [9]. These findings have reshaped our understanding of cancer biology, highlighting that shared driver mutations exist across many different cancers regardless of tumor origin [9].
This approach has proven particularly valuable for identifying targetable pathways in rare cancers or those with limited treatment options. For example, NTRK fusions have been identified across multiple histologically distinct tumor types, occurring in less than 1% of all cancers but presenting a highly targetable alteration with TRK inhibitors [14]. Similarly, tumor mutational burden (TMB) and microsatellite instability (MSI) have emerged as predictive biomarkers for immunotherapy response across diverse cancer types, demonstrating how pan-cancer analysis can identify therapeutic opportunities that transcend traditional classification systems [10] [14].
Tumor Reclassification and Diagnostic Refinement
Comprehensive genomic profiling has demonstrated significant utility in refining and sometimes reclassifying tumor diagnoses based on molecular features rather than solely on histopathology. In certain cases, comprehensive genomic profiling results may be inconsistent with initial pathological diagnosis and clinical presentation, warranting secondary clinicopathological review to explore alternative diagnostic explanations more consistent with the genomic results [15]. This molecular-driven reclassification can have profound implications for treatment selection and clinical trial eligibility.
A study of 28 cases where CGP results prompted diagnostic re-evaluation demonstrated two primary patterns of reclassification: (1) disease reclassification, involving a change from one distinct indication to another, and (2) disease refinement, where cancers of unknown primary (CUP) origin are assigned a more definitive tumor classification [15]. Specific examples included initial diagnoses of non-small cell lung cancer reclassified to renal cell carcinoma, sarcoma reclassified to melanoma, and neuroendocrine carcinoma reclassified to prostate carcinoma based on molecular findings [15]. These reclassifications enabled more precise therapeutic targeting based on the underlying molecular drivers.
Biomarker Discovery for Targeted Therapies
Pan-cancer approaches have dramatically accelerated the discovery of predictive biomarkers for targeted therapy development. By analyzing molecular patterns across diverse cancer types, researchers can identify genomic alterations that may be rare in individual cancer types but collectively significant as therapeutic targets. Comprehensive genomic profiling can provide more complete information on common oncogenic drivers (like EGFR, KRAS, BRAF) and new information on complex or rare biomarkers (like MET Exon 14, NTRK1, NTRK2, NTRK3) all from a single test [14].
The efficiency of CGP for biomarker discovery is particularly valuable in the context of tissue limitations. Sequential testing of single biomarkers or use of limited molecular diagnostic panels may quickly exhaust sample availability [14]. Professional guidelines now recommend that broad molecular profiling be conducted as part of biomarker testing for eligible patients using a validated test, which can help minimize tissue use and potential wastage [14]. This approach maximizes the information obtained from limited tissue resources, a critical consideration in cancer research.
Table 3: Key Genomic Alterations Identified Through Pan-Cancer Profiling
| Gene/Alteration | Alteration Type | Primary Cancer Types | Targeted Therapies |
|---|---|---|---|
| EGFR | SNVs, Indels | NSCLC, Glioblastoma | EGFR TKIs (erlotinib, osimertinib) |
| KRAS | SNVs | Pancreatic, Colorectal, NSCLC | KRAS G12C inhibitors (sotorasib) |
| BRAF V600E | SNV | Melanoma, Colorectal, NSCLC | BRAF/MEK inhibitors (dabrafenib/trametinib) |
| NTRK fusions | Gene fusion | Multiple rare tumors | TRK inhibitors (larotrectinib, entrectinib) |
| MSI-High | Genomic signature | Colorectal, Endometrial, Multiple | Immune checkpoint inhibitors |
| TMB-High | Genomic signature | Melanoma, Lung, Bladder | Immune checkpoint inhibitors |
The Scientist's Toolkit: Essential Research Reagents and Platforms
Successful implementation of pan-cancer genomic profiling requires specialized reagents, platforms, and computational tools. The following research toolkit outlines essential components for establishing robust NGS workflows in cancer research settings.
Table 4: Research Reagent Solutions for Pan-Cancer Genomic Profiling
| Category | Product/Platform | Specifications | Research Application |
|---|---|---|---|
| Pan-Cancer Panels | TruSight Oncology 500 | 523 cancer-relevant genes, TMB, MSI | Comprehensive genomic profiling for clinical research |
| Targeted Panels | AmpliSeq for Illumina Cancer HotSpot Panel v2 | Hotspot regions of 50 genes | Targeted investigation of known cancer hotspots |
| RNA Pan-Cancer | TruSight RNA Pan-Cancer | 1385 oncology genes | Gene expression, variant and fusion detection |
| Sequencing Platforms | Illumina NextSeq 550 | Desktop sequencer | Flexible throughput for targeted to whole-genome sequencing |
| Automation Systems | Agilent SureSelectXT | Automated target enrichment | Streamlined library preparation for large gene panels |
| Analysis Software | Illumina DRAGEN Bio-IT Platform | Secondary analysis of sequencing data | Ultra-rapid processing of somatic datasets |
| QC Instruments | Agilent 2100 Bioanalyzer | Microfluidics-based analysis | Assessment of DNA/RNA quality and library quantification |
The evolution from single-gene analysis to pan-cancer genomic profiling represents a fundamental transformation in cancer research methodology. Next-generation sequencing technologies have enabled this paradigm shift, providing researchers with powerful tools to decipher the molecular complexity of cancer across traditional histological boundaries. Comprehensive genomic profiling approaches have revealed shared molecular pathways operating across diverse cancer types, facilitating biomarker-driven therapeutic development and enabling more precise tumor classification systems.
For cancer heterogeneity studies, pan-cancer profiling offers unprecedented insights into the molecular basis of treatment response and resistance, enabling drug development professionals to identify targetable alterations that may be rare in individual cancer types but collectively significant. As NGS technologies continue to evolve, with advancements in single-cell sequencing, liquid biopsy applications, and computational analytics, their impact on cancer research will undoubtedly expand, further refining our understanding of cancer biology and accelerating the development of personalized therapeutic approaches.
Next-Generation Sequencing (NGS) has fundamentally transformed oncology research by providing unprecedented capabilities to characterize the complex genomic architecture of cancers. The profound genetic heterogeneity inherent in malignant tumors, both between patients (inter-tumor heterogeneity) and within individual patients (intra-tumor heterogeneity), represents a significant challenge for effective cancer management and treatment [16]. NGS technologies address this challenge by enabling comprehensive genomic profiling that reveals the molecular basis of cancer development, progression, and therapeutic resistance [16] [6]. Through massively parallel sequencing of millions of DNA fragments, NGS facilitates the identification of key genetic alterations across entire genomes, transcriptomes, and epigenomes, providing researchers and clinicians with a powerful toolset for precision oncology [16] [6].
The application of NGS in cancer heterogeneity studies primarily focuses on three critical areas: identifying driver mutations that initiate and promote tumor growth, detecting structural variants that redefine genomic architecture, and reconstructing clonal evolution that underlies treatment resistance and disease progression [16] [17]. This technical guide explores these core applications, detailing the experimental methodologies, analytical frameworks, and practical implementations of NGS that are essential for advancing our understanding of cancer biology and developing more effective, personalized treatment strategies.
NGS Technologies and Workflows for Cancer Genomics
Technology Platforms and Selection Criteria
The selection of an appropriate NGS platform is a critical strategic decision that directly influences the success of cancer genomics research. Second-generation platforms (e.g., Illumina) dominate the landscape with their exceptionally high throughput, low error rates (typically 0.1–0.6%), and cost-effectiveness, making them suitable for a wide range of applications from whole-genome sequencing to targeted panels [16] [18]. Third-generation technologies (e.g., PacBio, Oxford Nanopore) introduce distinctive approaches with their long-read capabilities, enabling better resolution of complex genomic variations, including structural variants and repetitive regions that are challenging for short-read platforms [16] [19].
Table 1: Comparison of Primary NGS Technologies in Cancer Research
| Technology | Read Length | Error Profile | Optimal Applications in Cancer Research | Throughput Range |
|---|---|---|---|---|
| Illumina | 75-300 bp (short) | Low error rate (0.1-0.6%) | Whole genome, exome, transcriptome, targeted sequencing; variant calling | High to ultra-high |
| Oxford Nanopore | Ultra-long (100,000+ bp) | Higher error rate, random errors | Structural variant detection, complex rearrangement resolution, epigenetics | Flexible |
| PacBio | 3-10 kb (long) | Higher error rate, random errors | Full-length transcript sequencing, complex structural variants, haplotype phasing | Medium |
The fundamental advantage of NGS over traditional sequencing methods lies in its massively parallel architecture, which enables concurrent analysis of millions of DNA fragments [16]. This parallel processing provides markedly increased sequencing depth and sensitivity, detecting low-frequency variants down to ~1% variant allele frequency, and significantly shortens turnaround times—an entire human genome can now be sequenced in approximately one week compared with years using Sanger technology [16]. This comprehensive genomic coverage and higher capacity with sample multiplexing make NGS particularly valuable for profiling the complex mutational landscape of tumors [16].
Essential NGS Workflow for Cancer Analysis
The NGS workflow encompasses multiple critical steps from sample preparation to data interpretation, each requiring rigorous quality control to ensure reliable results for cancer heterogeneity studies.
Diagram 1: Comprehensive NGS workflow for cancer genomics applications, spanning experimental, bioinformatics, and interpretation phases.
The workflow begins with sample preparation and quality control, where factors such as nucleic acid quality, tumor content, and appropriate sample type selection directly impact data quality [20]. For cancer samples, particularly formalin-fixed paraffin-embedded (FFPE) tissues, special considerations are necessary due to potential DNA degradation and cross-linking [20]. The library preparation step converts the extracted nucleic acids into sequencing-ready formats, with targeted approaches often preferred for clinical cancer samples due to their higher sensitivity and lower input requirements [20] [21].
Following sequencing, the primary analysis phase involves base calling and quality assessment, while secondary analysis includes alignment to reference genomes and initial variant calling [6]. The tertiary analysis represents a critical stage for cancer studies, encompassing variant annotation, filtering, and interpretation to distinguish driver mutations from passenger mutations, and determining clinical actionability based on evidence databases [6]. Throughout this workflow, quality control metrics must be rigorously monitored, including coverage uniformity, mapping quality, and sensitivity for variant detection [21].
Identifying Driver Mutations in Cancer
Methodologies for Driver Mutation Detection
Driver mutations confer selective growth advantage to cancer cells and have been functionally implicated in oncogenesis, progression, and treatment response [16]. Their identification is crucial for understanding tumor biology and guiding targeted therapy decisions. NGS enables comprehensive detection of driver mutations across multiple variant classes, including single nucleotide variants (SNVs), small insertions and deletions (indels), and copy number alterations [20].
Liquid biopsy approaches using cell-free DNA (cfDNA) have emerged as powerful non-invasive tools for detecting driver mutations, particularly in advanced cancers where tissue biopsies may be challenging to obtain. A study analyzing plasma cfDNA from 117 stage I-IV lung adenocarcinoma cases demonstrated that cancer-specific mutations could be detected in approximately 72% of cases across all stages, with detection rates increasing with advancing disease stage [22]. The concordance between cfDNA and tumor tissue also correlated with disease stage, ranging from 0% in stage I to 75% in stage IV, highlighting the potential of liquid biopsy for identifying therapeutic targets, especially in advanced disease [22].
Table 2: NGS Methodologies for Driver Mutation Identification in Cancer
| NGS Approach | Target Region | Optimal Sample Types | Advantages | Limitations |
|---|---|---|---|---|
| Whole Genome Sequencing (WGS) | Entire genome | High-quality DNA from fresh-frozen tissue | Comprehensive variant detection; identifies novel/non-coding drivers | High cost; large data storage; interpretation challenges |
| Whole Exome Sequencing (WES) | Protein-coding exons (1-2% of genome) | High-quality DNA from blood or fresh-frozen tissue | Focused on coding regions; higher depth than WGS | Misses non-coding variants; not recommended for FFPE |
| Targeted Sequencing Panels | Pre-selected cancer-related genes | FFPE, fine-needle aspirates, liquid biopsies | High sensitivity for low-frequency variants; cost-effective; fast turnaround | Limited to known targets; discovery power restricted |
| Liquid Biopsy NGS | Circulating tumor DNA in blood | Plasma from blood samples | Non-invasive; enables monitoring; captures heterogeneity | Lower sensitivity in early-stage disease; limited by ctDNA fraction |
Experimental Protocol for Targeted Driver Mutation Detection
Targeted NGS panels have become the most widely used approach in clinical oncology research due to their sensitivity, cost-effectiveness, and faster turnaround times [20] [21]. The following protocol outlines a robust method for identifying driver mutations using targeted panels:
Step 1: Sample Preparation and Quality Control
- Extract DNA from tumor samples (FFPE, fresh-frozen, or liquid biopsy) using specialized kits designed for the specific sample type [20].
- Quantify DNA using fluorescence-based methods (e.g., Qubit) rather than UV spectrophotometry to avoid overestimation from contaminants [20].
- Assess DNA quality and fragmentation: for FFPE samples, use agarose gel electrophoresis or fragment analyzers; ensure minimum DNA input of 50 ng for optimal results [21].
- Evaluate tumor content through pathological review; typical minimum requirement is 10-20% tumor cells; perform macrodissection if necessary to enrich tumor content [20].
Step 2: Library Preparation
- For hybridization capture-based approaches: Shear DNA to appropriate fragment sizes (200-500 bp), followed by end-repair, A-tailing, and adapter ligation [21].
- Hybridize with biotinylated oligonucleotide probes targeting cancer-associated genes; the TTSH-oncopanel targeting 61 genes exemplifies this approach [21].
- Wash to remove non-specific binding and amplify captured libraries using PCR (typically 8-12 cycles).
- For amplicon-based approaches: Use multiplex PCR to amplify targeted regions simultaneously.
Step 3: Sequencing and Data Analysis
- Sequence libraries on appropriate platforms (e.g., Illumina MiSeq/NextSeq, Ion Torrent) with sufficient coverage depth (typically 500-1000x for tumor samples) [21].
- Process raw data through bioinformatics pipelines: quality control (FastQC), alignment (BWA, STAR), variant calling (GATK, VarScan), and annotation (ANNOVAR, VEP) [6].
- Filter variants based on quality metrics, population frequency, and functional impact.
- Focus on known driver genes and pathways (e.g., KRAS, EGFR, TP53, PIK3CA) and interpret variants using clinical databases (OncoKB, CIViC, COSMIC) [6] [21].
This protocol, when implemented with rigorous validation, can achieve sensitivity of 98.23% and specificity of 99.99% for variant detection, with variant allele frequency thresholds as low as 2.9% [21].
Detecting Structural Variants in Cancer Genomes
Complex Structural Variants in Cancer
Structural variants (SVs), defined as genetic alterations involving 50 base pairs or more, play crucial roles in cancer development by disrupting tumor suppressor genes, activating oncogenes, and generating novel fusion transcripts [19]. While simple deletions and duplications represent the most common SVs, complex structural variants—involving clustered breakpoints originating from a single event—are increasingly recognized as important drivers in cancer pathogenesis [19].
Recent research has revealed that complex SVs constitute approximately 8.4% of all de novo structural variants, making them the third most common type after simple deletions and tandem duplications [19]. These complex rearrangements can be classified into distinct subtypes, including reciprocal inversions, reciprocal translocations, and templated insertions, each with different mechanistic origins and functional consequences [19]. In cancer genomics, the accurate detection and characterization of these complex SVs is essential for understanding the full spectrum of genomic alterations driving tumorigenesis.
Methodologies for Structural Variant Detection
The detection of structural variants presents significant technical challenges, particularly for short-read sequencing technologies whose limited read lengths often result in fragmented or incomplete representations of complex genomic rearrangements [19]. However, rigorous analytical approaches applied to large-scale datasets have enabled substantial progress in SV detection.
Table 3: Approaches for Structural Variant Detection in Cancer
| Method | Principle | SV Types Detected | Advantages | Limitations |
|---|---|---|---|---|
| Short-read WGS | Detection of discordant read pairs, split reads, and read depth changes | Deletions, duplications, inversions, translocations | High throughput; cost-effective; well-established pipelines | Limited resolution in repetitive regions; may miss complex SVs |
| Long-read WGS | Single-molecule sequencing spanning entire SVs | All SV types, including complex rearrangements | Complete characterization of complex SVs; phased haplotypes | Higher cost; lower throughput; higher error rates |
| Targeted RNA-seq | Sequencing transcriptome to detect fusion genes | Gene fusions, exon-skipping events | Direct evidence of functional consequences; high sensitivity | Limited to expressed genes; misses non-genic SVs |
| Hybrid Approaches | Integration of multiple data types | Comprehensive SV profiling | Complementary strengths; higher validation rate | Complex analysis; resource intensive |
The development of specialized bioinformatics tools has been critical for advancing SV detection. Pipelines incorporating multiple callers (e.g., Manta, Delly, Lumpy) followed by rigorous filtering and manual inspection have demonstrated high validation rates in large-scale studies [19]. For clinical applications, targeted approaches focusing on known cancer-relevant SVs (e.g., BCR-ABL, EML4-ALK, NTRK fusions) offer a practical alternative to whole-genome methods.
Experimental Protocol for Structural Variant Detection
Step 1: Sample and Library Preparation
- Extract high-molecular-weight DNA (≥50 ng) from tumor samples; fresh-frozen tissue is preferred over FFPE for SV detection due to better DNA quality [20].
- Prepare sequencing libraries with insert sizes optimized for SV detection (300-800 bp); larger insert sizes facilitate detection of larger SVs.
- For targeted approaches, use hybridization capture with probes designed to cover known breakpoint regions and cancer-associated genes.
Step 2: Sequencing and Primary Analysis
- Sequence using appropriate platform: short-read (Illumina) for cost-effective coverage, or long-read (PacBio, Oxford Nanopore) for complex regions.
- Achieve sufficient coverage: ≥30x for WGS, ≥100x for targeted approaches.
- Perform quality control: assess read length distribution, mapping quality, and coverage uniformity.
Step 3: SV Calling and Interpretation
- Run multiple SV callers with different detection principles (read-pair, read-depth, split-read, assembly-based).
- Merge and filter calls based on supporting evidence, quality scores, and population frequency.
- Annotate SVs for functional impact: gene disruptions, fusion genes, regulatory element alterations.
- Prioritize cancer-relevant SVs using databases like COSMIC, DGVa, and ClinGen [19] [6].
Long-read sequencing technologies are particularly valuable for resolving complex SVs that remain ambiguous with short-read data. The enhanced contiguity of long reads enables direct spanning of breakpoint junctions and more accurate reconstruction of complex rearrangement structures [19].
Analyzing Clonal Evolution in Tumors
Understanding Tumor Heterogeneity and Evolution
Cancer evolution is characterized by branching phylogenies, where subclones with unique genetic profiles emerge at different time points and anatomical locations, contributing to therapeutic resistance and disease progression [17]. The dynamic nature of tumor clonal architecture presents a major challenge for cancer treatment, as resistant subclones may expand under selective pressure from therapies [17]. Understanding these evolutionary trajectories is therefore essential for designing effective treatment strategies that can anticipate or prevent resistance.
Clonal evolution analysis leverages somatic mutations as natural barcodes to reconstruct the phylogenetic history of tumors and quantify the prevalence of distinct subclones. Advanced cancers typically exhibit significant intra-tumor heterogeneity, with multiple co-existing subclones harboring unique combinations of mutations [23] [17]. Monitoring changes in this clonal composition over time and in response to therapy provides critical insights into the evolutionary dynamics that underlie treatment failure and disease relapse.
Computational Methods for Clonal Reconstruction
Several computational approaches have been developed to reconstruct clonal population structures from bulk or single-cell sequencing data. MyClone represents a recent advancement in this field—a probabilistic method that processes read counts and copy number information of single nucleotide variants from deep sequencing data to determine the mutational composition of clones and their cancer cell fractions [23].
Diagram 2: Computational workflow for clonal evolution analysis from NGS data, showing the progression from raw data to evolutionary interpretation.
Compared to existing methods, MyClone demonstrates enhanced clustering accuracy and cancer cell fraction prediction when applied to deep-targeted sequencing data and bulk tumor sequencing data with deep coverage [23]. Additionally, it achieves substantial improvements in computational speed, making it suitable for clinical applications where timely analysis is critical for treatment decision-making [23].
Experimental Protocol for Clonal Evolution Analysis
Step 1: Study Design and Sample Collection
- Collect multiple samples from the same patient: spatially distinct regions of the same tumor (multi-region sequencing) and/or serial samples over time (longitudinal monitoring) [17].
- Include liquid biopsy samples for non-invasive monitoring of clonal dynamics through circulating tumor DNA [22] [23].
- Sequence matched normal tissue to distinguish somatic from germline variants.
Step 2: Sequencing and Variant Calling
- Perform deep sequencing (≥500x coverage) to detect low-frequency subclones; ultra-deep sequencing (≥1000x) is preferred for liquid biopsy samples [23].
- Use targeted panels focusing on known cancer genes or whole-exome sequencing for discovery approaches.
- Call variants using sensitive methods optimized for low variant allele frequencies.
Step 3: Clonal Reconstruction
- Estimate copy number alterations and tumor purity using tools like ASCAT, Sequenza, or PureCN.
- Calculate cancer cell fractions (CCFs) for each mutation by adjusting variant allele frequencies for copy number and purity.
- Cluster mutations based on their CCF distributions across samples using methods like PyClone, PhyloWGS, or MyClone [23].
- Build phylogenetic trees representing the evolutionary relationships between subclones.
Step 4: Interpretation and Clinical Translation
- Identify truncal mutations (present in all samples) representing early events in tumorigenesis.
- Detect branch-specific mutations associated with spatial heterogeneity or temporal evolution.
- Correlate clonal dynamics with treatment response to identify resistance mechanisms.
- In metastatic breast cancer, applications of this approach have identified mutated genes potentially associated with drug resistance or sensitivity, informing combination therapy strategies [23].
The integration of clonal evolution analysis into clinical trials and practice enables more dynamic treatment adaptation, with approaches such as adaptive therapy, extinction therapy, and reflexive control therapies showing promise for managing evolutionary-driven resistance [17].
Successful implementation of NGS applications in cancer heterogeneity research requires access to specialized reagents, computational tools, and reference databases. The following toolkit compiles essential resources referenced in the studies discussed.
Table 4: Essential Research Reagent Solutions for NGS Cancer Studies
| Resource Category | Specific Examples | Function/Application | Key Features |
|---|---|---|---|
| Targeted Sequencing Panels | Oncomine Precision Assay [22], TTSH-oncopanel (61 genes) [21] | Focused profiling of cancer-related genes | High sensitivity; rapid turnaround; FFPE-compatible |
| Library Prep Kits | Sophia Genetics library kits [21], AmpliSeq panels [20] | Preparation of sequencing libraries from limited samples | Automated compatibility; low input requirements |
| Reference Standards | HD701 reference control [21] | Assay validation and quality control | Known variant profile; enables sensitivity determination |
| Bioinformatics Tools | Sophia DDM [21], MyClone [23], BWA [16], GATK [16] | Data analysis, variant calling, clonal reconstruction | Machine learning integration; user-friendly interfaces |
| Clinical Interpretation Databases | OncoPortal Plus [21], COSMIC [6], dbSNP [6] | Variant annotation and clinical significance | Tiered evidence system; curated therapeutic associations |
In addition to wet laboratory reagents, computational resources play an indispensable role in NGS cancer studies. Cloud-based platforms have streamlined the storage, management, and processing of the vast datasets generated by NGS technologies, making large-scale genomic analyses more accessible to research institutions and clinical laboratories [6]. These platforms often integrate with established bioinformatics pipelines and databases, facilitating the translation of raw sequencing data into biologically and clinically meaningful insights.
Next-Generation Sequencing has fundamentally transformed our approach to studying and treating cancer by providing unprecedented insights into driver mutations, structural variants, and clonal evolution. The applications detailed in this technical guide—from targeted detection of actionable mutations to comprehensive reconstruction of tumor evolutionary histories—represent powerful approaches for addressing the profound challenge of cancer heterogeneity. As these methodologies continue to mature and integrate into clinical practice, they promise to advance personalized cancer treatment by matching patients with optimal therapies based on the molecular characteristics of their tumors.
Looking ahead, several emerging trends are poised to further expand the impact of NGS in cancer research. The integration of multi-omics data—combining genomic, transcriptomic, epigenomic, and proteomic profiles—offers a more comprehensive understanding of cancer biology and therapeutic vulnerabilities [16] [6]. Single-cell sequencing technologies enable the resolution of cellular heterogeneity within tumors at unprecedented resolution, revealing rare subpopulations that may drive resistance and metastasis [6] [24]. Spatial transcriptomics preserves the architectural context of cellular communities within tumor microenvironments, adding another dimension to our understanding of cancer heterogeneity [16]. Finally, the application of artificial intelligence and machine learning to NGS data holds tremendous potential for pattern recognition, predictive modeling, and the discovery of previously unrecognized relationships between genomic alterations and clinical outcomes [16] [6].
As these advancements mature, the ongoing challenges of data interpretation, standardization, accessibility, and ethical considerations must be addressed to fully realize the potential of NGS in cancer research and clinical oncology [6]. Through continued dedication to technological innovation and biological discovery, NGS will remain an indispensable tool in the ongoing effort to understand and overcome cancer heterogeneity.
The evolution of DNA sequencing from the first-generation Sanger method to massively parallel Next-Generation Sequencing (NGS) represents a foundational technological revolution in genomics research. This shift has been particularly transformative in oncology, enabling unprecedented insights into the complex genomic landscape of cancer heterogeneity. NGS technologies now allow researchers to decode entire cancer genomes, transcriptomes, and epigenomes at single-nucleotide resolution, providing the comprehensive data required to decipher tumor evolution, clonal dynamics, and resistance mechanisms. This technical review examines the core principles, performance metrics, and experimental methodologies underlying this paradigm shift, with a specific focus on applications in cancer heterogeneity studies that are driving the development of personalized therapeutic strategies.
The landscape of genomic analysis has undergone a radical transformation since the completion of the Human Genome Project, which relied on Sanger sequencing and required over a decade and nearly $3 billion to generate the first human genome sequence [25]. The advent of massively parallel NGS technologies has fundamentally redefined the scale and scope of possible genetic investigations, compressing similar sequencing endeavors into a matter of hours at a cost below $1,000 per genome [25]. This dramatic improvement in throughput and cost-efficiency has positioned NGS as an indispensable tool in molecular biology and clinical diagnostics.
In oncology research, this technological shift has been particularly impactful. Cancer is fundamentally a disease of the genome, characterized by accumulating genetic alterations that drive uncontrolled growth, metastasis, and therapeutic resistance [16]. The complex heterogeneity within tumors – both spatial and temporal – presents a formidable scientific challenge that requires deep, comprehensive genomic profiling to unravel. While Sanger sequencing provided excellent accuracy for focused studies of individual genes, its low-throughput, serial approach was ill-suited for capturing the full genomic complexity of malignancies [4]. NGS has filled this critical gap, enabling researchers to simultaneously interrogate millions of DNA fragments across hundreds to thousands of cancer-related genes in a single assay [16] [4].
The clinical implementation of NGS in oncology has demonstrated significant utility, with real-world studies showing that approximately 26% of advanced cancer patients harbor clinically actionable mutations detectable through comprehensive NGS profiling [7]. This capability has transformed cancer from a tissue-defined disease to a molecularly-defined constellation of subtypes, each with distinct therapeutic vulnerabilities. This whitepaper examines the technical foundations of this sequencing revolution, its application in deciphering cancer heterogeneity, and the methodological frameworks enabling these advances.
Fundamental Principles: Sanger Sequencing vs. Massively Parallel NGS
Core Methodological Differences
The fundamental distinction between Sanger sequencing and NGS lies in their underlying biochemistry and processing architecture. Sanger sequencing, also known as chain-termination sequencing, relies on the selective incorporation of dideoxynucleoside triphosphates (ddNTPs) during DNA synthesis [26]. These chain-terminating nucleotides lack the 3'-hydroxyl group necessary for continued DNA strand elongation, resulting in DNA fragments of varying lengths that can be separated by capillary electrophoresis and detected via fluorescent labels [26] [12]. This process generates a single, long contiguous read per reaction, typically ranging from 500 to 1,000 base pairs, with exceptional per-base accuracy exceeding 99.999% (Phred score > Q50) [26].
In contrast, NGS employs massively parallel sequencing, simultaneously processing millions to billions of DNA fragments in a single run [16] [12]. The most prevalent NGS methodology – Sequencing by Synthesis (SBS) – utilizes fluorescently-labeled, reversible terminator nucleotides that are incorporated one base at a time across millions of clustered DNA fragments immobilized on a solid surface [27] [26]. After each incorporation cycle, the fluorescent signal is imaged, the terminator is cleaved, and the process repeats, building up the DNA sequence base by base [27]. This parallel architecture enables the extraordinary throughput that characterizes NGS technologies.
Performance and Economic Comparison
The transition from Sanger sequencing to NGS has fundamentally altered the economics and capabilities of genomic analysis. The table below summarizes the key performance characteristics of each approach:
Table 1: Performance and Economic Comparison of Sanger Sequencing vs. NGS
| Aspect | Sanger Sequencing | Next-Generation Sequencing (NGS) |
|---|---|---|
| Throughput | Single DNA fragment at a time [16] | Millions to billions of fragments simultaneously [16] [12] |
| Sequencing Speed | Years for a human genome [16] | Approximately one week for a human genome [16] |
| Cost Trajectory | ~$3 billion for first human genome [25] | Under $1,000 per human genome [25] |
| Detection Sensitivity | ~15-20% variant allele frequency [16] | ~1% variant allele frequency [16] |
| Read Length | 500-1000 base pairs [26] | 50-300 bp (short-read); 10,000+ bp (long-read) [12] |
| Applications in Oncology | Single gene mutation analysis [4] | Comprehensive genomic profiling, tumor heterogeneity studies, liquid biopsies [16] [4] |
| Data Output | Limited data per run [4] | Gigabases to terabases per run [27] |
| Economic Efficiency | Cost-effective for 1-20 targets [16] | Cost-effective for large-scale projects and multiple samples [16] [28] |
The economic advantage of NGS becomes particularly evident in large-scale projects. While Sanger sequencing maintains lower per-run costs for small targets, its cost structure scales linearly with the number of sequences analyzed [28]. In contrast, NGS leverages multiplexing capabilities to process hundreds of samples simultaneously, dramatically reducing the per-sample cost for comprehensive genomic analyses [26]. This efficiency has made large-scale cancer genomics initiatives economically feasible, enabling population-level studies of cancer genomics and biomarker discovery.
NGS Methodologies and Experimental Frameworks in Cancer Research
Core NGS Workflow for Cancer Genomics
The implementation of NGS in cancer research follows a standardized workflow with specific considerations for tumor samples. The process begins with sample acquisition, which can include tumor tissue biopsies, liquid biopsies (blood samples for circulating tumor DNA analysis), or single-cell suspensions [4] [7]. Nucleic acids are then extracted, with quality control being particularly critical for degraded samples from formalin-fixed paraffin-embedded (FFPE) tissues commonly used in pathology archives [7].
Library preparation represents a crucial step where DNA is fragmented, and platform-specific adapters are ligated to the fragments [4]. For targeted sequencing approaches commonly used in oncology, hybrid capture methods using biotinylated probes to enrich for cancer-relevant genes are employed [7]. The prepared libraries are then sequenced using NGS platforms, with Illumina's Sequencing by Synthesis technology currently dominating the clinical oncology landscape due to its high accuracy and throughput [27] [12].
Table 2: Key NGS Platforms and Their Applications in Cancer Research
| Platform | Sequencing Technology | Read Length | Primary Applications in Oncology | Limitations |
|---|---|---|---|---|
| Illumina | Sequencing by Synthesis (SBS) | 75-300 bp [12] | Whole genome, exome, and transcriptome sequencing; targeted panels [27] [12] | Higher cost for large genomes; short reads limit structural variant detection [12] |
| Oxford Nanopore | Nanopore sensing | 10,000-30,000 bp [12] | Detection of large structural variants, fusion genes, epigenetic modifications [12] | Higher error rates (up to 15%) requiring computational correction [12] |
| Pacific Biosciences (PacBio) | Single Molecule Real-Time (SMRT) | 10,000-25,000 bp [12] | Characterization of complex genomic regions, haplotype phasing [12] | Higher cost per sample; requires high molecular weight DNA [12] |
| Ion Torrent | Semiconductor sequencing | 200-400 bp [12] | Targeted sequencing; rapid turnaround time applications [12] | Homopolymer sequence errors [12] |
The final stage involves bioinformatic analysis of the massive datasets generated. This includes sequence alignment to reference genomes, variant calling to identify mutations, and interpretation of the clinical significance of detected alterations [4]. In cancer studies, specialized algorithms are employed to distinguish somatic (tumor-specific) mutations from germline variants, determine tumor mutational burden, assess microsatellite instability, and reconstruct clonal architecture from variant allele frequencies [7].
Essential Research Reagents and Solutions for NGS in Cancer Studies
The successful implementation of NGS in cancer research requires specialized reagents and materials optimized for challenging tumor-derived samples. The following table details key components of the NGS workflow:
Table 3: Essential Research Reagents and Solutions for NGS in Cancer Studies
| Reagent Category | Specific Examples | Function in NGS Workflow | Considerations for Cancer Samples |
|---|---|---|---|
| Nucleic Acid Extraction Kits | QIAamp DNA FFPE Tissue Kit [7] | Isolation of high-quality DNA from tumor samples | Optimized for cross-linked FFPE DNA; removes inhibitors that affect library preparation |
| Library Preparation Kits | Agilent SureSelectXT Target Enrichment System [7] | Fragmentation, adapter ligation, and target enrichment | Efficient capture of degraded DNA; compatibility with low-input samples from biopsies |
| Target Enrichment Panels | SNUBH Pan-Cancer v2.0 (544 genes) [7] | Selective capture of cancer-relevant genomic regions | Comprehensive coverage of oncogenes, tumor suppressors, biomarkers (TMB, MSI) |
| Sequencing Reagents | Illumina SBS chemistry [27] | Nucleotides and enzymes for sequence determination | Balanced error rates; optimized for variant detection at low allele frequencies |
| Quality Control Tools | Qubit dsDNA HS Assay, Bioanalyzer [7] | Quantification and quality assessment of DNA and libraries | Sensitive detection for limited samples; accurate sizing of fragmented DNA |
| Bioinformatics Tools | MuTect2, CNVkit, LUMPY [7] | Variant calling, copy number analysis, fusion detection | Specialized algorithms for low VAF detection; tumor-normal comparison |
Applications in Cancer Heterogeneity Studies
Deciphering Tumor Evolution and Clonal Architecture
The massively parallel nature of NGS has enabled unprecedented insights into the dynamic landscape of intratumoral heterogeneity, a fundamental challenge in oncology. Deep sequencing approaches allow researchers to identify and quantify multiple subclonal populations within individual tumors based on their unique mutational signatures [16]. By sequencing at high coverage depths (often >500x for tumor samples), NGS can detect minor subclones present at frequencies as low as 1-2%, which would be undetectable by Sanger sequencing with its ~15-20% detection limit [16] [7].
Longitudinal application of NGS through liquid biopsies provides a non-invasive method for monitoring clonal dynamics during treatment [16] [4]. The analysis of circulating tumor DNA (ctDNA) in blood samples enables real-time tracking of tumor evolution, including the emergence of resistant subclones often months before clinical progression is radiographically detectable [25] [4]. This capability has profound implications for adaptive therapy approaches and understanding resistance mechanisms to targeted therapies.
Biomarker Discovery and Therapeutic Targeting
NGS has dramatically expanded the repertoire of actionable biomarkers in oncology, moving beyond single-gene markers to comprehensive mutational signatures. By simultaneously profiling hundreds of cancer-associated genes, NGS panels can identify targetable alterations across multiple signaling pathways, including EGFR, ALK, ROS1, BRAF, and KRAS, among others [16] [7]. This comprehensive approach is particularly valuable for tumors with complex genomic landscapes, such as pancreatic, ovarian, and glioblastoma malignancies.
The clinical impact of this comprehensive profiling is significant. Real-world studies demonstrate that approximately 13.7% of patients with advanced solid tumors received genomically-matched therapies based on NGS findings that would not have been identified through conventional testing methods [7]. Among these NGS-guided treatments, 37.5% achieved partial responses with a median treatment duration of 6.4 months, highlighting the therapeutic relevance of comprehensive genomic profiling [7].
The shift from Sanger sequencing to massively parallel NGS represents one of the most significant technological advancements in modern oncology research. This transition has enabled the comprehensive molecular characterization necessary to decipher cancer heterogeneity, evolution, and therapeutic resistance. As the field continues to evolve, several emerging trends promise to further enhance the capabilities of NGS in cancer research.
Third-generation sequencing technologies, including single-molecule real-time (SMRT) sequencing from PacBio and nanopore sequencing from Oxford Nanopore, are overcoming limitations of short-read NGS by providing long reads that span complex genomic regions and structural variations [12]. The integration of artificial intelligence and machine learning with NGS data is enhancing pattern recognition in mutational signatures and predicting therapeutic responses [29]. Multiomic approaches that combine genomic, transcriptomic, epigenomic, and proteomic data from the same sample are providing unprecedented insights into the functional consequences of genetic alterations [29]. Spatial sequencing technologies are adding geographical context to molecular profiles, preserving the architectural relationships between tumor subclones and their microenvironment [29].
In conclusion, the revolution in DNA sequencing technology from Sanger to NGS has fundamentally transformed our approach to cancer research and treatment. The massively parallel nature of NGS provides the necessary throughput, sensitivity, and comprehensiveness to unravel the complex genomic landscape of malignant diseases. As these technologies continue to evolve and integrate with complementary analytical approaches, they promise to further accelerate the development of personalized cancer medicine and deepen our understanding of cancer biology.
Next-generation sequencing (NGS) has emerged as a pivotal technology in oncology, fundamentally transforming our approach to cancer diagnosis, classification, and treatment by revealing the extensive genomic diversity inherent in malignant diseases [4]. This technological revolution enables massive parallel sequencing, processing millions of DNA fragments simultaneously, thereby providing unprecedented insights into the genetic alterations that drive cancer progression [4]. The ability to conduct comprehensive genomic profiling has shifted the paradigm from histology-based to molecularly-driven cancer classification, facilitating the development of precision medicine approaches where treatments are tailored to the specific genetic profile of a patient's tumor [4] [30]. Within this context, understanding and linking genomic diversity to clinical outcomes has become a central focus of modern cancer research, with profound implications for prognostication, therapeutic targeting, and drug development.
Cancer heterogeneity operates at multiple levels, including inter-tumor heterogeneity (variations between different patients' tumors) and intra-tumor heterogeneity (genetic diversity within a single tumor) [31]. Intra-tumor heterogeneity (ITH) represents a particular challenge clinically because it provides the genetic variation that may drive cancer progression and lead to emergence of drug resistance [31]. Large-scale pan-cancer analyses of whole-genome sequences from 2,658 cancer samples spanning 38 cancer types have revealed that nearly all informative samples (95.1%) contain evidence of distinct subclonal expansions with frequent branching relationships between subclones [31]. This pervasive heterogeneity underscores the critical need for advanced genomic tools that can accurately characterize the complex genetic landscape of cancers to improve patient outcomes.
Molecular Classification and Prognostic Stratification Across Cancers
Genomic Subtyping in Myeloid Neoplasms
Comprehensive genomic analysis has enabled refined classification of myeloid neoplasms based on molecular alterations rather than traditional morphological criteria alone. A landmark study of 1,585 patients with myeloproliferative neoplasms (MPN), myelodysplastic neoplasms (MDS), MDS/MPN overlap conditions, and aplastic anemia utilized unsupervised clustering of 53 recurrent genomic abnormalities to identify 10 distinct genomic groups with significant prognostic implications [32].
Table 1: Genomic Groups and Prognostic Associations in Myeloid Neoplasms
| Genomic Group | Defining Genetic Features | Associated Disease Subtypes | Prognostic Profile |
|---|---|---|---|
| DP1 | JAK2 mutations | MPN | Very favorable |
| DP5 | CALR mutations | MPN | Very favorable |
| DP10 | SF3B1 mutations | MDS | Favorable |
| DP8 | DDX41 mutations, chromosome 1q derivatives | MDS/MPN | Favorable |
| DP2 | TP53 mutations, complex karyotypes | MDS | Very adverse |
| DP9 | NPM1 mutations, other AML-related mutations | MDS/MPN, AML | Very adverse |
| DP7 | SETBP1 mutations | MDS/MPN, CMML | Adverse |
This genomic classification system demonstrated superior prognostic stratification compared to conventional diagnostic categories, with groups DP1 and DP5 (characterized by JAK2 and CALR mutations, respectively) showing very favorable prognoses, while groups DP2, DP7, and DP9 demonstrated markedly adverse outcomes across disease subtypes [32]. Importantly, the study also found that allogeneic hematopoietic stem cell transplantation improved survival in high-risk groups such as DP2, DP7, and DP9, providing crucial evidence for treatment personalization based on genomic classification [32].
Transcriptomic Subtyping in Solid Tumors
Similar advances have been achieved in solid tumors through transcriptomic-based classification. In gastric cancer (GC), integrative analysis of multi-omics data has identified three distinct molecular subtypes (CS1, CS2, and CS3) with significant differences in survival outcomes, tumor immune microenvironment composition, and therapeutic responses [33].
Table 2: Molecular Subtypes and Characteristics in Gastric Cancer
| Subtype | Survival Profile | TME Characteristics | Therapeutic Implications |
|---|---|---|---|
| CS1 | Intermediate | Mixed immune landscape | Moderate chemo-response |
| CS2 | Poor | Immunologically exhausted | Poor immunotherapy response |
| CS3 | Favorable | Immunologically active | Enhanced chemo and immunotherapy response |
The CS3 subtype, characterized by an immunologically active tumor microenvironment, demonstrated favorable prognosis and enhanced response to both chemotherapy and immunotherapy, while the CS2 subtype exhibited immunological exhaustion and poor outcomes [33]. Notably, Cathepsin V (CTSV) was identified as a potential classifier and prognostic marker, with significant downregulation in the favorable CS3 subtype and upregulation in the poor-prognosis CS2 subtype [33].
In soft tissue sarcomas (STS), transcriptomic profiling of 102 high-grade samples identified four distinct transcriptomic clusters (TCs) with independent prognostic value for both overall survival (OS) and disease-free survival (DFS) [34]. This molecular classification outperformed both clinical-based prognostic tools (SARCULATOR nomograms) and molecular-based signatures (CINSARC), representing one of the first molecular classifications capable of predicting OS in STS [34]. Furthermore, DNA sequencing analysis revealed numerous potentially actionable molecular targets across different transcriptomic subtypes, highlighting the dual utility of genomic profiling for both prognostication and therapeutic targeting [34].
Technical Foundations: NGS Methodologies and Workflows
NGS Technology Platforms and Selection Criteria
The successful implementation of genomic profiling in cancer research requires careful selection of appropriate NGS methods based on specific research questions and sample characteristics. The major NGS approaches include:
- Whole Genome Sequencing (WGS): Provides comprehensive analysis of the entire genome, ideal for discovery of novel genomic alterations but requires high-quality, high-quantity DNA input [20].
- Whole Exome Sequencing (WES): Focuses on protein-coding regions, offering higher coverage depth for detecting low allele frequency somatic variants while generating more manageable datasets [20].
- Targeted Sequencing Panels: Enables focused analysis of preselected cancer-related genes with lowest input requirements and greatest compatibility with compromised samples like FFPE tissue [20].
- RNA Sequencing: Facilitates transcriptome analysis, gene fusion detection, and expression profiling, with both whole transcriptome and targeted approaches available [20].
Table 3: NGS Method Compatibility with Clinical Sample Types
| NGS Method | Recommended Sample Types | Input Requirements | Key Applications |
|---|---|---|---|
| Whole Genome Sequencing | Fresh-frozen tissue, blood | High (typically 1 µg gDNA) | Novel alteration discovery, comprehensive profiling |
| Exome Sequencing | Fresh-frozen tissue, blood | Moderate (50-500 ng gDNA) | Coding variant detection, moderate throughput |
| Targeted Panels | FFPE, fine-needle aspirates, liquid biopsy | Low (10 ng minimum) | Clinical mutation profiling, therapy selection |
| RNA Sequencing | Fresh-frozen tissue, FFPE, single cells | Varies by method (5 ng-2 µg) | Fusion detection, expression profiling, immune analysis |
Standardized Experimental Workflow for Tumor Genomic Profiling
A robust NGS workflow for cancer heterogeneity studies involves multiple critical steps, each requiring stringent quality control measures to ensure reliable results:
Sample Preparation and Library Construction: The process begins with nucleic acid extraction from tumor samples, most commonly from formalin-fixed paraffin-embedded (FFPE) tissue, although fresh-frozen tissue typically yields superior quality material [20]. The quality and quantity of extracted DNA/RNA are assessed using fluorescence-based methods, with particular attention to factors such as tumor cellularity (typically requiring 10-20% minimum tumor content), nucleic acid concentration, and integrity [20]. For FFPE samples, which are often fragmented and damaged, targeted amplicon sequencing approaches are recommended due to their compatibility with shorter DNA fragments [20].
Library construction involves fragmenting the genomic DNA to appropriate sizes (around 300 bp) and attaching platform-specific adapters to facilitate amplification and sequencing [4]. For targeted sequencing approaches, an enrichment step is necessary to isolate coding sequences, typically accomplished through PCR using specific primers or exon-specific hybridization probes [4]. The quality of the final library is assessed using methods such as quantitative PCR to ensure both quantity and quality meet sequencing requirements [4].
Sequencing Reaction and Data Generation: The most commonly used NGS technology, Illumina sequencing, involves immobilizing library fragments on a flow cell surface followed by amplification through bridge PCR to generate clusters of identical sequences [4]. Sequencing-by-synthesis is then performed using fluorescently labeled nucleotides, with the instrument detecting fluorescence emissions in real-time to determine the sequence of each cluster [4]. Other platforms such as Ion Torrent and Pacific Biosciences employ different detection chemistries, including semiconductor-based detection and single-molecule real-time (SMRT) sequencing, respectively [4].
Bioinformatic Analysis and Interpretation: The massive datasets generated by NGS require sophisticated bioinformatic processing, beginning with base calling, quality assessment, and alignment to reference genomes [4]. Subsequent variant calling identifies somatic mutations, copy number alterations, structural variants, and other genomic abnormalities. For intra-tumor heterogeneity studies, specialized algorithms are employed to estimate cancer cell fractions and reconstruct subclonal architecture by clustering mutations based on their variant allele frequencies and adjusting for local copy number and sample purity [31]. The final step involves functional annotation of identified variants and assessment of their potential clinical significance using established classification frameworks [7].
NGS Workflow for Cancer Genomics: From Sample to Clinical Report
The Scientist's Toolkit: Essential Research Reagent Solutions
Successful implementation of cancer genomic studies requires access to specialized reagents and tools designed for NGS applications. The following table outlines key solutions essential for researchers in this field:
Table 4: Essential Research Reagent Solutions for Cancer Genomics
| Reagent/Tool Category | Specific Examples | Primary Function | Technical Considerations |
|---|---|---|---|
| Nucleic Acid Extraction Kits | QIAamp DNA FFPE Tissue Kit, Qubit dsDNA HS Assay | Isolation and quantification of high-quality nucleic acids from various sample types | FFPE-compatible kits essential for clinical samples; fluorescence-based quantification preferred over UV spectrophotometry |
| Target Enrichment Systems | Agilent SureSelectXT, Illumina Nextera Flex | Selective capture of genomic regions of interest | Hybridization-based vs. amplicon-based approaches; panel size and coverage uniformity critical for performance |
| Library Preparation Kits | Illumina TruSeq, Ion Torrent Oncomine | Conversion of extracted nucleic acids to sequencing-ready libraries | Input requirements, hands-on time, and compatibility with degraded samples (e.g., FFPE) are key selection factors |
| Sequencing Platforms | Illumina NextSeq, NovaSeq; Ion Torrent Genexus | Massive parallel sequencing of prepared libraries | Throughput, read length, error profiles, and cost per sample influence platform selection for specific applications |
| Bioinformatic Tools | Mutect2, CNVkit, LUMPY, GATK | Data analysis, variant calling, and interpretation | Open-source vs. commercial solutions; computational resource requirements and scalability considerations |
Advanced Applications: Single-Cell Resolution and Pan-Cancer Patterns
Dissecting Tumor Ecosystems at Single-Cell Resolution
Recent technological advances have enabled the application of single-cell sequencing to dissect tumor heterogeneity at unprecedented resolution. A comprehensive analysis of cutaneous melanoma (CM), acral melanoma (AM), and uveal melanoma (UM) ecosystems at single-cell resolution revealed significant differences in cellular composition, molecular characteristics, and genetic variation patterns across these anatomical sites [35].
The study identified oxidative phosphorylation (OXPHOS) as a critical driver of tumor cell evolution across melanoma subtypes, with abnormal ribosomal gene expression observed specifically in uveal melanoma [35]. Notably, UM tumor cells could be categorized into active and inactive states based on proliferation and DNA damage assessment, with inactive cells showing significant differential expression of ribosomal protein genes (RPL19, RPL26, RPS13) and upregulation of tumor suppressors TP53, PTEN, and RB1 [35]. These findings suggest that aberrant ribosome biogenesis may trigger tumor suppressor-mediated responses, potentially contributing to non-proliferative cell states in UM.
Analysis of the immune microenvironment revealed that AM and UM exhibit stronger immunosuppressive characteristics compared to CM, with OXPHOS contributing to T-cell cytotoxicity dysregulation in CM and AM, while interferon-γ signaling plays a crucial role in UM [35]. Additionally, tumor cells were found to potentially induce T-cell dysfunction through specific biological signals such as MIF-CD74 and HLA-E-NKG2A interactions, highlighting potential therapeutic targets for overcoming immune evasion [35].
Pan-Cancer Patterns of Intra-Tumor Heterogeneity
Large-scale pan-cancer analyses have provided fundamental insights into the patterns and clinical significance of intra-tumor heterogeneity across cancer types. The Pan-Cancer Analysis of Whole Genomes (PCAWG) consortium, which analyzed 2,658 tumors across 38 cancer types, demonstrated that ITH is a pervasive feature of cancer, with nearly all informative samples (95.1%) containing evidence of distinct subclonal expansions [31].
This comprehensive analysis revealed several key findings: positive selection of subclonal driver mutations occurs across most cancer types; cancer type-specific patterns exist for subclonal driver gene mutations, fusions, structural variants, and copy number alterations; and dynamic changes in mutational processes frequently occur between subclonal expansions [31]. The study also developed robust consensus approaches for variant calling, copy number analysis, and subclonal reconstruction, providing standardized methods for ITH quantification across different cancer types [31].
Cancer Evolution: From Initiation to Therapy Resistance
Clinical Translation and Therapeutic Implications
Real-World Clinical Implementation
The translation of NGS-based genomic profiling from research to clinical practice has demonstrated significant impact on patient management. A real-world study of 990 patients with advanced solid tumors who underwent NGS testing using a 544-gene panel found that 26.0% of patients harbored tier I variants (strong clinical significance), and 86.8% carried tier II variants (potential clinical significance) [7]. Among patients with tier I variants, 13.7% received NGS-based therapy, with particularly high implementation rates in thyroid cancer (28.6%), skin cancer (25.0%), gynecologic cancer (10.8%), and lung cancer (10.7%) [7].
Notably, patients who received NGS-guided therapy showed promising treatment outcomes, with 37.5% achieving partial response and 34.4% achieving stable disease among those with measurable lesions [7]. The median treatment duration was 6.4 months, demonstrating the clinical utility of NGS-based treatment selection in advanced cancer patients [7].
Liquid Biopsy and Monitoring Applications
Liquid biopsy approaches using circulating tumor DNA (ctDNA) analysis have emerged as powerful tools for non-invasive cancer monitoring and heterogeneity assessment. The variability in ctDNA detection across cancer types is an important consideration, with studies showing that ctDNA is detectable in more than 75% of patients with advanced pancreatic, colorectal, gastroesophageal, hepatocellular, and various other cancers, but less frequent (under 50% of cases) in primary brain, prostate, thyroid, and renal cancers [30].
Variant allele frequency (VAF) in ctDNA has emerged as a promising biomarker with multiple clinical applications, serving as a surrogate for mutation clonality and a tool for evaluating genomic heterogeneity [30]. This metric provides insights into tumor burden, treatment efficacy, and the dynamics of tumor evolution and resistance mechanisms, enabling real-time monitoring of therapeutic response and disease progression [30].
The integration of comprehensive genomic profiling through NGS technologies has fundamentally transformed our understanding of cancer heterogeneity and its clinical implications. Molecular classification systems based on genomic and transcriptomic signatures have demonstrated superior prognostic capability compared to traditional histopathological approaches across diverse cancer types, enabling more accurate risk stratification and treatment personalization [32] [33] [34].
The future of cancer prognostication and classification lies in the continued refinement of multi-omics approaches that integrate genomic, transcriptomic, epigenomic, and proteomic data to capture the full complexity of tumor biology [33] [30]. Advancements in single-cell technologies will further enhance our ability to dissect intra-tumor heterogeneity and understand its role in therapy resistance and disease progression [35]. Additionally, the growing application of liquid biopsy approaches promises to facilitate non-invasive monitoring of tumor evolution and early detection of treatment resistance [30].
As these technologies continue to evolve and become more accessible, molecular classification based on genomic diversity will increasingly form the foundation of precision oncology, enabling the development of more effective, personalized therapeutic strategies that account for the unique genetic landscape of each patient's cancer. The ongoing challenge for researchers and clinicians will be to translate this increasingly complex molecular information into clinically actionable insights that ultimately improve patient outcomes.
Advanced NGS Methodologies for Mapping Heterogeneity in Research and Clinical Practice
Next-Generation Sequencing (NGS) has fundamentally transformed oncology, enabling comprehensive genomic profiling that guides precision therapy [16]. While bulk RNA sequencing provided initial insights, it obscures a critical dimension of cancer: cellular heterogeneity. Tumors are not mere masses of identical cells but complex ecosystems composed of malignant cells, diverse immune populations, cancer-associated fibroblasts (CAFs), and other stromal components, collectively known as the tumor microenvironment (TME) [36] [37]. Single-cell RNA sequencing (scRNA-seq) represents a revolutionary advancement within the NGS toolkit, resolving this complexity by delivering gene expression data for individual cells [36]. This technical guide details how scRNA-seq deconvolutes the TME, providing researchers and drug developers with the methodologies to uncover the cellular underpinnings of cancer heterogeneity, therapy resistance, and immune evasion.
Technological Foundations of scRNA-seq
scRNA-seq is a high-throughput method for transcriptomic profiling at individual-cell resolution. By isolating individual cells, capturing their mRNA, and performing sequencing, it reveals cellular heterogeneity typically masked in bulk analyses [37]. Its key advantages include:
- Identification of Rare Cell Populations: Detection of tumor stem cells and transitional states undetectable by bulk RNA-seq [37].
- Precise Cell Classification: Classification based on canonical markers, enabling precise identification of immune cell subsets and epithelial cell states [37].
- Characterization of Dynamic Processes: Analysis of differentiation trajectories and cellular transitions [37].
- Multi-omics Integration: Compatibility with approaches like single-cell ATAC-seq (chromatin accessibility) and CITE-seq (surface protein expression) for multidimensional insights [37].
Table 1: Comparison of scRNA-seq with Bulk RNA-seq and Spatial Transcriptomics
| Aspect | Bulk RNA-seq | Single-Cell RNA-seq (scRNA-seq) | Spatial Transcriptomics (ST) |
|---|---|---|---|
| Resolution | Population average | Single-cell | Near-single-cell to multi-cellular spot |
| Spatial Context | Lost | Lost | Preserved |
| Primary Strength | Cost-effective for global profiling | Unraveling cellular heterogeneity | Mapping expression in tissue architecture |
| Key Limitation | Masks cellular diversity | Loses native spatial relationships | Lower resolution than scRNA-seq [37] |
| Ideal Application | Biomarker discovery, expression signatures | Identifying rare cell types, cell states, trajectories | Understanding spatial niches and cell-cell interactions [36] |
Despite its strengths, scRNA-seq has limitations, including relatively low RNA capture efficiency per cell, cost, technical complexity, and the critical loss of native spatial relationships due to mandatory tissue dissociation [37]. This last limitation is increasingly addressed by integrating scRNA-seq with spatial transcriptomics (ST), an innovative complementary approach that maps gene expression within intact tissue sections [36] [37]. This combination bridges cellular identity with spatial localization, offering a more complete picture of the TME [36].
Experimental Workflow: From Tissue to Data
A robust scRNA-seq experiment requires careful execution at each step. The following diagram and table outline the core workflow and key reagent solutions.
Table 2: Research Reagent Solutions for scRNA-seq (10x Genomics Chromium Example)
| Reagent / Solution | Function | Key Consideration |
|---|---|---|
| Viability Stain | Distinguishes live from dead cells during quality control (QC). | High viability (>80%) is critical; dead cells increase ambient RNA [38]. |
| Cell Lysis Buffer | Breaks open cells to release RNA after barcoding. | Must inactivate RNases without damaging barcode sequences. |
| Gel Beads in Emulsion (GEMs) | Contains barcoded oligonucleotides with Unique Molecular Identifiers (UMIs), poly-dT primers, and PCR handles. | Each GEM acts as a separate reaction chamber for a single cell [38]. |
| Reverse Transcriptase Master Mix | Performs reverse transcription inside GEMs to create barcoded cDNA. | Enzyme must be efficient and processive for full-length cDNA synthesis. |
| Library Construction Kit | Amplifies cDNA and adds sequencing adapters. | PCR amplification must be optimized to minimize bias [38]. |
| Sequenceing Reagents (Illumina) | Determines the nucleotide sequence of the constructed library. | Read length and depth must be sufficient for gene detection and quantification [38]. |
Detailed Methodologies for Key Steps
1. Tissue Dissociation and Single-Cell Suspension Preparation:
- Protocol: Fresh tissue samples are minced and digested using a combination of collagenase (e.g., Collagenase IV, 1-2 mg/mL) and DNase I (0.1-0.5 mg/mL) in a suitable buffer at 37°C for 15-60 minutes with gentle agitation. The digest is filtered through a 40-70μm strainer, and red blood cells are lysed if necessary. The resulting suspension is washed and resuspended in a PBS-based buffer containing 0.04% BSA.
- QC Metrics: Cell concentration and viability are assessed using an automated cell counter (e.g., Countess II) or flow cytometry with a viability dye like propidium iodide. A viability of >80% is strongly recommended [38]. The suspension should be mostly singlets; clumps can be removed via fluorescence-activated cell sorting (FACS) or density gradient centrifugation.
2. Single-Cell Barcoding and Library Preparation (10x Genomics Chromium):
- Protocol: The single-cell suspension is loaded onto a Chromium chip along with the Gel Beads and partitioning oil. The Chromium Controller microfluidics system co-partitions cells, beads, and RT master mix into nanoliter-scale GEMs. Within each GEM, cell lysis occurs, and the released mRNA is captured by the poly-dT primers on the beads. Reverse transcription creates barcoded, full-length cDNA. Post-RT, GEMs are broken, and the pooled cDNA is cleaned up with DynaBeads MyOne SILANE beads. The cDNA is then amplified via PCR (12-14 cycles) and used to construct a sequencing library with P5 and P7 adapters, sample indices, and Read 1 and Read 2 primers.
- QC Metrics: Library quality and concentration are assessed using a Bioanalyzer (Agilent) or Fragment Analyzer, looking for a broad smear from 0.5-10 kb. Quantitative PCR (qPCR) is used for accurate quantification prior to sequencing.
Data Analysis Pipeline and Quality Control
Raw sequencing data (FASTQ files) are processed through a standardized bioinformatic pipeline, such as the Cell Ranger suite, which performs alignment, filtering, barcode counting, and UMI counting to generate a feature-barcode matrix [38]. Subsequent analysis in R or Python involves:
- Quality Control (QC) and Filtering: This critical step removes low-quality cells and technical artifacts. Key metrics include:
- UMI Counts per Cell: Filters out empty droplets (low counts) and potential multiplets (very high counts) [38].
- Genes Detected per Cell: Correlates with UMI counts; used similarly to filter outliers [38].
- Mitochondrial Read Percentage: A high percentage (>10% in PBMCs) indicates stressed, apoptotic, or low-quality cells [38].
- Normalization and Scaling: Adjusts for sequencing depth differences between cells.
- Dimensionality Reduction and Clustering: Principal Component Analysis (PCA) is followed by graph-based clustering on the top principal components. Uniform Manifold Approximation and Projection (UMAP) or t-Distributed Stochastic Neighbor Embedding (t-SNE) are used for 2D visualization.
- Cell Type Annotation: Clusters are annotated using known marker genes (e.g., CD3D for T cells, CD79A for B cells, COL1A1 for fibroblasts) from reference databases.
Table 3: Key QC Metrics and Filtering Thresholds for scRNA-seq Data
| QC Metric | Description | Interpretation & Typical Threshold |
|---|---|---|
| Number of UMIs per Cell | Total transcripts detected per cell. | Low: Empty droplet or dead cell. High: Potential multiplet. Filter extremes [38]. |
| Number of Genes per Cell | Total unique genes detected per cell. | Correlates with UMI count. Filter cells with unusually low or high numbers [38]. |
| Percentage of Mitochondrial Reads | Fraction of reads mapping to mitochondrial genes. | High percentage (>5-10%, cell-type dependent) indicates cell stress or damage [38]. |
| Percentage of Ribosomal Reads | Fraction of reads mapping to ribosomal genes. | Can indicate cellular state; extreme values may warrant investigation. |
Deconvoluting the Tumor Microenvironment: Key Applications
Integrating scRNA-seq with spatial data unlocks deep insights into the TME's functional and spatial architecture [36] [37]. Key applications include:
- Uncovering Cellular Heterogeneity: scRNA-seq precisely categorizes malignant cell subpopulations and diverse stromal and immune cells, identifying rare but therapeutically relevant populations like tumor stem cells or exhausted T cells [37].
- Characterizing Stromal-Immune Interactions: Analysis of receptor-ligand pairs reveals intricate communication networks, such as how CAFs expressing interleukin-6 (IL-6) can create inflammatory niches that promote tumor cell survival [36] [37].
- Mapping Spatial Niches: Integration with ST data locates these cellular interactions within the tissue architecture, identifying niches associated with immune exclusion, fibrosis, or resistance mechanisms [36].
- Elucidating Therapy Resistance: By comparing pre- and post-treatment samples, scRNA-seq can identify transcriptional programs in both cancer and TME cells that enable survival under therapeutic pressure [37].
scRNA-seq is an indispensable tool within the NGS arsenal, providing an unparalleled view of the cellular composition and dynamics of the tumor microenvironment. Its ability to deconvolute the TME at single-cell resolution is driving discoveries in cancer heterogeneity, immune evasion, and therapeutic resistance. The ongoing integration with spatial transcriptomics and other omics technologies promises to further advance precision oncology, paving the way for spatially informed biomarkers and combination therapies tailored to the unique ecosystem of each patient's tumor [36] [16].
Cancer is a heterogeneous disease, characterized by unique genomic and phenotypic features that differ not only between patients but also among distinct regions within a single tumor and over time [39]. This tumor heterogeneity presents a fundamental challenge for precision oncology, as a single tissue biopsy may not fully represent the complete genomic landscape of a patient's cancer, potentially missing critical driver events or emergent resistance mechanisms that develop during therapy [39]. The advent of liquid biopsy, particularly the analysis of circulating tumor DNA (ctDNA), has revolutionized our ability to monitor this dynamic heterogeneity non-invasively. ctDNA refers to fragmented DNA released into the bloodstream from apoptotic or necrotic tumor cells, carrying the genetic signatures of both primary and metastatic lesions [40] [41]. As a subset of total cell-free DNA (cfDNA), ctDNA typically constitutes 0.1% to 1.0% of the total cfDNA in cancer patients, with its proportion often correlating with tumor burden [40].
The clinical implementation of next-generation sequencing (NGS) technologies has been instrumental in deciphering this complexity, enabling comprehensive profiling of tumor-derived genetic alterations from a simple blood draw [42]. When integrated with NGS, liquid biopsies provide a powerful window into the spatial and temporal heterogeneity of malignancies, allowing researchers and clinicians to track clonal evolution, monitor treatment response, and identify resistance mechanisms in near real-time [43] [41]. This in-depth technical guide explores the role of ctDNA analysis in capturing tumor heterogeneity, detailing experimental methodologies, analytical validation approaches, and clinical applications within the broader context of NGS-based cancer heterogeneity studies.
Tumor Heterogeneity: A Fundamental Challenge in Oncology
Dimensions and Implications of Heterogeneity
Tumor heterogeneity manifests in two primary dimensions: inter-tumor heterogeneity (variations between tumors from different patients) and intra-tumor heterogeneity (variations within a single tumor or within the same patient) [39]. Intra-tumor heterogeneity is particularly challenging therapeutically, as it can lead to the selection of resistant subclones under the selective pressure of treatment. The clonal evolution of tumors follows either a stochastic model, where gradual accumulation of genomic alterations leads to positive selection and expansion of certain cell lineages, or a cancer stem cell (CSC) model, where heterogeneity is driven by hierarchical differentiation from progenitor cells [39]. In reality, these models often co-occur, further complicating the tumor ecosystem.
The implications of heterogeneity for cancer therapy are profound. Genomic heterogeneity significantly contributes to the generation of diverse cell populations during tumor development and progression, representing a determining factor for variation in treatment response [39]. It has been considered a prominent contributor to therapeutic failure and increases the likelihood of resistance to future therapies in most common cancers [39]. This heterogeneity is not static but evolves dynamically throughout the disease course and in response to therapeutic interventions, necessitating monitoring approaches that can capture these temporal changes.
NGS in Deciphering Tumor Heterogeneity
Next-generation sequencing technologies have dramatically expanded our ability to characterize tumor heterogeneity at unprecedented resolution. Large-scale genomic studies and The Cancer Genome Atlas (TCGA) project have provided comprehensive insights into the molecular basis of multiple cancer types, revealing extensive inter- and intra-tumor heterogeneity across malignancies [39]. The cBioPortal web resource has emerged as a vital tool for cancer genomic data evaluation, allowing researchers to query genetic alterations across thousands of tumor samples [39].
Single-cell sequencing (SCS) technologies represent a particularly powerful approach for tackling intra-tumor heterogeneity, enabling the profiling of individual cells from multiple spatial regions within a tumor biopsy [39]. This methodology allows researchers to classify tumor cells into different sub-populations and predict potential molecular relationships among these sub-populations, ultimately elucidating therapeutic failure and resistance mechanisms while revealing the intricacies of tumor evolution [39]. When combined with serial spatial sampling, SCS facilitates the tracing of tumor cell lineages, providing unprecedented insights into the clonal dynamics of cancer progression and treatment resistance.
Circulating Tumor DNA: Biology and Technical Considerations
Origin and Characteristics of ctDNA
Circulating tumor DNA originates from tumor cells through various mechanisms, including apoptosis, necrosis, and active secretion, with the relative contributions of each pathway still under investigation [41]. These ctDNA fragments are typically shorter than non-malignant cfDNA fragments, averaging between 20-50 base pairs, a characteristic that can be exploited for enrichment and detection strategies [40]. The half-life of ctDNA is relatively short, approximately 16 minutes to 2.5 hours, enabling near real-time monitoring of tumor dynamics [40]. This rapid turnover makes ctDNA an ideal biomarker for tracking temporal changes in tumor burden and genetic composition.
The fraction of ctDNA within total cfDNA varies considerably among patients and depends on multiple factors, including tumor type, stage, burden, vascularity, and location [40]. In patients with metastatic disease, ctDNA levels are generally higher, reflecting increased tumor burden and shedding. However, even in early-stage cancers, sensitive detection methods can identify ctDNA, enabling potential applications in early detection and minimal residual disease monitoring [41].
Comparative Advantages of ctDNA Analysis
The analysis of ctDNA offers several distinct advantages over traditional tissue biopsy for assessing tumor heterogeneity:
- Comprehensive representation: ctDNA is shed from all tumor sites, potentially providing a more complete representation of the overall tumor genomic landscape compared to a single tissue biopsy, which may miss spatially separated heterogeneous clones [41].
- Temporal monitoring: The non-invasive nature of liquid biopsy allows for repeated sampling, enabling dynamic monitoring of clonal evolution throughout the disease course and during treatment [43] [40].
- Early detection capability: Changes in ctDNA levels often precede radiographic evidence of disease progression or recurrence, allowing for earlier intervention [41].
- Overcoming tissue limitations: Liquid biopsy is particularly valuable when tissue is inaccessible, insufficient, or when a repeat biopsy poses significant risk to the patient [40].
Table 1: Advantages and Limitations of ctDNA Analysis for Assessing Tumor Heterogeneity
| Aspect | Advantages | Limitations |
|---|---|---|
| Spatial Heterogeneity | Captures contributions from multiple tumor sites | May underrepresent clones with low shedding rates |
| Temporal Resolution | Enables frequent monitoring of clonal dynamics | Short half-life requires careful timing of collection |
| Sensitivity | Modern assays detect variants at <0.1% VAF | Low tumor burden may limit detection sensitivity |
| Analytical Scope | Can simultaneously assess multiple alteration types | Pre-analytical factors can impact DNA quality |
| Clinical Utility | Guides real-time treatment adjustments | Interpretation requires understanding of biology |
Experimental Methodologies for ctDNA Analysis
Pre-analytical Sample Processing
Robust pre-analytical protocols are essential for reliable ctDNA analysis. The following methodology outlines optimal sample processing procedures based on current best practices:
Blood Collection: Collect 10-20 mL of peripheral blood into Streck Cell-Free DNA BCT or similar cell-stabilizing tubes to prevent leukocyte lysis and preserve native cfDNA profiles [44]. Invert tubes gently 8-10 times immediately after collection to ensure proper mixing with preservative.
Plasma Separation: Process samples within 4 hours of collection for optimal results. Centrifuge at 2000×g for 10 minutes at 4°C to separate plasma from blood cells. Transfer the supernatant to a fresh 15 mL tube and perform a second centrifugation at 16,000×g for 10 minutes at 4°C to remove remaining cellular debris [45].
cfDNA Extraction: Extract cfDNA from plasma using validated kits such as the QIAamp Circulating Nucleic Acid Kit (Qiagen) following manufacturer's instructions. Quantify extracted cfDNA using fluorometric methods (e.g., Qubit Fluorometer with dsDNA HS Assay Kit) to ensure accurate input measurements for downstream applications [45].
Quality Assessment: Assess cfDNA quality using fragment analyzers or similar systems to confirm the expected size distribution (peak ~167 bp) and absence of high molecular weight genomic DNA contamination.
Next-Generation Sequencing Approaches
Multiple NGS approaches have been developed for ctDNA analysis, each with distinct strengths for capturing tumor heterogeneity:
Hybrid Capture-Based Panels: These panels use biotinylated oligonucleotide probes to enrich target regions before sequencing. The Hedera Profiling 2 (HP2) ctDNA test exemplifies this approach, covering 32 genes with demonstrated 96.92% sensitivity and 99.67% specificity for SNVs/Indels at 0.5% allele frequency [46]. Such panels typically achieve high sequencing depths (>15,000x) to detect low-frequency variants [45].
Amplicon-Based Panels: Targeted PCR amplification of specific regions followed by sequencing. The custom 15-gene NSCLC panel described by Chow et al. uses the ArcherDX platform to cover hotspot mutations in key driver genes including EGFR, ALK, ROS1, RET, and others relevant to NSCLC [44].
Whole Genome/Exome Sequencing: While less commonly used for ctDNA due to cost and sensitivity limitations, these approaches provide an unbiased view of the genome and can detect unexpected alterations, particularly in research settings.
The following workflow diagram illustrates a typical hybrid capture-based NGS approach for ctDNA analysis:
Bioinformatic Analysis for Heterogeneity Assessment
Bioinformatic processing of ctDNA sequencing data requires specialized approaches to accurately detect low-frequency variants and reconstruct clonal architecture:
Sequence Alignment: Map raw sequencing reads to the reference genome (hg19/GRCh38) using optimized aligners such as Burrows-Wheeler Aligner (BWA) with parameters adjusted for cfDNA fragment length [45].
Variant Calling: Implement dual approaches including:
- Ultra-sensitive variant callers (e.g., VarDict) with customized filtering to distinguish true low-frequency variants from technical artifacts [45].
- Unique Molecular Identifier (UMI)-based error suppression to correct for PCR and sequencing errors, enabling detection of variants at frequencies as low as 0.02% [47].
Clonal Deconvolution: Apply computational frameworks such as SubcloneSeeker to reconstruct tumor clone structure from variant allele frequency data, enabling interpretation and prioritization of cancer variants based on their clonal representation [48].
Actionability Assessment: Annotate variants according to established guidelines (ESMO Scale of Clinical Actionability for Molecular Targets, AMP/ASCO/CAP) to categorize alterations based on clinical significance and therapeutic implications [45] [46].
Analytical Validation of ctDNA NGS Assays
Performance Metrics and Validation Approaches
Robust analytical validation is essential for implementing ctDNA assays in both research and clinical settings. Key performance metrics and their typical validation approaches include:
Limit of Detection (LOD): Determined using serial dilution experiments with reference standards. The AlphaLiquid100 assay demonstrated LODs of 0.11% for SNVs, 0.11% for insertions, 0.06% for deletions, 0.21% for fusions, and 2.13 copies for copy number alterations with 30 ng input DNA [47].
Sensitivity and Specificity: Evaluated by comparing variant calls to orthogonal methods (e.g., ddPCR) in well-characterized samples. The 101-gene ctDNA assay showed 98.3% sensitivity for SNVs and 100% sensitivity for InDels and fusions compared to ddPCR/breakpoint PCR reference methods [45].
Precision and Reproducibility: Assessed through replicate testing across different operators, instruments, and days to establish inter- and intra-run variability.
Table 2: Analytical Performance Comparison of Representative ctDNA NGS Assays
| Assay Parameter | 101-Gene Panel [45] | AlphaLiquid100 [47] | 15-Gene Panel [44] | HP2 Panel [46] |
|---|---|---|---|---|
| Genes Covered | 101 | Not specified | 15 | 32 |
| SNV Sensitivity | 98.3% | >95% at 0.11% LOD | >95% | 96.92% |
| InDel Sensitivity | 100% | >95% at 0.06% LOD | >90% | 96.92% |
| Fusion Sensitivity | 100% | >95% at 0.21% LOD | Not reported | 100% |
| Input DNA | Not specified | 30 ng | 20-80 ng | Not specified |
| Sequencing Depth | ~15,880× | Not specified | >10,000× | Not specified |
| Specificity | 99.9% | ~100% | >99% | 99.67% |
The Researcher's Toolkit: Essential Reagents and Materials
Table 3: Essential Research Reagent Solutions for ctDNA NGS Analysis
| Reagent/Material | Function | Example Products |
|---|---|---|
| Cell-Free DNA Blood Collection Tubes | Stabilize blood cells and preserve native cfDNA profile during transport and storage | Streck Cell-Free DNA BCT, PAXgene Blood cDNA Tube |
| cfDNA Extraction Kits | Isolve and purify cell-free DNA from plasma with high efficiency and minimal contamination | QIAamp Circulating Nucleic Acid Kit, MagMAX Cell-Free DNA Isolation Kit |
| Library Preparation Kits | Convert fragmented cfDNA into sequencing-ready libraries with appropriate adapters | KAPA HyperPrep Kit, Illumina DNA Prep |
| Hybrid Capture Reagents | Enrich target regions of interest using biotinylated probes | xGen Lockdown Probes, IDT SureSelect XT HS |
| Sequenceing Platforms | Perform high-throughput sequencing of prepared libraries | Illumina NextSeq 500/550/550Dx, NovaSeq 6000 |
| Reference Standards | Validate assay performance and establish detection limits | Seraseq ctDNA Reference Materials, Horizon Multiplex I cfDNA Reference Standard |
Clinical Applications in Cancer Heterogeneity Monitoring
Tracking Clonal Evolution and Therapy Resistance
The dynamic monitoring capabilities of ctDNA analysis make it particularly valuable for tracking clonal evolution and the emergence of therapy resistance. In advanced NSCLC, ctDNA profiling has revealed complex patterns of resistance to tyrosine kinase inhibitors, including the appearance of secondary mutations (e.g., EGFR T790M), bypass pathway activation, and phenotypic transformation [47]. The high sensitivity of modern ctDNA assays enables detection of resistant clones often weeks or months before clinical or radiographic progression, creating opportunities for early intervention and therapy modification.
Longitudinal ctDNA monitoring has demonstrated that changes in variant allele frequencies of specific mutations can accurately reflect tumor response and progression. In the ctMoniTR project, advanced NSCLC patients treated with TKIs who achieved undetectable ctDNA levels within 10 weeks showed significantly better overall survival and progression-free survival [41]. This correlation between ctDNA dynamics and clinical outcomes underscores the utility of liquid biopsy as a pharmacodynamic biomarker for tracking heterogeneous tumor responses to targeted therapies.
Assessing Intratumor Heterogeneity and Metastatic Dissemination
ctDNA analysis provides unique insights into the spatial heterogeneity of tumors and their metastatic deposits. By comparing mutation profiles from simultaneously collected ctDNA and multiregional tissue samples, researchers can infer the relative clonal representation across different tumor sites. Studies have demonstrated that ctDNA profiles often encompass the majority of mutations identified through extensive multiregional sequencing, suggesting that liquid biopsy can capture the dominant clonal populations present across the entire disease burden [39].
The analysis of ctDNA fragmentation patterns and epigenetic features offers additional dimensions for assessing heterogeneity. Differences in nucleosome positioning and DNA methylation patterns in ctDNA can provide information about the tissue of origin for various metastatic clones, enabling non-invasive tracking of subclonal dissemination patterns across different organ sites [41]. These approaches are particularly valuable for understanding the biology of metastatic progression and for developing strategies to target specific metastatic subclones.
Current Challenges and Future Directions
Technical and Biological Limitations
Despite significant advances, several challenges remain in the implementation of ctDNA analysis for comprehensive assessment of tumor heterogeneity:
Sensitivity Limitations in Early-Stage Disease: The low abundance of ctDNA in early-stage cancers and minimal residual disease settings continues to present detection challenges, particularly for identifying subclonal populations present at very low frequencies [40].
Representation Biases: Clones with reduced shedding rates or from poorly perfused tumor regions may be underrepresented in ctDNA, potentially leading to incomplete assessment of heterogeneity [41].
Analytical Standardization: Pre-analytical variables including blood collection timing, tube types, processing protocols, and DNA extraction methods can significantly impact results, necessitating rigorous standardization for reproducible heterogeneity assessment [41].
Distinguishing Clonal Hematopoiesis: Age-related clonal hematopoiesis of indeterminate potential (CHIP) can contribute non-tumor-derived mutations to cfDNA, complicating interpretation and requiring matched white blood cell sequencing for accurate discrimination [41].
Emerging Technologies and Multimodal Approaches
The future of ctDNA analysis for heterogeneity assessment lies in the development of increasingly sensitive technologies and integrated multimodal approaches:
Ultra-Sensitive Assay Platforms: Techniques such as digital PCR and targeted sequencing with error correction are pushing detection limits below 0.01% variant allele frequency, enabling identification of increasingly rare subclones [47] [41].
Multimodal Liquid Biopsies: Integrating ctDNA analysis with other liquid biopsy components including circulating tumor cells, extracellular vesicles, and tumor-educated platelets provides complementary information for a more comprehensive view of tumor heterogeneity [43] [40].
Fragmentomics and Epigenetic Analysis: Examining ctDNA fragmentation patterns, nucleosome positioning, and methylation signatures offers additional layers of information about tumor heterogeneity and tissue of origin without requiring genetic alterations [41].
Longitudinal Monitoring Platforms: The development of patient-specific ctDNA assays targeting individual mutation profiles enables highly sensitive tracking of clonal dynamics throughout the entire disease course, from initial diagnosis through multiple lines of therapy [41].
The following diagram illustrates the multimodal approach to capturing tumor heterogeneity through liquid biopsy:
Liquid biopsy analysis of ctDNA has emerged as a powerful tool for capturing the dynamic heterogeneity of malignancies, providing a non-invasive window into the complex clonal architecture and evolutionary trajectories of tumors. When coupled with advanced NGS technologies, ctDNA profiling enables comprehensive assessment of spatial and temporal heterogeneity, revealing patterns of clonal evolution, therapeutic resistance, and metastatic dissemination that were previously inaccessible without repeated invasive procedures. As ctDNA analysis continues to evolve through technical improvements in sensitivity, multimodal integration, and sophisticated bioinformatic deconvolution approaches, its role in precision oncology will expand, ultimately enabling more dynamic and personalized therapeutic strategies that address the fundamental challenge of tumor heterogeneity in cancer treatment.
Next-generation sequencing (NGS) has fundamentally transformed oncology research and diagnostics, enabling unprecedented insights into the complex genomic architecture of cancer. The profound genetic alterations and cellular dysregulation that characterize cancer necessitate sophisticated molecular profiling technologies to unravel tumor heterogeneity, identify driver mutations, and guide therapeutic development [16]. Within this paradigm, two principal approaches have emerged: whole-genome sequencing (WGS), whichinterrogates the entire genome, and targeted sequencing, which focuses on predefined genes or regions of interest. The strategic selection between these methodologies represents a critical decision point for researchers and drug development professionals studying cancer heterogeneity, with implications for discovery power, clinical applicability, and resource allocation.
This technical guide provides a comprehensive comparison of WGS and targeted sequencing within the context of cancer heterogeneity studies. We examine their technological principles, performance characteristics in recent studies, and specific applications through structured data comparison, experimental protocols, and analytical workflows to inform strategic decision-making in oncogenomic research.
Technical Foundations and Performance Comparison
Core Technological Principles
Whole-genome sequencing employs a hypothesis-free approach that generates data across the entire genome, typically at a sequencing depth of 30-100× [49] [50]. This comprehensive coverage enables the detection of a broad spectrum of genomic alterations—including single nucleotide variants (SNVs), insertions/deletions (indels), copy number variations (CNVs), structural variants (SVs), and rearrangements—without prior knowledge of their location or nature [16]. The key advantage of WGS lies in its unbiased discovery power, particularly valuable for identifying novel cancer genes, complex structural rearrangements, and mutational signatures across the entire genome [51] [50].
Targeted sequencing utilizes hybridization capture or amplicon-based approaches to enrich specific genomic regions—typically several hundred cancer-associated genes and biomarker regions—before sequencing at high depth (often >500-1000×) [4] [49]. By focusing on clinically or biologically relevant regions, targeted panels maximize sequencing depth and sensitivity for variant detection while minimizing cost and data burden. This approach is particularly suited for clinical diagnostics where established biomarkers guide treatment decisions [7].
Comparative Performance Metrics
Table 1: Technical and operational comparison of WGS and targeted sequencing
| Feature | Whole Genome Sequencing (WGS) | Targeted Sequencing |
|---|---|---|
| Genomic Coverage | Comprehensive (entire genome) | Limited (predefined gene panels) |
| Typical Sequencing Depth | 30-100× [49] | 500-1000× or higher [49] |
| Variant Detection Spectrum | SNVs, indels, CNVs, SVs, fusions, rearrangements, mutational signatures [51] [16] | Primarily SNVs, indels, CNVs, and fusions within targeted regions |
| Sensitivity for Low-Frequency Variants | Limited at lower VAFs due to moderate depth | Superior (detection down to ~1% VAF) [16] |
| Cost Considerations | Higher per sample [50] | Lower per sample [49] |
| Data Volume | Substantial (~100 GB per genome) [4] | Moderate (~1-5 GB per sample) |
| Turnaround Time | Longer (including analysis) [49] | Shorter [49] |
| Ideal Application Context | Discovery research, novel biomarker identification, CUP [51] | Clinical diagnostics, therapy selection, clinical trials [7] |
Recent evidence demonstrates that WGS provides superior diagnostic yield in certain complex clinical scenarios. In cancer of unknown primary (CUP), where tumor heterogeneity presents significant diagnostic challenges, WGS identified additional reportable variants in 76% of cases compared to comprehensive gene panels (386-523 genes), with 35% of these having known therapeutic or diagnostic relevance [51]. WGS particularly excelled in detecting structural variants (98% detected only by WGS) and copy number variations (62% detected only by WGS) [51].
However, in genetically characterized cancers with established biomarkers, targeted sequencing demonstrates remarkable performance. A 2025 paired comparison in pancreatic cancer revealed 81% concordance across all variants and 100% concordance for variants relevant to targeted therapy between WGS and the Oncomine Comprehensive Assay Plus (501 genes) [49]. This suggests that for many clinical applications where established biomarkers guide treatment, targeted panels provide sufficient information with greater efficiency.
Experimental Protocols and Methodologies
Sample Preparation and Quality Control
Tissue Processing and Nucleic Acid Extraction: For both WGS and targeted sequencing, sample quality profoundly impacts results. Optimal DNA integrity is crucial, particularly for WGS. The standard practice involves pathologist-guided macrodissection of FFPE or fresh-frozen tissue sections to ensure adequate tumor cellularity (typically >30%) [49]. For FFPE samples, DNA extraction using specialized kits (e.g., QIAamp DNA FFPE Tissue Kit) is standard, with quality assessment via fluorometry (Qubit dsDNA HS Assay) and spectrophotometry (NanoDrop) to ensure A260/A280 ratios of 1.7-2.2 [7]. For WGS, fresh-frozen tissue is preferred as FFPE processing introduces DNA damage, resulting in shorter fragment lengths (FFPE median: 437 bp vs. Fresh: 618 bp) and higher sequence duplication rates (FFPE: 25% vs. Fresh: 7%) [51].
Library Preparation:
- WGS Library Construction: Fragmentation of genomic DNA to ~300-500 bp fragments followed by adapter ligation using platforms such as Illumina TruSeq DNA PCR-Free or Illumina DNA Prep [4]. Library quantification and quality control are performed via qPCR and bioanalyzer systems (e.g., Agilent 2100 Bioanalyzer).
- Targeted Sequencing Library Preparation: Hybridization-based capture using panels such as Illumina TSO500 or Oncomine Comprehensive Assay Plus with 5-40 ng DNA input [51] [49]. Target enrichment is followed by PCR amplification and library quantification. The SNUBH Pan-Cancer v2.0 Panel (544 genes) exemplifies typical targeted approaches, requiring minimum 20 ng DNA and generating libraries of 250-400 bp [7].
Sequencing and Data Analysis
Table 2: Key research reagents and solutions for NGS in cancer studies
| Reagent Category | Specific Examples | Function and Application Notes |
|---|---|---|
| Nucleic Acid Extraction Kits | QIAamp DNA FFPE Tissue Kit (Qiagen), Maxwell RSC DNA/RNA FFPE kits (Promega) [49] [7] | High-quality DNA extraction from challenging FFPE samples; critical for reliable variant detection |
| Target Enrichment Systems | Illumina TSO500, Oncomine Comprehensive Assay Plus, Agilent SureSelectXT Target Enrichment [51] [49] [7] | Gene panel-specific library preparation; determines genomic coverage and variant detection capability |
| Library Preparation Kits | Illumina TruSeq DNA PCR-Free, Illumina DNA Prep | Platform-specific library construction; impacts library complexity and sequencing quality |
| Sequence Platforms | Illumina NextSeq 550Dx, Illumina HiSeq/MiSeq, NovaSeq [7] | Generate sequence data; platform selection affects read length, throughput, and cost considerations |
| Analysis Tools | GATK Mutect2, VarDict, CNVkit, LUMPY, PURPLE [51] [49] [7] | Variant calling, copy number analysis, and structural variant detection; crucial for data interpretation |
Sequencing Protocols:
- WGS: Illumina platforms (NextSeq, NovaSeq) with minimum 30× coverage for germline and 50× for tumor samples, with ≥95% of genome covered at 10× [49]. For comprehensive variant detection, paired tumor-normal sequencing is recommended to distinguish somatic from germline variants.
- Targeted Sequencing: Illumina NextSeq 550Dx or similar systems with deep coverage (>500×) and >80% of targets covered at 100× [7]. The high depth enables detection of low-frequency variants (VAF ≥2%) in heterogeneous tumor samples.
Bioinformatic Analysis:
- Variant Calling: GATK Mutect2 for SNVs/indels [49] [7], CNVkit for copy number variations [7], and LUMPY or Manta for structural variants [49]. For WGS, additional analyses include mutational signature extraction using tools like SigProfiler and homology repair deficiency assessment.
- Variant Annotation and Interpretation: Variants are classified according to established guidelines (AMP/ASCO/CAP) into tiers based on clinical significance [7]. Tier I includes variants of strong clinical significance (FDA-approved biomarkers), while Tier II encompasses variants with potential clinical significance.
Diagram 1: Experimental workflow for WGS and targeted sequencing in cancer genomics
Integrative Approaches and Emerging Applications
Bridging the DNA-to-Protein Divide with RNA Sequencing
While DNA-based analyses identify potential mutations, functional interpretation requires understanding which variants are expressed. Targeted RNA sequencing provides orthogonal validation by detecting expressed mutations, bridging the "DNA-to-protein divide" [52]. In precision oncology, this integration is crucial as drugs target proteins rather than DNA. Studies demonstrate that RNA-seq uniquely identifies variants with pathological relevance missed by DNA-seq alone, while also revealing that some DNA-detected variants are not transcribed, suggesting limited clinical relevance [52].
The practical implementation involves paired DNA-RNA extraction from the same tumor specimen, followed by parallel sequencing using matched DNA and RNA panels. Bioinformatic analysis then intersects DNA variants with RNA expression data, confirming transcriptional activity and providing stronger evidence for functional relevance. This approach is particularly valuable for prioritizing variants in clinical decision-making and clinical trial enrollment [52].
Clinical Translation and Therapeutic Matching
The ultimate application of cancer genomic profiling is matching patients to effective therapies based on their tumor's molecular alterations. Real-world evidence demonstrates that NGS-based therapeutic matching significantly impacts patient outcomes. In a study of 990 advanced cancer patients, 26% harbored Tier I variants (strong clinical significance), and 13.7% of these received NGS-based therapy, with 37.5% achieving partial response [7].
Diagram 2: From genomic data to clinical applications in cancer research and treatment
The choice between whole-genome and targeted sequencing represents a strategic balance between discovery power and clinical applicability in cancer heterogeneity studies. Current evidence indicates that WGS provides superior diagnostic yield in complex cases like cancer of unknown primary, where it identified tissue of origin in 71% of otherwise unresolved cases and informed treatment decisions for 79% of patients [51]. The technology's comprehensive nature enables detection of diverse variant types, including structural variants and mutational signatures, which are increasingly relevant for both diagnostic classification and therapeutic targeting.
Conversely, targeted sequencing offers practical advantages in resource-constrained environments and for cancers with well-characterized molecular landscapes. Its higher sequencing depth enhances sensitivity for low-frequency variants in heterogeneous tumors, while reduced data complexity and cost facilitate integration into clinical workflows [49] [7].
For research focused on cancer heterogeneity, an integrated approach leveraging both technologies may provide optimal insights. WGS enables unbiased discovery of novel alterations driving heterogeneity, while targeted deep sequencing permits sensitive monitoring of subclonal populations throughout disease evolution and treatment. As sequencing costs decline and analytical methods improve, the distinction between these approaches may blur, with comprehensive genomic profiling becoming increasingly accessible for both discovery research and clinical diagnostics in cancer heterogeneity studies.
The advent of large-scale molecular profiling has revolutionized cancer research, yet single-omics approaches often fail to capture the complex, multi-layered nature of oncogenesis. Integrating genomics, transcriptomics, and epigenomics provides unprecedented opportunities for understanding tumor heterogeneity, identifying novel biomarkers, and advancing personalized therapeutic strategies. This technical review examines current methodologies, analytical frameworks, and clinical applications of multi-omics integration, with a specific focus on addressing intra-tumoral heterogeneity in cancer. We detail experimental protocols, computational integration strategies, and visualization techniques essential for researchers pursuing comprehensive oncological analyses. Within the broader context of NGS applications in cancer heterogeneity studies, this work underscores how multi-omics data integration enables more accurate patient stratification, prognosis prediction, and therapeutic target discovery by capturing the dynamic interactions between genetic, transcriptional, and regulatory layers.
Biological systems operate through complex, interconnected layers including the genome, transcriptome, and epigenome [53]. The flow of genetic information through these layers shapes observable traits, and elucidating the genetic basis of complex phenotypes like cancer requires an analytical framework that captures these dynamic, multi-layered interactions [53]. Intra-tumoral heterogeneity (ITH)—the coexistence of genetically and phenotypically diverse subclones within a single tumor—represents a formidable barrier in oncology, contributing to drug resistance, disease relapse, and diagnostic uncertainty [54]. Conventional bulk tissue analysis often overlooks subtle cellular heterogeneity, resulting in incomplete or misleading interpretations of tumor biology [54].
Multi-omics technologies enable comprehensive mapping of ITH across molecular layers, with each omics layer offering a distinct but partial view [54]. Genomics identifies clonal architecture and mutations, transcriptomics reflects regulatory programs and gene expression dynamics, and epigenomics captures heritable changes in gene expression not involving changes to the underlying DNA sequence [54] [53]. Only by integrating these orthogonal layers can researchers move from partial observations to systems-level understanding of ITH, facilitating cross-validation of biological signals, identification of functional dependencies, and construction of holistic tumor "state maps" linking molecular variation to phenotypic behavior [54].
Omics Components: Technologies and Insights
Core Omics Layers in Cancer Research
Table 1: Core Omics Components in Multi-omics Cancer Studies
| Omics Component | Description | Key Technologies | Primary Insights | Limitations |
|---|---|---|---|---|
| Genomics | Study of the complete set of DNA, including all genes, focusing on sequence, structure, and function [53]. | Next-Generation Sequencing (NGS), Whole Genome/Exome Sequencing [54] [53]. | Identifies driver/passenger mutations, Copy Number Variations (CNVs), Single-Nucleotide Polymorphisms (SNPs) [53]. | Does not account for gene expression or environmental influence; large data volume and complexity [53]. |
| Transcriptomics | Analysis of RNA transcripts produced by the genome under specific circumstances or in specific cells [53]. | Bulk RNA-Seq, Single-Cell RNA-Seq (scRNA-seq) [54] [55]. | Captures dynamic gene expression changes; reveals regulatory mechanisms and cell states [55] [53]. | RNA is less stable than DNA; provides a snapshot view, not long-term regulation [53]. |
| Epigenomics | Study of heritable changes in gene expression without altering the DNA sequence (e.g., methylation, chromatin accessibility) [54] [53]. | Bisulfite Sequencing, scATAC-seq, ChIP-seq, CUT&Tag [55] [53]. | Explains gene regulation beyond DNA sequence; connects environment and gene expression [53]. | Changes are tissue-specific and dynamic; complex data interpretation [53]. |
Molecular Insights from Integrated Omics
Integrative analyses reveal how variations across omics layers interact to drive oncogenesis. Driver mutations in genes like TP53 provide a growth advantage, while copy number variations (CNVs) can lead to overexpression of oncogenes or underexpression of tumor suppressor genes [53]. A key example is the amplification of the HER2 gene in approximately 20% of breast cancers, leading to protein overexpression associated with aggressive tumor behavior [53]. Single-nucleotide polymorphisms (SNPs) can influence cancer risk, prognosis, and drug response, such as those in BRCA1 and BRCA2 that increase risk for breast and ovarian cancers [53].
Epigenomic mechanisms, particularly DNA methylation, can silence tumor suppressor genes without changing their DNA sequence, while chromatin accessibility maps reveal active regulatory regions that dictate cell identity and state [55]. Transcriptomics connects these layers by measuring the functional output of genomic and epigenomic variation, capturing the dynamic gene expression programs that ultimately dictate cellular phenotype [53].
Multi-Omics Integration Methodologies
Conceptual Frameworks for Data Integration
The integration of multi-omics data can be categorized based on the timing and methodology of integration [56] [57]:
- Early Integration (Data-Level): Raw or pre-processed data from different omics sources are concatenated into a single matrix before analysis [56] [57]. This approach can identify correlations across omics layers but faces challenges with data heterogeneity and high dimensionality.
- Intermediate Integration (Feature-Level): Data are integrated during feature selection, extraction, or model development stages [57]. This allows more flexibility and control, often using dimensionality reduction techniques to create joint representations.
- Late Integration (Result-Level): Each omics dataset is analyzed separately, and results are combined at the final stage [56] [57]. This preserves unique characteristics of each dataset but may miss complex cross-omics interactions.
Additionally, integration can be vertical (N-integration), combining different omics from the same samples, or horizontal (P-integration), adding studies of the same molecular level from different subjects to increase sample size [56].
Computational and Statistical Approaches
Table 2: Computational Methods for Multi-Omics Data Integration
| Method Category | Key Approaches | Representative Algorithms/Tools | Best Use Cases |
|---|---|---|---|
| Statistical Methods | Regularization techniques, Matrix factorization [56] [58]. | LASSO, Elastic Net, MOFA+ [56] [57] [58]. | Dimensionality reduction, feature selection, identifying latent factors. |
| Machine Learning | Supervised and unsupervised learning; Deep learning [56] [57]. | XGBoost, Subtype-GAN, DeepProg, CustOmics [59] [57]. | Classification, subtyping, survival prediction. |
| Network-Based | Biological network construction; Graph analysis [56] [53]. | WGCNA, CellChat, NicheNet [60] [61]. | Inferring molecular interactions, pathway analysis, cell communication. |
| Multi-Stage Integration | Sequential analysis combining multiple methods [60] [61]. | WGCNA + Machine Learning [60]. | Biomarker discovery, prognostic model development. |
Machine learning approaches have shown particular promise in handling the high dimensionality and complexity of multi-omics data. For example, genetic programming has been employed to adaptively select the most informative features from each omics dataset, optimizing integration for survival analysis in breast cancer [57]. Deep learning models like DeepMO and moBRCA-net have demonstrated strong performance in cancer subtype classification by integrating mRNA expression, DNA methylation, and copy number variation data [57].
Network-based methods model molecular features as nodes and their functional relationships as edges, capturing complex biological interactions and identifying key subnetworks associated with disease phenotypes [53]. Tools like CellChat enable the inference of cell-cell communication networks from scRNA-seq data, revealing how different cell populations interact within the tumor microenvironment [61].
Experimental Protocols and Workflows
Data Generation and Preprocessing
A critical first step in multi-omics studies involves proper data generation and normalization across platforms. The MLOmics database provides a standardized pipeline for processing multi-omics data from TCGA, with specific steps for each data type [59]:
Transcriptomics (mRNA and miRNA) Processing:
- Data Identification: Trace downloaded data using metadata fields like "experimental_strategy" marked as "mRNA-Seq" or "miRNA-Seq"
- Platform Verification: Confirm experimental platform from metadata (e.g., "platform: Illumina")
- Normalization: Convert scaled gene-level RSEM estimates into FPKM values using edgeR package
- Filtering: Remove non-human miRNA expressions using species annotations from miRBase
- Quality Control: Eliminate features with zero expression in >10% of samples or undefined values
- Transformation: Apply logarithmic transformations to obtain log-converted expression data
Epigenomic (Methylation) Processing:
- Region Identification: Map methylation regions to genes using promoter definitions (e.g., 500bp upstream & 50bp downstream of TSS)
- Normalization: Perform median-centering normalization using limma R package to adjust for technical variations
- Promoter Selection: For genes with multiple promoters, select the promoter with the lowest methylation levels in normal tissues
Genomic (CNV) Processing:
- Alteration Identification: Examine how copy-number alterations are recorded in metadata
- Variant Filtering: Retain somatic variants and filter out germline mutations
- Recurrence Analysis: Use GAIA package to identify recurrent genomic alterations
- Annotation: Annotate recurrent aberrant genomic regions using BiomaRt package
Feature Selection and Model Building
After preprocessing, feature selection is crucial for managing dimensionality. The MLOmics pipeline provides three feature versions [59]:
- Original: Full set of genes directly extracted from omics files
- Aligned: Filters non-overlapping genes and selects genes shared across cancer types with z-score normalization
- Top: Identifies most significant features using multi-class ANOVA with Benjamini-Hochberg correction (FDR < 0.05), followed by z-score normalization
For prognostic model development, a common workflow integrates [60]:
- Single-cell analysis to identify relevant cell subpopulations and marker genes
- Weighted Gene Co-expression Network Analysis (WGCNA) to identify metabolic-related modules and hub genes
- Machine learning algorithms (e.g., LASSO-Cox) for feature selection and model construction
- Validation across multiple cohorts and experimental verification of key targets
Figure 1: Comprehensive Workflow for Multi-Omics Integration in Cancer Studies. This diagram outlines the major stages from sample processing to clinical application, highlighting the parallel processing of different molecular layers and their convergence through integration strategies.
Key Research Reagents and Computational Tools
Table 3: Essential Research Resources for Multi-Omics Cancer Studies
| Category | Resource/Reagent | Function/Application | Key Features |
|---|---|---|---|
| Wet-Lab Reagents | 10x Genomics Chromium X | Single-cell partitioning and barcoding | Enables profiling of >1M cells per run with multimodal compatibility [55] |
| BD Rhapsody HT-Xpress | High-throughput single-cell analysis | Improved sensitivity for transcriptome and immune profiling [55] | |
| Tn5 Transposase | Chromatin tagging in scATAC-seq | Selective labeling of accessible chromatin regions [55] | |
| Unique Molecular Identifiers (UMIs) | Single-cell barcoding strategy | Minimizes technical noise in transcriptome and proteome sequencing [55] | |
| Computational Tools | MLOmics Database | Preprocessed multi-omics data | 8,314 patient samples, 32 cancer types, four omics types [59] |
| CellChat | Cell-cell communication inference | Models interaction networks from scRNA-seq data [61] | |
| MOFA+ | Multi-omics factor analysis | Bayesian group factor analysis for latent representation [57] | |
| Scissor Algorithm | Phenotype-association analysis | Identifies cell subgroups linked to clinical outcomes [61] | |
| Reference Databases | TCGA (The Cancer Genome Atlas) | Primary multi-omics data source | Pan-cancer molecular profiles with clinical annotations [59] |
| STRING | Protein-protein interaction networks | Functional enrichment and network analysis [59] | |
| KEGG | Pathway mapping and analysis | Metabolic and signaling pathway visualization [59] |
For researchers entering the multi-omics field, several publicly available resources provide standardized datasets and processing pipelines:
MLOmics offers 20 task-ready datasets for machine learning models, including pan-cancer classification and cancer subtype clustering, with precomputed baselines using methods like XGBoost, Subtype-GAN, and XOmiVAE [59]. The database provides three feature versions (Original, Aligned, Top) to support different analytical needs and includes complementary resources for biological analysis such as survival analysis and volcano plots [59].
The Cancer Genome Atlas (TCGA) remains the foundational resource for cancer multi-omics data, accessible through the Genomic Data Commons (GDC) Data Portal [59]. These data are organized by cancer type, with omics data for individual patients scattered across multiple repositories, requiring careful sample linking and metadata review [59].
Visualization and Interpretation of Multi-Omics Data
Effective visualization is crucial for interpreting complex multi-omics relationships. The following diagram illustrates a network-based approach for integrating genomic variants with transcriptomic and epigenomic regulators:
Figure 2: Network View of Multi-Omics Interactions in Cancer. This diagram illustrates how variations across different molecular layers converge to influence clinical phenotypes, with the integration node representing combinatorial effects that provide superior predictive power.
Integrating genomics, transcriptomics, and epigenomics provides a powerful framework for addressing the fundamental challenge of intra-tumoral heterogeneity in cancer research. By capturing the dynamic interactions between genetic alterations, transcriptional programs, and regulatory mechanisms, multi-omics approaches enable more accurate molecular subtyping, prognosis prediction, and therapeutic target identification. While technical challenges remain in data integration, standardization, and interpretation, continued advancements in sequencing technologies, computational methods, and public resources like MLOmics are accelerating the translation of multi-omics findings into clinical applications. As these approaches mature, they hold exceptional promise for advancing personalized cancer therapy by fully characterizing the molecular landscape of individual tumors, ultimately improving patient outcomes through more precise and effective treatment strategies.
The comprehensive characterization of tumor genomes has fundamentally altered our understanding of cancer, revealing astonishing genetic heterogeneity even among histologically identical cancers. Next-generation sequencing (NGS) has emerged as a pivotal technology to decode this complexity, enabling high-throughput, parallel analysis of multiple genes from limited clinical samples [4] [20]. Within cancer heterogeneity studies, NGS panels provide a critical bridge between broad discovery platforms and clinically actionable findings, allowing researchers and clinicians to navigate the intricate landscape of somatic variations while maintaining practical utility for therapeutic decision-making. The targeted design of these panels facilitates streamlined interpretation and optimized diagnostic yield, particularly in malignancies with known genetic heterogeneity [62]. This technical guide examines the implementation of NGS panels for matched therapy in advanced cancers, focusing on the practical frameworks that translate genomic insights into clinical applications within the paradigm of precision oncology.
NGS Technology and Platform Selection
Core Sequencing Technologies and Principles
Next-generation sequencing represents a revolutionary leap in genomic technology, enabling massive parallel sequencing of DNA fragments simultaneously, in contrast to traditional Sanger sequencing which processes fragments sequentially [4]. The core NGS workflow involves multiple critical steps: sample preparation, library construction, sequencing, and bioinformatic data analysis [4]. During library preparation, genomic DNA is fragmented, and adapters are ligated to facilitate amplification and sequencing [4]. Various NGS platforms employ distinct detection chemistries, including Illumina's sequencing-by-synthesis with fluorescently labeled nucleotides, Ion Torrent's semiconductor-based detection of hydrogen ions released during DNA polymerization, and Pacific Biosciences' single-molecule real-time (SMRT) sequencing [4].
Table 1: Comparison of NGS Analysis Approaches in Cancer Diagnostics
| Feature | Targeted Gene Panels | Whole Exome Sequencing (WES) | Whole Genome Sequencing (WGS) |
|---|---|---|---|
| Genomic Coverage | Predefined gene sets (dozens to hundreds of genes) | All protein-coding exons (~1-2% of genome) | Entire genome (coding + non-coding) |
| Sequencing Depth | Very high (500-1000x+) | Moderate (100-200x) | Lower (30-100x) |
| Primary Application | Identifying mutations in known cancer-associated genes | Discovery of novel coding variants | Comprehensive variant detection including structural variants |
| Data Complexity | Manageable, focused | High, requires significant filtering | Very high, complex interpretation |
| Turnaround Time | Short (4-10 days) | Moderate (2-4 weeks) | Long (3-6 weeks) |
| Cost Effectiveness | High for clinical application | Moderate | Lower for routine use |
| Sample Requirements | Low input, compatible with FFPE | Higher input, not ideal for FFPE | Highest input requirements |
Selection Criteria for NGS Panels in Cancer Research
Choosing an appropriate NGS method requires careful consideration of research objectives, desired genomic information, and sample availability [20]. Targeted sequencing panels have emerged as the most widely used NGS method in oncology research and clinical practice, balancing comprehensive genomic coverage with practical considerations [20]. These panels simultaneously analyze multiple pre-selected sets of genes, research-relevant variants, or biomarkers from a single sample, including oncogenes, tumor suppressor genes, mutational hotspots, and structural variants [20]. The hybridization-capture or amplicon-based target enrichment strategies employed in these panels allow for deep sequencing coverage even from compromised samples like FFPE tissue [21]. For the specific application of matched therapy selection, panels must include genes with established clinical actionability while maintaining flexibility to incorporate emerging biomarkers as clinical evidence evolves.
Implementation Framework for NGS-Based Matched Therapy
Laboratory Workflow and Quality Assurance
The successful implementation of NGS panels for matched therapy requires a rigorously validated laboratory workflow encompassing pre-analytical, analytical, and post-analytical phases. The process begins with sample acquisition and assessment, where factors such as tumor content, nucleic acid quality, and quantity are determined [21] [20]. For FFPE samples—the most common specimen type in clinical oncology—DNA extraction must overcome formalin-induced cross-linking and fragmentation, with typical minimum tumor content requirements of 10-20% [20]. Library preparation follows, utilizing either amplicon-based or hybridization-capture approaches, with the latter demonstrating superior performance for detecting diverse variant types including insertions/deletions (indels) and copy number alterations [21].
Table 2: Key Performance Metrics for Validated NGS Panels in Cancer
| Performance Metric | Acceptance Criteria | Reported Performance in Validated Panels |
|---|---|---|
| Sensitivity | >95% for SNVs at ≥5% VAF | 96.98-98.23% [21] [63] |
| Specificity | >99% | 99.99% [21] [63] |
| Reproducibility | >99% | 99.99% [21] |
| Limit of Detection | ≤5% VAF for SNVs | 2.8-3.0% for SNVs [21] [63] |
| Turnaround Time | <10 working days | 4-10 days [21] |
| Coverage Uniformity | >95% | >98% [21] |
Quality control metrics must be established throughout the workflow, including DNA quality assessments, library quantification, sequencing coverage depth, and uniformity [21]. The validation of an NGS panel should establish critical parameters including sensitivity, specificity, reproducibility, and limit of detection for different variant types [63]. For instance, the NCI-MATCH trial validation demonstrated an overall sensitivity of 96.98% for 265 known mutations and 99.99% specificity, with limits of detection varying by variant type: 2.8% for single-nucleotide variants (SNVs), 10.5% for insertion/deletions (indels), and 6.8% for large indels [63].
Bioinformatic Analysis and Variant Interpretation
The bioinformatic pipeline for NGS data analysis represents a critical component in the translation of raw sequencing data to clinically actionable information. Following sequencing, raw data undergoes primary analysis including base calling, demultiplexing, and quality assessment [4]. Alignment to reference genomes (typically hg19 or GRCh38) is followed by variant calling using specialized algorithms optimized for different variant types: Mutect2 for SNVs and small indels, CNVkit for copy number variations, and LUMPY for gene fusions [7]. Variant annotation incorporates population frequency databases, functional prediction algorithms, and cancer-specific knowledgebases to prioritize potentially actionable findings [4].
The interpretation of genomic variants utilizes standardized classification frameworks such as the Association for Molecular Pathology (AMP) guidelines, which categorize variants into four tiers: Tier I (variants of strong clinical significance), Tier II (variants of potential clinical significance), Tier III (variants of unknown significance), and Tier IV (benign or likely benign variants) [7]. Similarly, the ESMO Scale for Clinical Actionability of Molecular Targets (ESCAT) provides a evidence-based framework for prioritizing molecular targets based on the strength of clinical evidence supporting matched therapies [64] [65]. This structured approach to variant interpretation ensures consistent and evidence-based translation of genomic findings into therapeutic recommendations.
Real-World Evidence and Clinical Trial Data
Clinical Utility and Patient Outcomes
The implementation of NGS panels for matched therapy selection has demonstrated significant clinical utility across multiple real-world studies and clinical trials. In a comprehensive analysis of Vall d'Hebron Institute of Oncology's precision medicine program spanning 2014-2024, which included 12,168 unique patients, the detection rate of actionable alterations increased substantially from 10.1% in 2014 to 53.1% in 2024, paralleling advances in drug biomarkers and sequencing technology [64]. Critically, 10.1% of patients overall received molecularly matched therapies, with rates rising from 1% in 2014 to 14.2% in 2024 [64]. Among patients with actionable alterations, 23.5% received targeted therapies, meeting ESMO's recommended benchmark for molecularly guided therapy implementation [64].
The phase 2 ROME trial provided randomized evidence supporting the efficacy of NGS-guided therapy, demonstrating significantly improved outcomes for patients receiving tailored treatment compared to standard of care [66]. The trial reported a superior objective response rate (17.5% versus 10%; P = 0.0294) and improved median progression-free survival (3.5 months versus 2.8 months; hazard ratio = 0.66) in the genomically guided arm [66]. Similarly, a South Korean real-world study of 990 patients with advanced solid tumors found that 13.7% of patients with Tier I variants received NGS-based therapy, with 37.5% of treated patients achieving partial response and 34.4% achieving stable disease [7]. These findings collectively substantiate the clinical value of NGS-guided therapy matching in advanced cancers.
Table 3: Clinical Outcomes from NGS-Guided Therapy Implementation
| Study / Trial | Patient Population | Actionable Alteration Detection Rate | Therapy Matching Rate | Clinical Outcomes |
|---|---|---|---|---|
| VHIO PMP (2014-2024) [64] | 12,168 patients with advanced cancers | 53.1% (2024) | 23.5% of patients with actionable alterations | Matched therapy rates increased from 1% to 14.2% |
| ROME Trial [66] | 400 randomized patients with metastatic solid tumors | Not specified | 100% in TT arm | ORR: 17.5% vs 10% (SoC); mPFS: 3.5 vs 2.8 months |
| SNUBH Real-World [7] | 990 patients with advanced solid tumors | 26.0% (Tier I) 86.8% (Tier II) | 13.7% of Tier I patients | 37.5% PR, 34.4% SD in treated patients |
| ESMO Benchmark [64] | Minimum standard for molecularly guided therapy | Variable | Recommended: 25% Optimal: 33% | Quality care indicator |
Molecular Tumor Boards and Interpretation Frameworks
The molecular tumor board (MTB) represents a critical multidisciplinary forum for interpreting NGS results and translating them into personalized therapeutic recommendations. These boards typically include molecular pathologists, medical oncologists, bioinformaticians, genetic counselors, and pharmacists who collectively review genomic findings in the context of individual patient characteristics [64] [66]. The ROME trial highlighted the essential role of MTBs, with 127 weekly meetings conducted to review 897 patients with potentially actionable alterations before randomization [66]. Standardized frameworks such as ESCAT provide MTBs with structured approaches to prioritize molecular targets based on evidence levels, facilitating consistent decision-making across different tumor types [64] [65]. The integration of liquid biopsy data, particularly for monitoring resistance mutations and tumor evolution, has further enhanced the capability of MTBs to guide therapy throughout the disease course [64].
Essential Research Reagents and Technical Solutions
The implementation of robust NGS panels for matched therapy requires carefully selected research reagents and technical components that ensure reproducibility, accuracy, and clinical utility. The following table details essential solutions utilized in validated NGS workflows.
Table 4: Essential Research Reagent Solutions for NGS Panel Implementation
| Reagent Category | Specific Examples | Function | Technical Considerations |
|---|---|---|---|
| Nucleic Acid Extraction Kits | QIAamp DNA FFPE Tissue Kit [7] | Isolation of high-quality DNA from FFPE specimens | Optimized for cross-linked, fragmented DNA; includes deparaffinization steps |
| Target Enrichment Systems | Agilent SureSelectXT [7], Sophia Genetics Capture Kit [21] | Hybridization-based capture of target genomic regions | Biotinylated oligonucleotide probes; compatibility with automation systems |
| Library Preparation Kits | Illumina TruSeq, Ion AmpliSeq | Conversion of genomic DNA to sequencing-ready libraries | Adapter ligation, PCR amplification; optimized for low-input samples |
| Sequence Capture Panels | SNUBH Pan-Cancer v2.0 (544 genes) [7], TTSH-oncopanel (61 genes) [21] | Targeted enrichment of cancer-relevant genes | Customizable content; balance between comprehensiveness and practicality |
| Quality Control Assays | Qubit dsDNA HS Assay [7], Bioanalyzer DNA Kit [7] | Quantification and qualification of nucleic acids | Fluorometric methods preferred over UV spectrophotometry for accuracy |
| Reference Standards | HD701 Multiplex Reference Standard [21] | Assay validation and quality monitoring | Contains known variants at predetermined frequencies for performance tracking |
Signaling Pathways and Actionable Alterations in Precision Oncology
The therapeutic actionability of genomic alterations identified through NGS panels is grounded in their roles within critical cancer signaling pathways. The most frequently altered genes in solid tumors include KRAS, EGFR, BRAF, PIK3CA, TP53, and BRCA1/2, which function within interconnected networks driving oncogenesis [7] [21]. The MAPK pathway (KRAS, BRAF, EGFR) represents one of the most commonly dysregulated signaling cascades across multiple cancer types, with targeted therapies available for specific mutations such as BRAF V600E and EGFR sensitizing mutations [66]. Similarly, alterations in PI3K-AKT-mTOR signaling (PIK3CA, PTEN) and DNA damage response pathways (BRCA1/2, ATM) confer sensitivity to pathway inhibitors and PARP inhibitors, respectively [64].
The expanding repertoire of tumor-agnostic biomarkers has further transformed the therapeutic landscape, enabling histology-independent treatment approaches based solely on molecular characteristics. These include microsatellite instability-high (MSI-H) status responsive to immune checkpoint inhibitors, NTRK gene fusions targeted by larotrectinib and entrectinib, and high tumor mutational burden (TMB) predicting response to immunotherapy [66]. The integration of these biomarkers into NGS panels creates a comprehensive platform for matching diverse molecular alterations to appropriate targeted therapies across cancer types.
The implementation of NGS panels for matched therapy in advanced cancers represents a cornerstone of modern precision oncology, providing a robust framework to navigate tumor heterogeneity and identify actionable therapeutic targets. The real-world evidence and clinical trial data demonstrate consistently that comprehensive genomic profiling enables personalized treatment strategies with improved clinical outcomes across diverse cancer types. Future developments in the field will likely include the expanded integration of liquid biopsies for dynamic monitoring of tumor evolution, the incorporation of transcriptomic and epigenetic analyses into multidimensional assessment platforms, and the refinement of bioinformatic algorithms for interpreting complex genomic data. As the catalog of actionable biomarkers continues to grow and therapeutic options expand, NGS panels will remain essential tools in the translation of cancer genomics into clinically meaningful interventions, ultimately advancing the goal of personalized cancer care tailored to individual molecular profiles.
Navigating Technical and Analytical Challenges in NGS-Based Heterogeneity Studies
Tumor heterogeneity represents a fundamental obstacle in the diagnosis and treatment of cancer, encompassing the genetic, epigenetic, and phenotypic diversity exhibited by malignant cell populations [67]. This heterogeneity manifests spatially (within individual lesions and between different metastatic sites) and temporally as tumors evolve under selective pressures such as therapy [67]. The pervasive nature of this diversity means that a single tissue biopsy, often considered the gold standard for tumor diagnosis, may provide only a limited snapshot of the complete molecular landscape, potentially missing critical subclones that drive disease progression and therapeutic resistance [67] [68]. High levels of intratumoral heterogeneity have been unequivocally linked to worse patient survival [69], underscoring the critical need for sampling approaches that comprehensively capture a tumor's genomic architecture.
Within this context, next-generation sequencing (NGS) has emerged as a pivotal technology for delineating the complex genetic landscape of cancers [4]. However, the utility of NGS is fundamentally constrained by the sampling method used to obtain genetic material. Traditional single-region tissue biopsies are susceptible to sampling bias, failing to represent the full spectrum of molecular alterations present across different tumor regions and metastatic sites [69]. This review examines how emerging approaches—particularly liquid biopsy and sequential profiling strategies—are overcoming the challenges posed by tumor heterogeneity, thereby enabling more comprehensive molecular characterization to guide precision oncology.
Spatial and Temporal Dimensions of Tumor Heterogeneity
Spatial Heterogeneity: Intra- and Inter-lesional Diversity
Spatial heterogeneity occurs at multiple levels, with significant genetic differences existing both within individual tumors (intra-lesional) and between distinct metastatic lesions (inter-lesional) [67]. Multi-region sequencing studies have revealed that distinct tumor regions contain unique sets of clonal, sub-clonal, and private mutations, creating a fractal-like architecture with spatially separated populations [69]. This spatial diversity has profound clinical implications, as driver genetic alterations—which may represent potential therapeutic targets—can be distributed heterogeneously within a single tumor [69].
A 2025 study investigating multiple metastatic lesions across various cancer types demonstrated substantial inter-lesional heterogeneity, with variable mutation frequencies (VAFs ranging from 1.5% to 71.4%) across different anatomical sites [67]. Hierarchical clustering of mutational profiles revealed distinct patterns among samples from the same patient, reflecting the genomic divergence that occurs as tumors metastasize and evolve in different tissue environments [67]. For instance, in one patient with lung adenocarcinoma, biopsies formed two distinct clusters: one with uniformly low VAFs (0-10%) including mediastinal lymph nodes and the right adrenal gland, and another with notably higher VAFs (35.1-58.1%) predominantly encompassing left-sided lesions and liver metastases [67]. This spatial segregation of subclones means that a biopsy from one site may miss clinically actionable mutations present in other regions.
Temporal Heterogeneity and Clonal Evolution
Temporal heterogeneity results from the ongoing process of clonal evolution, wherein tumor cell populations dynamically change over time in response to selective pressures such as anticancer therapies [67]. Under treatment, different clones can employ diverse mechanisms to confer resistance, and simultaneously, multiple tumor sites may show convergent loss of the same suppressor gene as a tool to establish resistance [69]. The seeds of later clonal diversity are typically present very early in tumorigenesis, with intra-tumor heterogeneity becoming increasingly pervasive as the disease progresses [69].
The dynamic nature of cancer genomes means that a molecular profile obtained at a single time point may quickly become obsolete as new resistant subclones emerge. This evolution is particularly evident in studies tracking resistance mutations, such as those affecting the EGFR pathway in lung cancer, where different resistance mechanisms can emerge simultaneously in different lesions within the same patient [40]. The clinical consequence of this temporal evolution is often the development of "mixed" responses to therapy, where some lesions regress while others progress, reflecting underlying differences in the molecular composition of these tumor sites [67].
Limitations of Conventional Tissue Sampling
Technical and Practical Constraints of Tissue Biopsies
Tissue biopsy, while remaining the diagnostic gold standard, faces numerous limitations in the context of tumor heterogeneity. As an invasive procedure, it carries risks of complications and may be technically challenging for tumors in difficult-to-access anatomical locations [68] [70]. Furthermore, sequential tissue sampling to monitor temporal evolution is often not feasible due to patient discomfort, cumulative risks, and logistical constraints [67]. From a molecular profiling perspective, the limited tissue obtained from a biopsy may be insufficient for comprehensive NGS analysis, particularly when prioritization must be given to histopathological diagnosis over molecular studies [70].
The practical challenges of tissue sampling are compounded by its inherent inability to fully represent spatial heterogeneity. Research comparing multi-region tissue sampling with liquid biopsy has demonstrated that 22 tissue variants were absent in matched liquid biopsy samples, while 18 liquid biopsy-exclusive variants were detected (VAFs: 0.2-2.8%), confirming that both approaches capture complementary rather than identical mutational profiles [67]. This sampling limitation is particularly problematic for clinical decision-making, as alterations missed by a single-region biopsy may underlie resistance to targeted therapies.
Impact of Sampling Strategy on Mutation Detection
The sampling method can fundamentally determine NGS results and their clinical utility. Studies examining different tissue sampling strategies—including single biopsy, combined local biopsies, and combined multi-regional biopsies—have revealed significant differences in mutation detection capabilities [69]. While sequencing samples from spatially neighboring regions generally shows similar genetic compositions with few private mutations, pooling samples from multiple distinct areas of the primary tumor increases the robustness of detecting clonal mutations without necessarily increasing the total number of identified mutations [69].
Table 1: Comparison of Tissue Sampling Strategies for NGS Analysis
| Sampling Strategy | Trunk Mutation Detection | Sub-clonal Mutation Detection | Practical Feasibility | Technical Challenges |
|---|---|---|---|---|
| Single Biopsy | Variable (15.9-81.7%) | Limited, region-specific | High | Risk of sampling bias |
| Multiple Local Samples | Improved | Moderate | Moderate | Increased procedural complexity |
| Multi-regional Pooling | Highest robustness | Comprehensive | Low | Significant logistical challenges |
In hypermutating tumors, increasing sample size can easily dilute sub-clonal private mutations below detection thresholds, creating special considerations for sequencing approach and coverage [69]. Research has shown that in such cases, only 15.9% of mutations identified in a single biopsy sample represented trunk mutations, compared to 71.4% in global samples that integrated material from multiple regions [69]. These findings highlight the critical interplay between sampling strategy and the genomic architecture of individual tumors.
Liquid Biopsy: A Minimally Invasive Approach for Comprehensive Profiling
Fundamental Principles and Biological Basis
Liquid biopsy (LBx) represents a minimally invasive approach that analyzes tumor-derived material in body fluids, most commonly blood, to assess the comprehensive genetic profile of solid tumors [40] [68]. This approach leverages the fact that tumors continuously release various biomarkers into the circulation, including circulating tumor DNA (ctDNA), circulating tumor cells (CTCs), extracellular vesicles, and cell-free RNA [40] [68]. These analytes provide real-time insights into the evolving tumor genome, capturing contributions from multiple tumor sites simultaneously [67].
The biological foundation of liquid biopsy lies in the release of tumor-derived material through processes such as apoptosis, necrosis, and active secretion [67]. CtDNA, in particular, has emerged as a valuable biomarker due to its short half-life (approximately 2 hours), which enables near real-time monitoring of tumor dynamics [40]. Compared to circulating free DNA (cfDNA) from normal cells, ctDNA fragments in cancer patients tend to be shorter (20-50 base pairs), and the ratio of ctDNA to total cfDNA can vary considerably (0.1-1.0% in early-stage disease, higher in advanced cancers) [40]. This differential fragment length and representation provides opportunities for both quantitative and qualitative assessment of tumor burden and evolution.
Analytical Performance in Capturing Heterogeneity
Recent studies have directly evaluated the capability of liquid biopsy to capture tumor heterogeneity by comparing genetic profiles from multiple metastatic lesions with matched LBx samples. A 2025 study analyzing 56 postmortem tissue samples from eight cancer patients against pre-mortem liquid biopsies found that LBx identified 51 variants (4-17 per patient, VAFs: 0.2-31.1%) that overlapped with mutations from tissue samples by 33-92% [67]. This partial overlap demonstrates that while liquid biopsy effectively captures a substantial proportion of the tumor mutational landscape, it also detects unique variants not identified in single or even multi-region tissue samples.
Table 2: Comparison of Mutations Detected in Tissue vs. Liquid Biopsy [67]
| Detection Category | Number of Mutations | Mean VAF Range | Clinical Implications |
|---|---|---|---|
| Exclusively in Tissue | 22 variants across patients | 15.4% (mean) | Potential sampling bias of tissue approach |
| Exclusively in Liquid Biopsy | 18 variants across patients | 0.2-2.8% | Liquid biopsy captures unique subclones |
| Overlapping Detection | 33-92% per patient | Tissue: 1.5-71.4%; LBx: 0.2-31.1% | Complementary nature of approaches |
Notably, liquid biopsy demonstrated sensitivity in detecting emerging resistance mutations that were absent in matched tissue biopsies. In patients with gastrointestinal cancers who developed acquired resistance to targeted therapies, LBx detected resistance mutations not found in tissue samples in up to 78% of cases [67], highlighting its particular utility for monitoring temporal evolution and therapy resistance.
Next-Generation Sequencing Technologies for Heterogeneity Assessment
NGS Methodologies and Technical Considerations
Next-generation sequencing represents a revolutionary leap in genomic technology, enabling the simultaneous parallel sequencing of millions to billions of DNA fragments, a stark contrast to traditional Sanger sequencing that processes fragments individually [4]. The NGS workflow encompasses several critical steps: sample preparation, library construction, sequencing, and data analysis [4]. For library construction, genomic DNA is fragmented to appropriate sizes (typically around 300 bp) and adapters are attached, followed by amplification and qualification steps to ensure library quality [4].
The selection of NGS approach depends on the specific research or clinical question. Whole-genome sequencing (WGS) provides the most comprehensive coverage but generates immense datasets with only a small fraction clinically actionable. Whole-exome sequencing (WES) focuses on protein-coding regions, representing approximately 1-2% of the genome but encompassing the majority of known disease-associated variants. Targeted sequencing panels concentrate on specific genes or regions of interest, allowing for higher sequencing depth (often exceeding 1000x), which is particularly important for detecting low-frequency subclones in heterogeneous samples [4].
When applied to liquid biopsy samples, NGS must be optimized to detect rare variants against a background of predominantly wild-type DNA. Techniques such as unique molecular identifiers (UMIs) and error-suppression algorithms are employed to distinguish true low-frequency variants from sequencing artifacts, enabling reliable detection of ctDNA alterations at frequencies as low as 0.1% [71]. The high sensitivity required for these applications necessitates specialized bioinformatic approaches and validation protocols to ensure analytical accuracy.
Comparison with Traditional Molecular Detection Methods
Traditional molecular detection methods such as immunohistochemistry (IHC), fluorescence in situ hybridization (FISH), and PCR-based techniques have historically been the mainstays of cancer molecular profiling. However, these methods possess significant limitations in the context of tumor heterogeneity. IHC detects protein expression but cannot identify specific genetic alterations [72]. FISH is considered the gold standard for detecting gene fusions and amplifications but is limited to known targets and cannot identify novel fusion partners or point mutations [72]. PCR methods like ARMS-PCR offer high sensitivity for detecting specific known mutations but have limited multiplexing capability and may miss novel or unexpected alterations [72].
Table 3: Comparison of Genomic Profiling Technologies for Assessing Tumor Heterogeneity
| Technology | Multiplexing Capability | Detection of Novel Alterations | Sensitivity | TMB/MSI Assessment |
|---|---|---|---|---|
| IHC | Low (single protein) | No | High for protein expression | Limited (IHC-based surrogate) |
| FISH | Low (1-2 targets) | Limited | Moderate | No |
| PCR-based | Moderate (10s of targets) | No | High (0.1-0.001%) | No |
| NGS | High (100s of genes) | Yes | Moderate-high (1-5%) | Yes |
NGS overcomes many of these limitations by simultaneously assessing point mutations, insertions/deletions, copy number alterations, and gene rearrangements across hundreds of genes in a single assay [72]. Furthermore, NGS data can be leveraged to calculate emerging biomarkers such as tumor mutational burden (TMB) and microsatellite instability (MSI), which have implications for immunotherapy response prediction [72]. This comprehensive genomic profiling capability makes NGS particularly well-suited for interrogating tumor heterogeneity, though it requires more complex infrastructure, longer turnaround times, and higher costs compared to targeted assays.
Experimental Design and Methodological Protocols
Integrated Tissue and Liquid Biopsy Sampling Protocol
To comprehensively capture both spatial and temporal heterogeneity, an integrated approach combining multi-region tissue sampling with serial liquid biopsies is recommended. For tissue sampling, the protocol should include:
- Radiologically-guided sampling of distinct tumor regions (core, peripheral, intermediate) and, when feasible, geographically separated metastatic lesions [73].
- Collection of multiple cores (minimum 3-4) from each sampled region, with one core reserved for histopathological validation and others for molecular analysis.
- Documentation of spatial relationships between samples, including distance from tumor center and necrotic areas.
- Standardized processing with allocation of material for both fresh-frozen and FFPE preservation to enable different analytical applications.
For liquid biopsy integration, the protocol should specify:
- Blood collection in specialized tubes (e.g., Streck Cell-Free DNA, PAXgene Blood cDNA) at multiple timepoints: baseline (same day as tissue biopsy), during treatment, at progression.
- Processing within specified timeframes (typically within 2-4 hours of collection) with double centrifugation to obtain platelet-poor plasma.
- cfDNA extraction using silica-membrane or magnetic bead-based methods optimized for short fragment recovery.
- Quality control assessment using fluorometric quantification and fragment analysis to confirm the presence of the characteristic cfDNA fragmentation pattern.
NGS Library Preparation and Sequencing for Heterogeneity Studies
Library preparation for heterogeneity studies requires special consideration to maintain representation of subclonal populations:
- Input DNA quantification: For tissue samples, require minimum 50 ng DNA; for cfDNA, use 20-100 ng input depending on yield.
- Library construction: Employ hybridization capture-based approaches for targeted sequencing, as these demonstrate better uniformity compared to amplicon-based methods, reducing dropout of regions with GC bias.
- Unique Molecular Indices (UMIs): Incorporate UMIs during library preparation to enable bioinformatic correction of PCR and sequencing errors, essential for accurate detection of low-frequency variants.
- Sequencing depth: Target coverage of 500-1000x for tissue samples and 3000-5000x for liquid biopsies to reliably detect subclonal variants present at 1-5% VAF.
For data analysis, implement a specialized bioinformatic pipeline including:
- UMI-aware alignment and variant calling tools (e.g., MuTect2, VarScan2)
- Clustering analysis of mutations based on VAF distributions to infer subclonal architecture
- Phylogenetic tree reconstruction to model evolutionary relationships between subclones
Research Reagent Solutions for Tumor Heterogeneity Studies
Table 4: Essential Research Reagents for Tumor Heterogeneity Studies
| Reagent Category | Specific Examples | Function in Experimental Workflow |
|---|---|---|
| Blood Collection Tubes | Streck Cell-Free DNA BCT, PAXgene Blood cDNA Tube | Stabilize nucleated blood cells and prevent genomic DNA contamination of plasma |
| Nucleic Acid Extraction Kits | QIAamp Circulating Nucleic Acid Kit, MagMAX Cell-Free DNA Isolation Kit | Isolate high-quality cfDNA from plasma with recovery of short fragments |
| Library Preparation Kits | Illumina TruSight Oncology 500, Thermo Fisher Oncomine Pan-Cancer Panel | Prepare sequencing libraries from limited input DNA with incorporation of UMIs |
| Target Enrichment | IDT xGen Lockdown Probes, Twist Human Core Exome | Capture genomic regions of interest with uniform coverage |
| Hybridization Reagents | Illumina Hyb Buffer, IDT xGen Hybridization Capture | Enable specific binding of target regions to capture probes |
| Sequencing Controls | Seraseq ctDNA Reference Materials, Horizon Multiplex I cfDNA Reference | Validate assay performance and detect limits for variant calling |
Data Interpretation and Clinical Translation
Analytical Frameworks for Heterogeneity Data
Interpreting NGS data from multi-region sampling and liquid biopsies requires specialized analytical approaches that move beyond simple variant calling. Computational methods for reconstructing subclonal architecture typically leverage variant allele frequency distributions across multiple samples to infer the prevalence of different subclones and their evolutionary relationships [69]. These phylogenetic approaches model tumor evolution as a branching process, with trunk mutations representing early events present in all tumor cells, and branch mutations reflecting later divergence in different regions.
When analyzing serial liquid biopsies, the changing VAF trajectories of specific mutations can provide insights into clonal dynamics in response to therapy. Sensitive clones decrease under effective treatment pressure while resistant subclones expand, creating characteristic patterns in the ctDNA profile. Computational approaches such as PyClone, PhyloWGS, and EXPANDS have been developed specifically to deconvolute this complex mixture of subpopulations from bulk sequencing data, enabling quantification of subclonal diversity and tracking of evolving populations over time.
Clinical Validation and Utility
The clinical utility of heterogeneity-informed approaches is increasingly supported by evidence across multiple cancer types. In lung cancer, comprehensive genomic profiling using NGS has become standard for identifying actionable targets such as EGFR, ALK, ROS1, and BRAF mutations [72]. The Chinese Expert Consensus on NGS recommends NGS testing for all patients with advanced lung adenocarcinoma, and consideration for patients with mixed histology or clinical features associated with driver mutations (young age, light/never smoking history) [72].
Liquid biopsy has demonstrated particular clinical value in scenarios where tissue is insufficient or unavailable, when monitoring response to therapy, and when investigating mechanisms of resistance [40] [70]. Studies have shown that changes in ctDNA levels often precede radiographic evidence of response or progression by several weeks, providing an early indicator of treatment efficacy [40]. Furthermore, the ability of liquid biopsy to identify heterogeneous resistance mechanisms—such as multiple different EGFR resistance mutations in the same patient—enables more informed subsequent treatment decisions [67] [40].
Visualizing Concepts and Workflows
Figure 1: Conceptual framework for addressing tumor heterogeneity through integrated sampling approaches, highlighting the relationship between different forms of heterogeneity and corresponding solutions.
Figure 2: Integrated workflow for comprehensive tumor heterogeneity assessment, combining multi-region tissue sampling with serial liquid biopsies and NGS analysis.
The challenges posed by tumor heterogeneity to accurate diagnosis and effective treatment are substantial, but emerging approaches that leverage NGS technologies are progressively overcoming these limitations. Liquid biopsy, particularly when combined with targeted NGS panels, provides a minimally invasive means to capture both spatial and temporal heterogeneity, offering a complementary approach to traditional tissue sampling [67] [40]. The integration of these methodologies enables more comprehensive molecular profiling that reflects the complete genomic landscape of a patient's cancer, moving beyond the limitations of single-region, single-timepoint assessments.
Future directions in the field include the refinement of single-cell sequencing technologies, which promise to resolve heterogeneity at its most fundamental level by characterizing individual tumor cells [4]. Additionally, the integration of radiomic features from medical imaging with genomic heterogeneity data may provide non-invasive approaches to mapping spatial variations in molecular characteristics [73]. As these technologies mature, their implementation in clinical trials and routine practice will be essential for realizing the promise of truly personalized cancer therapy tailored to each patient's evolving disease.
The application of Next-Generation Sequencing (NGS) in cancer heterogeneity studies presents significant bioinformatics challenges that impact the accuracy and clinical utility of genomic findings. This technical guide examines the core hurdles in data management, variant calling, and interpretation within the context of cancer genomics. We evaluate performance discrepancies among twelve common variant calling pipelines, which demonstrated significant variability with overall high specificity (99.99%) but low sensitivity in detecting single nucleotide variants across different tumor heterogeneity levels. The review highlights advanced methodologies including machine learning approaches such as deep convolutional neural networks that achieve 94.1% concordance with manual expert review, and customized targeted panels that reduce turnaround time from 3 weeks to 4 days while maintaining 99.99% reproducibility. The analysis underscores that effective navigation of these bioinformatics challenges requires optimized computational frameworks, robust validation protocols, and integrated multi-omics approaches to accurately decipher tumor evolution and therapeutic resistance mechanisms.
Next-generation sequencing (NGS) has revolutionized oncology by enabling comprehensive genomic profiling of tumors, thereby advancing our understanding of cancer heterogeneity and progression [4]. This technological paradigm shift has facilitated the identification of genetic alterations that drive cancer progression, enabling personalized treatment plans that target specific mutations and improve patient outcomes [4]. The foundational principle of NGS lies in its ability to perform massive parallel sequencing, processing millions of DNA fragments simultaneously, which has significantly reduced the time and cost associated with genomic analysis compared to traditional Sanger sequencing [4].
Despite these advancements, the implementation of NGS in cancer research presents substantial bioinformatics challenges, particularly when studying tumor heterogeneity [74]. Cancer is a result of the transformation of cells through which they obtain uncontrolled growth, and understanding the molecular changes underlying this transformation requires sophisticated computational approaches to analyze the complex genomic data [74]. The bioinformatics hurdles span the entire NGS workflow, from data management of vast sequencing datasets to accurate variant calling and functional interpretation of genomic alterations in the context of clonal diversity and evolution [48].
This technical guide examines the core bioinformatics challenges in NGS-based cancer heterogeneity studies, focusing on three critical areas: data management strategies for handling large-scale genomic data; variant calling methodologies and their performance limitations; and interpretation frameworks for deriving biological and clinical insights from complex genomic data. Through systematic evaluation of current approaches and emerging solutions, this review provides a comprehensive framework for optimizing NGS data analysis in cancer research, with particular emphasis on addressing tumor heterogeneity through advanced computational methods.
Data Management Challenges in NGS Cancer Studies
Scale and Complexity of NGS Data
The management of NGS data generated from cancer studies presents monumental challenges due to the enormous volume and inherent complexity of the information. A single whole-genome sequencing run can generate terabytes of raw data, requiring sophisticated storage solutions and efficient data transfer protocols [6]. The binary alignment map (BAM) files containing aligned sequence data, which are fundamental for variant calling, require particularly substantial storage capacity and computational resources for processing and analysis [6]. This data deluge is further complicated in cancer heterogeneity studies, where multiple tumor regions, longitudinal samples, or single-cell analyses are performed to capture the full spectrum of genomic diversity, exponentially increasing data management demands [48].
Cancer studies employing NGS technologies must also contend with significant data heterogeneity, as researchers often integrate genomic data with transcriptomic, epigenetic, and clinical information to obtain a comprehensive view of tumor biology [75]. Each data type possesses unique characteristics, file formats, and analytical requirements, creating formidable obstacles for data integration and unified analysis [6]. The specialized computational infrastructure needed for NGS data management includes high-performance computing clusters, expansive storage systems, and robust bioinformatics support, representing substantial investments that may be prohibitive for some research institutions [7].
Data Privacy and Security Considerations
Genomic data from cancer patients is inherently sensitive, as it not only reveals an individual's predisposition to disease but also carries implications for biological relatives [6]. This creates critical privacy risks, including potential stigmatization and discrimination in employment or insurance contexts, despite legislative protections such as the U.S. Genetic Information Nondiscrimination Act (GINA) [6]. The re-identification of anonymized genomic data remains a significant concern, necessitating implementation of rigorous data security measures including encryption, access controls, and secure data sharing frameworks [6].
Ethical challenges related to genetic testing, including concerns around patient consent and data privacy, must be carefully addressed for the broader implementation of NGS in both research and clinical settings [4]. Data management protocols must balance the imperative for data sharing to advance scientific discovery with the ethical obligation to protect patient privacy, particularly as large-scale collaborative projects like The Cancer Genome Atlas (TCGA) and International Cancer Genome Consortium (ICGC) have demonstrated the tremendous value of shared genomic resources [74] [6].
Variant Calling Methodologies and Performance
Variant Calling Algorithms and Pipeline Configurations
Variant calling represents a critical computational step in NGS analysis that directly impacts the accuracy of mutation detection in cancer genomics. The process involves identifying genomic variants—including single nucleotide variants (SNVs), small insertions and deletions (indels), and structural variants (SVs)—by comparing sequence data from tumor samples to a reference genome [76]. Sophisticated bioinformatics algorithms are employed to distinguish true biological variants from sequencing artifacts, which can arise from various sources including library preparation, cluster amplification, cycle sequencing, or image analysis [77].
Cancer sequencing pipelines typically combine mapping (alignment) algorithms with variant discovery algorithms, and the specific combination significantly influences variant detection performance [74]. Benchmarking studies have evaluated various pipeline configurations incorporating different mapping algorithms (Bwa, Bowtie2, Novoalign) and variant calling algorithms (Mutect2, Varscan, SomaticSniper, Strelka2) [74]. These pipelines demonstrate markedly different performance characteristics, with significant discrepancies in variant calls observed across different tumor heterogeneity levels [74]. The selection of optimal pipeline configurations depends on multiple factors, including sequencing platform, tumor purity, and the specific variant types of interest.
Table 1: Performance Metrics of Variant Calling Pipelines on Simulated Tumor Samples
| Pipeline Combination | Sensitivity (%) | Specificity (%) | Precision (%) | Accuracy (%) |
|---|---|---|---|---|
| Bwa-Mutect2 | 97.14 | 99.99 | 97.14 | 99.99 |
| Bwa-Varscan | 98.23 | 99.99 | 97.14 | 99.99 |
| Bowtie2-Mutect2 | 97.14 | 99.99 | 97.14 | 99.99 |
| Bowtie2-Varscan | 98.23 | 99.99 | 97.14 | 99.99 |
| Novoalign-Mutect2 | 97.14 | 99.99 | 97.14 | 99.99 |
| Novoalign-Varscan | 98.23 | 99.99 | 97.14 | 99.99 |
Technical Validation of Variant Calling Methods
Rigorous validation of variant calling methods is essential to ensure reliable detection of cancer-associated mutations. Analytical validation studies typically assess key performance metrics including sensitivity, specificity, precision, and accuracy under controlled conditions [21]. The limit of detection (LOD) for variant allele frequency (VAF) represents a critical parameter, with most validated panels demonstrating reliable detection of SNVs and indels at VAFs as low as 2.9-3.0% [21]. The input DNA quantity also significantly impacts performance, with most protocols requiring ≥50ng of DNA input for optimal variant detection [21].
Technical reproducibility is another essential validation metric, assessed through replicate sequencing experiments. Advanced targeted NGS panels have demonstrated exceptional reproducibility (99.99%) and repeatability (99.99%) across multiple sequencing runs [21]. This high degree of technical consistency is crucial for clinical applications where reliable detection of low-frequency variants can inform treatment decisions. Longitudinal quality control using reference standards with known mutations further ensures consistent assay performance over time, with coefficient of variation typically maintained below 0.1x for variant allele frequency measurements [21].
Figure 1: NGS Data Analysis Workflow with Critical Bioinformatics Challenges Highlighted
Interpretation of Complex Genomic Data in Cancer Heterogeneity
Tumor Heterogeneity and Clonal Architecture Analysis
The interpretation of genomic data in cancer is profoundly complicated by tumor heterogeneity, which exists at multiple levels including inter-tumor heterogeneity (between different patients), intra-tumor heterogeneity (within a single tumor), and temporal heterogeneity (evolution over time) [48]. Next-generation sequencing enhances the pathologist's traditional microscopic view by enabling comprehensive characterization of this heterogeneity through detection of molecular alterations across different tumor regions and time points [48]. Computational approaches such as SubcloneSeeker have been developed specifically to reconstruct tumor clone structure, enabling interpretation and prioritization of cancer variants within the context of clonal evolution [48].
Single-cell sequencing approaches have further advanced our understanding of cancer heterogeneity by resolving the genomic architecture of individual tumor cells, revealing complex clonal relationships and evolutionary trajectories that are obscured in bulk sequencing analyses [48]. The integration of multiple data types—including genomic, transcriptomic, and epigenetic information—provides a more comprehensive perspective on tumor heterogeneity, enabling researchers to distinguish driver mutations from passenger events and identify therapeutic targets that impact multiple tumor subclones [6]. These multi-omics approaches are particularly valuable for understanding the molecular mechanisms underlying drug resistance and disease relapse [77].
Clinical Interpretation and Actionability Assessment
The translation of genomic findings into clinically actionable insights represents a formidable challenge in cancer bioinformatics. Clinical interpretation frameworks, such as the four-tier system proposed by the Association for Molecular Pathology, categorize variants based on their clinical significance [7]. Tier I variants have strong clinical significance, including FDA-approved drug targets or professional guideline recommendations, while Tier II variants have potential clinical significance, such as FDA-approved treatments for different tumor types or investigational therapies [7]. In real-world clinical implementation, approximately 26.0% of patients harbor tier I variants, and 86.8% carry tier II variants, highlighting the potential for genomically-guided therapy in a substantial proportion of cancer patients [7].
The implementation of NGS-based molecular profiling in clinical practice has demonstrated significant impact on patient care. Among patients with tier I variants, 13.7% received NGS-based therapy, with particularly high rates in thyroid cancer (28.6%), skin cancer (25.0%), gynecologic cancer (10.8%), and lung cancer (10.7%) [7]. Patients who received NGS-guided therapy showed promising treatment outcomes, with 37.5% achieving partial response and 34.4% achieving stable disease, supporting the clinical utility of comprehensive genomic profiling in advanced cancers [7].
Table 2: Clinical Actionability of Genomic Findings in Solid Tumors
| Cancer Type | Patients with Tier I Variants (%) | Patients Receiving NGS-Based Therapy (%) | Treatment Response (Partial Response + Stable Disease) |
|---|---|---|---|
| Thyroid Cancer | 28.6 | 28.6 | 71.4% (5/7) |
| Skin Cancer | 25.0 | 25.0 | 75.0% (6/8) |
| Gynecologic Cancer | 10.8 | 10.8 | 76.9% (10/13) |
| Lung Cancer | 10.7 | 10.7 | 66.7% (8/12) |
| All Cancers | 26.0 | 13.7 | 71.9% (23/32) |
Advanced Computational Approaches
Machine Learning and Deep Learning Applications
Machine learning approaches are increasingly being deployed to address complex challenges in NGS data analysis, particularly for distinguishing true somatic variants from sequencing artifacts. Traditional computational methods often struggle with this discrimination, necessitating laborious manual review by trained researchers following published standard operating procedures [77]. Deep convolutional neural networks (CNNs) represent a transformative approach that can automate variant refinement while achieving performance on par with human experts (94.1% accuracy) [77]. These models process sequencing data represented as three-dimensional tensors encompassing positional information, read indices, and base-wise characteristics including nucleotide type, quality scores, and read direction [77].
Another innovative machine learning approach, VarRNA, employs XGBoost models to classify variants detected in RNA-Seq data as germline, somatic, or artifact [78]. This method is particularly valuable for leveraging transcriptomic data to identify allelic expression imbalances and RNA editing events that may contribute to cancer pathogenesis [78]. By integrating multiple data types and computational approaches, these advanced algorithms enhance the accuracy of variant detection and interpretation, ultimately improving the reliability of genomic findings for both research and clinical applications.
Integrated Analysis Frameworks and Multi-Omics Approaches
The complexity of cancer biology necessitates integrated analytical frameworks that combine information from multiple molecular levels to comprehensively characterize tumor heterogeneity. Multi-omics integration—combining genomic, transcriptomic, epigenomic, and proteomic data—provides unprecedented insights into the functional consequences of genetic alterations and their role in cancer progression [6]. Computational methods for data integration include joint analysis of DNA and RNA sequencing data to distinguish expressed mutations from silent alterations, and combined analysis of genetic and epigenetic profiles to identify regulatory mechanisms driving tumor evolution [78] [6].
Cloud-based bioinformatics platforms have emerged as essential tools for managing the computational demands of integrated multi-omics analysis, providing scalable resources for data storage, processing, and collaborative interpretation [6]. These platforms often incorporate both open-source and commercial tools for variant calling, annotation, and visualization, facilitating reproducible analysis workflows across different research groups and institutions [6]. The continued development of sophisticated computational frameworks for multi-omics data integration promises to deepen our understanding of complex biological processes in cancer, ultimately enabling more effective personalized therapeutic strategies.
Figure 2: Integrated Multi-Omics Analysis Framework for Personalized Cancer Treatment
The Scientist's Toolkit: Research Reagent Solutions
Table 3: Essential Research Reagents and Platforms for NGS Cancer Heterogeneity Studies
| Resource Category | Specific Tools/Platforms | Primary Function | Application in Cancer Heterogeneity |
|---|---|---|---|
| Sequencing Platforms | Illumina NextSeq 550Dx, MGI DNBSEQ-G50RS | Massive parallel sequencing | Generate high-throughput sequencing data from tumor samples |
| Target Enrichment | Agilent SureSelectXT, Sophia Genetics custom panels | Library preparation and target capture | Enrich cancer-associated genomic regions for sequencing |
| Variant Callers | Mutect2, VarScan, Strelka2, SomaticSniper | Identify somatic mutations from sequencing data | Detect SNVs, indels across heterogeneous tumor samples |
| Data Analysis Platforms | Sophia DDM, OGT Interpret NGS Analysis Software | Automated variant analysis and visualization | Streamline analysis workflow and facilitate clinical interpretation |
| Reference Databases | dbSNP, COSMIC, TCGA, ClinVar | Variant annotation and interpretation | Classify variants by frequency, pathogenicity, and clinical actionability |
| Visualization Tools | Integrative Genomics Viewer (IGV) | Visual inspection of sequencing data | Manual verification of variant calls and artifact identification |
Bioinformatics hurdles in data management, variant calling, and interpretation represent significant challenges in NGS-based cancer heterogeneity studies. The enormous volume and complexity of genomic data require sophisticated computational infrastructure and analytical strategies to extract meaningful biological and clinical insights. Variant calling performance varies substantially across different pipeline configurations and tumor contexts, necess careful optimization and validation based on specific research objectives. The interpretation of genomic findings in the context of tumor heterogeneity demands advanced computational approaches, including machine learning algorithms and multi-omics integration frameworks. Despite these challenges, continued advancements in bioinformatics methodologies and computational resources are progressively enhancing our ability to decipher the complex genomic landscape of cancer, ultimately advancing personalized cancer medicine and improving patient outcomes.
Managing Variants of Uncertain Significance (VUS) and Standardizing Clinical Reporting
The advent of Next-Generation Sequencing (NGS) has revolutionized patient management in oncology, improving diagnosis and treatment decisions for cancer patients [79]. However, this powerful technology has unveiled a significant interpretive challenge: the identification of a massive number of genetic variants of uncertain significance (VUS). These variants, for which available evidence is insufficient to clearly define as either pathogenic or benign, currently account for approximately 40% of all variants detected through NGS methodologies [79]. This high prevalence creates substantial obstacles in clinical translation, as medical reports often omit VUS data or include them with limited clinical utility, leaving clinicians and researchers with ambiguous genetic information that is difficult to act upon [79].
The VUS problem is particularly pronounced in hereditary cancer syndromes, where multi-gene panel testing has become routine clinical practice. In the context of Hereditary Breast and Ovarian Cancer (HBOC), for instance, the shift from targeted BRCA1/2 analysis to comprehensive gene panels has been paralleled by a significant increase in VUS detections [80]. This trend disproportionately affects underrepresented populations, including Middle Eastern and other minority groups, due to insufficient representation in global genomic databases [80]. The interpretation of sequencing results relies heavily on variant frequency data from population databases, and when these databases lack diversity, variants that might be classified as benign in well-studied populations remain as VUS in underrepresented groups [80].
VUS Classification Frameworks and Guidelines
Standardized Classification Systems
To address the need for consistent variant interpretation, professional organizations have established structured classification frameworks. The system adopted by the American College of Medical Genetics and Genomics and the Association for Molecular Pathology (ACMG/AMP) categorizes variants into five distinct classes: pathogenic (P), likely pathogenic (LP), variant of uncertain significance (VUS), likely benign (LB), and benign (B) [81]. These classifications are based on weighted evidence including population data, computational predictions, functional data, and segregation information [81]. The International Agency for Research on Cancer (IARC) system similarly utilizes a five-class classification, with Class 3 specifically reserved for VUS [79].
A critical distinction in these frameworks is the separation between variants with truly insufficient information (VUS) and those with substantial but not definitive evidence (likely pathogenic or likely benign) [79]. The ACMG/AMP guidelines recommend using "likely pathogenic" and "likely benign" for variants with greater than 90% certainty of being disease-causing or benign, respectively [81]. This threshold provides laboratories with a common, though somewhat arbitrary, definition for clinical reporting consistency.
Gene-Specific Adaptations
While general guidelines provide a foundational framework, research has demonstrated that gene-specific adaptations significantly improve classification accuracy. The Evidence-based Network for the Interpretation of Germintine Mutant Alleles (ENIGMA) Variant Curation Expert Panel (VCEP) has developed specialized specifications for BRCA1 and BRCA2 genes that dramatically outperform the standard ACMG/AMP approach [82]. One study comparing these methodologies found that applying ENIGMA VCEP specifications resulted in an 83.5% reduction in VUS compared to only 20% with the standard ACMG/AMP approach supplemented by Sequence Variant Interpretation recommendations [82]. This striking improvement highlights the importance of gene-specific criteria and suggests that for diagnostic analysis of BRCA1 and BRCA2, the ENIGMA VCEP specifications provide optimal clinical translation of genetic variants [82].
Table 1: Key Variant Classification Systems and Their Applications
| Classification System | Variant Categories | Primary Application | Strengths |
|---|---|---|---|
| ACMG/AMP [81] | Pathogenic, Likely Pathogenic, VUS, Likely Benign, Benign | General Mendelian disorders | Standardized terminology; widely adopted |
| IARC [79] | Classes 1-5 (Class 3 = VUS) | Cancer susceptibility genes | Distinguishes insufficient evidence from conflicting evidence |
| ENIGMA VCEP [82] | Adapted from ACMG/AMP with gene-specific criteria | BRCA1 and BRCA2 | Significantly reduces VUS rates; gene-specific optimization |
Methodologies for VUS Interpretation and Reclassification
Evidence Integration for Variant Assessment
Clinical variant interpretation follows a structured process that integrates multiple lines of evidence to determine clinical significance. This process begins with comprehensive data collection and quality assessment, including patient clinical history, genetic reports, and family data [83]. The core interpretation methodology then leverages several key approaches:
Population frequency data from resources like the Genome Aggregation Database (gnomAD) helps determine variant rarity. Generally, a variant with a frequency exceeding 5% in healthy individuals is typically classified as benign, though pathogenic variants involved in certain common diseases can be found at higher frequencies in different populations [83]. Computational predictions utilize in silico tools to assess the potential impact of variants on protein function, splicing, or other critical biological processes [83]. These tools evaluate factors like evolutionary conservation of amino acid residues across species and structural changes to predict deleterious effects [84].
Functional assays provide laboratory-based validation of variant impact, directly testing how a variant affects gene or protein function through methods that assess protein stability, enzymatic activity, splicing efficiency, or cellular signaling pathways [83]. For intronic variants, minigene assays can be particularly valuable for demonstrating aberrant splicing patterns, as shown in colorectal cancer research where this approach revealed potentially disease-related aberrant transcripts [84].
Segregation analysis examines how variants track with disease in families, while tumor pathological characteristics offer phenotypic correlations for cancer-related variants [79]. The integration of these diverse evidence types follows a weighted approach, with some types of evidence (like functional data or segregation statistics) carrying more weight than others (such as in silico predictions) in the final classification [81].
Bioinformatics and Computational Approaches
Robust bioinformatics practices form the foundation of reliable variant interpretation in clinical NGS applications. The Nordic Alliance for Clinical Genomics (NACG) has established consensus recommendations for clinical bioinformatics that support accurate variant calling and interpretation [85]. Key recommendations include adopting the hg38 genome build as reference, implementing a standard set of recommended analyses, and using multiple tools for structural variant calling [85]. Standardized workflows should encompass:
- De-multiplexing of raw sequencing output (BCL to FASTQ)
- Alignment of sequencing reads to a reference genome (FASTQ to BAM)
- Comprehensive variant calling including SNVs, small insertions/deletions (indels), copy number variants (CNVs), structural variants (SVs), and short tandem repeats (STRs)
- Variant annotation (VCF to annotated VCF) [85]
For rare disease diagnosis and VUS interpretation, computational variant prioritization models have become essential tools. The Critical Assessment of Genome Interpretation (CAGI) challenges have evaluated these models in real-life clinical settings, finding that top-performing teams successfully recall causal variants by prioritizing high-quality variant calls that are rare, predicted deleterious, segregate correctly with disease, and are consistent with reported phenotypes [86]. The integration of artificial intelligence methods further enhances variant detection, with approaches like BoostDM demonstrating capability to identify oncodriver germline variants with potential implications for disease progression [84].
Diagram 1: VUS interpretation workflow integrating multiple evidence types.
VUS Reclassification Outcomes and Clinical Impact
Reclassification Rates and Trends
The dynamic nature of genomic knowledge means that VUS classifications are necessarily provisional and subject to change as new evidence emerges. Studies examining VUS reclassification patterns reveal significant rates of reassignment. In a study of Levantine patients at risk for HBOC, retrospective reclassification of 160 VUS resulted in 32.5% being reclassified, including 4 variants (2.5% of total VUS) upgraded to pathogenic/likely pathogenic status [80]. This reclassification rate demonstrates the potential for significant diagnostic refinement over time.
The factors driving VUS reclassification are diverse, with population allele frequency data, computational prediction algorithms, and accumulating clinical evidence playing pivotal roles [80]. The process is significantly enhanced by expert panel reviews and curated databases such as ClinVar, which aggregate global evidence for variant interpretation [79] [82]. The development of the Clinical Genome Resource (ClinGen) project has been particularly impactful, creating a central resource that defines the clinical validity, pathogenicity, and clinical usefulness of genomic information [79].
Clinical Implications of VUS Reclassification
VUS reclassification has direct consequences for patient management and clinical decision-making. The identification of previously unrecognized pathogenic variants enables tailored oncological surveillance and risk-reduction strategies aligned with established guidelines [80]. In hereditary cancer syndromes, such reclassifications can affect screening protocols, surgical prevention options, and therapeutic approaches.
The prevalence of pathogenic and likely pathogenic variants varies considerably across cancer types and testing panels. Analysis of the first 10,000 patients referred for NGS cancer panel testing revealed an overall molecular diagnosis rate of 9.0%, with the highest yield in Lynch syndrome/colorectal cancer panels (14.8%) compared to 9.7% in breast cancer and 13.4% in ovarian cancer patients [87]. Notably, approximately half of the pathogenic variants identified in patients with breast or ovarian cancer were in genes other than BRCA1/2, underscoring both the genetic heterogeneity of hereditary cancer and the clinical utility of multigene panels over single-gene tests [87].
Table 2: Pathogenic/Likely Pathogenic Variant Prevalence in Cancer Panels [87]
| Cancer Type / Panel | Positive Yield | Notes |
|---|---|---|
| Overall | 9.0% | Across all cancer panels |
| Breast Cancer | 9.7% | ~50% in genes other than BRCA1/2 |
| Ovarian Cancer | 13.4% | ~50% in genes other than BRCA1/2 |
| Lynch Syndrome/Colorectal Cancer | 14.8% | Highest diagnostic yield |
Functional Validation Strategies for VUS Resolution
Experimental Approaches for Functional Characterization
When clinical and computational evidence remains insufficient for VUS classification, functional assays provide critical biological evidence to resolve uncertainty. These laboratory-based methods directly assess how a variant affects gene or protein function, offering empirical data beyond statistical correlations or predictive algorithms [83]. Key functional approaches include:
Splicing assays investigate whether a variant disrupts normal RNA processing, which is particularly relevant for intronic and synonymous variants that may affect splice sites or regulatory elements. The minigene assay has proven valuable for this purpose, as demonstrated in colorectal cancer research where this approach successfully validated intronic mutations by revealing aberrant transcripts potentially linked to disease etiology [84].
Enzyme activity tests measure functional impairment caused by amino acid changes, providing quantitative assessment of protein function. These assays are especially useful for genes with well-characterized biochemical functions, such as those involved in DNA repair pathways [83]. Cellular localization studies examine protein trafficking and compartmentalization, which can be disrupted by certain variants [79].
For cancer-related variants, tumor pathogenicity characteristics offer another form of functional evidence, correlating specific variants with histological features or biomarkers that support pathogenic or benign impacts [79]. The development of standardized functional assessment protocols through organizations like the European Molecular Genetics Quality Network (EMQN) and Genomics Quality Assessment (GenQA) helps ensure consistency and reliability in functional assay results across laboratories [83].
Diagram 2: Functional assay selection guide based on variant characteristics.
The Scientist's Toolkit: Key Research Reagents and Solutions
Table 3: Essential Research Reagents for VUS Functional Characterization
| Reagent / Tool | Primary Function | Application in VUS Resolution |
|---|---|---|
| Minigene Assay Systems | Functional validation of splicing defects | Demonstrates aberrant RNA processing from intronic variants [84] |
| Expression Vectors | Recombinant protein production | Enables biochemical characterization of mutant protein function |
| CRISPR-Cas9 Systems | Genome editing | Creates isogenic cell lines for functional comparison |
| Antibody Panels | Protein detection and localization | Assesses expression levels, post-translational modifications, and cellular localization |
| Cell Line Models | In vitro functional assessment | Provides controlled systems for characterizing variant effects |
| NGS Platforms | High-throughput sequencing | Enables transcriptome analysis, RNA-seq for splicing studies |
The management of Variants of Uncertain Significance represents both a formidable challenge and a significant opportunity in the era of precision oncology. As NGS technologies continue to reveal the profound genetic heterogeneity underlying cancer, the systematic approach to VUS interpretation and reclassification will play an increasingly critical role in translating genomic discoveries into clinical action. The current evidence demonstrates that through structured classification frameworks, rigorous bioinformatics practices, and comprehensive functional validation, a substantial proportion of VUS can be successfully reclassified to enable informed clinical decision-making.
The future of VUS management will likely see increased integration of artificial intelligence approaches [84], expanded population genomic diversity in reference databases [80], and continued refinement of gene-specific classification guidelines [82]. These advances, coupled with international collaboration through initiatives like ClinGen and ENIGMA, promise to reduce the diagnostic uncertainty currently posed by VUS and ultimately enhance the implementation of precision medicine approaches in oncology care. As the field evolves, standardized clinical reporting that clearly communicates the evidence behind variant classifications and their potential implications will be essential for ensuring that patients and providers can effectively utilize genomic information in healthcare decisions.
Next-Generation Sequencing (NGS) has fundamentally transformed cancer heterogeneity studies, enabling comprehensive genomic profiling that reveals the complex genetic, epigenetic, and phenotypic diversity within tumors [67] [16]. This profound capability to characterize spatial and temporal heterogeneity provides critical insights into treatment response and resistance mechanisms, forming the cornerstone of precision oncology [67]. However, the integration of NGS into routine research and clinical practice faces significant economic and logistical hurdles that impede its full potential. These challenges span cost-effectiveness debates, turnaround time inefficiencies, and multifaceted access barriers that collectively restrict the widespread implementation of this transformative technology [88] [30]. Understanding and addressing these constraints is particularly crucial in cancer heterogeneity research, where comprehensive genomic profiling is essential for deconstructing tumor evolution and developing effective therapeutic strategies.
The economic and logistical landscape of NGS implementation presents a complex interplay between direct testing costs, infrastructure requirements, and reimbursement frameworks. While the technology offers unparalleled capabilities for simultaneous multi-gene analysis, questions regarding its cost-effectiveness relative to traditional testing approaches have created significant adoption barriers [89]. Additionally, logistical challenges related to testing turnaround times and tissue sample limitations further complicate its research and clinical application. This technical review systematically examines these barriers and presents evidence-based strategies to optimize NGS implementation within cancer heterogeneity studies, providing researchers and drug development professionals with practical frameworks to enhance their genomic profiling capabilities.
Comprehensive Cost-Benefit Analysis of NGS Implementation
Direct and Holistic Cost Considerations
The economic evaluation of NGS requires distinguishing between direct testing expenses and holistic cost considerations that encompass the entire testing ecosystem. Traditional cost analyses often focus exclusively on reagent and equipment costs, failing to capture the complete economic picture of genomic profiling in cancer research.
Table 1: Cost Comparison of NGS Versus Single-Gene Testing Approaches
| Cost Component | Targeted NGS Panels (2-52 genes) | Large NGS Panels (100+ genes) | Single-Gene Testing |
|---|---|---|---|
| Direct Testing Cost | Moderate to High | High | Low per test |
| Cost-Effectiveness Threshold | Cost-effective when ≥4 genes require testing [89] | Generally not cost-effective [89] | Cost-effective for <4 genes |
| Tipping Point for Cost Savings | 10-12 biomarkers [90] | Not cost-effective | N/A |
| Personnel Costs | Lower (streamlined workflow) | Lower (streamlined workflow) | Higher (sequential testing) |
| Equipment/Overhead Costs | Moderate | High | Low to Moderate |
| Tissue Utilization Efficiency | High (conserves tissue) | High (conserves tissue) | Low (tissue depletion) |
Evidence from systematic literature reviews demonstrates that targeted NGS panels (2-52 genes) become cost-effective compared to single-gene testing when four or more genes require analysis [89]. The economic advantage intensifies with larger biomarker panels, with recent global micro-costing analyses revealing a tipping point of 10-12 biomarkers where NGS generates significant cost savings [90]. This economic profile makes NGS particularly advantageous for cancer heterogeneity studies, where comprehensive profiling of multiple genetic alterations is necessary to capture tumor diversity.
Holistic cost analysis extends beyond direct expenses to include personnel requirements, equipment utilization, and tissue conservation. NGS implementations demonstrate substantial advantages in these domains, reducing healthcare staff requirements, minimizing hospital visits, and decreasing overall hospital costs [89]. The efficient tissue utilization of NGS is particularly valuable in cancer research, where limited tissue availability often constrains extensive molecular profiling. Traditional single-gene testing approaches frequently deplete available tissue samples, preventing complete biomarker assessment and compromising research completeness [90].
Long-Term Economic Value and Research Efficiency
The economic value proposition of NGS extends beyond immediate cost comparisons to encompass long-term research efficiency and therapeutic development implications. While initial investments in NGS infrastructure and expertise are substantial, the technology generates significant downstream value through accelerated discovery and enhanced research outcomes.
Cancer heterogeneity studies particularly benefit from the comprehensive genomic profiling capabilities of NGS, which enables simultaneous detection of multiple variant types including single-nucleotide polymorphisms (SNPs), insertions/deletions (indels), copy number variations (CNVs), and structural variants [16]. This multi-faceted detection capability eliminates the need for multiple separate testing approaches, consolidating costs and streamlining research workflows. The technology's high sensitivity (detecting variants at frequencies as low as 1%) provides critical capabilities for identifying low-frequency subclones within heterogeneous tumors, offering insights into resistance mechanisms and tumor evolution that would be missed by less sensitive approaches [16].
The economic impact of NGS also extends to drug development pipelines, where comprehensive genomic profiling enables more precise patient stratification and biomarker identification. This precision potentially accelerates therapeutic development and reduces late-stage failure rates, generating substantial cost savings across the research and development continuum. Additionally, the integration of liquid biopsy approaches with NGS platforms offers opportunities for real-time monitoring of tumor evolution and treatment response, further enhancing research efficiency and enabling dynamic adaptation of study protocols based on emerging genomic findings [67] [30].
Turnaround Time Optimization and Workflow Efficiency
Comparative Turnaround Time Analysis
Testing turnaround time represents a critical logistical parameter in both research and clinical contexts, directly impacting study timelines and therapeutic decision-making. Traditional send-out NGS services frequently require 14-28 days for results delivery, creating significant bottlenecks in research sequencing and experimental planning [91].
Table 2: Turnaround Time Comparison Across Testing Modalities
| Testing Methodology | Average Turnaround Time | Key Factors Influencing Timing | Impact on Research Workflow |
|---|---|---|---|
| Send-out NGS | 10.4-28 days [91] | Transport logistics, external queue times | Significant delays in experimental progression |
| In-house NGS | 5-10 days | Equipment availability, staffing expertise | Moderate delays, more controllable |
| High-Definition PCR | 5.01 days [91] | Equipment availability, sample processing capacity | Minimal disruptions |
| Single-Gene Testing | Varies by number of genes | Sequential testing requirements | Cumulative delays with multiple genes |
Recent studies implementing in-house high-definition PCR platforms demonstrate substantial improvements in processing efficiency, reducing average turnaround time to approximately 5 days compared to 10.4 days for send-out NGS [91]. This 52% reduction in processing time significantly accelerates research sequencing and enhances overall project efficiency. The streamlined workflow of targeted NGS panels similarly improves processing efficiency compared to sequential single-gene testing approaches, particularly when multiple biomarkers require analysis [89].
The temporal efficiency of NGS workflows is further enhanced through process optimization and batch sequencing approaches. Implementing standardized protocols, optimizing sample preparation pipelines, and leveraging bioinformatics automation collectively contribute to reduced processing intervals. These optimizations are particularly valuable in cancer heterogeneity studies, where rapid profiling enables timely experimental interventions and dynamic adaptation of research hypotheses based on genomic findings.
Workflow Integration and Process Optimization
Efficient integration of NGS workflows into existing research infrastructure requires careful consideration of personnel requirements, equipment placement, and process mapping. The implementation of in-house NGS capabilities demands significant upfront investment in technical expertise and equipment but generates long-term efficiency gains through reduced external dependencies and streamlined processing.
Diagram 1: NGS Workflow Optimization Pipeline
The NGS workflow encompasses three distinct phases, each offering specific optimization opportunities. The pre-analytical phase, involving sample collection and nucleic acid extraction, benefits from standardized collection protocols and quality control measures to ensure input material integrity [91]. The analytical phase, comprising library preparation and sequencing, can be optimized through process automation and batch processing to maximize equipment utilization and reduce hands-on time. The post-analytical phase, including data analysis and interpretation, offers efficiency gains through bioinformatics pipeline automation and standardized reporting templates.
Liquid biopsy integration presents particularly valuable opportunities for workflow optimization in cancer heterogeneity studies. This minimally invasive approach enables serial sampling for temporal heterogeneity assessment, bypassing the logistical challenges associated with repeated tissue biopsies [67] [30]. The simplified sample acquisition process reduces overall timeline requirements and facilitates dynamic monitoring of tumor evolution under selective pressures, providing critical insights into resistance mechanisms and clonal dynamics.
Access Barriers and Implementation Challenges
Multifaceted Access Limitations
The implementation of NGS in cancer research encounters complex access barriers spanning reimbursement complexities, infrastructure limitations, and knowledge gaps. These constraints disproportionately affect resource-limited settings and create significant disparities in genomic profiling capabilities across research institutions.
Reimbursement Challenges: Complex reimbursement processes represent the most frequently cited barrier to NGS implementation, reported by 87.5% of physicians in recent surveys [92]. These challenges predominantly include cumbersome prior authorization requirements (72%), complicated fee code structures (68%), and excessive administrative burdens (67.5%) that collectively impede testing access [92]. Despite clinical practice guidelines increasingly endorsing NGS as the preferred testing approach, insurance coverage frequently lags behind these recommendations, creating implementation disconnects between evidence-based guidelines and practical reimbursement realities [88].
Infrastructure and Expertise Limitations: Effective NGS implementation requires sophisticated laboratory infrastructure, bioinformatics capabilities, and technical expertise that may be unavailable in resource-constrained settings. The absence of appropriate testing infrastructure, inadequate staff training, and limited bioinformatics support collectively constrain NGS adoption [88]. These limitations are particularly pronounced for large-scale genomic profiling approaches required for comprehensive heterogeneity studies, where data management and analytical complexity present significant implementation hurdles.
Evidence and Knowledge Gaps: Uncertainties regarding clinical utility and analytical interpretation persist as notable implementation barriers, with 80% of physicians citing lack of clinical utility evidence as a significant concern [92]. Additionally, knowledge gaps regarding NGS methodologies, interpretation complexities, and appropriate application contexts further hinder implementation. Variants of uncertain significance (VUS) represent particular interpretation challenges in cancer heterogeneity studies, where distinguishing driver from passenger mutations in heterogeneous tumor populations requires sophisticated analytical approaches [16].
Equity and Disparity Considerations
NGS implementation disparities create concerning equity gaps in cancer research participation and precision medicine access. Evidence indicates significant heterogeneity in testing access across geographic regions, practice settings, and patient demographics, potentially biasing research findings and limiting generalizability [88].
Patients treated at National Cancer Institute-designated cancer centers demonstrate substantially higher NGS testing rates compared to those in community oncology settings, creating a two-tiered research ecosystem that potentially limits the diversity of studied populations [88]. Similar disparities emerge across racial and ethnic groups, with marginalized populations frequently underrepresented in genomic profiling studies, potentially compromising the generalizability of findings and perpetuating health inequities.
The 2018 Medicare National Coverage Determination (NCD) improved access for Medicare beneficiaries with advanced cancer, but its impact remains incomplete, particularly for patients with early-stage cancers and those covered by other insurance types [88]. These coverage limitations constrain patient recruitment for heterogeneity studies and potentially introduce selection biases that affect research validity. Additionally, international disparities in NGS access are particularly pronounced, with significant variability in testing availability and reimbursement policies across healthcare systems [90].
Strategic Solutions and Technical Recommendations
Economic Optimization Strategies
Implementing cost-effective NGS approaches requires strategic panel selection, process optimization, and holistic economic assessment that captures the full value proposition of comprehensive genomic profiling.
Panel Selection and Test Optimization: Targeted NGS panels (2-52 genes) provide optimal economic value for most cancer heterogeneity studies, particularly when focused on established biomarkers with validated clinical implications [89]. The selection of appropriate panel size should balance comprehensiveness with cost considerations, prioritizing genes with established relevance to the specific cancer type and research questions. Reflex testing approaches, beginning with focused panels and expanding based on initial findings, can further optimize resource utilization while maintaining profiling comprehensiveness.
Process Efficiency and Batch Optimization: Implementing batch sequencing approaches maximizes equipment utilization and reduces per-sample costs, particularly for lower-volume research settings. Process efficiency improvements through workflow automation, standardized protocols, and cross-training of technical staff further enhance economic efficiency. Additionally, leveraging shared sequencing facilities and core resources can distribute fixed costs across multiple research projects, improving individual project economics.
Holistic Value Assessment: Research economic assessments should capture the full value of NGS beyond direct testing costs, including tissue conservation benefits, reduced repeat testing requirements, and comprehensive data generation for secondary analyses [89] [90]. The capacity of NGS to generate rich datasets suitable for multiple research questions provides significant economic advantages compared to targeted approaches with limited reuse potential.
Access Expansion Frameworks
Developing structured implementation frameworks can significantly enhance NGS accessibility and address existing adoption barriers across diverse research settings.
Structured Implementation Pathways:
Diagram 2: NGS Implementation Roadmap
Developing structured implementation pathways provides systematic approaches to overcome adoption barriers. The process begins with comprehensive needs assessment and infrastructure planning, followed by protocol development and expertise building phases that address technical capacity requirements [92]. Pilot implementation with progressive scaling allows for process refinement and quality assurance before full integration, minimizing implementation risks and optimizing resource allocation.
Collaborative Networks and Resource Sharing: Establishing collaborative genomic profiling networks enables resource sharing across institutions, particularly benefiting smaller research centers with limited individual testing volumes. These networks facilitate expertise exchange, protocol standardization, and cost-sharing arrangements that collectively enhance access and economic efficiency. Additionally, leveraging centralized bioinformatics cores and data analysis resources helps address technical expertise gaps and reduces individual institutional burdens for computational infrastructure development.
Policy Engagement and Reimbursement Advocacy: Active engagement with payers and policy makers promotes alignment between evidence-based guidelines and reimbursement policies [89] [88]. Researchers can contribute to this alignment through rigorous economic analyses that demonstrate the holistic value of NGS, including long-term research efficiencies and therapeutic development implications. Documenting and communicating the operational impacts of administrative barriers, such as prior authorization requirements, further supports process improvement efforts.
Table 3: Essential Research Reagents and Platforms for NGS Implementation
| Category | Specific Solutions | Research Applications | Technical Considerations |
|---|---|---|---|
| NGS Platforms | Illumina systems, Ion Torrent, Oxford Nanopore, PacBio | DNA/RNA sequencing, comprehensive genomic profiling | Throughput, read length, error profiles vary by platform [16] |
| Liquid Biopsy Technologies | ctDNA isolation kits, digital PCR systems, targeted panels | Temporal heterogeneity monitoring, resistance mechanism studies | Sensitivity limitations for early-stage disease [67] |
| Library Preparation Kits | Hybridization capture, amplicon-based approaches | Target enrichment, panel customization | Impact on coverage uniformity, GC bias [16] |
| Bioinformatics Tools | BWA, GATK, STAR, custom pipelines | Variant calling, annotation, interpretation | Computational infrastructure requirements [16] |
| Quality Control Reagents | DNA quantification, fragmentation analysis, QC metrics | Input quality assessment, process validation | Critical for reliable variant detection [91] |
Selecting appropriate technical solutions requires careful alignment with specific research objectives and resource constraints. Targeted sequencing panels offer optimal efficiency for focused research questions, while comprehensive approaches provide greater discovery potential for exploratory heterogeneity studies. Liquid biopsy platforms enable longitudinal monitoring applications but require validation against tissue-based approaches for specific cancer types and stages [67]. Bioinformatics resources represent particularly critical implementation components, with robust computational infrastructure and analytical expertise being essential for reliable variant detection and interpretation.
The economic and logistical optimization of NGS implementation requires multifaceted approaches that address cost structures, workflow efficiency, and access barriers simultaneously. The evidence demonstrates that targeted NGS panels provide compelling economic value when appropriately selected based on research objectives and biomarker requirements. Process optimization and strategic implementation approaches further enhance efficiency and accessibility, maximizing the research return on investment.
Future developments in sequencing technologies, including continued cost reductions, process automation, and computational advancements, promise to further alleviate existing implementation barriers. The integration of artificial intelligence and machine learning approaches offers particular potential for interpretive efficiency gains, helping researchers navigate the complexity of cancer heterogeneity data. Additionally, the growing adoption of liquid biopsy methodologies may fundamentally transform accessibility for serial monitoring applications, enabling more dynamic studies of tumor evolution.
For cancer heterogeneity research specifically, prioritizing comprehensive genomic profiling approaches despite implementation challenges is justified by the scientific necessity of capturing tumor diversity. The biological complexity of cancer heterogeneity demands technological approaches capable of resolving spatial and temporal genomic diversity, making NGS an indispensable tool despite its implementation hurdles. By strategically addressing economic and logistical constraints through the frameworks outlined in this review, researchers can optimize their genomic profiling capabilities and advance our understanding of cancer evolution and therapeutic resistance.
Cancer is not a single disease but a complex ecosystem of genetically diverse cell populations within a single tumor. This intratumoral heterogeneity is a principal driver of therapeutic resistance, disease progression, and metastatic potential, presenting a formidable challenge in clinical oncology [11]. Next-Generation Sequencing (NGS) has emerged as the cornerstone technology for dissecting this heterogeneity, enabling the comprehensive genomic, transcriptomic, and epigenomic profiling of tumor cells [4]. However, the full potential of NGS in elucidating cancer heterogeneity is often constrained by cumbersome, centralized laboratory workflows that are slow, costly, and inaccessible for many institutions.
The paradigm is shifting towards automated, decentralized testing, moving genomic analysis closer to the point of need, such as within hospital settings or specialized clinical labs [29]. This transition is critical for accelerating diagnostic turnaround times, facilitating real-time monitoring of tumor evolution, and ultimately enabling more dynamic, personalized treatment adjustments. Optimizing the entire NGS workflow—from initial sample preparation to final data analysis—is therefore not merely a technical exercise but a fundamental prerequisite for advancing cancer research and precision medicine. This guide provides a detailed technical roadmap for researchers and drug development professionals seeking to streamline these processes for robust and scalable studies of cancer heterogeneity.
The NGS Workflow: Core Steps and Optimization Strategies
The fundamental NGS workflow consists of three primary stages: template preparation, sequencing, and data analysis. Optimization at each stage is vital for generating high-quality data capable of capturing the subtle genetic nuances of heterogeneous tumors [93].
Stage 1: Sample Preparation and Library Construction
This initial stage converts a raw biological sample into a sequence-ready library. Rigor here is paramount for successful outcomes, especially with complex samples like formalin-fixed paraffin-embedded (FFPE) tissues or liquid biopsies.
- Nucleic Acid Extraction: The process begins with the extraction of DNA or RNA from the sample (e.g., tumor tissue, blood for liquid biopsy). The quality (e.g., integrity) and quantity of the input nucleic acids are critical success factors [93]. For FFPE samples, which are common in cancer research, optimization of DNA repair protocols is often necessary to address formalin-induced damage [4].
- Fragmentation: Long DNA or RNA molecules are fragmented into smaller, uniform pieces. This can be achieved through physical (e.g., sonication, nebulization), enzymatic, or chemical methods. The desired fragment size, typically around 300 base pairs, is platform-dependent and must be carefully controlled for reproducibility [4] [93].
- Library Preparation: This is a key area for innovation. Adapters (short, known oligonucleotide sequences) are ligated to both ends of the fragmented DNA. These adapters are essential for:
- Binding fragments to the sequencing platform's flow cell or beads.
- Providing primer binding sites for amplification.
- Incorporating unique molecular barcodes (indexes) that enable multiplexing—the pooling of dozens of samples in a single sequencing run, drastically improving throughput and reducing per-sample cost [93].
- Target Enrichment (for Targeted Panels): In studies focusing on a predefined set of cancer-related genes, an enrichment step is required to isolate the coding sequences of interest. This is typically accomplished via PCR using specific primers or, more commonly, through hybridization with exon-specific probes [4]. This allows for deep sequencing of relevant genomic regions at a lower cost than whole-genome sequencing.
- Amplification: The adapter-ligated library fragments are amplified to generate a sufficient signal for sequencing. Common methods include emulsion PCR (ePCR) and bridge amplification, which create clusters of identical DNA templates on a flow cell [4] [93].
Stage 2: Sequencing and Imaging
Once the library is prepared, it is loaded onto an NGS platform. Different technologies are available, each with distinct chemistries suited to particular applications in cancer research.
- Sequencing by Synthesis (SBS): This is the predominant method used by platforms like Illumina. It involves the cyclic addition of fluorescently labeled, reversible terminator nucleotides. After each nucleotide incorporation, a high-resolution camera captures the fluorescent signal, the terminator is cleaved, and the next cycle begins. This process generates millions of parallel reads simultaneously with high accuracy, making it excellent for detecting single-nucleotide variants in heterogeneous tumors [4] [93].
- Semiconductor Sequencing: Used by Ion Torrent platforms, this method detects hydrogen ions released during nucleotide incorporation. The pH change is converted directly into a digital signal, eliminating the need for optical systems. This allows for a faster and simpler workflow [93].
- Single-Molecule Real-Time (SMRT) Sequencing and Nanopore: These third-generation technologies (e.g., PacBio, Oxford Nanopore) sequence single DNA molecules in real-time and produce long reads. These long reads are invaluable for resolving complex genomic regions, detecting large structural variants, and phasing haplotypes—all of which are crucial for a complete understanding of cancer heterogeneity [11] [29].
Stage 3: Data Analysis
The sequencing instrument generates terabytes of raw data, necessitating sophisticated bioinformatics pipelines. For cancer genomics, this analysis is particularly complex due to the need to distinguish true somatic mutations from background noise and to deconvolute mixed cell populations [4] [93].
- Primary Analysis: This involves base calling (translating raw signals into nucleotide sequences) and assigning quality scores to each base.
- Secondary Analysis:
- Quality Control (QC): Raw reads are assessed for quality, and low-quality bases or adapter sequences are trimmed.
- Alignment/Mapping: The cleaned reads are aligned to a reference human genome to identify their genomic origins.
- Variant Calling: Specialized algorithms identify variations (e.g., single nucleotide variants (SNVs), insertions/deletions (indels), copy number variations (CNVs), and structural variants) by comparing the tumor sequence to the reference. Distinguishing low-frequency clones in a heterogeneous sample requires high sequencing depth and sensitive algorithms [4].
- Tertiary Analysis:
- Annotation and Interpretation: Identified variants are annotated with information from clinical and functional databases to determine their potential biological and clinical significance (e.g., oncogenic drivers, therapeutic targets).
- Downstream Analysis: This includes advanced applications like clonal decomposition, which infers the subclonal architecture of a tumor, and phylogenetic analysis, which models the evolutionary history of the cancer [93] [29]. The integration of artificial intelligence (AI) and machine learning is becoming increasingly important for probing these high-dimensional datasets to uncover novel biomarkers and biological insights [29].
Quantitative Comparison of NGS Technologies and Trends
Selecting the appropriate NGS platform is a strategic decision that directly impacts the feasibility and success of a cancer heterogeneity study. The table below summarizes the key specifications of modern sequencing platforms to guide this selection.
Table 1: Key Specifications of Modern NGS Platforms for Cancer Research [93] [11] [29]
| Platform Feature | Short-Read Sequencers (e.g., Illumina) | Long-Read Sequencers (e.g., PacBio) | Portable Sequencers (e.g., Oxford Nanopore) |
|---|---|---|---|
| Typical Read Length | 75-300 bp | 10,000 - 25,000+ bp (HiFi reads) | Varies; can exceed 1 Mb |
| Throughput per Run | 300 Mb - >6 Tb | ~240 Gb (Sequel IIe) | 10 - 50 Gb (MinION) |
| Key Strength | High accuracy for SNV detection; low cost per base | Resolves structural variants, repetitive regions, and phasing | Real-time sequencing; extreme portability |
| Limitation | Limited in complex genomic regions | Higher cost per sample; larger DNA input required | Higher raw error rate than short-read platforms |
| Ideal Application in Heterogeneity | Targeted panels; whole exome/genome for point mutations; RNA-seq | Fusion gene discovery; complex structural variant analysis; full isoform sequencing | Rapid diagnosis; metagenomic analysis of tumor microbiome |
The NGS market is evolving rapidly, driven by technological advancements. The global NGS market is projected to grow from USD 42.25 billion by 2033, reflecting its expanding role in diagnostics and research [94]. Key trends shaping the future of NGS workflows in 2025 and beyond include:
- Cost Reduction: The cost of sequencing a human genome continues to fall, aiming to drop below $100, making large-scale studies more feasible [29] [94].
- Multiomics: The integration of genomic, epigenomic, and transcriptomic data from the same sample is becoming the new standard, providing a more holistic view of the biological state of a tumor [29].
- AI and Informatics: AI-driven bioinformatics tools are critical for managing, analyzing, and interpreting the vast, complex datasets generated by multiomic studies of heterogeneous cancers [29] [94].
- Spatial Biology: Emerging technologies enable in situ sequencing of cells within intact tissue, allowing researchers to map clonal populations in their native spatial context, a crucial dimension for understanding tumor microenvironment interactions [29].
Essential Research Reagent Solutions for NGS Workflows
A successful NGS experiment relies on a suite of high-quality reagents and materials. The following table details the essential components of the "scientist's toolkit" for optimized NGS workflows in cancer research.
Table 2: Key Research Reagent Solutions for NGS Workflows [4] [93]
| Item | Function | Key Considerations |
|---|---|---|
| Nucleic Acid Extraction Kits | Isolate high-purity DNA/RNA from various sample types (tissue, blood, FFPE). | Select kits optimized for sample type; assess yield, purity (A260/280), and integrity (e.g., DIN, RIN). |
| Fragmentation Enzymes/ Kits | Shear nucleic acids to a uniform, desired size. | Reproducibility and tight size distribution are critical for uniform library coverage. |
| Library Preparation Kits | Fragment, end-repair, A-tail, and ligate adapters to DNA. | Look for kits with high efficiency, low bias, and compatibility with automation. |
| Unique Dual Indexes (UDIs) | Molecular barcodes that allow multiplexing of hundreds of samples. | Essential for sample tracking, preventing index hopping, and reducing per-sample costs. |
| Target Enrichment Panels | Probes (e.g., RNA baits) to capture specific genomic regions of interest. | Panels can be focused (e.g., 50 genes) or comprehensive (e.g., 500+ genes); design impacts coverage and cost. |
| Sequenceing Kits | Chemistry required for the sequencing run (e.g., flow cells, buffers, enzymes). | Platform-specific; a major contributor to ongoing operational costs. |
| Automated Liquid Handlers | Robots to perform liquid transfer steps in library prep. | Dramatically improve reproducibility, throughput, and hands-off time while reducing human error. |
Visualizing the Optimized NGS Workflow for Cancer Heterogeneity
The following diagram illustrates the integrated, optimized workflow from sample to insight, highlighting key steps for analyzing cancer heterogeneity and the trend towards decentralized, automated testing.
Diagram Title: Optimized NGS Workflow for Cancer Heterogeneity
The optimization of NGS workflows—from robust, automatable sample preparation to decentralized sequencing and AI-powered data analysis—is no longer a luxury but a necessity. For researchers and clinicians dedicated to unraveling the complexities of cancer heterogeneity, these streamlined processes are the key to generating the high-quality, multi-dimensional data required to decipher the evolutionary dynamics of tumors. As the field advances towards more accessible, cost-effective, and integrated multiomic solutions, these optimized workflows will form the foundational infrastructure for the next generation of discoveries in precision oncology, ultimately translating into more effective, personalized cancer therapies.
Validating NGS Findings and Comparative Frameworks for Clinical Translation
The emergence of circulating tumor DNA (ctDNA) analysis via next-generation sequencing (NGS) presents a paradigm shift in oncology, offering a non-invasive window into the tumor genome. This whitepaper examines the concordance between whole-genome sequencing (WGS) of ctDNA and traditional tumor tissue biopsies, a critical validation step for integrating liquid biopsies into cancer heterogeneity studies and clinical decision-making. We synthesize evidence from multiple concordance studies, detailing experimental protocols, presenting quantitative performance data, and analyzing the technological and biological factors influencing agreement between these methods. Framed within the broader context of NGS applications in cancer research, this review underscores how ctDNA analysis can capture the complex spatial and temporal heterogeneity of tumors, thereby enhancing precision medicine approaches in drug development and clinical oncology.
Next-generation sequencing (NGS) has become a cornerstone of precision oncology, enabling comprehensive genomic profiling of tumors to guide targeted therapies [4]. Traditionally, this profiling relies on tumor tissue biopsies, which are invasive, carry procedural risks, and may not fully represent the genomic landscape of a patient's cancer due to intratumoral heterogeneity [95] [96]. The analysis of circulating tumor DNA (ctDNA)—short DNA fragments released into the bloodstream by apoptotic or necrotic tumor cells—offers a minimally invasive alternative [97] [98].
A pivotal question for researchers and clinicians is the degree to which genomic alterations detected in ctDNA reflect those found in tumor tissue. Establishing this concordance is essential for validating liquid biopsies as a reliable tool for cancer diagnosis, monitoring, and guiding treatment [95] [97]. This technical guide explores the methodologies and evidence from studies directly comparing whole-genome and whole-exome sequencing of ctDNA with matched tumor tissue biopsies. Furthermore, it situates these concordance studies within the critical research theme of cancer heterogeneity, illustrating how ctDNA can provide a more composite view of a patient's disease compared to a single tissue biopsy [98] [96].
Methodological Framework for Concordance Studies
Core Experimental Workflow
A standardized approach is crucial for robust concordance studies. The following workflow outlines the key steps, from sample collection to data analysis.
The Scientist's Toolkit: Essential Reagents and Materials
Successful execution of a ctDNA concordance study requires carefully selected molecular biology reagents and sequencing solutions. The following table details key components.
Table 1: Essential Research Reagent Solutions for ctDNA Concordance Studies
| Item | Function | Key Considerations |
|---|---|---|
| cfDNA Extraction Kits (e.g., QIAamp DNA FFPE Tissue kit [7]) | Isolate cell-free DNA from plasma samples. | Maximize yield from low-concentration samples; minimize contamination. |
| FFPE DNA Extraction Kits | Extract DNA from formalin-fixed, paraffin-embedded (FFPE) tumor tissue. | Overcome DNA fragmentation and cross-linking from fixation [7]. |
| NGS Library Prep Kits | Prepare sequencing libraries from fragmented DNA input. | Optimized for low-input, degraded DNA (cfDNA); high conversion efficiency. |
| Target Enrichment Methods (Hybrid-Capture or Amplicon) [97] | Enrich for genomic regions of interest (e.g., cancer gene panels). | Hybrid-capture: broader coverage. Amplicon: cost-effective for hotspots. |
| Unique Molecular Identifiers (UMIs) [97] | Tag individual DNA molecules before amplification. | Enable bioinformatic error correction and reduce false-positive variant calls. |
| NGS Platforms (e.g., Illumina NextSeq 550Dx [7]) | Perform high-throughput parallel sequencing. | Choose based on required depth, read length, and application scale. |
| Bioinformatic Tools (e.g., MuTect2 for SNVs, CNVkit for CNVs [7]) | Align sequences, call variants, and filter results. | Critical for distinguishing true somatic variants from sequencing artifacts. |
Quantitative Concordance Findings and Data Synthesis
The concordance between ctDNA and tumor tissue is not a single value but varies significantly based on the genomic context and analytical parameters.
Studies report a wide range of concordance, heavily influenced by whether all tested genes or only altered genes are considered.
Table 2: Summary of Key Concordance Metrics from Select Studies
| Study Context | Overall Concordance (All Genes) | Concordance in Altered Genes | Sensitivity / Specificity | Key Factors Influencing Concordance |
|---|---|---|---|---|
| Targeted NGS (65 genes) in Advanced Cancers [95] | 91.9% - 93.9% | 11.8% - 17.1% | Sensitivity: 59.1%Specificity: 94.8% | Interval treatment (>90 days between samples), tumor heterogeneity, assay platform differences. |
| Multi-site ctDNA Assay Evaluation [97] | - | - | High sensitivity & specificity at VAF >0.5%; suboptimal and variable below 0.5% VAF. | Variant Allele Frequency (VAF), input DNA quantity, coverage depth, use of UMIs. |
| Whole Exome Sequencing (WES) in Multiple Cancers [98] | - | - | Concordance improves markedly with higher ctDNA fraction (>16.4%). | ctDNA fraction in plasma, tumor heterogeneity (capture of primary & metastatic profiles). |
| Clinical NGS Panel (544 genes) in Solid Tumors [7] | - | - | 26.0% patients had Tier I (strong clinical significance) variants. | Successfully identified actionable alterations for matched therapy. |
Factors Governing Concordance and Detection Sensitivity
The following diagram synthesizes the primary factors that influence whether a mutation present in the tumor is also detected in the ctDNA.
Critical Considerations for Experimental Design
Discordant results between ctDNA and tissue biopsies are not merely technical failures but can provide valuable biological insights. Key sources include:
- Tumor Heterogeneity: A single tissue biopsy may not capture the full genomic diversity of the tumor. ctDNA, shed from multiple tumor sites, can offer a more comprehensive profile, leading to apparent discordance as it detects clones absent in the biopsied sample [95] [96]. Studies have shown ctDNA can capture the mutational profiles of both primary and metastatic tumors within the same patient [98].
- Temporal Dynamics: Cancer genomes evolve over time and under treatment pressure. A long interval between tissue and blood collection can lead to discordance due to the emergence of new resistance mutations or clonal evolution, making the samples biologically distinct [95].
- Analytical Sensitivity: The low abundance of ctDNA in a background of wild-type cell-free DNA is a fundamental challenge. The variant allele frequency (VAF) is a critical determinant of detectability. As shown in multi-assay evaluations, reliable detection of mutations below 0.5% VAF remains a key challenge, with performance dropping significantly in this low-frequency range [97].
- Technical Artifacts: Errors can arise during pre-analytical (e.g., sample processing), analytical (e.g., PCR errors during library preparation), and bioinformatic steps. The use of unique molecular identifiers (UMIs) is highly recommended to tag and bioinformatically correct for these artifacts, significantly reducing false-positive calls [97].
Best Practices and Recommendations
Based on current evidence, the following practices enhance the validity of concordance studies:
- Minimize Time Intervals: Collect paired tissue and blood samples as close in time as possible to reduce the impact of tumor evolution [95].
- Maximize Input and Coverage: Use adequate volumes of plasma and ensure high sequencing depth to improve the detection of low-frequency variants [97].
- Employ UMIs: Implement UMI-based error correction to ensure variant calling accuracy [97].
- Use Standardized Reference Materials: Well-characterized cell line-derived reference samples are invaluable for cross-platform assay validation and proficiency testing [97].
- Interpret in Clinical Context: Discordance should be interpreted not just as a technical failure but as a potential reflection of the tumor's heterogeneous biology and evolution.
Concordance studies firmly establish that ctDNA WGS and WES can reliably capture a substantial portion of the genomic alterations found in traditional tumor biopsies, particularly for variants with VAF above 0.5%. The observed discordances are not merely noise but often stem from the very biological complexities—such as tumor heterogeneity and clonal evolution—that liquid biopsies are uniquely positioned to address. For the research and drug development community, this validates ctDNA analysis as a powerful tool for uncovering the complete genomic landscape of cancer, tracking dynamic changes in response to therapy, and identifying mechanisms of drug resistance. As NGS technologies continue to evolve, offering greater sensitivity and lower costs, the integration of ctDNA-based liquid biopsies into cancer heterogeneity studies and clinical trial designs will undoubtedly become more profound, accelerating the advance of personalized oncology.
Within the framework of a broader thesis on NGS applications in cancer heterogeneity studies, the analytical validation of next-generation sequencing (NGS) assays represents a critical foundational step. The profound genomic diversity within and between tumors necessitates molecular diagnostics of the highest accuracy and reliability [99]. Analytical validation provides the rigorous, evidence-based foundation that ensures the detection of true somatic variants—including low-frequency subclonal events characteristic of tumor heterogeneity—while minimizing false positives and maintaining consistency across runs and laboratories [16]. This technical guide details the core experimental protocols and performance metrics essential for establishing sensitivity, specificity, and reproducibility in NGS assays, with a specific focus on their application in cancer research and drug development.
Core Performance Metrics: Definitions and Benchmarking
Analytical validation determines whether an NGS assay performs as intended by assessing its performance limits and overall robustness [100]. For NGS assays in oncology, the key metrics are Sensitivity, Specificity, and Reproducibility, each requiring careful measurement for all variant types the assay is designed to detect.
Sensitivity measures the proportion of true positive variants that are correctly identified by the assay. It is often reported as Positive Percent Agreement (PPA) when compared to a reference method [46]. Specificity measures the proportion of true negative variants correctly identified, reported as Negative Percent Agreement (NPA) [46]. In the context of cancer, the Limit of Detection (LoD) is a crucial component of sensitivity, defining the lowest variant allele frequency (VAF) or input quantity at which a variant can be reliably detected [101]. This is particularly important for detecting low-frequency variants in heterogeneous tumor samples or in liquid biopsy applications where circulating tumor DNA (ctDNA) forms a small fraction of the total cell-free DNA [46]. Reproducibility encompasses both intra-run, inter-run, and inter-laboratory consistency, ensuring the assay produces the same results when repeated under varying conditions [102].
Table 1: Typical Performance Metrics for Validated NGS Assays Across Different Applications
| Application & Study | Variant Type | Sensitivity (PPA) | Specificity (NPA) | Key Validation Parameters |
|---|---|---|---|---|
| Liquid Biopsy Pan-Cancer [46] | SNVs/Indels | 96.92% | 99.67% | AF: 0.5%; 32-gene panel |
| Liquid Biopsy Pan-Cancer [46] | Fusions | 100% | 100% | AF: 0.5%; 32-gene panel |
| GI Cancer Panel [103] | SNVs | >99% | 97.4% | AF: >10%; 93-gene panel |
| GI Cancer Panel [103] | Indels | >99% | 93.6% | AF: >10%; 93-gene panel |
| RNA Fusion Detection [101] | Fusions | 98.28% | 99.89% | 318 fusion genes; 189 clinical specimens |
| NSCLC In-House Testing [102] | SNVs/Indels | 97.2% | 99.2% | 50-gene panel; 283 FFPE samples |
PPA, positive percent agreement; NPA, negative percent agreement; AF, allele frequency; SNV, single-nucleotide variant; Indel, insertion/deletion; FFPE, formalin-fixed, paraffin-embedded; GI, gastrointestinal; NSCLC, non-small cell lung cancer.
The data in Table 1 demonstrates that well-validated NGS assays can achieve high sensitivity and specificity across multiple sample types and variant classes. It is critical to note that performance is influenced by several factors, including the minimum allele frequency set for the assay, the input quantity and quality of nucleic acids, and the specific wet-lab and bioinformatics protocols used [99] [104].
Experimental Protocols for Establishing Performance Metrics
A robust validation strategy requires carefully designed experiments using well-characterized reference materials. The following protocols are considered the gold standard.
Determining Sensitivity and Limit of Detection (LoD)
The LoD is established using contrived samples with known variant allele frequencies. This often involves serial dilutions of DNA from cell lines harboring known mutations into wild-type DNA [101] [103].
- Reference Materials: Use commercially available reference cell lines or synthetic DNA standards with known variants. For fusion detection, RNA from cell lines with known fusions can be used [99] [101].
- Dilution Series: Create a dilution series of tumor DNA in normal DNA to model a range of tumor purities and variant allele frequencies (e.g., from 1% to 20%) [99] [103].
- Testing and Analysis: Process each sample in the dilution series through the entire NGS workflow, including library preparation, sequencing, and bioinformatics analysis. The LoD is defined as the lowest VAF at which the variant is detected with ≥95% confidence [101]. For the FoundationOneRNA assay, the LoD for fusions was determined to be between 21 and 85 supporting reads, with a minimum RNA input ranging from 1.5 ng to 30 ng [101].
Establishing Specificity
Specificity is evaluated by sequencing samples known to be negative for the variants in the assay's scope.
- True Negative Samples: Include wild-type cell lines or clinical samples previously characterized by orthogonal methods (e.g., Sanger sequencing) as negative for specific variants [104].
- Analysis: The NGS results are compared against the known negative status. Any false-positive calls are investigated to determine if they stem from sequencing artifacts, alignment errors, or sample contamination [104] [103]. A study comparing Exome Sequencing (ES) to Sanger sequencing found that 18.1% of ES-derived variants were false positives when non-stringent variant calling criteria were applied, highlighting the need for optimized bioinformatics filters [104].
Assessing Reproducibility
Reproducibility ensures the assay's results are consistent across different runs, operators, days, and potentially across laboratories.
- Experimental Design: Select a set of 5-10 samples encompassing different variant types (SNVs, indels, CNAs, fusions) and a range of allele frequencies [101] [102].
- Replication: Process the same set of samples repeatedly in different sequencing runs (inter-run), by different operators, and/or on different instruments [103].
- Multi-institutional Studies: For decentralized testing, inter-laboratory reproducibility is key. A multi-institutional study on NSCLC samples demonstrated 95.2% inter-laboratory concordance, proving that standardized protocols can yield highly reproducible results [102].
- Calculation: Reproducibility is calculated as the percentage of identical variant calls across all replicates. In a validation study of an RNA-seq assay for fusions, 10 out of 10 pre-defined target fusions showed 100% reproducibility [101].
Diagram 1: Core NGS analytical validation workflow, highlighting the integrated steps from sample preparation to final interpretation.
The Scientist's Toolkit: Essential Reagents and Materials
Successful implementation and validation of an NGS assay rely on a suite of trusted reagents and platforms. The selection of tools depends on the chosen methodology (e.g., amplicon-based vs. hybrid capture) and the desired throughput.
Table 2: Key Research Reagent Solutions for Targeted NGS Workflows
| Product Category | Example Products | Primary Function in NGS Workflow |
|---|---|---|
| Targeted Panels | Archer FUSIONPlex, VARIANTPlex [105] | Targeted sequencing for fusion detection (FUSIONPlex) or variant detection (VARIANTPlex) via amplicon-based enrichment. |
| Hybrid Capture Panels | xGen Hybrid Capture workflows [105] | Use biotinylated probes to enrich for regions of interest from fragmented DNA libraries; suitable for larger genomic regions. |
| Automation Platforms | Biomek i3 Benchtop Liquid Handler [105] | Automates liquid handling steps in NGS library prep, reducing hands-on time and improving reproducibility and throughput. |
| NGS Platforms | Illumina, PacBio, Oxford Nanopore [16] | High-throughput sequencers that perform massively parallel sequencing; choice depends on read length, cost, and error profile needs. |
| Reference Standards | Commercial or publicly available cell lines (e.g., Coriell) [99] | Provide DNA with known mutations at defined allele frequencies for assay validation, sensitivity, and LoD studies. |
An Error-Based Approach to Validation
Professional guidelines from the Association of Molecular Pathology (AMP) and the American College of Medical Genetics and Genomics (ACMG) emphasize an error-based approach to validation [99] [106]. This involves the laboratory director proactively identifying potential sources of errors throughout the entire analytical process—from sample extraction to variant reporting—and addressing them through test design, validation, or quality controls.
- Pre-Analytical Phase: Errors can arise from insufficient tumor content, poor nucleic acid quality from FFPE samples, or sample mix-up. Mitigation strategies include mandatory pathological review for tumor enrichment and DNA/RNA quantification using fluorometric methods [99].
- Analytical Phase: Library preparation artifacts (e.g., in amplicon-based methods) or sequencing errors can occur. Using unique molecular identifiers (UMIs), optimizing hybridization conditions, and monitoring sequencing quality metrics (Q-scores) are essential quality controls [99] [46].
- Post-Analytical Phase: Bioinformatics pipelines can introduce false positives/negatives through misalignment or inappropriate variant filtering. Pipelines must be validated, and key parameters like coverage depth and quality scores must be optimized [104]. A study found that an algorithm based on variant-specific features (e.g., quality score, read depth) could classify 91.7% of exome-sequencing variants with 100% specificity, drastically reducing the need for confirmatory Sanger sequencing [104].
Diagram 2: An error-based validation approach maps and mitigates potential failure points across the entire NGS workflow.
The rigorous analytical validation of NGS assays is a non-negotiable prerequisite for generating reliable data in cancer heterogeneity research. By establishing and adhering to strict performance benchmarks for sensitivity, specificity, and reproducibility, researchers and drug developers can confidently use these powerful tools to decipher the complex genomic landscape of tumors. The protocols and metrics outlined in this guide provide a roadmap for implementing robust NGS assays that can accurately detect the full spectrum of genomic alterations, thereby enabling the advancement of personalized oncology and the development of more effective targeted therapies.
The emergence of Next-Generation Sequencing (NGS) has fundamentally transformed genomic analysis, enabling unprecedented insights into the complex architecture of cancer genomes. Unlike traditional methods that analyze genetic alterations in isolation, NGS provides a comprehensive view of the genomic landscape, making it particularly invaluable for studying tumor heterogeneity - a fundamental characteristic of cancer that drives therapeutic resistance and disease progression [4] [2]. The ability to profile thousands of genes simultaneously from limited biological material has positioned NGS as a cornerstone technology in precision oncology, facilitating the discovery of novel biomarkers and personalized treatment strategies [7].
This technical analysis provides a comparative assessment of NGS versus traditional sequencing methods across critical parameters including sensitivity, throughput, and cost-effectiveness, with specific emphasis on applications in cancer heterogeneity research. As tumors evolve through distinct spatial and temporal patterns, creating intricate subclonal architectures, the technological limitations of single-gene assays become increasingly apparent [2]. The transition to NGS represents not merely an incremental improvement but a paradigm shift in how researchers interrogate the genetic basis of cancer, enabling multi-dimensional analysis of heterogeneity that was previously undetectable [4].
Technological Comparison: NGS vs. Traditional Methods
Fundamental Principles and Workflows
Traditional Sanger Sequencing, developed by Frederick Sanger in 1977, operates on the chain-termination principle using dideoxynucleotides (ddNTPs) to generate DNA fragments of varying lengths that are separated by capillary electrophoresis [12] [93]. While revolutionary for its time, this method processes only a single DNA fragment per reaction, fundamentally limiting its throughput and scalability for comprehensive genomic studies [4].
In contrast, Next-Generation Sequencing employs massively parallel sequencing, simultaneously processing millions to billions of DNA fragments [107] [12]. This core architectural difference enables NGS to generate orders of magnitude more data in a single run. The NGS workflow typically involves: (1) library preparation through DNA fragmentation and adapter ligation; (2) cluster generation via bridge amplification or emulsion PCR; (3) cyclic sequencing through synthesis or ligation; and (4) imaging and base calling [4] [93]. This parallel processing framework fundamentally redefines the scale and scope of genomic investigation possible within conventional research timelines and budgets.
Performance Metrics: Comparative Analysis
Table 1: Direct comparison of key performance metrics between NGS and Sanger sequencing
| Feature | Next-Generation Sequencing | Sanger Sequencing |
|---|---|---|
| Throughput | Millions to billions of reads in parallel [4] | Single sequence per reaction [4] |
| Read Length | Short-read: 50-300 bp [108]; Long-read: 10,000-30,000 bp [12] | 400-900 bp [4] |
| Sensitivity for Variant Detection | Can detect variants with ≥2% variant allele frequency (VAF) [7] | Limited sensitivity, typically ≥15-20% VAF [4] |
| Cost-Effectiveness | Highly cost-effective for large gene panels/whole genomes [93] | Economical for interrogating single genes [4] |
| Applications in Cancer | Comprehensive genomic profiling, tumor heterogeneity, MRD monitoring [4] | Ideal for confirming specific mutations in known oncogenes [4] |
| Variant Detection Scope | Simultaneously detects SNVs, INDELs, CNVs, fusions, and TMB [7] | Limited to specific targeted mutations [4] |
Table 2: Comparison of pathogen detection performance in lower respiratory tract infections
| Parameter | NGS Method | Traditional Methods |
|---|---|---|
| Detection Rate | 84.5% (60/71 cases) [109] | 26.8% (19/71 cases) [109] |
| Turnaround Time | Significantly shorter [109] | Considerably longer [109] |
| Organisms Detected | Broad range including Mycobacterium, viruses, fungi, bacteria [109] | Limited primarily to bacteria and fungi [109] |
| Consistency Rate | 68.4% with traditional methods (when traditional method is gold standard) [109] | N/A |
The dramatically higher sensitivity of NGS enables detection of low-frequency subclonal populations within heterogeneous tumors that would remain undetectable by Sanger sequencing [4]. This capability is critical for understanding tumor evolution, therapeutic resistance, and minimal residual disease [4]. In a clinical study of lower respiratory tract infections, NGS demonstrated a 84.5% pathogen detection rate compared to only 26.8% with traditional methods [109]. The technological advantage extends beyond raw detection rates to encompass a much broader spectrum of genetic alterations, including single nucleotide variants (SNVs), insertions/deletions (INDELs), copy number variations (CNVs), gene fusions, and global metrics like tumor mutational burden (TMB) - all from a single assay [7].
Experimental Protocols and Methodologies
NGS Workflow for Cancer Genomic Profiling
NGS Cancer Profiling Workflow
The standard NGS workflow for comprehensive genomic profiling in cancer research involves multiple critical stages, each requiring rigorous quality control [7]. Sample collection typically utilizes Formalin-Fixed Paraffin-Embedded (FFPE) tumor specimens or fresh biopsy material, with careful attention to tumor cellularity and nucleic acid integrity [7]. For FFPE samples, manual microdissection of representative tumor areas ensures sufficient tumor content, with a minimum of 20 ng DNA required for library generation [7].
Library preparation employs hybrid capture methods using systems like the Agilent SureSelectXT Target Enrichment Kit, with fragmentation to approximately 300 bp followed by adapter ligation [4] [7]. The quality assessment of resulting libraries includes evaluation of size distribution (250-400 bp) and concentration (>2 nM) using an Agilent 2100 Bioanalyzer system [7]. Targeted sequencing panels (e.g., SNUBH Pan-Cancer v2.0 covering 544 genes) are then sequenced on platforms such as Illumina NextSeq 550Dx with a mean depth of 677.8× and minimum 80% of bases covered at 100× [7].
Bioinformatic analysis represents a critical component of the NGS workflow. Following sequencing, reads are aligned to the reference genome (hg19) using optimized aligners, followed by variant calling with tools like Mutect2 for SNVs/INDELs and CNVkit for copy number variations [7]. For clinical applications, variants are classified according to established guidelines such as the Association for Molecular Pathology (AMP) tiers, which categorize variants based on their clinical significance [7].
The Scientist's Toolkit: Essential Research Reagents
Table 3: Key research reagents and their applications in NGS workflows
| Reagent/Kits | Primary Function | Application Context |
|---|---|---|
| QIAamp DNA FFPE Tissue Kit (Qiagen) | Extraction of high-quality DNA from archived FFPE samples [7] | Overcoming formalin-induced crosslinking for archival tissue analysis |
| Agilent SureSelectXT Target Enrichment | Hybrid capture-based enrichment of target genomic regions [7] | Focused sequencing of cancer-related genes with comprehensive coverage |
| Illumina NextSeq 550Dx System | High-throughput sequencing with integrated data analysis [7] | Production-scale sequencing for large patient cohorts |
| Precision ID mtDNA Control Region Panel | Targeted analysis of mitochondrial hypervariable regions [110] | Forensic applications and analysis of degraded samples |
| Ion GeneStudio S5 System | Semiconductor-based sequencing technology [110] | Flexible sequencing output for various research scales |
NGS Applications in Cancer Heterogeneity Research
Dissecting Tumor Heterogeneity
Cancer heterogeneity represents a fundamental challenge in oncology, encompassing both intertumoral (between patients) and intratumoral (within individual tumors) diversity [2]. Traditional two-dimensional cell cultures and single-gene assays fail to adequately capture this complexity due to their simplified model systems and limited genomic coverage [4] [2]. NGS technologies enable multi-dimensional analysis of heterogeneity through multiple approaches:
Single-cell sequencing resolves cellular diversity within tumors by profiling individual cells, revealing rare subpopulations and transitional states that drive therapeutic resistance [107]. This approach is particularly valuable for mapping clonal evolution and identifying pre-resistant clones before therapeutic exposure. Spatial transcriptomics complements single-cell analysis by preserving the architectural context of gene expression, allowing researchers to correlate genetic heterogeneity with tumor microenvironmental niches [107]. This spatial dimension is critical for understanding how positional constraints influence clonal expansion and drug penetration.
The integration of NGS with patient-derived organoids (PDOs) creates powerful model systems that maintain the genetic and phenotypic heterogeneity of original tumors [2]. These three-dimensional structures recapitulate the histoarchitecture, genetic stability, and phenotypic complexity of primary tumors, serving as avatars for high-throughput drug screening and functional genomics [2]. When combined with CRISPR-based functional screens, PDOs enable systematic investigation of genetic dependencies across molecularly distinct subclones within heterogeneous tumors [2].
Clinical Translation and Therapeutic Decision-Making
The clinical implementation of NGS has demonstrated significant impact on personalized cancer therapy. In a large-scale study of 990 patients with advanced solid tumors, NGS profiling identified Tier I variants (strong clinical significance) in 26.0% of cases, with 13.7% of these patients receiving NGS-guided therapy [7]. Among patients with measurable lesions who received matched targeted therapies, 37.5% achieved partial response and 34.4% achieved stable disease, with a median treatment duration of 6.4 months [7].
NGS further enhances cancer management by enabling minimal residual disease (MRD) monitoring with superior sensitivity compared to traditional methods [4]. This application allows detection of recurrent disease before clinical or radiological manifestation, potentially enabling earlier therapeutic intervention. Additionally, NGS identifies biomarkers predictive of response to immunotherapy, such as tumor mutational burden (TMB) and microsatellite instability (MSI), expanding treatment options for patients lacking targetable driver mutations [4] [7].
Current Challenges and Future Directions
Analytical and Implementation Considerations
Despite its transformative potential, NGS implementation faces several significant challenges. Bioinformatic complexity represents a substantial barrier, requiring sophisticated computational infrastructure and specialized expertise for data processing, variant interpretation, and clinical reporting [107] [7]. The massive volume of data generated by NGS platforms - often exceeding terabytes per project - necessitates robust storage solutions and scalable computational resources, frequently addressed through cloud-based platforms like Amazon Web Services and Google Cloud Genomics [107].
Data interpretation and reporting complexities are amplified in cancer heterogeneity research, where distinguishing driver mutations from passenger alterations in subclonal populations requires advanced analytical methods [7]. The establishment of molecular tumor boards with multidisciplinary expertise has emerged as a strategy to address these interpretation challenges in clinical settings [7]. Additionally, turnaround time remains a consideration for clinical adoption, with NGS tests typically requiring several days compared to rapid PCR tests for single genes, though technological advances are continuously reducing this timeline [109].
Emerging Technologies and Methodological Innovations
The NGS landscape continues to evolve with several promising technologies enhancing cancer heterogeneity research. Third-generation sequencing platforms including PacBio's HiFi reads and Oxford Nanopore Technologies offer long-read capabilities exceeding 15 kb with >99.9% accuracy, enabling resolution of complex genomic regions, structural variants, and haplotype phasing that are inaccessible to short-read technologies [12] [108]. Single-molecule sequencing approaches eliminate amplification biases, providing more quantitative measurements of allele frequencies in heterogeneous samples [12].
The convergence of NGS with artificial intelligence represents another frontier, with deep learning models like Google's DeepVariant demonstrating superior variant calling accuracy compared to traditional methods [107]. AI-powered analytical tools are particularly valuable for interpreting the complex patterns of heterogeneity in multi-dimensional genomic data. Additionally, multi-omics integration - combining genomic, transcriptomic, proteomic, and epigenomic data - provides a systems-level understanding of tumor biology that more accurately captures the molecular complexity of cancer [107]. These integrated approaches reveal how genetic heterogeneity manifests at different molecular levels, enabling more comprehensive biomarkers of therapeutic response and resistance.
NGS in Cancer Heterogeneity Research
The comprehensive comparative analysis presented in this technical assessment demonstrates that Next-Generation Sequencing outperforms traditional methods across all critical parameters - sensitivity, throughput, and comprehensive variant detection - while maintaining cost-effectiveness for large-scale genomic investigations. The technological advantages of NGS are particularly pronounced in cancer heterogeneity research, where its ability to detect low-frequency subclones, simultaneously identify diverse variant types, and profile the entire genomic landscape enables unprecedented insights into tumor evolution and therapeutic resistance.
While challenges remain in data management, interpretation complexity, and clinical integration, ongoing innovations in sequencing chemistry, computational analytics, and multi-omics integration continue to expand the applications of NGS in both research and clinical domains. The convergence of NGS with patient-derived organoids, single-cell technologies, and artificial intelligence represents a powerful paradigm for advancing our understanding of cancer heterogeneity and accelerating the development of personalized therapeutic strategies. As these technologies mature and become more accessible, NGS will undoubtedly remain the foundational technology for precision oncology and cancer systems biology.
The advent of Next-Generation Sequencing (NGS) has fundamentally transformed oncology, enabling a shift from histology-based to genomics-driven cancer treatment. This whitepaper examines the growing body of real-world evidence (RWE) correlating NGS-based genomic matching with patient treatment response and survival outcomes. Within cancer heterogeneity studies, RWE derived from routine clinical practice provides critical insights complementing data from controlled clinical trials, particularly regarding the clinical utility of comprehensive genomic profiling (CGP) across diverse patient populations and healthcare settings. The integration of these real-world findings is essential for advancing precision oncology and understanding how genomic matching influences therapeutic efficacy in heterogenous tumor environments [111] [112].
Quantitative Evidence of NGS Impact on Clinical Outcomes
Real-world studies across multiple institutions and geographic regions have generated substantial quantitative data regarding the impact of genomically-matched therapies on patient outcomes. The evidence demonstrates variable but clinically meaningful benefits, though the magnitude depends on clinical context and selection criteria.
Table 1: Real-World Outcomes of NGS-Guided Therapy Across Multiple Studies
| Study (Country) | Study Population | Key Findings on Genomically-Matched Therapy | Statistical Significance |
|---|---|---|---|
| Tsimberidou et al., 2017 (International) [111] | Advanced cancer (n=1,436) | Improved response rates (11% vs. 5%); Longer failure-free survival (3.4 vs. 2.9 months); Longer overall survival (8.4 vs. 7.3 months) | P=0.0099; P=0.0015; P=0.041 |
| South Korean Tertiary Hospital Study [7] | Advanced solid tumors (n=990) | 13.7% of Tier I variant patients received NGS-based therapy; 37.5% achieved partial response; 34.4% achieved stable disease | Treatment duration: 6.4 months |
| Spanish Observational Study [113] | Mixed cancers (n=139) | No significant PFS difference based on druggable alterations alone; Significant PFS improvement when NGS used within clinical judgement (319 vs. 123 days) | P=0.0020 |
| Taiwanese NSCLC Study [114] | NSCLC (n=385) | 86.8% harbored pathogenic variants; Actionable drivers identified: EGFR (46.2%), KRAS (9.4%), ALK fusions (4.4%) | Informs treatment selection |
The evidence indicates that clinical benefit from NGS-based matching is most pronounced when testing is applied within specific clinical contexts rather than universally. A Spanish observational study highlighted this nuance, finding that progression-free survival (PFS) was not significantly influenced by the mere presence of druggable alterations, but was significantly improved when NGS testing was performed under recommended clinical scenarios (319 days versus 123 days, p=0.0020) [113]. Similarly, a population-based study on NSCLC found that NGS did not increase survival outcomes for all patients, but was associated with better survival specifically in the subgroup for whom EGFR or ALK inhibitors were not indicated (14.1 versus 9.0 months, HR 0.82, 95% CI 0.69-0.97) [115]. This underscores the importance of patient selection and clinical judgement in maximizing the utility of NGS testing.
Methodological Framework for NGS-Based Genomic Matching
Sample Preparation and Quality Control
The reliability of NGS-based genomic matching begins with rigorous sample preparation and quality control. The standard process involves multiple critical steps:
- Sample Acquisition and Evaluation: Formalin-fixed, paraffin-embedded (FFPE) tumor specimens are reviewed by pathologists to assess tissue quality and tumor content. Samples with ≥20% tumor cells are generally considered acceptable, though suboptimal specimens may be used in specific clinical scenarios after clinician consultation [114].
- Nucleic Acid Extraction: DNA and RNA are co-extracted from FFPE samples using specialized kits (e.g., RecoverAll Total Nucleic Acid Isolation Kit). The extracted nucleic acids are quantified using fluorometric methods (e.g., Qubit fluorometer), and purity is assessed via spectrophotometry (A260/A280 ratio between 1.7-2.2) [7] [114].
- Library Preparation: For targeted sequencing, libraries are prepared using either hybrid capture or amplicon-based approaches. The Oncomine Focus Assay (OFA), an amplicon-based method, requires only 20ng of DNA or RNA input, making it suitable for limited biopsy material [114]. Adapters are ligated to fragmented DNA, followed by library amplification and normalization before sequencing.
Sequencing Platforms and Analytical Approaches
Different NGS approaches offer varying balances between comprehensiveness and clinical practicality:
- Targeted NGS Panels: Focus on 50-500 cancer-related genes, providing a cost-effective solution for clinical decision-making with faster turnaround times. Examples include the Oncomine Focus Assay (52 genes) and SNUBH Pan-Cancer v2.0 (544 genes) [7] [114].
- Whole Exome Sequencing (WES): Analyzes all protein-coding regions (approximately 1-2% of the genome), capturing most disease-related mutations.
- Whole Genome Sequencing (WGS): Provides the most comprehensive analysis of the entire genome, including non-coding regions, but generates substantial data requiring complex interpretation [4].
Diagram 1: NGS Clinical Testing Workflow
Bioinformatics Analysis and Variant Interpretation
The analytical pipeline transforms raw sequencing data into clinically actionable information:
- Variant Calling: Bioinformatic tools (e.g., Mutect2 for SNVs/indels, CNVkit for copy number variations, LUMPY for fusions) identify genomic alterations from aligned sequences. Minimum quality thresholds are applied (e.g., variant allele frequency ≥2%, read depth ≥200) [7].
- Variant Annotation and Classification: Identified variants are classified according to established guidelines such as the Association for Molecular Pathology (AMP) tiers or the ESMO Scale for Clinical Actionability of Molecular Targets (ESCAT) [113] [7]. Tier I/ESCAT I-II variants have strong evidence supporting clinical actionability.
- Molecular Tumor Boards (MTBs): Multidisciplinary teams comprising oncologists, pathologists, geneticists, and bioinformaticians interpret complex genomic findings within individual patient contexts to recommend personalized treatment strategies [112].
Key Signaling Pathways and Actionable Targets in Oncology
NGS profiling reveals alterations across core cancer signaling pathways that represent opportunities for targeted intervention. The clinical actionability of these findings depends on the strength of evidence linking specific alterations to treatment response.
Table 2: Clinically Actionable Genomic Alterations and Targeted Therapies
| Signaling Pathway | Key Alterations | Associated Cancers | Matched Targeted Therapies |
|---|---|---|---|
| Receptor Tyrosine Kinase Signaling | EGFR mutations, ALK fusions, ROS1 fusions, RET fusions | NSCLC, various solid tumors | EGFR inhibitors (erlotinib), ALK inhibitors (crizotinib), TRK inhibitors |
| MAPK Pathway | BRAF V600E, KRAS G12C, NRAS mutations | Melanoma, NSCLC, colorectal cancer | BRAF inhibitors (vemurafenib), MEK inhibitors, KRAS G12C inhibitors |
| PI3K/AKT/mTOR Pathway | PIK3CA mutations, PTEN loss, AKT mutations | Breast cancer, gynecologic cancers, glioblastoma | PI3K inhibitors, AKT inhibitors, mTOR inhibitors |
| DNA Damage Response | BRCA1/2 mutations, ATM alterations | Breast, ovarian, prostate, pancreatic cancers | PARP inhibitors (olaparib) |
| Cell Cycle Regulation | CDK4/6 amplifications, CCND1 amplifications | Breast cancer, sarcoma, liposarcoma | CDK4/6 inhibitors (palbociclib) |
Diagram 2: Key Actionable Pathways in Precision Oncology
Essential Research Reagents and Platforms
The implementation of NGS in clinical research requires specialized reagents, controls, and instrumentation to ensure reproducible and accurate results.
Table 3: Essential Research Reagents and Platforms for NGS Implementation
| Reagent/Platform Category | Specific Examples | Function and Application |
|---|---|---|
| Nucleic Acid Extraction Kits | RecoverAll Total Nucleic Acid Isolation Kit | Co-extraction of DNA and RNA from FFPE specimens for simultaneous analysis of multiple alteration types |
| Targeted NGS Panels | Oncomine Focus Assay (52 genes), SNUBH Pan-Cancer v2.0 (544 genes) | Simultaneous detection of SNVs, indels, CNVs, and fusions in cancer-relevant genes with optimized sample requirements |
| Library Preparation Systems | Agilent SureSelectXT, Ion AmpliSeq | Target enrichment and library construction with integration for specific sequencing platforms |
| Sequencing Platforms | Illumina NextSeq 550Dx, Ion Torrent | High-throughput sequencing with different chemistries (sequencing by synthesis vs. semiconductor) |
| Reference Standards | Horizon OncoSpan, Seraseq Fusion RNA Mix | Quality control, assay validation, and monitoring of sensitivity/specificity across batches |
| Bioinformatics Tools | Mutect2, CNVkit, LUMPY | Variant calling, annotation, and interpretation with specialized algorithms for different alteration types |
Challenges and Implementation Considerations
Despite the demonstrated utility of NGS-based genomic matching, several challenges persist in its routine clinical application:
- Tumor Heterogeneity and Clonal Evolution: Intratumoral heterogeneity can lead to incomplete genomic characterization from single biopsies, and clonal evolution under therapeutic pressure may cause discordance between molecular profiles and treatment response [111] [113].
- Interpretative Complexity: Distinguishing driver from passenger mutations and accurately predicting functional impact requires sophisticated bioinformatics and multidisciplinary expertise [111] [112].
- Access and Equity Issues: Real-world studies have identified disparities in NGS utilization based on age, income, and geographic location, potentially limiting equitable access to precision oncology [115].
- Infrastructure and Resource Requirements: Establishing and maintaining the bioinformatics infrastructure, computational resources, and specialist expertise needed for NGS implementation represents a significant investment for healthcare systems [7] [112].
Real-world evidence consistently demonstrates that NGS-based genomic matching can significantly impact patient outcomes in oncology, particularly when applied within appropriate clinical contexts and supported by multidisciplinary interpretation. The integration of comprehensive genomic profiling into cancer heterogeneity research provides crucial insights into the molecular determinants of treatment response and resistance mechanisms. As NGS technologies evolve and evidence matures, the ongoing refinement of patient selection, biomarker validation, and clinical decision-support frameworks will further enhance the implementation of precision oncology across diverse healthcare settings. Future directions include the standardization of liquid biopsy applications, the integration of artificial intelligence for pattern recognition in complex genomic data, and the development of more sophisticated frameworks for interpreting the clinical implications of co-mutation patterns within heterogeneous tumor ecosystems [111] [4] [112].
Benchmarking Different NGS Platforms (Illumina, Oxford Nanopore, PacBio) for Heterogeneity Studies
The comprehensive genomic profiling of tumors has fundamentally transformed the approach to cancer diagnosis and treatment, with next-generation sequencing (NGS) emerging as a pivotal technology in oncology [4]. Cancer, characterized by profound genetic alterations and cellular dysregulation, represents a major global health challenge, with an estimated 20 million new cases and 9.7 million deaths reported in 2022 alone [16]. The genomic heterogeneity of tumors—both within individual patients (spatial heterogeneity) and over time (temporal heterogeneity)—presents significant challenges for treatment and is a primary driver of therapeutic resistance and disease progression [4] [16].
Understanding this heterogeneity is essential for developing effective, personalized cancer therapies. NGS technologies enable researchers to decipher this complexity by providing unprecedented insights into the molecular landscape of cancers, identifying driver mutations, fusion genes, and predictive biomarkers across diverse cancer types [16]. The paradigm shift toward precision oncology has been largely underpinned by these sequencing technologies, which allow for the comprehensive interrogation of cancer genomes at multiple molecular levels [4] [16].
This technical guide provides a comprehensive benchmarking analysis of three major NGS platforms—Illumina, Oxford Nanopore Technologies (ONT), and Pacific Biosciences (PacBio)—for studying cancer heterogeneity. We evaluate their performance characteristics, experimental considerations, and applications in resolving the complex genomic architecture of tumors, with a focus on enabling molecularly driven cancer care.
NGS Platform Technologies: Principles and Comparison
Fundamental Sequencing Technologies
Illumina technology employs sequencing-by-synthesis chemistry, where DNA fragments are immobilized on a flow cell and amplified to form clusters, followed by cyclic nucleotide incorporation with fluorescent detection [4]. This approach generates massive amounts of short-read data (75-300 bp) with exceptionally high accuracy (exceeding 99.9%) [16]. Illumina dominates second-generation NGS due to its high throughput, low error rates, and attractive cost per base, making it suitable for genome resequencing, transcriptome profiling, and variant calling with established bioinformatics pipelines [16].
Oxford Nanopore Technologies (ONT) utilizes a fundamentally different approach based on nanopore sequencing. Single strands of DNA or RNA are passed through protein nanopores embedded in a synthetic membrane, with changes in electrical current measured as each molecule traverses the pore [116]. This technology produces ultra-long reads (sometimes exceeding hundreds of thousands of bases) and can sequence native DNA/RNA, preserving base modifications [116]. However, it traditionally has lower raw read accuracy and systematic errors in low-complexity regions, leading to higher coverage requirements [116].
Pacific Biosciences (PacBio) employs single-molecule real-time (SMRT) sequencing technology, which uses hairpin adapters to create single-stranded circular templates that can be sequenced continuously through zero-mode waveguides [117]. The platform's HiFi sequencing mode generates long reads (15,000-20,000 bases) with exceptional accuracy (exceeding 99.9%) through circular consensus sequencing, which multiples passes of the same DNA molecule [116]. This approach provides high-quality reads of sequence and methylation status, including in regions not accessible to short-read technologies [116].
Technical Performance Comparison
Table 1: Technical Specifications of Major NGS Platforms
| Feature | Illumina | Oxford Nanopore | PacBio HiFi |
|---|---|---|---|
| Read Length | 75-300 bp [16] | 20 to >4 Mb [116] | 500 to 20 kb [116] |
| Accuracy | >99.9% (Q30+) [16] | ~Q20 (99%) [116] | Q33 (99.95%) [116] |
| Typical Run Time | Varies by system | 72 hours [116] | 24 hours [116] |
| Throughput | High (system-dependent) | 50-100 Gb per flow cell [116] | 60-120 Gb per SMRT Cell [116] |
| Variant Detection - SNVs | Excellent [16] | Good [116] | Excellent [116] |
| Variant Detection - Indels | Good (limited in repeats) | Challenging in repetitive regions [116] | Excellent [116] |
| Variant Detection - SVs | Limited for complex variants | Excellent [118] | Excellent [116] |
| DNA Modification Detection | Requires bisulfite treatment | Direct detection (5mC, 5hmC, 6mA) [117] [116] | Direct detection (5mC, 6mA) [117] [116] |
| RNA Sequencing | Via cDNA | Direct RNA sequencing [116] | Via cDNA [116] |
Table 2: Performance in Genomic Contexts Relevant to Cancer Heterogeneity
| Genomic Feature | Illumina | Oxford Nanopore | PacBio HiFi |
|---|---|---|---|
| Single Nucleotide Variants | Excellent sensitivity and specificity [16] | Good, but affected by lower base accuracy [116] | Excellent sensitivity and specificity [116] |
| Small Insertions/Deletions | Good for simple indels [16] | Systematic errors in repetitive regions [116] | High accuracy even in repetitive contexts [116] |
| Structural Variants | Limited resolution for complex events [118] | Excellent for detecting large rearrangements [118] | Excellent precision for breakpoint mapping [116] |
| Copy Number Variations | Good with sufficient coverage [7] | Challenging due to coverage uniformity | Good with specialized analysis |
| Gene Fusions | Limited to known partners with targeted panels | Can discover novel fusions [119] | Ideal for comprehensive fusion detection |
| Epigenetic Modifications | Requires separate assays | Native detection possible [117] | Integrated 5mC detection [117] |
| Phasing | Limited to statistical methods | Long reads enable direct phasing | HiFi reads provide excellent phasing [116] |
Experimental Design for Platform Benchmarking
Sample Preparation and Quality Control
Robust experimental design begins with appropriate sample collection and nucleic acid extraction. For cancer heterogeneity studies, both tumor tissues and liquid biopsy samples can be utilized, with careful attention to tumor cellularity and DNA quality [7]. The initial step in NGS involves extracting and preparing DNA or RNA from the sample of interest, with quality and quantity of nucleic acids assessed to ensure they meet sequencing requirements [4].
For DNA sequencing, this typically involves extracting genomic DNA from cells or tissues, while RNA sequencing requires isolation of total RNA followed by reverse transcription to generate complementary DNA (cDNA) [4]. In formalin-fixed paraffin-embedded (FFPE) tumor specimens—common in clinical practice—DNA fragmentation must be assessed, and a minimum of 20 ng of DNA with A260/A280 ratio between 1.7 and 2.2 is recommended for library generation [7]. For studies incorporating liquid biopsies, cell-free DNA extraction protocols should be optimized for fragment size preservation.
Library construction includes fragmenting the genomic sample to the correct size (approximately 300 bp for Illumina) and attaching adapters to the DNA fragments [4]. These adapters are essential for attaching DNA fragments to the sequencing platform and for subsequent amplification and sequencing. Depending on the NGS technology, various types of libraries can be constructed, such as whole-genome, whole-exome, or targeted sequencing libraries [4]. An enrichment step is necessary to isolate coding sequences, typically accomplished through PCR using specific primers or exon-specific hybridization probes [4].
Platform-Specific Methodologies
Illumina Sequencing Protocol for cancer heterogeneity studies typically involves targeted sequencing panels like the SNUBH Pan-Cancer v2.0 Panel, which targets 544 cancer-related genes [7]. The hybrid capture method is used for DNA library preparation and target enrichment according to Illumina's standard protocol using kits such as Agilent SureSelectXT Target Enrichment [7]. For the V3-V4 regions of the 16S rRNA gene (relevant for microbiome studies in cancer), amplification conditions include denaturation at 95°C for 5 minutes; 20 cycles of denaturation at 95°C for 30 seconds, primer annealing at 60°C for 30 seconds, extension at 72°C for 30 seconds, and final elongation at 72°C for 5 minutes [120]. Sequencing is performed on platforms such as NextSeq 550Dx to generate paired-end reads with a read length of 2×300 bp [120] [7].
Oxford Nanopore Protocol for whole-genome sequencing of cancer samples utilizes the Native Barcoding Kit for multiplexing samples [118]. Barcoded libraries are pooled and loaded onto a MinION, GridION or PromethION flow cell (with R9.4 or R10.4.1 chemistry) [120] [118]. Sequencing is performed using MinKNOW software onboard the MinION Mk1C until the end of life of the flow cell (typically 72 hours) [120]. For 16S rRNA profiling, the ONT 16S Barcoding Kit is used, following the manufacturer's protocol [120]. Basecalling and demultiplexing are performed using the Dorado basecaller with the High Accuracy (HAC) model [120].
PacBio Sequencing Protocol for high-resolution sequencing employs the SMRTbell Prep Kit for library preparation following PacBio's protocol [121]. For full-length 16S rRNA gene sequencing, the universal primers 5'-GCATC/barcode/AGRGTTYGATYMTGGCTCAG-3' and 5'-GCATC/barcode/RGYTACCTTGTTACGACTT-3' are used, each tagged with sample-specific PacBio barcodes for multiplexed sequencing [121]. PCR amplification is performed over 30 cycles: denaturation at 95°C for 30 seconds, annealing at 57°C for 30 seconds, and extension at 72°C for 60 seconds [121]. Sequencing runs on the PacBio Sequel IIe system typically take 10 hours [121].
Analytical Approaches for Heterogeneity Studies
Bioinformatics Pipelines
The bioinformatics analysis of NGS data for cancer heterogeneity requires sophisticated computational approaches tailored to each platform's characteristics. For Illumina data, processing typically begins with quality assessment using FastQC, followed by adapter trimming with tools like Cutadapt [120]. Reads are aligned to a reference genome using optimized aligners such as BWA, followed by variant calling with tools like Mutect2 for single nucleotide variants (SNVs) and small insertions/deletions (indels), CNVkit for copy number variations, and LUMPY for gene fusions [7]. Microsatellite instability (MSI) status can be detected using mSINGs, and tumor mutation burden (TMB) is calculated as the number of eligible variants within the panel size [7].
For long-read data from Oxford Nanopore and PacBio, specialized analytical tools are required. Structural variant calling from long-read sequencing data employs tools such as Sniffles, cuteSV, Delly, DeBreak, Dysgu, NanoVar, SVIM, and Severus [118]. These tools offer various functionalities tailored to specific challenges in SV detection, with combinations of multiple tools often enhancing the accuracy of somatic SV detection [118]. For methylation detection from nanopore data, Nanopolish is commonly used, which groups CpGs located within 10 bp of each other (CpG units) and outputs a log-likelihood ratio (LLR) for methylation status [117].
Heterogeneity Quantification Methods
Cancer heterogeneity analysis requires specialized approaches to resolve subclonal populations and spatial architecture. For mutational heterogeneity, tools such as PyClone and SciClone can be used to cluster mutations based on their variant allele frequencies, inferring subclonal population structures [119]. Phylogenetic reconstruction methods, including LICHeE and Treeomics, enable the building of evolutionary trees representing the relationship between different subclones [119].
Spatial heterogeneity analysis incorporates multi-region sequencing data to map the geographic distribution of subclones within tumors. This approach has revealed that sarcomas, for instance, exhibit significant genomic heterogeneity, with studies identifying an average of 2.74 alterations per patient and potentially targetable mutations in 22.2% of cases [119]. The most frequently altered genes in sarcomas include TP53 (38%), RB1 (22%), and CDKN2A (14%), with different histological subtypes showing distinct mutation profiles [119].
Multi-omics integration approaches combine genomic, transcriptomic, and epigenomic data to provide a more comprehensive view of tumor heterogeneity. Methods such as non-negative matrix factorization (NMF) and integrative clustering (iCluster) can identify molecular subtypes that cut across traditional data types, revealing deeper biological insights into cancer heterogeneity [122].
Applications in Cancer Heterogeneity Research
Characterizing Heterogeneity Across Cancer Types
NGS platforms have been extensively applied to characterize heterogeneity across diverse cancer types. In soft tissue and bone sarcomas, genomic profiling using multiple NGS kits (FoundationOne, Tempus, OncoDEEP, and MI Profile) identified a total of 223 genomic alterations across 81 patients, with copy number amplifications (26.9%) and deletions (24.7%) being the most common alteration types [119]. This study demonstrated that NGS can reclassify diagnoses in some patients, highlighting its utility not only in therapeutic decision-making but also as a powerful diagnostic tool [119].
In lung cancer—the leading cause of cancer mortality worldwide—NGS-based molecular profiling has refined classification (e.g., NSCLC versus SCLC) and improved treatment strategies [16]. Similar advances are seen in breast, colorectal, and hematologic cancers, where NGS-based molecular characterization has guided the adoption of more effective, personalized therapies [16]. The identification of actionable mutations in genes such as EGFR, KRAS, and ALK enables targeted treatment selection, significantly improving outcomes in advanced malignancies [4] [16].
Liquid biopsy applications of NGS technologies represent a particularly promising approach for monitoring tumor heterogeneity over time. By sequencing cell-free DNA from blood samples, researchers can non-invasively track the evolution of tumor subclones and the emergence of treatment-resistant mutations, enabling dynamic adjustment of therapeutic strategies [16].
The Scientist's Toolkit: Essential Research Reagents
Table 3: Essential Research Reagents for NGS-based Heterogeneity Studies
| Reagent Category | Specific Examples | Function in Workflow |
|---|---|---|
| Nucleic Acid Extraction Kits | QIAamp DNA FFPE Tissue Kit [7], Quick-DNA Fecal/Soil Microbe Microprep Kit [121], Sputum DNA Isolation Kit [120] | Isolation of high-quality DNA from various sample types including FFPE tissue, microbiome samples, and respiratory specimens |
| Library Preparation Kits | Agilent SureSelectXT Target Enrichment [7], QIAseq 16S/ITS Region Panel [120], ONT 16S Barcoding Kit [120], SMRTbell Prep Kit [121] | Preparation of sequencing libraries with platform-specific adapters and barcodes for multiplexing |
| Target Enrichment Panels | SNUBH Pan-Cancer v2.0 Panel (544 genes) [7], FoundationOne, Tempus, OncoDEEP [119] | Selective capture of cancer-relevant genomic regions for focused sequencing |
| Quality Control Tools | Qubit dsDNA HS Assay Kit [7], Fragment Analyzer [121], Bioanalyzer [7] | Quantification and qualification of nucleic acids and libraries to ensure sequencing success |
| Sequencing Chemicals | Illumina NextSeq reagent kits, PacBio SMRTbell enzymes, ONT flow cells (R9.4, R10.4.1) [120] [118] [121] | Platform-specific consumables required to perform the sequencing reactions |
The benchmarking of NGS platforms for cancer heterogeneity studies reveals a complex landscape where each technology offers distinct advantages depending on the specific research question. Illumina platforms provide the highest base-level accuracy and are ideal for detecting single nucleotide variants and small indels with high confidence, making them well-suited for variant validation and large-scale cohort studies [16]. Oxford Nanopore Technologies excels in applications requiring ultra-long reads and real-time sequencing capability, particularly for resolving complex structural variants and epigenetic modifications [118] [117]. PacBio HiFi sequencing strikes a balance between read length and accuracy, making it particularly powerful for phased variant calling, fusion detection, and characterizing highly repetitive regions [116].
The future of NGS in cancer heterogeneity research will likely involve integrated approaches that leverage the strengths of multiple platforms. For instance, using Illumina for high-confidence base calling, complemented by long-read technologies for resolving complex genomic regions and structural variants [118]. The emergence of third-generation sequencing technologies with improved accuracy and throughput promises to further enhance our ability to decipher cancer heterogeneity at unprecedented resolution [16].
Advancements in single-cell sequencing and spatial transcriptomics represent the next frontier in cancer heterogeneity studies, enabling the characterization of individual cells within their tissue context [16]. These technologies, combined with the continuous improvement of NGS platforms and analytical methods, will continue to drive innovations in precision oncology, ultimately leading to more effective, personalized cancer therapies tailored to the unique genetic landscape of each patient's tumor [4] [16].
Conclusion
Next-generation sequencing has unequivocally established itself as the cornerstone technology for dissecting cancer heterogeneity, providing the resolution needed to guide precision oncology from research to clinical practice. The synthesis of insights from foundational genomics, advanced methodologies like single-cell and liquid biopsy, rigorous troubleshooting, and robust validation frameworks demonstrates that comprehensive genomic profiling is essential for understanding drug resistance, monitoring disease evolution, and identifying novel therapeutic targets. Future progress hinges on the integration of artificial intelligence for data analysis, the widespread adoption of multi-omics and spatial transcriptomics, continued refinement of liquid biopsy applications, and a concerted global effort to standardize workflows and improve accessibility. For researchers and drug developers, embracing these evolving NGS technologies is paramount to designing more effective, personalized cancer therapies and ultimately improving patient outcomes in the face of tumor complexity.
References
- 1. Intratumoral heterogeneity and drug resistance in cancer [https://cancerci.biomedcentral.com/articles/10.1186/s12935-025-03734-w]
- 2. Organoids as Next-Generation Models for Tumor ... [https://www.mdpi.com/2674-1172/4/4/23]
- 3. Tumor biomarkers for diagnosis, prognosis and targeted ... [https://www.nature.com/articles/s41392-024-01823-2]
- 4. Next-generation sequencing in cancer diagnosis and ... [https://pmc.ncbi.nlm.nih.gov/articles/PMC12009796/]
- 5. PMC Search Update - PubMed Central - NIH [https://pmc.ncbi.nlm.nih.gov/articles/PMC12367963/]
- 6. Next generation DNA Sequencing data analysis and its ... [https://www.sciencedirect.com/science/article/abs/pii/S034403382500473X]
- 7. Clinical implementation of next-generation sequencing ... [https://www.nature.com/articles/s41598-024-84909-9]
- 8. Characterization of Breast Cancer Intra-Tumor ... [https://www.mdpi.com/2072-6694/16/22/3849]
- 9. Pan-Cancer Analysis | Tumor type-agnostic studies using ... [https://www.illumina.com/areas-of-interest/cancer/clinical-cancer-research/somatic-mutations/pan-cancer.html]
- 10. Comprehensive Genomic Profiling (CGP) | Cancer ... [https://www.illumina.com/areas-of-interest/cancer/ngs-in-oncology/cgp.html]
- 11. Next-Generation Sequencing: A Review of Its ... [https://www.mdpi.com/2075-4418/15/19/2425]
- 12. Next-Generation Sequencing Technology: Current Trends ... [https://pmc.ncbi.nlm.nih.gov/articles/PMC10376292/]
- 13. Analytical validation and implementation of a pan cancer next ... [https://pmc.ncbi.nlm.nih.gov/articles/PMC9947346/]
- 14. Why Comprehensive Genomic Profiling? [https://www.foundationmedicine.com/resource/why-comprehensive-genomic-profiling]
- 15. Tumor diagnosis recharacterization enabled by ... [https://www.nature.com/articles/s41698-025-00942-5]
- 16. Next-Generation Sequencing: A Review of Its Transformative ... [https://pmc.ncbi.nlm.nih.gov/articles/PMC12523276/]
- 17. Clonal evolution and therapy resistance in the era of ... [https://www.sciencedirect.com/science/article/pii/S1044579X25001257]
- 18. Application of next-generation sequencing in clinical ... [https://pmc.ncbi.nlm.nih.gov/articles/PMC3777453/]
- 19. Complex de novo structural variants are an underestimated ... [https://www.nature.com/articles/s41467-025-64722-2]
- 20. NGS Basics for Cancer Research [https://www.thermofisher.com/us/en/home/life-science/sequencing/sequencing-learning-center/next-generation-sequencing-information/cancer-research/basics.html]
- 21. A targeted next-generation sequencing panel for ... [https://www.nature.com/articles/s41598-025-08039-6]
- 22. Identification of Driver Mutations and Risk Stratification in ... [https://pubmed.ncbi.nlm.nih.gov/40282516/]
- 23. MyClone: rapid and precise reconstruction of clonal ... [https://pubmed.ncbi.nlm.nih.gov/41062923/]
- 24. Applications of NGS [https://www.illumina.com/science/technology/next-generation-sequencing/beginners/applications.html]
- 25. Next-generation sequencing: 2025 Revolution [https://lifebit.ai/blog/next-generation-sequencing/]
- 26. Next-Generation Sequencers vs. Sanger ... [https://www.labx.com/resources/next-generation-sequencers-vs-sanger-sequencers-key-differences/5597]
- 27. Next-Generation Sequencing (NGS) | Explore the technology [https://www.illumina.com/science/technology/next-generation-sequencing.html]
- 28. Next-Generation Sequencing (NGS) vs. Sanger ... [https://www.labmanager.com/next-generation-sequencing-ngs-vs-sanger-sequencing-which-dna-sequencing-method-is-right-for-you-33659]
- 29. 2025 Trends: NGS [https://www.genengnews.com/topics/genome-editing/2025-trends-ngs/]
- 30. Next-generation sequencing impact on cancer care [https://www.frontiersin.org/journals/genetics/articles/10.3389/fgene.2024.1420190/full]
- 31. Characterizing genetic intra-tumor heterogeneity across 2,658 ... [https://pmc.ncbi.nlm.nih.gov/articles/PMC8054914/]
- 32. Classification and Prognostic Stratification Based on Genomic ... [https://pmc.ncbi.nlm.nih.gov/articles/PMC11640283/]
- 33. Prognostic molecular subtype reveals the heterogeneity of ... [https://www.nature.com/articles/s41598-025-96686-0]
- 34. Transcriptomic-Based Classification Identifies Prognostic ... [https://www.mdpi.com/2072-6694/17/17/2861]
- 35. Dissecting Melanoma Ecosystem Heterogeneity from ... [https://www.mdpi.com/1422-0067/26/20/9956]
- 36. Single-cell and spatial transcriptomics integration [https://pubmed.ncbi.nlm.nih.gov/41112263/?utm_source=FeedFetcher&utm_medium=rss&utm_campaign=None&utm_content=1tcbYKHhYJM1v-GMUKNZlesugx3JrapdWc_qFV9O1fWQVmjE7f&fc=None&ff=20251022150930&v=2.18.0.post22+67771e2]
- 37. Single-cell and spatial transcriptomics integration [https://www.frontiersin.org/journals/immunology/articles/10.3389/fimmu.2025.1649468/full]
- 38. Best Practices for Analysis of 10x Genomics Single Cell ... [https://www.10xgenomics.com/analysis-guides/best-practices-analysis-10x-single-cell-rnaseq-data]
- 39. Characterization of cancer genomic heterogeneity by next ... [https://pmc.ncbi.nlm.nih.gov/articles/PMC6333046/]
- 40. Liquid biopsy in cancer: current status, challenges and ... [https://www.nature.com/articles/s41392-024-02021-w]
- 41. Drug Discovery News — ctDNA monitoring is providing a ... [https://friendsofcancerresearch.org/news/drug-discovery-news-ctdna-monitoring-is-providing-a-smarter-way-to-track-and-treat-cancer/]
- 42. Integrating next-generation sequencing into clinical oncology [https://www.sciencedirect.com/science/article/pii/S2059702920325217]
- 43. Liquid biopsy – a narrative review with an update on current ... [https://pmc.ncbi.nlm.nih.gov/articles/PMC12333414/]
- 44. Analytical and clinical validation of a custom 15-gene next ... [https://journals.plos.org/plosone/article?id=10.1371/journal.pone.0276161]
- 45. Analytical and clinical validation of a NGS panel in ... [https://pmc.ncbi.nlm.nih.gov/articles/PMC11464656/]
- 46. Analytical Validation of a Pan-Cancer NGS Assay for In- ... [https://www.sciencedirect.com/science/article/pii/S152515782500220X]
- 47. Analytical and Clinical Validation of a Highly Sensitive ... [https://www.e-crt.org/journal/view.php?number=3579]
- 48. Tumor heterogeneity: next-generation sequencing enhances ... [https://genomebiology.biomedcentral.com/articles/10.1186/s13059-014-0463-6]
- 49. Paired Comparison of Whole Genome Sequencing and ... [https://ar.iiarjournals.org/content/45/2/605]
- 50. Whole Genome Sequencing in Cancer [https://frontlinegenomics.com/whole-genome-sequencing-in-cancer/]
- 51. Whole genome sequencing improves tissue-of-origin ... [https://www.nature.com/articles/s41467-025-59661-x]
- 52. Augmenting precision medicine via targeted RNA-Seq ... [https://www.nature.com/articles/s41698-025-00993-8]
- 53. Navigating Cancer Complexity: Integrative Multi-Omics ... [https://pmc.ncbi.nlm.nih.gov/articles/PMC12553891/]
- 54. Integration of multi-omics approaches in exploring intra ... [https://pmc.ncbi.nlm.nih.gov/articles/PMC12395700/]
- 55. Single-cell multi-omics in cancer immunotherapy: from tumor ... [https://pmc.ncbi.nlm.nih.gov/articles/PMC12376342/]
- 56. Methods for multi-omic data integration in cancer research [https://www.frontiersin.org/journals/genetics/articles/10.3389/fgene.2024.1425456/full]
- 57. Adaptive multi-omics integration framework for breast ... [https://www.nature.com/articles/s41598-025-22202-z]
- 58. Methods for multi-omic data integration in cancer research [https://pubmed.ncbi.nlm.nih.gov/39364009/]
- 59. Cancer Multi-Omics Database for Machine Learning [https://www.nature.com/articles/s41597-025-05235-x]
- 60. Novel multi-omics analysis revealing metabolic ... [https://www.sciencedirect.com/science/article/pii/S1936523325001755]
- 61. Integrative multi-omics and machine learning reveal critical ... [https://www.nature.com/articles/s41698-025-01027-z]
- 62. NGS Approaches in Clinical Diagnostics: From Workflow to ... [https://www.mdpi.com/1422-0067/26/19/9597]
- 63. Analytical Validation of the Next-Generation Sequencing ... [https://www.sciencedirect.com/science/article/pii/S1525157816302318]
- 64. Genomic actionability and matched targeted therapy in a ... [https://pmc.ncbi.nlm.nih.gov/articles/PMC12639418/]
- 65. Recommendations for the use of next-generation ... [https://www.sciencedirect.com/science/article/pii/S092375342400111X]
- 66. Genomically matched therapy in advanced solid tumors [https://pmc.ncbi.nlm.nih.gov/articles/PMC12532583/]
- 67. Dissecting Tumor Heterogeneity by Liquid Biopsy—A ... [https://pmc.ncbi.nlm.nih.gov/articles/PMC12347833/]
- 68. 综述:液体活检在癌症诊疗中的突破与挑战:现状、问题与展望 [https://www.ebiotrade.com/newsf/2025-2/20250213044216399.htm]
- 69. Currently favored sampling practices for tumor sequencing ... [https://www.nature.com/articles/s41598-020-71382-3]
- 70. Progress of Liquid Biopsy in Early Diagnosis of Lung Cancer [https://pmc.ncbi.nlm.nih.gov/articles/PMC6105353/]
- 71. 使用NGS 进行液体活检分析| Thermo Fisher Scientific - CN [https://www.thermofisher.cn/cn/zh/home/life-science/cancer-research/cancer-genomics/liquid-biopsy-cancer-research-applications/liquid-biopsy-analysis-ngs.html]
- 72. Chinese Expert Consensus on Next Generation Sequencing ... [https://pmc.ncbi.nlm.nih.gov/articles/PMC7519957/]
- 73. Next-Generation Sequencing and Image-Guided Tissue ... [https://www.sciencedirect.com/science/article/pii/S1051044323002245]
- 74. Detailed evaluation of cancer sequencing pipelines in ... [https://pmc.ncbi.nlm.nih.gov/articles/PMC8068765/]
- 75. Next Generation Sequencing Application in Cancer ... [https://www.mdpi.com/journal/cancers/special_issues/NGS_Application]
- 76. Summoning insights: NGS variant calling best practice [https://www.ogt.com/ca/resources/ngs-resources-and-support/ngs-resources/summoning-insights-ngs-variant-calling-best-practices/]
- 77. Validation of genetic variants from NGS data using deep ... [https://bmcbioinformatics.biomedcentral.com/articles/10.1186/s12859-023-05255-7]
- 78. Variant calling from RNA-Seq data reveals allele-specific ... [https://www.nature.com/articles/s43856-025-00901-y]
- 79. in the era of high-throughput... Variants of uncertain significance [https://jeccr.biomedcentral.com/articles/10.1186/s13046-020-01554-6]
- 80. The Frequency and Reclassification of Variants Uncertain Significance [https://www.dovepress.com/the-frequency-and-reclassification-of-variants-uncertain-significance--peer-reviewed-fulltext-article-CMAR]
- 81. Standards and Guidelines for the Interpretation of Sequence ... [https://pmc.ncbi.nlm.nih.gov/articles/PMC4544753/]
- 82. Reclassification of VUS in BRCA1 and BRCA2 using the ... [https://www.sciencedirect.com/science/article/pii/S2949774424011075]
- 83. A Practical Guide to Clinical Variant Interpretation [https://www.euformatics.com/blog-post/a-practical-guide-to-clinical-variant-interpretation]
- 84. Frontiers | Integrating next-generation sequencing and artificial... [https://www.frontiersin.org/journals/oncology/articles/10.3389/fonc.2025.1568205/full]
- 85. Recommendations for bioinformatics in clinical practice [https://genomemedicine.biomedcentral.com/articles/10.1186/s13073-025-01543-4]
- 86. Critical assessment of variant prioritization methods for rare ... [https://pmc.ncbi.nlm.nih.gov/articles/PMC10418577/]
- 87. Pathogenic and likely pathogenic variant prevalence among the first 10... [https://www.nature.com/articles/gim2015166?error=cookies_not_supported&code=ccbd228f-a132-45e9-ba0d-3eb2d2287667]
- 88. Barriers and facilitators to next-generation sequencing use in ... [https://pmc.ncbi.nlm.nih.gov/articles/PMC11572137/]
- 89. Assessing the Cost-Effectiveness of Next-Generation ... [https://www.sciencedirect.com/science/article/pii/S109830152402357X]
- 90. Costs of biomarker testing in advanced non‐small cell lung ... [https://pmc.ncbi.nlm.nih.gov/articles/PMC11886603/]
- 91. Evaluation of turnaround times and performance of in- ... [https://pubmed.ncbi.nlm.nih.gov/40328657/]
- 92. Potential barriers to implementation of next-generation ... [https://pubmed.ncbi.nlm.nih.gov/39606845/]
- 93. Next Generation Sequencing Platform: Ultimate Guide 2025 [https://lifebit.ai/blog/next-generation-sequencing-platform/]
- 94. Next Generation Sequencing (NGS) Market Poised to Hit ... [https://www.prnewswire.com/news-releases/next-generation-sequencing-ngs-market-poised-to-hit-42-25-billion-by-2033-key-drivers-behind-the-surge--latest-study-by-grand-view-research-inc-302614298.html]
- 95. Concordance between genomic alterations assessed by next ... [https://pmc.ncbi.nlm.nih.gov/articles/PMC5323161/]
- 96. Heterogeneity in Cancer [https://www.mdpi.com/2072-6694/17/3/441]
- 97. Evaluating the analytical validity of circulating tumor DNA ... [https://pmc.ncbi.nlm.nih.gov/articles/PMC8434938/]
- 98. Concordance between whole exome sequencing of ... [https://journals.plos.org/plosone/article?id=10.1371/journal.pone.0292879]
- 99. Guidelines for Validation of Next-Generation Sequencing– ... [https://pmc.ncbi.nlm.nih.gov/articles/PMC6941185/]
- 100. FDA-Reviewed Validation Protocols for Liquid Biopsy [https://www.bloodpac.org/publications/press-release-bloodpac-publishes-fda-reviewed-validation-protocols-for-liquid-biopsy]
- 101. Analytical validation (accuracy, reproducibility, limit of ... [https://journals.plos.org/plosone/article?id=10.1371/journal.pone.0329697]
- 102. Impact and Reproducibility of In-House Targeted Next ... [https://www.sciencedirect.com/science/article/pii/S152515782500042X]
- 103. Technical Validation of a Next-Generation Sequencing ... [https://www.sciencedirect.com/science/article/pii/S1525157816000490]
- 104. Development of an evidence-based algorithm that ... [https://www.nature.com/articles/s41436-018-0016-6]
- 105. Automated NGS Workflows for Cancer Research | IDT [http://eupages.idtdna.com/pages/about/news/2025/11/12/integrated-dna-technologies-and-beckman-coulter-life-sciences-partner-to-advance-cancer-research-through-automated-ngs-workflows]
- 106. ACMG clinical laboratory standards for next-generation ... [https://pmc.ncbi.nlm.nih.gov/articles/PMC4098820/]
- 107. 2025 and Beyond: The Future of Genomic Data Analysis ... [https://blog.crownbio.com/2025-and-beyond-the-future-of-genomic-data-analysis-and-innovations-in-genomics-services]
- 108. DNA Sequencing: How to Choose the Right Technology [https://frontlinegenomics.com/dna-sequencing-how-to-choose-the-right-technology/]
- 109. Comparison of next-generation sequencing with traditional ... [https://pmc.ncbi.nlm.nih.gov/articles/PMC9794229/]
- 110. Comparison of classic Sanger and next generation ... [https://link.springer.com/article/10.1007/s00414-025-03603-1]
- 111. Advances in personalized medicine: translating genomic ... [https://pmc.ncbi.nlm.nih.gov/articles/PMC12106117/]
- 112. Integrating comprehensive genomic profiling in the ... [https://www.sciencedirect.com/science/article/pii/S2319417025000253]
- 113. Usefulness and real-world outcomes of next generation ... [https://pmc.ncbi.nlm.nih.gov/articles/PMC10248077/]
- 114. Real-world application of targeted next-generation ... [https://bmccancer.biomedcentral.com/articles/10.1186/s12885-025-14016-z]
- 115. Effectiveness of next-generation sequencing for patients ... [https://www.sciencedirect.com/science/article/pii/S2059702923014412]
- 116. Comparing long-read sequencing technologies [https://www.pacb.com/blog/sequencing-101-comparing-long-read-sequencing-technologies/]
- 117. A comparison of methods for detecting DNA methylation from ... [https://genomebiology.biomedcentral.com/articles/10.1186/s13059-024-03207-9]
- 118. Benchmarking long-read structural variant calling tools and ... [https://www.nature.com/articles/s41598-025-92750-x]
- 119. Next-generation sequencing-based genomic profiling of ... [https://www.frontiersin.org/journals/oncology/articles/10.3389/fonc.2025.1627452/full]
- 120. Comparative analysis of illumina and oxford nanopore ... [https://www.nature.com/articles/s41598-025-18768-3]
- 121. Comparative evaluation of sequencing platforms [https://pmc.ncbi.nlm.nih.gov/articles/PMC12365774/]
- 122. Exploring the Metabolic Heterogeneity of Cancers [https://www.mdpi.com/2075-4426/11/6/496]