Comprehensive Pharmacophore-Based Virtual Screening Protocol for Kinase Inhibitors: From AI-Driven Design to Experimental Validation
This article provides a comprehensive guide to pharmacophore-based virtual screening (PBVS) for kinase inhibitor discovery, a critical methodology for addressing challenges like selectivity and resistance in oncology drug development.
Comprehensive Pharmacophore-Based Virtual Screening Protocol for Kinase Inhibitors: From AI-Driven Design to Experimental Validation
Abstract
This article provides a comprehensive guide to pharmacophore-based virtual screening (PBVS) for kinase inhibitor discovery, a critical methodology for addressing challenges like selectivity and resistance in oncology drug development. We detail the foundational principles of pharmacophore modeling for kinases, explore established and cutting-edge AI-driven methodological workflows, and offer practical troubleshooting strategies to optimize screening performance. The protocol emphasizes rigorous validation through molecular dynamics, free energy calculations, and biological assays, showcasing successful applications against targets like c-Src and Janus kinases. Aimed at researchers and drug development professionals, this resource synthesizes current best practices and emerging trends to accelerate the identification of novel, potent kinase inhibitors.
Understanding Pharmacophores and Kinase Targets: The Essential Foundation
In the field of computer-aided drug design (CADD), a pharmacophore is universally defined as "the ensemble of steric and electronic features that is necessary to ensure the optimal supramolecular interactions with a specific biological target structure and to trigger (or to block) its biological response" [1] [2]. This abstract model represents the essential molecular interaction capabilities of a compound, rather than a specific molecular framework or functional group. For kinase targets, this concept is particularly powerful because it facilitates the identification of novel inhibitors that share key interaction patterns without being constrained by specific chemical scaffolds, a process known as scaffold hopping [1]. The development of a kinase pharmacophore model enables researchers to postulate the "essence" of structure-activity relationships gained from studying series of active and inactive molecules, providing a critical tool for virtual screening and lead optimization in kinase drug discovery programs [1].
Kinases represent one of the major drug target classes amenable to small molecule inhibition. Most kinase inhibitors target the conserved ATP-binding site, yet achieving selectivity among the over 500 human kinase domains remains a significant challenge. Pharmacophore-based approaches address this challenge by mapping the common interaction features of diverse inhibitors across different kinase targets, providing a structural blueprint for designing selective compounds [3]. The retrospective analysis of chemical structures and scaffolds of drug molecules has led to the identification of structural motifs often associated with biological activity, sometimes called "privileged structures" [4]. However, it is crucial to distinguish these from pharmacophores; while privileged structures represent scaffolds that confer activity toward multiple targets, a pharmacophore represents the common molecular interaction features of a set of molecules toward their receptor [4].
Core Pharmacophore Features for Kinase Inhibition
Fundamental Steric and Electronic Features
Kinase pharmacophore models are built from a set of fundamental chemical features that mediate interactions between inhibitors and the kinase binding pocket. These features represent essential interaction points that a ligand must possess to bind effectively to the kinase target. The most relevant pharmacophore features for kinase inhibition include [1] [5]:
- Hydrogen Bond Acceptors (HBA): Atoms or groups that can accept hydrogen bonds, typically represented as vectors or spheres. Common examples in kinase inhibitors include carbonyl oxygen atoms and nitrogen atoms in heterocyclic rings.
- Hydrogen Bond Donors (HBD): Groups that can donate hydrogen bonds, such as amine groups and amide NH moieties.
- Hydrophobic Features (H): Non-polar regions that participate in van der Waals interactions, often represented as spheres. These include alkyl groups, alicycles, and weakly or non-polar aromatic rings.
- Aromatic Rings (AR): Planar ring systems that can engage in π-π stacking or cation-π interactions with tyrosine, phenylalanine, or histidine residues in the kinase binding site.
- Positive Ionizable Groups (PI): Features that can carry a positive charge under physiological conditions, such as protonated amines.
- Negative Ionizable Groups (NI): Features that can carry a negative charge, such as carboxylates.
Table 1: Core Pharmacophore Features for Kinase Inhibitors
| Feature Type | Geometric Representation | Interaction Types | Structural Examples in Kinase Inhibitors |
|---|---|---|---|
| Hydrogen Bond Acceptor (HBA) | Vector or Sphere | Hydrogen Bonding | Carbonyl oxygen, pyridine nitrogen, ether oxygen |
| Hydrogen Bond Donor (HBD) | Vector or Sphere | Hydrogen Bonding | Amine groups, amide NH, hydroxyl groups |
| Hydrophobic (H) | Sphere | Hydrophobic Contact | tert-Butyl groups, alicyclic rings, aromatic rings |
| Aromatic (AR) | Plane or Sphere | π-Stacking, Cation-π | Phenyl, pyridine, indole rings |
| Positive Ionizable (PI) | Sphere | Ionic, Cation-π | Protonated amines, ammonium ions |
| Negative Ionizable (NI) | Sphere | Ionic | Carboxylates, tetrazoles |
Kinase-Specific Interaction Patterns
Analysis of kinase-inhibitor complexes has revealed conserved interaction patterns that are critical for high-affinity binding. McGregor et al. explored the features of protein-ligand interactions for 220 kinase crystal structures from the Protein Data Bank, creating a comprehensive "pharmacophore map" that shows interactions made by all ligands with their receptors simultaneously [3]. This map provides invaluable insight for the design of kinase screening sets and combinatorial libraries. Key interaction patterns include:
- The hinge region interactions, where inhibitors form one to three hydrogen bonds with the backbone atoms of the kinase hinge region, a conserved structural element connecting the N-terminal and C-terminal lobes of the kinase domain.
- Gatekeeper residue interactions, where inhibitors form van der Waals contacts with the gatekeeper residue, which controls access to a hydrophobic pocket deep in the ATP-binding site.
- DFG-motif targeting, particularly for Type II inhibitors that bind to the inactive "DFG-out" conformation of kinases, engaging in specific interactions with the aspartate and phenylalanine residues of the DFG motif.
- Solvent-front interactions, where inhibitors contact residues on the solvent-exposed surface of the kinase, often contributing to selectivity profiles.
Quantitative Analysis of Kinase Pharmacophore Features
Feature Frequency and Spatial Distribution
Analysis of known kinase inhibitors reveals distinct patterns in the occurrence and spatial arrangement of pharmacophore features. The kinase pharmacophore map derived from 220 kinase crystal structures provides quantitative data on the prevalence of different interaction types and their geometric relationships [3]. This data enables the development of scoring algorithms that can identify inhibitor poses close to crystal structure configurations using only 2D chemical structure as input [3].
Table 2: Quantitative Analysis of Pharmacophore Features in Kinase Inhibitors
| Pharmacophore Feature | Frequency in Kinase Inhibitors (%) | Typical Distance Ranges (Å) | Key Kinase Residues Interacted With |
|---|---|---|---|
| H-bond Acceptor 1 | ~95% | 2.8-3.2 | Hinge region backbone NH |
| H-bond Acceptor 2 | ~65% | 2.9-3.3 | Hinge region backbone NH |
| H-bond Donor | ~45% | 2.7-3.1 | Hinge region backbone C=O |
| Hydrophobic Center 1 | ~85% | 3.5-4.5 | Gatekeeper residue |
| Hydrophobic Center 2 | ~75% | 4.0-5.0 | DFG-phenylalanine |
| Aromatic Center | ~70% | 3.8-5.0 | Catalytic lysine, other aromatic residues |
Selectivity-Determining Features
Achieving kinase selectivity remains a central challenge in inhibitor design. The pharmacophore map approach has identified key features that contribute to selectivity among kinase targets. Three crucial mutations within the ligand binding site create distinct microenvironments that can be exploited for selective inhibitor design: Phe208/Ile199 (MAO-A/MAO-B), Phe173/Leu164, and Ile335/Tyr326 [6]. These residue differences, combined with variations in cavity shape, provide a roadmap for discovering selective inhibitors [6].
The spatial arrangement of exclusion volumes—regions representing forbidden space where the ligand cannot occupy due to steric clashes with the receptor—also plays a critical role in determining selectivity. By incorporating shape constraints derived from specific kinase structures, pharmacophore models can effectively discriminate between closely related kinase targets [1].
Experimental Protocols for Kinase Pharmacophore Modeling
Structure-Based Pharmacophore Modeling Protocol
Structure-based pharmacophore modeling utilizes the three-dimensional structure of kinase targets, often obtained from X-ray crystallography or homology modeling, to derive essential interaction features.
Protocol: Structure-Based Kinase Pharmacophore Generation
Protein Structure Preparation
- Obtain the 3D structure of the kinase target from the Protein Data Bank (PDB) or through homology modeling [5].
- Prepare the protein structure by adding hydrogen atoms, assigning correct protonation states, and optimizing hydrogen bonding networks using tools like MOE or Discovery Studio.
- Resolve any missing residues or atoms through loop modeling or energy minimization.
Binding Site Characterization
- Identify the ligand-binding site using methods such as GRID or LUDI, which detect potential interaction sites based on energetic, geometric, or evolutionary properties [5].
- For kinases, the ATP-binding site is typically the primary target, but allosteric sites may also be considered.
Interaction Feature Generation
- Analyze the binding site to identify regions complementary to pharmacophore features using software such as LigandScout or Phase.
- Generate potential features including hydrogen bond acceptors/donors, hydrophobic areas, and charged/aromatic interaction sites.
- For complexes with bound ligands, derive features directly from observed protein-ligand interactions.
Feature Selection and Model Refinement
- Select features most critical for ligand binding by considering conserved interactions across multiple kinase structures.
- Incorporate exclusion volumes to represent steric constraints of the binding pocket.
- Validate the model by screening known active and inactive compounds to optimize selectivity.
Ligand-Based Pharmacophore Modeling Protocol
When 3D structures of the kinase target are unavailable, ligand-based approaches can generate pharmacophore models using known active compounds.
Protocol: Ligand-Based Kinase Pharmacophore Generation
Compound Selection and Conformational Analysis
- Curate a diverse set of known active kinase inhibitors with measured activity data (IC₅₀ or Kᵢ values) from databases like ChEMBL [7].
- Include inactive compounds to enhance model selectivity.
- Generate representative conformational ensembles for each compound using systematic or stochastic methods.
Common Pharmacophore Identification
- Identify common spatial arrangements of pharmacophore features across active compounds using algorithms such as HipHop or HypoGen [2].
- Use software tools like Phase or MOE to generate multiple pharmacophore hypotheses.
Model Validation and Optimization
- Validate models by screening against test sets of active and inactive compounds.
- Optimize model parameters to maximize enrichment of active compounds.
- Select the best model based on statistical metrics and chemical intuition.
Machine Learning-Accelerated Pharmacophore Screening
Modern approaches integrate machine learning with pharmacophore-based screening to accelerate virtual screening of large compound libraries.
Protocol: ML-Enhanced Pharmacophore Screening
Training Data Generation
- Perform molecular docking of a diverse compound set against the kinase target to generate docking scores.
- Calculate molecular descriptors and fingerprints for all compounds.
Model Training and Validation
- Train machine learning models (e.g., random forest, neural networks) to predict docking scores from molecular descriptors.
- Validate model performance using cross-validation and external test sets.
Pharmacophore-Constrained Screening
- Apply pharmacophore filters to large compound libraries (e.g., ZINC) to create focused subsets.
- Use trained ML models to rapidly predict docking scores for pharmacophore-matched compounds.
- Select top-ranking compounds for synthesis and experimental validation.
This approach has been shown to accelerate binding energy predictions by up to 1000 times compared to classical docking-based screening while maintaining high accuracy [6].
Research Reagent Solutions for Kinase Pharmacophore Studies
Table 3: Essential Research Reagents and Software Tools
| Tool/Reagent | Type/Category | Primary Function | Application in Kinase Pharmacophore Studies |
|---|---|---|---|
| LigandScout | Software | Structure-based & ligand-based pharmacophore modeling | Advanced pharmacophore model generation with intuitive visualization [8] |
| MOE | Software | Molecular modeling suite | Comprehensive pharmacophore modeling, docking, and QSAR analysis [2] |
| Phase | Software | Pharmacophore modeling platform | Ligand-based pharmacophore generation and virtual screening [2] [8] |
| ELIXIR-A | Software | Pharmacophore refinement tool | Alignment and refinement of pharmacophore models from multiple ligands/receptors [8] |
| ZINC Database | Compound Library | Database of commercially available compounds | Source of compounds for virtual screening [6] |
| ChEMBL Database | Bioactivity Database | Database of bioactive molecules | Source of activity data for ligand-based modeling [7] |
| Protein Data Bank | Structure Database | Repository of 3D protein structures | Source of kinase structures for structure-based modeling [5] |
| Smina | Software | Molecular docking | Docking scoring function for structure-based pharmacophore validation [6] |
Implementation in Virtual Screening Workflow
The integration of pharmacophore modeling into a comprehensive virtual screening workflow for kinase inhibitors involves multiple stages that combine both structure-based and ligand-based approaches.
Integrated Virtual Screening Protocol
Target Analysis and Data Collection
- Gather 3D structures of the kinase target from PDB or through homology modeling.
- Collect known active and inactive compounds from databases like ChEMBL.
Multi-Method Pharmacophore Model Generation
- Develop both structure-based and ligand-based pharmacophore models.
- Use tools like ELIXIR-A to align and refine models from different sources [8].
Hierarchical Screening Approach
- Apply pharmacophore filters as a first rapid screening step to reduce library size.
- Use machine learning models to predict docking scores for pharmacophore-matched compounds [6].
- Perform molecular docking on top-ranking compounds for detailed binding pose analysis.
Experimental Validation
- Select top compounds for synthesis and biochemical testing.
- Iteratively refine pharmacophore models based on experimental results.
This integrated approach leverages the strengths of pharmacophore modeling for rapid screening while incorporating machine learning and docking for enhanced prediction accuracy, creating an efficient pipeline for identifying novel kinase inhibitors [6].
Protein kinases constitute one of the largest protein families in the human genome, with approximately 518 members identified to date [9]. These enzymes catalyze the transfer of phosphate groups from adenosine triphosphate (ATP) to specific substrates, thereby regulating critical cellular processes including signal transduction, cell cycle progression, differentiation, metabolism, and apoptosis [9] [10]. The precise control of kinase activity is crucial for cellular homeostasis, and dysregulation due to mutations, overexpression, or abnormal signaling contributes to a range of human diseases, particularly cancer [10]. Nearly 30 tumor suppressor genes and over 100 oncogenes are protein kinases, underscoring their pivotal roles in cancer biology [10].
The development of kinase-targeted therapeutics represents a landmark achievement in molecular medicine. Since the approval of imatinib in 2001, the first molecular-targeted drug for cancer treatment, kinase inhibitors have transformed oncology treatment paradigms [11]. Over the past two decades, the FDA has approved more than 70 small molecule kinase inhibitors, with numerous others in various stages of clinical development [11] [9]. Despite these successes, developing selective kinase inhibitors remains challenging due to structural conservation within the kinase family and the evolution of resistance mechanisms [11] [10].
Structural Basis of Kinase Inhibition Challenges
Conserved Architecture of the Kinase Domain
The high degree of structural conservation among protein kinases presents the fundamental challenge for selective inhibitor design. The characteristic architecture of the kinase catalytic domain consists of a small amino-terminal N-lobe and a large carboxy-terminal C-lobe connected by a hinge region [9] [10]. Table 1 summarizes the key structural elements and their functional roles.
Table 1: Key Structural Elements of the Kinase Catalytic Domain
| Structural Element | Location | Functional Role | Conservation Challenge |
|---|---|---|---|
| Hinge Region | Connects N-lobe and C-lobe | Mediates hydrogen bonding with ATP adenine ring | High sequence conservation limits selectivity |
| Glycine-rich Loop (P-loop) | N-lobe (between β1-β2) | Folds over nucleotide; contacts phosphate groups | GxGxxG motif highly conserved across kinases |
| Catalytic Loop | C-lobe | Contains HRD motif essential for phosphotransfer | HRD motif nearly universal in protein kinases |
| Activation Loop | C-lobe | Begins with DFG motif; regulates kinase activity | DFG motif present in most protein kinases |
| αC-Helix | N-lobe | Adopts "in" or "out" conformation for activation | Structural flexibility complicates drug design |
The ATP-binding pocket, where the majority of kinase inhibitors bind, is particularly conserved across the kinome [11] [9]. This pocket contains a hydrophobic region that accommodates the adenine ring of ATP, with key hydrogen bonds forming between the adenine and the hinge region backbone [10]. The structural similarity of ATP-binding pockets among human kinases has forced drug developers to search for alternative strategies for developing selective inhibitors [10].
Classification of Kinase Inhibitor Binding Modes
Kinase inhibitors are categorized based on their binding mechanisms and interaction sites within the kinase domain. Table 2 outlines the primary classes of kinase inhibitors and their characteristics.
Table 2: Classification of Kinase Inhibitors by Binding Mechanism
| Inhibitor Type | Binding Site | Mechanism of Action | Selectivity Profile | Representative Examples |
|---|---|---|---|---|
| Type I | ATP-binding pocket (active conformation) | Competes directly with ATP; targets active DFG-in conformation | Lower selectivity due to conserved ATP pocket | Imatinib, Gefitinib |
| Type II | ATP-binding pocket (inactive conformation) | Binds adjacent hydrophobic pocket; targets inactive DFG-out conformation | Moderate selectivity from unique inactive states | Sorafenib, Ponatinib |
| Type III (Allosteric) | Site distal to ATP pocket | Induces conformational changes; non-competitive with ATP | Higher selectivity through targeting unique regions | Trametinib |
| Type IV (Substrate-competitive) | Substrate binding site | Competes with protein substrate rather than ATP | Potentially high selectivity | Under investigation |
| Covalent Inhibitors | ATP pocket with cysteine targeting | Forms irreversible covalent bond with nucleophilic cysteine | High selectivity if cysteine unique to target | Ibrutinib |
The pursuit of Type III and IV inhibitors, along with covalent inhibition strategies, represents promising approaches to overcome the selectivity challenges inherent to ATP-competitive compounds [11] [10]. Allosteric inhibitors that bind to sites other than the ATP pocket can achieve greater specificity by exploiting structural differences outside the conserved catalytic cleft [10].
Computational Approaches for Selective Kinase Inhibitor Design
Pharmacophore-Based Virtual Screening Protocol
Pharmacophore-based virtual screening (PBVS) has emerged as a powerful ligand-based strategy for identifying novel kinase inhibitors with enhanced selectivity profiles [12] [13]. This approach defines the essential molecular features necessary for biological activity, providing a template for screening compound libraries. The following protocol outlines a comprehensive PBVS workflow for kinase inhibitor discovery.
Protocol 1: Pharmacophore-Based Virtual Screening for Kinase Inhibitors
Step 1: Pharmacophore Model Generation
- Reference Ligand Selection: Identify high-affinity, selective kinase inhibitors with known binding modes from structural biology data or literature. For Src kinase, bosutinib or dasatinib may serve as reference compounds [11] [12].
- Feature Definition: Map critical chemical features including hydrogen bond donors/acceptors, hydrophobic regions, aromatic rings, and ionizable groups based on the reference ligand's interaction with the kinase binding pocket [14] [12].
- Model Validation: Validate the pharmacophore model using a set of known active and inactive compounds to ensure discrimination capability. Aim for enrichment factors >3 and high early recovery rates of actives [13].
Step 2: Virtual Screening Implementation
- Compound Library Preparation: Curate a diverse chemical library (e.g., ZINC15, ChemBridge) with drug-like properties. Apply appropriate ionization states and generate conformational ensembles for each compound [15] [12].
- Pharmacophore Screening: Screen the entire library against the pharmacophore model using software such as Catalyst or ZINCPharmer. This step typically reduces the library size by 90-99% by eliminating compounds that don't match the essential features [14] [12].
- Selectivity Filtering: Apply kinase-specific filters to prioritize compounds with potential selectivity, such as exclusion of pan-kinase inhibitor features or inclusion of features targeting unique subpockets [11].
Step 3: Molecular Docking and Binding Affinity Assessment
- Protein Structure Preparation: Obtain the target kinase structure from PDB (e.g., 3U4W for c-Src). Add hydrogen atoms, assign partial charges, and optimize side-chain orientations using molecular mechanics force fields [12].
- Focused Docking: Perform molecular docking of pharmacophore-matched compounds against the target kinase using programs such as AutoDock, GOLD, or Glide. Define the binding site with a grid centered on the ATP-binding pocket [12].
- Binding Mode Analysis: Visually inspect top-ranking poses to ensure critical ligand-protein interactions (e.g., hinge region hydrogen bonds, specific interactions with selectivity residues) are maintained [12].
Step 4: Selectivity Assessment and Hit Prioritization
- Cross-Kinase Screening: Dock top candidates against structurally related kinases (e.g., Src family kinases) to assess potential selectivity. Prioritize compounds showing significant binding energy differences (>2 kcal/mol) [11].
- ADMET Prediction: Evaluate pharmacokinetic properties using QSAR models, including permeability, metabolic stability, and potential toxicity. Apply filters such as Lipinski's Rule of Five and PAINS exclusion [15] [12].
- Final Hit Selection: Select 10-20 compounds for experimental validation based on comprehensive assessment of binding energy, interaction quality, selectivity potential, and drug-like properties [12].
Benchmark Comparison of Virtual Screening Methods
Comparative studies have demonstrated that PBVS frequently outperforms docking-based virtual screening (DBVS) in retrieval of active compounds from large chemical libraries [13]. In a comprehensive benchmark against eight diverse targets, PBVS achieved higher enrichment factors in fourteen of sixteen virtual screening scenarios [13]. The average hit rates at 2% and 5% of the highest ranks of entire databases were significantly higher for PBVS compared to DBVS methods [13]. This superior performance is attributed to PBVS's ability to capture essential interaction features while accommodating some structural flexibility.
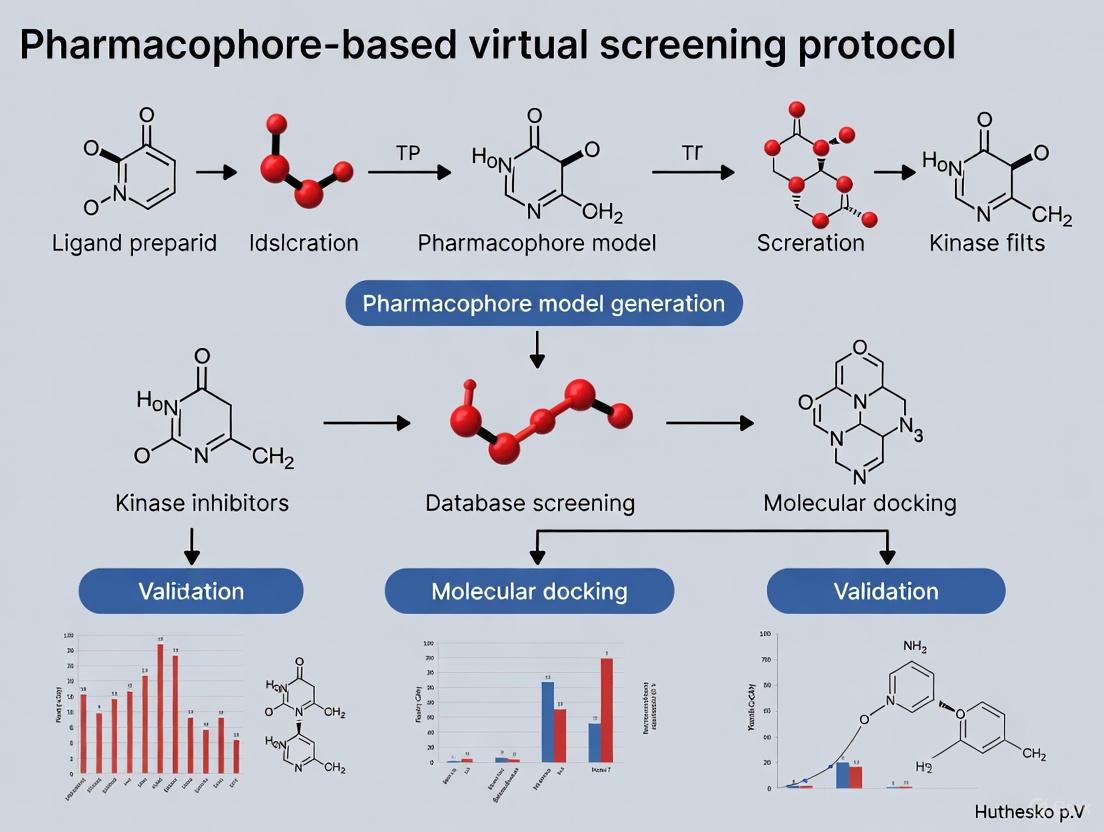
Figure 1: Pharmacophore-Based Virtual Screening Workflow for Kinase Inhibitor Discovery
Case Study: Application to Src Kinase Inhibitor Discovery
Src Kinase as a Challenging Selectivity Target
Src kinase, a non-receptor tyrosine kinase, exemplifies the challenges of selective kinase inhibitor development [11]. As the prototypical member of the Src kinase family (SFK), which includes nine additional structurally similar kinases, Src displays high conservation in its ATP-binding pocket [11]. Despite decades of research, no Src-selective kinase inhibitors have entered clinical use, highlighting the difficulties in achieving selectivity among closely related kinases [11].
In a recent study, researchers implemented a comprehensive virtual screening approach to identify novel c-Src kinase inhibitors with improved selectivity profiles [12]. The protocol screened 500,000 small molecules from the ChemBridge commercial library using pharmacophore-based virtual screening followed by molecular docking and molecular dynamics simulations [12]. This integrated approach identified several promising candidates, with the top hit (compound 71736582) demonstrating potent inhibition of c-Src-mediated kinase activity (IC50: 517 nM) compared to the positive control bosutinib (IC50: 408 nM) [12].
Experimental Validation of Computational Predictions
The transition from computational prediction to experimental validation represents a critical phase in kinase inhibitor development. The following protocol outlines a rigorous experimental framework for validating computational predictions of kinase inhibitor activity and selectivity.
Protocol 2: Experimental Validation of Kinase Inhibitor Selectivity
Step 1: Biochemical Kinase Activity Profiling
- Kinase Assay Selection: Implement biochemical kinase assays (e.g., mobility shift, FRET, or radiometric assays) to measure compound potency against the target kinase [12] [16].
- Initial Potency Assessment: Determine IC50 values for top computational hits across a concentration range (typically 0.1 nM to 10 μM) using recombinant kinase protein [12].
- Selectivity Profiling: Utilize kinase profiling services (e.g., DiscoverX, Millipore) to screen compounds against a panel of 50-100 diverse kinases at a single concentration (e.g., 1 μM) [16].
- Selectivity Score Calculation: Calculate selectivity scores (S(1μM) or S(10μM)) based on the percentage of kinases inhibited beyond a specific threshold (typically >90% inhibition) [16].
Step 2: Cellular Target Engagement Assessment
- Cell Line Selection: Choose relevant cancer cell lines with documented expression of the target kinase and pathway activation (e.g., MDA-MB-231 for Src kinase) [12].
- Cellular Potency Determination: Assess compound effects on cell viability using MTT, MTS, or CellTiter-Glo assays. Calculate GI50 values following 72-hour exposure [12].
- Pathway Modulation Analysis: Evaluate target engagement in cells via Western blotting for phosphorylation of direct kinase substrates and downstream pathway components [12].
- Phenotypic Response Characterization: Assess functional responses to kinase inhibition, such as effects on migration, invasion, or cell cycle progression, using appropriate assays [11].
Step 3: Binding Mode Confirmation
- X-ray Crystallography: Pursue co-crystal structures of lead compounds with the target kinase to verify predicted binding modes and interactions [11].
- Cellular Target Engagement Probes: Utilize techniques such as cellular thermal shift assays (CETSA) to confirm direct target engagement in intact cells [16].
Step 4: Resistance Profiling
- Mutation Analysis: Evaluate compound activity against clinically relevant kinase mutants to assess resistance potential [11].
- Bypass Pathway Assessment: Investigate compensatory pathway activation following prolonged inhibitor treatment through phosphoproteomic analysis [11].
Research Reagent Solutions for Kinase Inhibitor Development
Table 3: Essential Research Reagents for Kinase Inhibitor Screening and Validation
| Reagent/Category | Specific Examples | Application Purpose | Key Features & Considerations |
|---|---|---|---|
| Kinase Assay Systems | ADP-Glo, LanthaScreen, Caliper Mobility Shift | Biochemical activity screening | Homogeneous format, suitable for HTS, kinetic capability |
| Recombinant Kinases | Active Src, Abl, EGFR, CDK2 | Target-based screening | Catalytic domain vs. full-length, activation status |
| Kinase Profiling Services | DiscoverX KinomeScan, Eurofins KinaseProfiler | Selectivity assessment | Broad kinome coverage, standardized conditions |
| Cell Line Models | MDA-MB-231, A549, HCT-116, Ba/F3 | Cellular activity evaluation | Target relevance, pathway activation, genetic background |
| Pathway Antibodies | Phospho-Src (Tyr416), Phospho-FAK (Tyr397) | Cellular target engagement | Specificity validation, application-appropriate |
| Chemical Libraries | ChemBridge, ZINC15, Selleckchem FDA-approved | Compound sourcing for screening | Diversity, drug-like properties, known bioactives |
| Structural Biology Resources | Kinase expression constructs, Crystallization screens | Binding mode determination | High-yield expression, crystallization conditions |
Emerging Technologies and Future Perspectives
The integration of artificial intelligence and machine learning with traditional structure-based drug design is accelerating the development of next-generation kinase inhibitors with enhanced selectivity profiles [11] [17]. Deep learning-enhanced QSAR models are demonstrating remarkable capability in automating feature extraction and capturing complex structure-activity relationships that surpass traditional QSAR approaches [17]. These methods are particularly valuable for predicting kinome-wide selectivity profiles and optimizing chemical scaffolds to minimize off-target interactions [17].
Novel therapeutic modalities beyond conventional ATP-competitive inhibition are also emerging as promising strategies to overcome selectivity challenges. Targeted protein degradation technologies, such as proteolysis-targeting chimeras (PROTACs), are being explored to achieve enhanced selectivity through cooperative binding events that require simultaneous engagement of both the kinase and E3 ubiquitin ligase [11] [10]. Allosteric inhibition approaches continue to advance, with several compounds in clinical development that exploit unique structural features outside the conserved ATP-binding pocket [11].
Figure 2: Challenges and Innovative Solutions in Selective Kinase Inhibitor Design
The future of selective kinase inhibitor design will likely involve increasingly sophisticated computational-experimental feedback loops, where machine learning models trained on large-scale kinase profiling data inform the design of novel chemical scaffolds, which in turn generate new data to refine predictive models [17] [16]. This iterative approach, combined with structural insights and emerging therapeutic modalities, holds significant promise for addressing the persistent challenge of achieving selectivity in kinase drug discovery.
A pharmacophore is an abstract model that defines the ensemble of steric and electronic features essential for a molecule to interact with a biological target and trigger its biological response [2]. In the context of kinase inhibitor research, pharmacophore models serve as powerful tools for identifying and optimizing compounds that can selectively target the ATP-binding site or allosteric pockets of kinases. These models capture the critical supramolecular interactions necessary for high-affinity binding, providing a blueprint for virtual screening and rational drug design [2]. The core features—hydrogen bond donors/acceptors, hydrophobic regions, and aromatic interactions—represent the fundamental language of molecular recognition between kinase inhibitors and their protein targets. This application note details the core components of pharmacophore models and provides established protocols for their application in virtual screening campaigns for kinase inhibitors, with a specific focus on practical implementation for research scientists.
Core Components of a Pharmacophore Model
Quantitative Definition of Pharmacophore Features
Table 1: Core Pharmacophore Features and Their Characteristics
| Feature Type | Electronic/Steric Role | Complementary Protein Environment | Typical Kinase Interactions |
|---|---|---|---|
| Hydrogen Bond Acceptor | Electron-rich atom (e.g., O, N) capable of accepting a hydrogen bond [2] | Hydrogen bond donor (e.g., backbone NH from hinge region) [18] | Hinge region binding (e.g., Val/Met/Gly-rich loop) |
| Hydrogen Bond Donor | Hydrogen atom attached to an electronegative atom (e.g., N-H, O-H) [2] | Hydrogen bond acceptor (e.g., backbone carbonyl oxygen) [18] | Hinge region binding; interaction with catalytic lysine |
| Hydrophobic Region | Region of low polarity; often aliphatic or aromatic carbon chains [2] | Hydrophobic subpocket (e.g., gatekeeper residue region, DFG motif vicinity) [18] | Interaction with hydrophobic back pocket and gatekeeper residue |
| Aromatic Interaction | Electron-rich π-system (e.g., phenyl, heteroaryl rings) [19] | Cationic residues (Lys, Arg), other π-systems (π-π stacking) [18] | Cation-π interaction with catalytic lysine; π-stacking with His/Phe/Tyr |
Detailed Feature Analysis and Kinase Relevance
Hydrogen Bond Donors and Acceptors form the cornerstone of specificity in kinase inhibitor design. These features are typically directional interactions that precisely align the inhibitor within the kinase's hinge region, a segment that connects the N- and C-terminal lobes of the kinase domain. The hydrogen-bonding pattern between the inhibitor and the hinge region's backbone atoms often determines the base level of binding affinity. In pharmacophore modeling, these features are defined not only by their chemical identity but also by their vector directionality and optimal distance ranges to complementary protein features [18]. In a study targeting c-Src kinase, specific hydrogen-bonding interactions at the kinase binding site were critical for identifying potent inhibitors through pharmacophore-based virtual screening [20] [12].
Hydrophobic Regions contribute significantly to the binding affinity through entropy-driven processes and van der Waals interactions. In kinases, these features typically map to the adenine-binding pocket, the hydrophobic back pocket near the gatekeeper residue, and the region associated with the DFG (Asp-Phe-Gly) motif. The spatial placement of hydrophobic features in a pharmacophore model helps exploit these conserved yet structurally distinct pockets, offering opportunities for achieving selectivity among kinase family members. Generation of hydrophobic pharmacophore elements often involves computational methods like k-means clustering of grid points with favorable hydrophobic scores within the binding site [18].
Aromatic Interactions, including π-π stacking and cation-π interactions, provide substantial binding energy and can be crucial for anchoring inhibitors in specific orientations. The catalytic lysine residue, which is highly conserved across the kinase family, often participates in cation-π interactions with aromatic ring systems of inhibitors. Aromatic features in a pharmacophore can be derived from the spatial orientation of protein aromatic rings or from known ligand interactions, and are often represented as ring centroids or normal vectors [18] [19].
Experimental Protocols for Pharmacophore Modeling
Structure-Based Pharmacophore Generation Protocol
This protocol generates a pharmacophore model directly from a protein structure with a defined binding site, without prior ligand information. It is particularly valuable for kinase targets where few active ligands are known.
Workflow: Structure-Based Pharmacophore Generation
Step-by-Step Methodology:
Protein Structure Preparation
- Obtain a high-resolution crystal structure of the kinase target from the Protein Data Bank (PDB). For kinases, structures in the DFG-in conformation are often preferred for Type I inhibitors.
- Prepare the protein structure by adding hydrogen atoms, assigning correct protonation states for residues (especially catalytic Asp and Glu), and optimizing hydrogen bonding networks. The
PDBbinddatabase provides pre-processed structures suitable for this purpose [18].
Binding Site Definition and Grid Generation
- Define the binding site of interest. For kinase ATP-site inhibitors, the centroid of a co-crystallized ligand or the conserved hinge region serves as an appropriate center.
- Project a 3D grid with 0.4 Å spacing into the binding site. The grid should extend at least 4-6 Å beyond the expected dimensions of a typical ligand [18].
Molecular Interaction Field (MIF) Calculation
- Compute interaction potentials between protein atoms and molecular probes placed at each grid point. Use scoring functions such as a continuous form of the ChemScore to evaluate hydrogen-bonding and hydrophobic potentials [18].
- Employ specific probes: hydrogen-bond donor, hydrogen-bond acceptor, hydrophobic, aromatic, and ionic probes. The interaction energy at each grid point indicates the favorability of that specific interaction type.
Pharmacophore Feature Identification
- Hydrophobic Features: Apply k-means clustering over all grid points with favorable hydrophobic scores. The number of clusters (k) is adjusted until the minimum distance between cluster centers reaches a predefined cutoff (e.g., 2.0 Å). The hydrophobic pharmacophore element is the energy-weighted geometric center of each cluster [18].
- Hydrogen-Bonding, Aromatic, and Ionic Features: For these specific interactions, group grid points associated with the same nearest functional group (e.g., a specific backbone carbonyl). Perform k-means clustering within this group or calculate a single energy-weighted geometric center using the formula:
c = Σ(x_i · ε_i), wherex_iandε_iare the coordinates and interaction potential of grid pointi, respectively [18]. - Introduce distance restraints, the Interaction Range for Pharmacophore Generation (IRFPG), to the scoring function to ensure pharmacophore elements are placed at biologically relevant distances from protein atoms [18].
Feature Selection and Model Validation
- Select the most critical features to create a pharmacophore hypothesis. A typical kinase ATP-site pharmacophore includes 3-5 key features.
- Validate the model by screening a small set of known active and inactive compounds. Assess the model's ability to enrich active compounds and its discriminatory power.
Ligand-Based Pharmacophore Generation Protocol
This protocol is used when several active kinase inhibitors are known but a protein structure may be unavailable.
Workflow: Ligand-Based Pharmacophore Generation
Step-by-Step Methodology:
Ligand Dataset Curation
- Compile a set of 20-30 structurally diverse kinase inhibitors with confirmed activity. Include potency data (IC₅₀ or Kᵢ values) if available for quantitative model development.
- Prepare all ligand structures by generating plausible 3D conformations, optimizing geometry, and assigning correct ionization states at physiological pH.
Conformational Analysis and Feature Annotation
- Perform a comprehensive conformational analysis for each ligand to sample the low-energy 3D space. Tools like RDKit or CONFGEN can generate multiple conformers [21].
- Annotate all potential pharmacophore features (hydrogen bond donors/acceptors, hydrophobic regions, aromatic rings, ionizable groups) on each conformer using software such as LigandScout or Phase [2].
Multi-Ligand Alignment and Common Feature Identification
- Align the active molecules based on their pharmacophore features rather than chemical structure. This identifies the maximum common pharmacophore shared by all active compounds.
- Develop a pharmacophore hypothesis that includes the essential features common to the aligned active molecules. The hypothesis should explain the observed activity data.
Model Validation and Refinement
- Validate the model using statistical methods (e.g., Fischer's randomization) and by screening a test set of active and decoy molecules.
- Refine the model by adjusting feature definitions and tolerances based on validation results.
Application in Virtual Screening for Kinase Inhibitors
Implementation in a Screening Pipeline
The validated pharmacophore model serves as a 3D query to screen large chemical libraries. The screening process identifies molecules that match the spatial arrangement of the defined features.
Table 2: Key Research Reagents and Computational Tools
| Tool/Resource Category | Specific Examples | Primary Function in Protocol |
|---|---|---|
| Pharmacophore Modeling Software | LigandScout [2], Phase [2], MOE, Catalyst/Discovery Studio [2] | Model building, visualization, and virtual screening |
| Docking Software | PLANTS [21] | Flexible ligand docking and pose generation |
| Chemical Libraries | ChemBridge Library [20] [12], National Cancer Institute (NCI) Library [22], ZINC database | Source of compounds for virtual screening |
| Protein Structure Resources | Protein Data Bank (PDB) [21], PDBbind database [18] | Source of experimentally determined structures for structure-based modeling |
| Conformer Generation | RDKit [21] [19], CONFGEN [21] | Generation of multiple 3D conformations for ligands |
Case Study: c-Src Kinase Inhibitor Discovery
A recent study demonstrated the successful application of pharmacophore-based virtual screening to identify novel c-Src kinase inhibitors [20] [12]. Researchers screened 500,000 small molecules from the ChemBridge library using a pharmacophore model. This process identified 29 top-ranked molecules, which were further refined to 4 lead compounds through visual inspection of protein-ligand interactions. Molecular dynamics simulations (200 ns) confirmed the stability of two inhibitors at the c-Src kinase binding site. The top hit, compound 71736582, exhibited excellent anticancer potential against various cancer cell lines and inhibited c-Src-mediated kinase activity (IC₅₀: 517 nM), comparable to the positive control bosutinib (IC₅₀: 408 nM) [20] [12].
Advanced Applications and Future Directions
Recent advances integrate pharmacophore modeling with deep learning approaches. For instance, PharmRL uses a deep geometric reinforcement learning algorithm to select optimal subsets of interaction points to form a pharmacophore, demonstrating superior performance in virtual screening [19]. Another method, PGMG (Pharmacophore-Guided deep learning approach for bioactive Molecule Generation), uses pharmacophore hypotheses as input to generate novel bioactive molecules with high validity, uniqueness, and novelty [23].
Shape-focused pharmacophore models like those generated by the O-LAP algorithm represent another advancement. O-LAP creates cavity-filling models by clustering overlapping atomic content from docked active ligands, then uses these models to rescore docking poses, significantly improving enrichment rates in virtual screening [21].
In the targeted search for kinase inhibitors, pharmacophore-based virtual screening stands as a pivotal technique for efficiently identifying novel hit compounds. A pharmacophore is defined as "the ensemble of steric and electronic features that is necessary to ensure the optimal supramolecular interactions with a specific biological target and to trigger (or block) its biological response" [5]. For kinase targets, which often present highly conserved ATP-binding sites, the strategic choice between ligand-based and structure-based pharmacophore modeling approaches can significantly impact the success and efficiency of a drug discovery campaign [24] [25]. This application note provides a detailed comparative analysis of these two fundamental methodologies, offering structured protocols and decision-making frameworks to guide researchers in selecting and implementing the optimal strategy for their specific kinase project.
Technical Comparison: Core Methodologies
The two primary approaches to pharmacophore modeling differ fundamentally in their starting information and generation processes, each with distinct advantages and implementation requirements.
Ligand-Based Pharmacophore Modeling
Ligand-based approaches derive pharmacophore models exclusively from the structural and chemical properties of known active compounds, without requiring 3D target structure information [5] [26]. The underlying principle posits that compounds sharing common chemical functionalities in a similar spatial arrangement likely exhibit similar biological activity against the same target [5] [25].
- Key Techniques: The workflow typically involves generating multiple 3D conformations of known active ligands, performing structural alignment, and identifying common chemical features critical for molecular recognition and activity [26]. These features are translated into a 3D pharmacophore hypothesis containing hydrogen bond donors/acceptors, hydrophobic areas, aromatic rings, and ionizable groups [5].
- Validation Methods: Generated models are rigorously validated using datasets containing both active compounds and inactive decoys to assess their ability to distinguish true positives from false positives [26] [27]. Statistical metrics including sensitivity, specificity, enrichment factor, and goodness of hit scores quantify model performance [27].
Structure-Based Pharmacophore Modeling
Structure-based methods generate pharmacophore models directly from the 3D structure of the target protein, typically derived from X-ray crystallography, NMR spectroscopy, or cryo-electron microscopy [5] [28]. For kinase targets, this often involves analyzing protein-ligand co-crystal structures to identify key interaction points.
- Key Techniques: The process begins with critical protein structure preparation, including protonation state assignment and missing residue modeling [5] [27]. The binding site is then analyzed to map potential interaction features complementary to the protein's functional groups [5]. Exclusion volumes are incorporated to represent spatial restrictions of the binding pocket shape [5].
- Implementation Considerations: When a protein-ligand complex structure is available, feature selection can be guided by the ligand's bioactive conformation, resulting in higher-quality models [5]. In the absence of bound ligand, all possible interaction points in the binding site are detected, often requiring manual refinement to select the most biologically relevant features [5].
Table 1: Comparative Analysis of Pharmacophore Modeling Approaches for Kinase Targets
| Parameter | Ligand-Based Approach | Structure-Based Approach |
|---|---|---|
| Required Input Data | Set of known active compounds [26] | 3D protein structure (X-ray, NMR, Cryo-EM) [5] [28] |
| Feature Generation | Derived from ligand alignment and common chemical features [26] | Mapped from protein binding site or protein-ligand interactions [5] |
| Scaffold Hopping Potential | Moderate to high (depends on model flexibility) [5] | High (focuses on complementary interactions) [5] |
| Handling Protein Flexibility | Limited (implicit in diverse ligand conformations) | Can be addressed through multiple structures or MD simulations [27] |
| Key Advantages | No protein structure required; Directly captures ligand activity data [28] | Direct structural insights; Can identify novel binding motifs [28] |
| Primary Limitations | Dependent on known chemotypes; May miss novel interaction patterns | Requires high-quality structure; Sensitive to binding site conformation [28] |
Experimental Protocols
Protocol 1: Ligand-Based Pharmacophore Modeling for Kinase Inhibitors
This protocol outlines the steps for developing a ligand-based pharmacophore model to identify novel kinase inhibitors, adapted from successful implementations for EGFR/VEGFR2 and JAK kinase inhibitors [24] [25].
Compound Selection and Preparation:
- Curate a diverse set of 20-30 confirmed active compounds with measured IC₅₀ or Ki values against your kinase target from literature or databases like ChEMBL [24].
- Prepare 3D structures of all compounds using molecular modeling software (e.g., MOE). Generate multiple low-energy conformers for each compound to account for flexibility [29].
Pharmacophore Model Generation:
- Perform 3D alignment of the generated conformers using flexible alignment algorithms [26].
- Identify common chemical features (hydrogen bond donors/acceptors, hydrophobic areas, ionizable groups, aromatic rings) shared across the aligned active compounds [26] [24].
- Generate initial pharmacophore hypotheses using software such LigandScout, MOE, or open-source tools like Phramer [26].
Model Validation and Refinement:
- Validate generated models using a separate test set of known active compounds and decoy molecules (inactive or random compounds) [26] [27].
- Calculate statistical metrics (sensitivity, specificity, enrichment factor) to quantify model performance [27].
- Select the best-performing model based on validation statistics for virtual screening [24].
Protocol 2: Structure-Based Pharmacophore Modeling for Kinase Targets
This protocol details structure-based pharmacophore generation, exemplified by studies on FAK1 and c-Src kinases [20] [27].
Protein Structure Preparation:
- Obtain the 3D structure of your kinase target from the Protein Data Bank (PDB). Prioritize high-resolution structures (<2.2 Å) co-crystallized with an inhibitor [27].
- Prepare the protein structure by adding hydrogen atoms, assigning protonation states, and correcting any missing residues or atoms using modeling software [5] [27].
- For structures with missing loops or regions, employ homology modeling with tools like MODELLER [27].
Binding Site Analysis and Feature Mapping:
- Define the binding site around the co-crystallized ligand or known catalytic region (e.g., ATP-binding site for kinases) [5].
- Identify key interaction features (hydrogen bond donors/acceptors, hydrophobic patches, charged interactions) between the protein and a reference ligand [5] [27].
- Use software such as Pharmit or LigandScout to automatically detect and map pharmacophore features from the protein-ligand complex [27].
Model Generation and Optimization:
- Generate an initial structure-based pharmacophore model containing 5-7 key features [27].
- Incorporate exclusion volumes to represent steric constraints of the binding pocket [5].
- Refine the model by selecting features most critical for binding affinity, potentially removing redundant or less contributive features to enhance model selectivity [5].
Diagram 1: Workflow for ligand-based and structure-based pharmacophore modeling.
Table 2: Key Research Reagent Solutions for Pharmacophore Modeling Studies
| Resource Category | Specific Tools & Databases | Key Functionality | Application Context |
|---|---|---|---|
| Protein Structure Databases | RCSB Protein Data Bank (PDB) [5] [27] | Repository of experimentally determined 3D protein structures | Source of kinase structures for structure-based modeling |
| Chemical Databases | ZINC [27] [6], ChEMBL [6] | Libraries of commercially available compounds & bioactivity data | Virtual screening compound sources & training set curation |
| Modeling Software | Molecular Operating Environment (MOE) [29] [26], LigandScout [26] | Integrated computational chemistry software for model generation | Ligand-based & structure-based pharmacophore development |
| Web Servers | Pharmit [26] [27], PharmMapper [26] | Online platforms for pharmacophore screening & modeling | Structure-based model creation & virtual screening |
| Validation Resources | DUD-E [27] | Database of useful decoys for virtual screening evaluation | Pharmacophore model validation with active/inactive compounds |
Application Case Studies in Kinase Research
Dual EGFR and VEGFR2 Kinase Inhibitors (Ligand-Based Approach)
A ligand-based pharmacophore modeling study successfully identified dual inhibitors of EGFR and VEGFR2 tyrosine kinases [24]. Researchers developed separate pharmacophore models for each target using known inhibitors (erlotinib for EGFR and axitinib for VEGFR2) [24]. These models were used to screen the ZINC database, followed by molecular docking and molecular dynamics simulations. The workflow identified two promising compounds (ZINC16525481 and ZINC38484632) that demonstrated stable binding interactions with both kinase targets, illustrating the power of ligand-based approaches for multi-target inhibitor design [24].
FAK1 Kinase Inhibitors (Structure-Based Approach)
In a structure-based study targeting Focal Adhesion Kinase 1 (FAK1), researchers developed pharmacophore models from the FAK1-P4N co-crystal structure (PDB ID: 6YOJ) [27]. After validating models using active compounds and decoys from the DUD-E database, virtual screening of the ZINC database identified several promising hits [27]. Molecular dynamics simulations and MM/PBSA binding free energy calculations confirmed that candidate ZINC23845603 showed strong binding affinity and interaction features similar to the known inhibitor P4N, demonstrating the utility of structure-based approaches for identifying novel kinase inhibitors with confirmed binding stability [27].
c-Src Kinase Inhibitors (Integrated Approach)
A comprehensive virtual screening campaign for c-Src kinase inhibitors employed structure-based pharmacophore modeling followed by high-throughput virtual screening of 500,000 compounds from the ChemBridge library [20]. The integrated approach included ADME analysis, molecular docking, and molecular dynamics simulations, ultimately identifying four promising candidates [20]. Biological validation confirmed that the top hit (compound 71736582) exhibited excellent anticancer potential against various cancer cell lines and inhibited c-Src-mediated kinase activity with an IC₅₀ of 517 nM, comparable to the positive control bosutinib [20].
Table 3: Decision Matrix for Approach Selection in Kinase Projects
| Project Scenario | Recommended Approach | Rationale | Implementation Tips |
|---|---|---|---|
| Novel Kinase Target with Limited Structural Data | Ligand-Based | Leverages known actives when 3D structures are unavailable [28] | Use diverse chemotypes in training set to maximize feature diversity |
| High-Resolution Co-Crystal Structure Available | Structure-Based | Directly exploits atomic-level binding site information [5] [27] | Include water-mediated interactions if structurally conserved |
| Selectivity Campaign Across Kinase Family | Integrated Approach | Combines advantages of both methods for selectivity challenges [20] | Develop models for multiple kinases to identify selectivity features |
| Scaffold Hopping for Patent Expansion | Ligand-Based | Identifies novel chemotypes maintaining key interactions [5] | Use less restrictive models to maximize structural diversity |
| Allosteric or Novel Site Inhibitor Discovery | Structure-Based | Reveals unique interaction patterns in unconventional sites [27] | Focus on unique subpockets distinct from conserved ATP site |
The strategic selection between ligand-based and structure-based pharmacophore modeling is pivotal for efficient kinase inhibitor discovery. Ligand-based approaches provide a powerful solution when structural data is limited but knowledge of active compounds exists, while structure-based methods offer atomic-level insights when high-quality protein structures are available. For challenging kinase targets, particularly those requiring high selectivity across conserved kinase families, an integrated approach that combines both methodologies may offer the most robust path to identifying novel, potent inhibitors. As computational methods continue to advance, including machine learning acceleration for virtual screening [6], pharmacophore modeling remains an indispensable component of the modern kinase drug discovery toolkit.
Leveraging Publicly Available Kinase Structures and Bioactivity Data (e.g., PDB, ChEMBL) for Model Development
Kinases represent a prime target family in drug discovery for diseases such as cancer and inflammatory disorders [30]. The high conservation of their binding sites, particularly the ATP-binding pocket, presents a challenge for achieving selective inhibition and underscores the risk of promiscuous binding and off-target effects [30] [31]. Publicly available resources, including the Protein Data Bank (PDB) for structural data and ChEMBL for bioactivity data, provide a foundational data source for computational approaches like pharmacophore modeling and machine learning. These methods are crucial for navigating the kinase inhibitor chemical space in a cost- and time-effective manner [5] [6]. This application note details protocols for developing robust computational models within the context of a pharmacophore-based virtual screening protocol for kinase inhibitor research.
A successful modeling workflow hinges on the integration of data from multiple public resources. The table below summarizes the core databases utilized in kinase inhibitor discovery.
Table 1: Key Public Data Resources for Kinase Research
| Resource Name | Data Type | Key Features & Utility | Reference |
|---|---|---|---|
| RCSB PDB | Protein-ligand structures | Primary source for 3D structures of kinase-ligand complexes; essential for structure-based pharmacophore modeling and molecular docking. | [5] [6] |
| ChEMBL | Bioactivity data | Manually curated database of bioactive molecules with quantitative properties (e.g., IC₅₀, Kᵢ); vital for ligand-based modeling and model validation. | [6] [32] |
| KLIFS | Kinase-focused structures | Specialized database providing curated structural data of kinase ligand-binding sites, including DFG and αC-helix conformations. | [30] [33] |
| UniProt | Protein sequence & function | Provides comprehensive information on kinase sequences, functional domains, and annotated mutations. | [30] |
Kinase-Specific Structural Concepts
Kinase structures are highly dynamic. Successful model development requires attention to key conformational states:
- DFG Motif: The Asp-Phe-Gly motif can adopt "DFG-in" (active) or "DFG-out" (inactive) conformations, which is a primary classifier for kinase inhibitor types (e.g., Type I vs. Type II) [34].
- αC-Helix: This helix can also adopt "in" or "out" conformations, which, combined with the DFG state, defines the kinase's catalytic status and the shape of the binding pocket [34].
- Hinge Region: A critical area for forming hydrogen bonds with ATP-competitive inhibitors [30].
Researchers should note that AI-based structural prediction tools like AlphaFold2 have a demonstrated bias toward generating structures in the active, DFG-in conformation prevalent in the PDB. Using lower multiple sequence alignment (MSA) depths during AlphaFold2 prediction can help explore a wider range of inactive conformations for drug discovery [34].
Experimental Protocols and Workflows
The following diagram illustrates a comprehensive protocol integrating public data and computational models for kinase inhibitor discovery.
Diagram 1: Integrated kinase inhibitor discovery workflow.
Protocol 1: Structure-Based Pharmacophore Modeling
This protocol generates a pharmacophore model directly from the 3D structure of a kinase target.
Procedure:
Protein Structure Preparation
- Obtain the 3D structure of your kinase target of interest from the PDB (e.g., PDB ID: 2Z5Y for MAO-A) [6]. If an experimental structure is unavailable, a high-quality model from AlphaFold2 (with caution for conformational bias) or a homology model can be used [5] [34].
- Prepare the protein structure using standard molecular modeling software (e.g., Maestro's Protein Preparation Wizard). This involves adding hydrogen atoms, assigning bond orders, correcting protonation states (e.g., using PropKa at pH 7), and optimizing hydrogen-bonding networks [35].
- Perform energy minimization using a force field such as OPLS_2005 to relieve steric clashes [35].
Binding Site Detection and Analysis
- Define the ligand-binding site. If the structure is a complex with a ligand, the binding site is defined by the co-crystallized ligand. For apo structures, use tools like GRID or LUDI to identify potential binding pockets by analyzing the protein surface for regions with favorable interaction energies [5].
- For kinases, specialized resources like KLIFS provide a standardized definition of the binding pocket, which includes 85 key residues [30] [31].
Pharmacophore Feature Generation
- Analyze the prepared binding site to generate a set of chemical features that a ligand must possess to bind effectively. Standard features include [5]:
- Hydrogen Bond Donor (HBD)
- Hydrogen Bond Acceptor (HBA)
- Hydrophobic (H)
- Positively/Negatively Ionizable (PI/NI)
- Aromatic Ring (AR)
- The features can be derived from interactions made by a bound ligand (in a holo structure) or from complementary interaction points calculated for the protein alone (in an apo structure) [5].
- To increase model selectivity, incorporate Exclusion Volumes (XVOL). These are spheres placed in the 3D space where the presence of ligand atoms would cause steric clashes with the protein, thereby defining the shape of the binding cavity [5].
- Analyze the prepared binding site to generate a set of chemical features that a ligand must possess to bind effectively. Standard features include [5]:
Model Refinement and Validation
- Not all generated features are equally important. Manually select features that are critical for bioactivity, such as those involved in conserved interactions (e.g., hinge region hydrogen bonds in kinases) or interactions with key residues identified from mutagenesis studies [5].
- Validate the model by assessing its ability to retrieve known active compounds from a database of decoys before proceeding to virtual screening.
Protocol 2: Developing a Machine Learning Bioactivity Predictor
This protocol leverages large-scale bioactivity data from ChEMBL to train a model that predicts compound-kinase interactions, dramatically accelerating virtual screening [6] [32].
Procedure:
Data Curation from ChEMBL
- Download kinase bioactivity data from ChEMBL (e.g., Ki, IC₅₀ values for MAO-A and MAO-B) [6].
- Filter the data to ensure quality. Retain only compounds with definitive activity values (e.g., IC₅₀). Exclude compounds with molecular weight >700 Da and highly flexible structures to reduce noise [6].
- Convert IC₅₀ values to pIC₅₀ (pIC₅₀ = -log₁₀(IC₅₀)) to create a more normally distributed value for modeling [6].
Data Splitting Strategy
- Split the dataset into training, validation, and test sets (e.g., 70/15/15). To rigorously test the model's ability to generalize to novel chemical scaffolds, use Bemis-Murcko scaffold-based splitting. This ensures that compounds in the training and test sets are structurally distinct, providing a more realistic performance estimate for prospective screening [6].
Feature Generation (Featurization)
- Compound Representation: Encode compounds using molecular fingerprints such as ECFP4 (Extended Connectivity Fingerprints) or other descriptors (e.g., RDKit fingerprints) [32].
- Kinase Representation: Encode kinases using features derived from their amino acid sequence. This can include the 85-residue binding pocket sequence from KLIFS or embeddings from a pretrained protein language model like ProtBert [32].
Model Training and Ensemble Construction
- Train multiple machine learning algorithms, which may include Random Forest, Kernel Ridge Regression, or deep learning methods like ConPLex [32].
- Construct an ensemble model that combines predictions from multiple individual models (e.g., using different fingerprint types or algorithms). This ensemble approach reduces prediction errors and delivers more precise and robust activity predictions [6].
Model Validation and Application
- Evaluate the model on the held-out test set using metrics like Root Mean Square Error (RMSE) and Spearman rank correlation.
- Use the trained model to predict the activity of millions of compounds from commercial databases (e.g., ZINC), prioritizing compounds with predicted high activity for further experimental testing [6].
The Scientist's Toolkit
Table 2: Essential Research Reagents and Computational Tools
| Tool/Resource | Type | Function in Protocol |
|---|---|---|
| RCSB PDB & KLIFS | Database | Provides validated 3D structures of kinase targets for structure-based modeling and analysis of binding site motifs. |
| ChEMBL | Database | Supplies curated bioactivity data for training and validating ligand-based and machine learning models. |
| UniChem | Web Service | Cross-references compound identifiers between databases (e.g., from ChEMBL ID to PDB ligand ID) [36]. |
| AlphaFold2 DB | Database | Offers protein structure predictions for targets lacking experimental structures; requires conformational bias assessment [34]. |
| ECFP4 Fingerprints | Computational Descriptor | Encodes molecular structure for machine learning models, enabling the prediction of bioactivity from chemical features [32]. |
| Smina | Software | Performs molecular docking to generate binding poses and scores for virtual screening; can be used as a source of data for ML model training [6]. |
| Schrödinger Phase | Software | Facilitates the development and application of structure-based and ligand-based pharmacophore models for virtual screening [35]. |
Building and Executing Your Screening Protocol: A Step-by-Step Workflow
Pharmacophore modeling represents a foundational step in structure-based drug discovery, providing an abstract definition of the structural and chemical features essential for a small molecule to bind a biological target. Within kinase drug discovery, this approach is particularly valuable for identifying novel chemotypes and addressing challenges of selectivity and resistance. This protocol details the generation and validation of pharmacophore models targeted specifically at kinase binding pockets, serving as the critical first step in a comprehensive pharmacophore-based virtual screening workflow for kinase inhibitor identification.
Key Pharmacophore Features for Kinase Binding Pockets
Kinase binding pockets share conserved structural elements that inform pharmacophore feature definition. The table below summarizes the critical pharmacophore features relevant for kinase inhibitor design, particularly for Type II inhibitors that target the inactive (DFG-out) conformation.
Table 1: Essential Pharmacophore Features for Kinase Binding Pockets
| Feature Type | Structural Role in Kinase Binding | Target Kinase Residues |
|---|---|---|
| Hydrogen Bond Acceptor | Binds to hinge region backbone amide | Cys919 (VEGFR-2), Ala539 (FGFR-1), Cys531 (BRAF) [37] |
| Hydrogen Bond Donor | Binds to hinge region backbone carbonyl | Gate area and hinge region [37] |
| Hydrophobic Group | Interacts with hydrophobic back pocket | Phe1047 (VEGFR-2), Phe537 (FGFR-1), Phe583 (BRAF) [37] |
| Aromatic Ring | Engages in π-π or cation-π interactions | Often with Phe residues in the DFG motif [38] |
| Negative Ionizable | Interacts with cationic Lys/Glu pair | Glu885 (VEGFR-2), Glu562 (FGFR-1) [39] [37] |
| Hydrophobic Atom | Occupies hydrophobic regions I/II | Val916, Leu1035 (VEGFR-2), Ala564, Leu484 (FGFR-1) [38] [40] |
Methodological Approaches
Structure-Based Pharmacophore Modeling
Structure-based pharmacophore models are derived from the 3D structure of the target kinase, typically in complex with an inhibitor.
Protocol: Structure-Based Model Generation using MOE
- Protein Preparation: Obtain the crystal structure of the kinase-inhibitor complex from the PDB (e.g., PDB ID: 3E8D for Akt2). Remove water molecules and co-crystallized ligands. Add hydrogen atoms and assign correct protonation states at pH 7.4.
- Binding Site Analysis: Define the binding site using the co-crystallized ligand as a reference, creating a sphere within a 7 Å radius from the original ligand [40].
- Feature Generation: Use the "Interaction Generation" protocol to map potential interaction points (hydrogen bond donors/acceptors, hydrophobic patches, aromatic centers, ionic groups) between the protein and a putative ligand [38] [40].
- Feature Selection and Clustering: Manually edit and cluster the generated features to eliminate redundancies. Retain only the features with catalytic importance. A typical model may comprise 6-7 key features [40].
- Exclusion Volume Addition: Define exclusion volumes (spheres) around protein atoms in the binding site to represent steric constraints, ensuring generated molecules have compatible shapes [40].
Ligand-Based Pharmacophore Modeling
When structural data is limited or to incorporate known structure-activity relationships (SAR), ligand-based models are constructed from a set of active compounds.
Protocol: Ligand-Based Model Generation with Catalyst/HipHop
- Training Set Compilation: Select 4-6 known kinase inhibitors with activity spanning a wide potency range (e.g., nanomolar to micromolar). Assign priority levels based on potency [39].
- Conformational Analysis: For each training set compound, generate a representative set of low-energy conformations using the "Generate Conformations" protocol (Best Energy Threshold: 20 kcal/mol) [40].
- Hypothesis Generation: Use the HipHopRefine algorithm to identify common chemical features from the aligned conformations of the most active compounds [39].
- Model Refinement: Use medium- and low-activity compounds to validate and refine the hypothesis, discarding models that assign high fit values to inactive compounds [39].
Emerging Methods: Water-Based and AI-Enhanced Pharmacophores
Recent advances incorporate explicit water molecules and machine learning to improve model accuracy and novelty.
- Water-Based Pharmacophores: Molecular dynamics (MD) simulations of water molecules in the empty, solvated kinase binding pocket are performed. The conserved hydration sites are then translated into complementary pharmacophore features (e.g., hydrogen bond donors/acceptors), offering a ligand-free strategy for novel chemotype identification [41].
- AI-Enhanced Models: Graph Neural Networks (GNNs) can be applied to ensembles of 3D pharmacophores to enhance virtual kinase profiling. This approach integrates multiple protein-ligand interaction patterns, significantly improving prediction accuracy for kinase inhibitor activity and selectivity [42].
Model Validation Protocols
Rigorous validation is crucial to ensure the model's utility for virtual screening.
Table 2: Pharmacophore Model Validation Methods and Metrics
| Validation Method | Procedure | Interpretation of Results |
|---|---|---|
| Decoy Set Validation | Screen a database of known actives and decoys. Calculate Enrichment Factor (EF) and Goodness of Hit Score (GH). | EF > 10 and GH > 0.7 indicate a high-quality model. A GH of 0.72 is considered very good [40]. |
| Test Set Validation | Challenge the model with a set of known active inhibitors not used in training and confirmed inactive compounds. | The model should retrieve a high percentage of actives (e.g., 20-100%) and correctly reject most inactives [39] [40]. |
| Fischer's Validation | Assess the statistical significance of the hypothesis against a null model that assumes no discriminating power. | A confidence level of >95% indicates the model did not arise by chance [40]. |
Validation Protocol: Decoy Set Testing
- Prepare a Decoy Set: Compile a database of ~2000 molecules, including ~20 known active kinase inhibitors and 1980 pharmaceutically relevant but presumably inactive decoy molecules with similar physical properties [40].
- Perform Virtual Screening: Use the pharmacophore model as a 3D query to screen the decoy set.
- Calculate Metrics:
- Enrichment Factor (EF):
EF = (Ht / Ht) / (A / D), whereHtis the number of actives found,Hais the number of actives in the database, andDis the total molecules in the database [40]. - Goodness of Hit Score (GH):
GH = [ (Ht / (4 * Ha * D)) ^ (1/2) ] * [ ( (Ha - Ht) / (Ha - Ht) ) + 1 ]. A score closer to 1.0 is ideal [40].
- Enrichment Factor (EF):
The Scientist's Toolkit
Table 3: Essential Research Reagents and Software for Pharmacophore Modeling
| Item Name | Function/Application | Examples/References |
|---|---|---|
| Molecular Operating Environment (MOE) | Software for structure-based pharmacophore generation, molecular docking, and simulations. | Used for creating complex-based pharmacophore models and analyzing binding interactions [38]. |
| Accelrys Discovery Studio | Platform for generating and validating 3D-QSAR pharmacophore models and performing virtual screening. | Employed for hypothesis generation using the HipHop algorithm and Fischer's validation [40]. |
| Pharmit Server | Online tool for ligand-based virtual screening using pharmacophore queries. | Used for screening chemical databases based on pharmacophoric features of a co-crystal ligand [43]. |
| RCSB Protein Data Bank (PDB) | Repository for 3D structural data of proteins and nucleic acids, essential for structure-based design. | Source of kinase crystal structures (e.g., 3F3V for Src kinase, 7AEI for EGFR) [38] [43]. |
| Kinase-Targeted Compound Libraries | Curated sets of known kinase inhibitors and drug-like molecules for validation and screening. | Databases like ZINC, PubChem, ChemBridge, NCI, and commercial libraries from Enamine and ChemDiv [12] [43]. |
| Graph Neural Network (GNN) Models | Machine learning architecture for enhancing kinase profiling accuracy using 3D pharmacophore ensembles. | Applied to a curated database of 75 kinases to predict inhibitor selectivity [42]. |
Workflow Visualization
Kinase Pharmacophore Modeling Workflow
Application in Kinase Drug Discovery
Validated pharmacophore models are deployed as 3D search queries to screen large chemical databases (e.g., ZINC, PubChem) [43]. This virtual screening process efficiently prioritizes compounds that match the essential feature map of the kinase binding pocket. Successful applications have identified novel, potent inhibitors for diverse kinase targets, including:
- c-Src kinase: A pharmacophore-based high-throughput virtual screening of 500,000 compounds identified specific inhibitors with anticancer activity and kinase IC~50~ values comparable to the control drug bosutinib [12].
- VEGFR-2, FGFR-1, and BRAF: A multi-kinase pharmacophore model facilitated the discovery of a benzimidazole-based compound (8u) with potent inhibitory activity (IC~50~ values of 0.93 µM, 3.74 µM, and 0.25 µM, respectively) and lethal effects on various NCI cancer cell lines [37].
- PLK1: The TransPharmer generative model, guided by pharmacophore fingerprints, designed a novel inhibitor (IIP0943) with 5.1 nM potency and a new 4-(benzo[b]thiophen-7-yloxy)pyrimidine scaffold, demonstrating successful scaffold hopping [44].
High-Throughput Virtual Screening (HTVS) serves as a critical computational methodology in modern kinase drug discovery, enabling researchers to rapidly prioritize potential inhibitor candidates from libraries containing millions of small molecules before committing to costly experimental assays. This approach is particularly valuable for kinase targets, where the high degree of structural conservation in the ATP-binding site presents significant challenges for achieving selectivity. HTVS leverages the power of molecular docking and pharmacophore modeling to efficiently evaluate compound libraries, significantly reducing the number of compounds requiring physical screening while increasing the probability of identifying genuine hits with the desired biological activity [45] [46]. The process typically involves a multi-stage workflow that progressively applies more computationally intensive and stringent filters to distill a manageable number of promising candidates from an initial pool of several million compounds.
Library Selection and Preparation
The foundation of a successful HTVS campaign lies in the careful selection and preparation of the compound library. Several large-scale commercial and public databases are routinely used for this purpose.
Table 1: Common Chemical Libraries for Kinase Inhibitor Screening
| Library Name | Size (Compounds) | Key Characteristics | Application Examples |
|---|---|---|---|
| ZINC Database | >6 million (lead-like subset) [46] | Publicly accessible, contains commercially available compounds with drug-like and lead-like properties. | Screening for novel NDM-1 [46] and c-Src kinase inhibitors [45]. |
| NCI Database | Not specified | Publicly available database from the National Cancer Institute. | Used for pharmacophore-based virtual screening for Src inhibitors [47]. |
| ChemBridge Library | 500,000 [45] | Commercial library of small molecules. | Used for pharmacophore-based VS to identify c-Src kinase inhibitors [45]. |
| Maybridge HitFinder | 14,400 [48] | Premier compounds representing the drug-like diversity of the Maybridge screening collection. | Used for kinase inhibitor screening by service providers [48]. |
| Life Chemicals Collection | ~30,000 [48] | Small organic molecules with optimal physicochemical parameters for drug discovery. | Used for HTS and kinase-targeted libraries [48]. |
The initial preparation of these libraries is a crucial step. It typically involves applying Lipinski's Rule of Five and Veber's rules to filter out molecules with poor drug-likeness or predicted ADME/T (Absorption, Distribution, Metabolism, Excretion, and Toxicity) properties [46] [47]. Subsequently, the 3D structures of the remaining compounds are generated and energy-minimized using force fields such as CHARMM [47]. For each molecule, multiple conformers are often generated to ensure adequate coverage of its potential 3D shape space during virtual screening [47].
HTVS Workflow and Protocol
The standard HTVS protocol employs a multi-tiered docking approach to balance computational efficiency with screening accuracy. The following workflow diagram and detailed protocol outline the key steps.
Detailed Step-by-Step Protocol
Library Sourcing and Preparation:
- Download the "lead-like" or "drug-like" subset from a database such as ZINC, which may contain over 6 million compounds [46].
- Prepare the library using software like LIGPREP (Schrödinger) [46] or the "smart minimizer" in Discovery Studio [47]. This step involves adding hydrogens, generating ionization states at a specified pH, and generating multiple low-energy conformers for each molecule (e.g., 255 conformers per molecule) [47].
Protein Target Preparation:
- Obtain the 3D crystal structure of the kinase target from the Protein Data Bank (e.g., PDB IDs: 3G5D, 1Y57 for c-Src) [47].
- Prepare the protein structure by removing water molecules and any co-crystallized native ligands. Add hydrogen atoms and assign partial charges using an appropriate force field (e.g., CHARMM) [47].
- Define the binding site for docking. Typically, a spherical region with a radius of 10-12 Å around the centroid of a known co-crystallized inhibitor is used [47].
High-Throughput Virtual Screening (HTVS):
- Perform the initial, rapid docking of the entire prepared library against the defined kinase binding site using the HTVS mode in docking software (e.g., Glide) [46].
- Output: Select the top 1-10% of compounds (e.g., 10,000 molecules from 1 million) based on the HTVS docking score for further analysis [46].
Standard Precision (SP) Docking:
- Subject the hits from the HTVS step to a more rigorous SP docking protocol.
- Output: Select the top 1% of compounds (e.g., 100 molecules from 10,000) based on improved SP docking scores [46].
Extra Precision (XP) Docking:
- Apply the most stringent XP docking to the top-ranking SP hits. This step is designed to eliminate false positives and refine the binding poses [46].
- Output: Select compounds with a docking score cutoff of ≥ -7.5 kcal/mol (the more negative, the better). This typically results in a shortlist of 5-30 compounds [46].
Post-Docking Analysis:
- Visually inspect the binding poses of the top-ranked XP hits. Prioritize compounds that form key interactions with the kinase hinge region and other critical residues in the binding pocket [45] [49].
- Employ consensus scoring by evaluating the compounds using multiple scoring functions (e.g., PMF, PLP, Jain, LUDI) to improve the reliability of the selection [47].
- Final Output: A final set of 20-50 compounds is typically selected for purchase and experimental validation [48].
Experimental Validation of HTVS Hits
The computational predictions from HTVS require rigorous experimental validation to confirm biological activity.
Primary Biochemical Assays
The top-ranking virtual hits are first tested for their ability to directly inhibit the target kinase. This is typically done using a kinase activity assay to determine the half-maximal inhibitory concentration (IC50). For example, a validated c-Src inhibitor from HTVS exhibited an IC50 of 517 nM, comparable to the control drug bosutinib (IC50: 408 nM) [45]. Similarly, for other enzyme targets like NDM-1, steady-state enzyme kinetics are performed in the presence of the hit compound to assess a decrease in catalytic efficiency (kcat/Km) against various antibiotics [46].
Cellular Phenotypic Assays
Active compounds from biochemical assays are progressed to cell-based studies. Key assays include:
- Phospho-ELISA: To measure the inhibition of target phosphorylation in cancer cell lines (e.g., suppression of Src phosphorylation) [47].
- Cell Viability/Proliferation Assays: To evaluate the anticancer potential of inhibitors against various cancer cell lines (e.g., A549, HCT-116, MDAMB-231) [45] [47].
- Functional Assays: To investigate the compound's effect on clonogenicity, invasion, and migration of cancer cells in vitro [47].
- Apoptosis and Oxidative Stress Assays: To determine if the inhibitor induces programmed cell death and increases reactive oxygen species in cancer cells [45].
Case Studies and Data
The utility of HTVS is demonstrated by its successful application in identifying potent inhibitors for various therapeutic targets.
Table 2: Representative HTVS Outcomes for Kinase and Related Targets
| Target Protein | Initial Library | Final Hits | Hit Rate | Potency of Exemplar Hit |
|---|---|---|---|---|
| c-Src Kinase [45] | 500,000 compounds (ChemBridge) | 4 molecules for biological validation | ~0.0008% | IC50 = 517 nM (Kinase assay); Anticancer activity in multiple cell lines. |
| NDM-1 [46] | ~6 million compounds (ZINC, lead-like) | 5 novel inhibitors identified | ~0.00008% | Docking binding free energy: -11.234 kcal/mol; Reduced catalytic efficiency of NDM-1. |
| PKM2 [48] | >100 million compounds (ZINC) | 30 purchased, 5 active | ~16.7% (of purchased) | IC50 = 10 µM (from in-house screening). |
In one case study targeting c-Src kinase, researchers used a pharmacophore-based HTVS of 500,000 small molecules from the ChemBridge library. The workflow involved pharmacophore modeling, ADME analysis, and molecular docking, which narrowed the list to 29 best-docked molecules. After visual inspection, 4 top candidates were identified. Molecular dynamics simulations revealed two of these formed exceptionally stable complexes with c-Src. The top hit, compound 71736582, demonstrated potent anticancer activity across multiple cancer cell lines and inhibited c-Src kinase activity with an IC50 of 517 nM [45]. In a different approach for kinase inhibitor discovery, a de novo design strategy started with over two million commercial compounds. Researchers extracted ~84,000 unique core fragments, applied a hinge-binding pharmacophore filter, and docked the 6,000 passing fragments against a panel of 46 kinases. This process led to the synthesis of 186 novel compounds, 15 of which were screened. Impressively, all 15 showed activity against at least one kinase, with one compound, B1, achieving IC50 values as low as 6 µM and high ligand efficiencies for several therapeutically relevant kinases [49].
The Scientist's Toolkit
Table 3: Essential Research Reagents and Software for HTVS
| Item Name | Function/Application | Specific Examples |
|---|---|---|
| ZINC Database | A free public database of commercially available compounds for virtual screening. | Used for screening millions of "lead-like" and "drug-like" molecules [46] [48]. |
| NCI Database | A public chemical database maintained by the National Cancer Institute. | Source of compounds for pharmacophore-based virtual screening [47]. |
| Schrödinger Suite | A comprehensive software suite for drug discovery. | Used for LIGPREP, HTVS, SP, and XP molecular docking [46]. |
| Discovery Studio | A software suite for biomolecular modeling and simulation. | Used for 3D-QSAR pharmacophore generation (HypoGen) and molecular docking (LibDock) [47]. |
| CHARMM Force Field | A widely used force field for energy minimization and molecular dynamics simulations. | Used to prepare and optimize the 3D structures of both small molecules and protein targets [47]. |
| Kinase-Targeted Library | A specialized commercial library pre-filtered for kinase inhibitor-like properties. | Life Chemicals Kinase Type II Inhibitor Library [50]. |
| Fragment Libraries | Collections of small, low molecular weight compounds for fragment-based drug discovery. | Used in de novo design to generate novel kinase inhibitor scaffolds [49]. |
Within a comprehensive pharmacophore-based virtual screening (PBVS) protocol for kinase inhibitor discovery, hit refinement through multi-level molecular docking and scoring is a critical step. Following the initial high-throughput pharmacophore screening, this stage applies computational methods to predict the binding mode and affinity of candidate molecules within the kinase's active site, prioritizing the most promising leads for further experimental validation [12] [27]. This document details the standard operating procedures for implementing a multi-level docking and scoring strategy to refine hits identified from pharmacophore screening of kinase targets.
Background and Rationale
Virtual screening is a cornerstone of modern drug discovery, with Pharmacophore-Based Virtual Screening (PBVS) and Docking-Based Virtual Screening (DBVS) being two predominant methodologies. While PBVS excels at rapidly filtering large libraries based on essential steric and electronic features, it provides limited information on the detailed energetics of ligand binding [51] [52]. DBVS, though often computationally more intensive, addresses this by predicting the precise binding orientation (pose) of a ligand within a protein binding site and estimating its binding affinity using a scoring function [27].
The integration of these methods into a sequential workflow leverages their complementary strengths. A benchmark study comparing PBVS and DBVS across eight diverse protein targets demonstrated that PBVS often achieves higher enrichment factors in initial hit identification [51] [13]. Consequently, a synergistic protocol is recommended: using PBVS as a primary filter to reduce library size, followed by DBVS for a more rigorous assessment of binding geometry and affinity of the top candidates [51] [53]. This multi-level docking approach is particularly valuable for kinase targets, given the high conservation of their ATP-binding sites and the consequent challenge of achieving inhibitor selectivity [12] [27].
Experimental Protocol: Multi-Level Docking and Scoring
Prerequisites and Input Preparation
Input from Previous Step: A refined compound library generated from a validated pharmacophore model, typically comprising a few hundred to a few thousand candidates [54] [53].
Protein Preparation:
- Retrieve 3D Structure: Obtain a high-resolution crystal structure of the target kinase domain from the Protein Data Bank (PDB). Structures co-crystallized with an inhibitor are preferred (e.g., PDB ID: 6YOJ for FAK1) [27].
- Preprocess the Protein: Using molecular visualization software (e.g., UCSF Chimera):
- Remove water molecules and co-crystallized ligands, though structural waters mediating key hydrogen bonds may be retained.
- Add missing hydrogen atoms and assign protonation states to residues (e.g., Asp, Glu, His) appropriate for physiological pH.
- Model any missing loops in the receptor structure using tools like MODELLER [27].
- Assign partial charges and save the protein in the required format for the docking software (e.g., PDBQT for AutoDock Vina).
Ligand Preparation:
- Convert to 3D: Ensure all ligand structures from the pharmacophore screening output are in a three-dimensional format.
- Energy Minimization: Perform geometry optimization using molecular mechanics force fields (e.g., MMFF94) to ensure correct bond lengths and angles and to eliminate steric clashes.
- Generate Conformers: For flexible docking, generate multiple low-energy conformers for each ligand to account for rotational bonds.
- Format for Docking: Prepare ligand files in the appropriate format for the docking program, including the assignment of partial charges and torsion tree roots.
Docking Workflow and Execution
A tiered approach is recommended to balance computational efficiency with accuracy.
Level 1: Standard-Precision Docking
- Objective: Rapid screening of the entire pharmacophore-refined library to eliminate weak binders.
- Software: AutoDock Vina integrated into PyRx is commonly used for its speed and good accuracy [27].
- Procedure:
- Define the Binding Site: The search space for docking is typically defined by a grid box centered on the native ligand's binding site in the kinase. Example dimensions are 22 × 22 × 22 Å in the x, y, and z directions [53].
- Execute Docking: Run the docking simulation for all prepared ligands. Standard parameters for exhaustiveness can be used.
- Analysis: Rank compounds based on their docking scores (estimated binding affinity in kcal/mol). Select the top 1-5% of compounds, or all compounds with scores better than a known reference inhibitor, for the next level of docking [54] [12].
Level 2: High-Precision Docking & Interaction Analysis
- Objective: A more detailed assessment of the top hits from Level 1 using more rigorous docking algorithms.
- Software: SwissDock, Glide (SP or XP mode), or GOLD can be employed for this stage [27] [13].
- Procedure:
- Refined Docking: Dock the shortlisted compounds using more precise, computationally intensive methods.
- Pose Clustering and Visualization: Analyze the predicted binding poses. Cluster similar poses and visually inspect the top-ranked poses for key interactions with the kinase's active site, such as hinge region hydrogen bonds, hydrophobic pocket occupancy, and gatekeeper residue interactions [12] [27].
- Select Final Candidates: Based on a consensus of favorable docking scores and complementary interaction profiles, select 10-50 compounds for further computational and experimental testing.
Post-Docking Validation
Molecular Dynamics (MD) Simulations:
- Objective: To assess the stability of the protein-ligand complex under dynamic, near-physiological conditions and to calculate more robust binding free energies.
- Protocol:
- System Setup: Solvate the protein-ligand complex in a water box (e.g., TIP3P) and add ions to neutralize the system.
- Simulation Run: Perform simulations for a sufficient duration (typically 100-200 ns) using software like GROMACS [54] [12] [27].
- Analysis: Calculate root-mean-square deviation (RMSD) of the protein and ligand to monitor stability. A stable, low RMSD (e.g., ~1.42 Å for a stable complex vs. ~2.8 Å for a less stable one) indicates a robust binding mode [54] [53]. Use the simulation trajectories for MM/PBSA (Molecular Mechanics/Poisson-Boltzmann Surface Area) calculations to estimate binding free energies [27].
Binding Free Energy Estimation (MM/PBSA):
- Using frames from the stable phase of the MD trajectory, calculate the binding free energy (ΔG_bind). This method often provides a better correlation with experimental activity than docking scores alone [22] [27]. Superior MM/PBSA scores compared to reference inhibitors strongly support the potential of a hit compound [22].
Data Presentation and Analysis
Quantitative Data from Case Studies
Table 1: Docking and Binding Energy Results from Representative Virtual Screening Studies
| Study Target | Hit Compound | Docking Score (kcal/mol) | Reference Inhibitor Score (kcal/mol) | MM/PBSA ΔG_bind (kcal/mol) | Citation |
|---|---|---|---|---|---|
| KHK-C | Compound 2 | -9.10 | -7.77 (PF-06835919) | -70.69 | [22] |
| PARP-1 | MWGS-1 | -16.8 | -16.8 (Compound IV) | N/R | [54] [53] |
| c-Src | 71736582 | N/R | N/R | N/R | [12] |
| FAK1 | ZINC23845603 | N/R | N/R | Favorable vs. P4N | [27] |
| Legend: N/R = Not explicitly reported in the abstract or main text. |
Table 2: Key Research Reagent Solutions for Docking and Refinement
| Reagent / Software Solution | Function in Protocol | Example Use Case |
|---|---|---|
| AutoDock Vina / PyRx | Level 1: Standard-precision docking for rapid hit triage. | Initial screening of hundreds of pharmacophore hits against a kinase target [53] [27]. |
| SwissDock / Glide / GOLD | Level 2: High-precision docking for pose prediction and affinity estimation. | Refined docking of top ~50 hits with more accurate scoring functions [27] [13]. |
| GROMACS | Molecular dynamics simulations to assess complex stability. | 200 ns simulation of a kinase-hit complex to validate binding pose and calculate MM/PBSA [54] [27]. |
| Pharmit | Structure-based pharmacophore generation and validation. | Creating the initial pharmacophore model from a kinase-inhibitor co-crystal structure [53] [27]. |
| DUD-E Database | Source of decoy molecules for pharmacophore and docking validation. | Validating a FAK1 kinase pharmacophore model with 114 actives and 571 decoys [27]. |
Workflow Visualization
Kinase Inhibitor Binding Site Analysis
Troubleshooting and Best Practices
- Lack of Correlation with Experimental Data: If docking scores do not align with experimental activity results, consider using multiple scoring functions or rescoring docking poses with more advanced methods like MM/PBSA. Re-evaluate the prepared protein structure for correct protonation states.
- Handling Protein Flexibility: For kinases that undergo significant conformational change (e.g., DFG-loop movement), perform docking into multiple receptor conformations if available, or use an ensemble docking approach.
- Validation is Critical: Always validate the docking protocol by re-docking a known native ligand from a crystal structure and confirming that the procedure can reproduce the experimental binding mode with a low root-mean-square deviation (RMSD < 2.0 Å).
- Focus on Interactions, Not Just Score: A compound with a marginally worse score but a perfect interaction with the kinase hinge region is often more promising than a high-scoring compound with suboptimal interactions.
The integration of artificial intelligence (AI) and machine learning (ML) for predicting protein-ligand binding affinity represents a paradigm shift in computational drug discovery, offering unprecedented speed and accuracy for identifying kinase inhibitors. Traditional structure-based methods like molecular docking, while valuable, are computationally expensive and time-consuming, creating a bottleneck in virtual screening campaigns [6] [55]. AI and ML models overcome these limitations by learning the complex relationships between molecular structures and their biological activities from existing data, enabling the ultra-fast screening of ultra-large chemical libraries [6] [56]. This capability is crucial within a pharmacophore-based virtual screening protocol for kinases, as it allows for the rapid prioritization of compounds that not only fit the pharmacophore model but are also predicted to bind strongly to the target kinase, thereby increasing the likelihood of identifying true hits.
AI-based binding affinity prediction methods can be broadly categorized into three groups: conventional scoring functions, traditional machine learning models, and modern deep learning approaches [55]. Conventional methods, often based on physics-based models or empirical equations, can be rigid and may only perform well for specific protein families. Traditional ML methods (e.g., Random Forest, Support Vector Machines) use human-engineered features from complex structures and have shown improved accuracy in scoring and ranking ligands. The field is now dominated by deep learning models, which require less manual feature engineering and can learn complex patterns directly from data, with performance scaling alongside the increasing volume of available structural and affinity data [55].
The table below summarizes the core approaches and their reported performance gains.
Table 1: Categories of Binding Affinity Prediction Methods
| Method Category | Key Features | Reported Performance / Advantage | Example Context |
|---|---|---|---|
| Conventional Scoring | Physics-based or empirical energy functions; rigid. | Works well for specific protein families. | Docking software scoring functions [55]. |
| Traditional Machine Learning | Uses human-engineered features from structures (e.g., interaction fingerprints, descriptors). | Improved scoring and ranking power over conventional methods. | Models trained on PDBbind data for general affinity prediction [55]. |
| Deep Learning | Minimal feature engineering; uses graph neural networks, 3D convolutional neural networks. | Dominates current state-of-the-art; performance increases with more data. | Graph neural networks for protein-ligand binding [55]. |
| Kinase-Specific AI (Kinhibit) | Integrates graph contrastive learning for inhibitors & protein language models for kinases. | 92.6% accuracy in predicting inhibitors for MAPK pathway kinases (RAF, MEK, ERK) [57]. | Kinase-inhibitor affinity prediction [57]. |
| ML-Accelerated Docking | ML model trained to approximate docking scores from 2D structures. | ~1000x faster than classical docking-based screening [6]. | Virtual screening for MAO inhibitors [6]. |
Specialized models have been developed for high-value target families like kinases. For instance, the Kinhibit framework demonstrates the power of integrating modern AI architectures, achieving 92.6% accuracy in predicting inhibitors for key kinases in the MAPK signaling pathway (RAF, MEK, ERK) by combining self-supervised graph learning for molecules with a structure-informed protein language model for the kinase targets [57]. For pure screening speed, an ML-based methodology that learns from docking results has been shown to predict binding energies ~1000 times faster than classical docking procedures, a critical advantage when scanning millions of compounds [6].
Detailed Experimental Protocol: An Integrated AI-Pharmacophore Workflow
This protocol details the steps for integrating an AI-based binding affinity prediction into a pharmacophore-guided virtual screening pipeline for kinase targets, synthesizing methodologies from recent literature [27] [6].
Stage 1: Data Preparation and Feature Engineering
- Curate a Kinase-Inhibitor Affinity Dataset: Assemble a training dataset with known binding affinities (e.g., Kd, Ki, IC50) for diverse kinase-inhibitor complexes. Public resources like PDBbind (which includes protein-protein and protein-ligand complexes) and BindingDB are essential starting points [55] [58].
- Featurize Inhibitor Molecules: Represent each small molecule inhibitor using numerical descriptors. Common choices include:
- Molecular Fingerprints: ECFP (Extended Connectivity Fingerprints) or similar topological fingerprints [6].
- Graph Representations: Represent the molecule as a graph with atoms as nodes and bonds as edges, suitable for Graph Neural Networks (GNNs) [57].
- 3D Structural Features: For structure-based models, calculate features from the 3D complex, such as interaction fingerprints, atomic densities, or surface properties [55].
- Featurize the Kinase Target:
- For sequence-based models, use the amino acid sequence, potentially leveraging pre-trained protein language models like ESM (Evolutionary Scale Modeling) [57].
- For structure-based models, use features derived from the kinase's 3D structure (e.g., from PDB ID 6YOJ for FAK1), focusing on the active site or ATP-binding pocket [27] [55].
Stage 2: Model Training and Validation
- Model Selection and Training: Choose an appropriate ML algorithm. For deep learning, architectures like Graph Neural Networks (GNNs) for the ligand and Convolutional Neural Networks (CNNs) for the protein structure are powerful. Train the model to map the input features (inhibitor + kinase) to the experimental binding affinity value [55] [57].
- Rigorous Validation: Validate the model using a strict train-test split to avoid overfitting. Use scaffold splitting (grouping molecules by their core Bemis-Murcko scaffold) to test the model's ability to generalize to novel chemotypes, which is critical for virtual screening [6]. Evaluate performance using metrics like Pearson's R (for scoring power) and Mean Square Error (MSE).
Stage 3: Integration with Pharmacophore Screening
- Generate a Pharmacophore Model: Based on a key kinase-inhibitor complex (e.g., FAK1-P4N from PDB:6YOJ), use a tool like Pharmit to identify critical pharmacophoric features (e.g., hydrogen bond donors/acceptors, hydrophobic regions, aromatic rings) [27].
- Virtual Screening of a Large Database: Screen a multi-million compound database (e.g., ZINC) using the validated pharmacophore model to filter for molecules that match the essential steric and electronic features [27] [6].
- Ultra-Fast AI Affinity Prediction: Pass the pharmacophore-matched hits directly to the trained AI model for binding affinity prediction. This step bypasses traditional docking for these compounds, leveraging the ~1000x speedup of ML-based prediction [6].
- Prioritization and Downstream Analysis: Rank the compounds based on their predicted binding affinity. Select the top-ranking compounds for further analysis, which may include more precise molecular docking, ADMET (Absorption, Distribution, Metabolism, Excretion, Toxicity) profiling, and finally, experimental validation [27].
Diagram 1: AI-Pharmacophore virtual screening workflow.
Table 2: Essential Resources for AI-Driven Binding Affinity Prediction
| Resource / Tool Name | Type | Primary Function in Workflow |
|---|---|---|
| ZINC Database | Compound Library | A vast database of commercially available compounds for virtual screening [27] [6]. |
| PDBbind | Curated Dataset | A comprehensive collection of protein-ligand complexes with experimental binding affinities for model training and testing [55] [58]. |
| BindingDB | Curated Dataset | A public database of measured binding affinities for drug targets, focusing on proteins with known small-molecule ligands [55]. |
| Pharmit | Software Tool | An interactive tool for pharmacophore modeling and virtual screening [27]. |
| Graph Neural Network (GNN) | Algorithm/Model | A deep learning architecture ideal for processing molecular graph structures to learn informative representations [57]. |
| Protein Language Model (e.g., ESM) | Algorithm/Model | A pre-trained deep learning model that generates informative representations from protein sequences, capturing evolutionary and structural information [57]. |
| Smina | Software Tool | A molecular docking software used to generate docking scores for training ML models [6]. |
The application of AI and ML for binding affinity prediction marks a transformative advancement in kinase drug discovery. By integrating these ultra-fast methods with well-established pharmacophore-based screening, researchers can construct a highly efficient and powerful computational pipeline. This integrated approach enables the rapid exploration of vast chemical spaces with high accuracy, significantly accelerating the identification of novel, potent, and selective kinase inhibitors for therapeutic development.
Within a comprehensive pharmacophore-based virtual screening protocol for kinase inhibitors, In Silico ADMET and Physicochemical Property Profiling serves as the critical gatekeeper. This step ensures that hits identified through structure-based virtual screening are not only potent but also possess developable drug-like properties, aligning with the industry's goal of reducing late-stage attrition due to poor pharmacokinetics or toxicity [59] [60]. For kinase-focused projects, this involves applying specific property filters informed by the successful historical profiles of approved kinase drugs [61]. The integration of Artificial Intelligence (AI) and Machine Learning (ML) has revolutionized this space, enabling the rapid, high-throughput prediction of complex properties directly from molecular structure, thus providing a powerful and efficient means to prioritize lead-like compounds early in the discovery pipeline [62] [63].
Core Property Panels for Kinase Inhibitor Profiling
Lead-likeness is evaluated against a panel of computed properties that forecast a molecule's absorption, distribution, metabolism, excretion, and toxicity (ADMET), as well as its fundamental physicochemical characteristics. The table below summarizes the key properties, their role in lead optimization, and kinase-specific considerations or target values.
Table 1: Essential Property Panel for Kinase Inhibitor Lead-Likeness Assessment.
| Property Category | Specific Property | Role in Lead-Likeness & Kinase-Specific Considerations |
|---|---|---|
| Physicochemical | Molecular Weight (MWt) | Impacts permeability and solubility. Approved kinase inhibitors show a trend; for example, an analysis of the first 30 FDA-approved kinase inhibitors informed developability criteria [61]. |
| Lipophilicity (LogP/LogD) | Critical for membrane permeability and off-target toxicity. Optimal ranges can be derived from retrospective analysis of successful drugs. | |
| Hydrogen Bond Donors (HBDH) | Influences absorption and permeability. The Rule of 5 suggests HBDH ≤5 [64]. | |
| Hydrogen Bond Acceptors (e.g., M_NO) | Affects permeability. The Rule of 5 suggests M_NO ≤10 [64]. | |
| ADME | Solubility | Aqueous solubility is crucial for oral bioavailability and can be predicted vs. pH [64]. |
| Metabolic Stability (e.g., CYP Inhibition) | Predicts drug-drug interaction potential and clearance. AI models can reliably predict human Cytochrome P450 inhibition [60]. | |
| Permeability (e.g., Caco-2) | Indicates intestinal absorption potential. Machine learning models like XGBoost provide accurate predictions for test sets [60]. | |
| Volume of Distribution (Vd) | Indicates the extent of tissue distribution. A key pharmacokinetic parameter for efficacy and dosing frequency [59]. | |
| Toxicity | Ames Test | Predicts mutagenic potential, a critical early safety liability [64]. |
| Drug-Induced Liver Injury (DILI) | Flags compounds with potential for severe hepatic toxicity [64]. |
Advanced frameworks, such as the ADMET Risk score, integrate multiple such properties into a single metric. This score uses "soft" thresholds calibrated against successful oral drugs, providing a weighted assessment of absorption risk (AbsnRisk), CYP-mediated metabolism risk (CYPRisk), and toxicity risk (TOX_Risk), offering a holistic view of a compound's developability [64].
Workflow and Experimental Protocols
Integrated Screening Workflow
The following diagram illustrates the typical integrated workflow for profiling compounds after the initial pharmacophore-based virtual screening, incorporating both property prediction and lead optimization cycles.
Detailed Protocol for AI/ML-Driven ADMET Profiling
Objective: To rapidly and accurately predict a comprehensive set of ADMET and physicochemical properties for thousands of virtual hit compounds to enable data-driven prioritization.
Materials & Software:
- Input Data: 2D structures of hit compounds (e.g., in SDF or SMILES format) from the previous virtual screening step.
- Software Platforms: AI/ML prediction tools such as ADMET Predictor [64], ADMETlab 3.0 [59] [60], or other validated in-house/commercial platforms.
- Computing Infrastructure: A standard desktop computer or high-performance computing cluster for larger libraries.
Procedure:
- Data Preparation: Compile the list of hit compounds from the pharmacophore screen into a single file. Standardize the structures (e.g., neutralize charges, remove duplicates) to ensure prediction consistency.
- Batch Property Calculation: Load the standardized structure file into the chosen prediction software. Configure the job to calculate the core property panel outlined in Table 1. For example:
- In ADMET Predictor, select the relevant modules (e.g., PCB for solubility/permeability, MET for metabolism, TOX for toxicity) to generate predictions for over 175 properties [64].
- For pharmacokinetic parameter prediction (e.g., Clearance, Vd), an LSTM-based ML framework can be employed, using ADME and physicochemical descriptors as input, as demonstrated in recent research [59].
- Data Aggregation and Analysis: Export the results into a structured database or spreadsheet. Calculate composite scores like the ADMET Risk score [64] to rank compounds.
- Lead-Likeness Filtering: Apply predefined filters based on the target product profile. For instance, a common first-pass filter is the "Rule of 5" (violations ≤1). Further refinement can use kinase-informed thresholds from analyses of approved drugs [61].
- Visualization and Triaging: Use the software's built-in visualization tools (e.g., 2D/3D scatter plots, distribution charts) to identify trends, outliers, and structure-property relationships (SPR) among the compound set.
Protocol for AI-Driven Lead Optimization
Objective: To rationally design new compounds with improved ADMET profiles while maintaining potency, particularly for hits that failed initial lead-likeness criteria.
Materials & Software:
- Generative AI Software: Platforms like ADMETrix, which combines the REINVENT generative model with a geometric deep learning architecture (ADMET AI) for multi-parameter optimization [63].
Procedure:
- Identify Optimization Goals: Select one or more ADMET properties for improvement (e.g., reduce Ames mutagenicity alert, improve solubility).
- Configure the Generative Model: In the ADMETrix framework, set the desired objectives for the generative process. This includes specifying the target profile for the properties to be optimized and defining the pharmacophoric features that must be preserved to maintain binding to the kinase target [63].
- Run De Novo Generation: Execute the model to generate novel, synthetically accessible molecules. The AI operates in real-time, proposing structures that balance the multiple constraints.
- Validate and Iterate: Profile the newly generated compounds using the standard ADMET prediction protocols (Section 3.2). The most promising candidates, often resulting from successful scaffold hopping to reduce toxicity, can then be advanced for synthesis and experimental validation [63].
The Scientist's Toolkit: Research Reagent Solutions
Table 2: Essential Computational Tools for In Silico ADMET Profiling.
| Tool Name | Type | Primary Function in Profiling |
|---|---|---|
| ADMET Predictor [64] | Standalone AI/ML Software | Flagship platform for predicting a wide array (>175) of physicochemical, ADME, and toxicity properties; includes PBPK simulation and ADMET Risk scoring. |
| ADMETlab 3.0 [59] [60] | Online Platform | Provides comprehensive ADMET property prediction, and was used to generate descriptors for successful LSTM-based PK profile prediction. |
| ADMETrix [63] | Generative AI Framework | Enables de novo molecular generation optimized for multiple ADMET endpoints, ideal for lead optimization and scaffold hopping. |
| Deep-PK [62] | AI Platform for PK | Utilizes graph-based descriptors and multitask learning for predicting pharmacokinetic parameters. |
| pkCSM [60] | Prediction Tool | Employs graph-based signatures to predict pharmacokinetic and toxicity properties of small molecules. |
Concluding Remarks
Integrating robust in silico ADMET and physicochemical property profiling is a non-negotiable step in a modern kinase inhibitor discovery program. By leveraging AI-powered predictive models and established lead-likeness principles, researchers can efficiently triage virtual hits, focus synthetic efforts on the most promising chemical series, and proactively design out potential liabilities. This data-driven approach significantly de-risks the candidate selection process, increasing the probability of advancing high-quality, developable kinase inhibitors into preclinical development.
Pharmacophore-based virtual screening (PBVS) has emerged as a powerful computational strategy in modern drug discovery, enabling the rapid identification of novel therapeutic agents from vast chemical libraries. This approach is defined by the International Union of Pure and Applied Chemistry (IUPAC) as "the ensemble of steric and electronic features that is necessary to ensure the optimal supramolecular interactions with a specific biological target structure and to trigger (or to block) its biological response" [2]. In oncology research, PBVS has proven particularly valuable for targeting kinase families, including c-Src and Janus kinases (JAKs), which are critically implicated in cancer progression, metastasis, and treatment resistance [12] [65] [66]. This case study examines the specific application of PBVS protocols for identifying novel c-Src and JAK kinase inhibitors with demonstrated anticancer potential, providing detailed experimental frameworks for research implementation.
Theoretical Background: Pharmacophore Modeling and Kinase Targets
Pharmacophore Modeling Fundamentals
Pharmacophore models abstract the key molecular interaction capacities of bioactive compounds into a set of three-dimensional features rather than specific chemical groups [2]. These features typically include hydrogen bond donors (HBDs), hydrogen bond acceptors (HBAs), hydrophobic regions (Hs), aromatic rings (ARs), and charged groups [67]. Two primary approaches are employed in model generation:
- Structure-based pharmacophore modeling: Utilizes three-dimensional structural information from protein-ligand complexes (e.g., from X-ray crystallography or NMR) to extract essential interaction patterns between the target and bound ligands [67] [2].
- Ligand-based pharmacophore modeling: Derives common chemical features from a set of known active compounds that interact with the same biological target, particularly useful when structural target information is limited [67] [2] [25].
High-quality pharmacophore models undergo rigorous validation using datasets containing both active and inactive molecules, with metrics such as enrichment factor, specificity, sensitivity, and ROC-AUC analysis employed to evaluate model performance before prospective application [67].
c-Src and JAK Kinases as Therapeutic Targets in Cancer
c-Src Kinase: A non-receptor tyrosine kinase belonging to the Src-family kinases (SFKs), c-Src is commonly overexpressed in numerous cancers and plays a critical role in regulating proliferation, differentiation, migration, and angiogenesis [12] [68]. Its hyperactivation results in abnormal cell activity that promotes cancer development, with high expression levels correlating with poor overall survival prognosis [68]. Challenges in targeting c-Src include its high structural homology to other kinases, involvement of compensatory pathways, and toxicity and resistance issues with available inhibitors [12].
JAK Kinases: The Janus kinase family comprises four members (JAK1, JAK2, JAK3, and TYK2) that mediate signaling through the JAK-STAT pathway, which regulates crucial cellular processes including proliferation, apoptosis, inflammation, and differentiation [65] [66]. Dysregulation of this pathway has been implicated in various cancers, with constitutive activation promoting tumor growth, metastasis, and immune evasion [65] [66]. JAK inhibitors have shown significant clinical efficacy, but limitations including opportunistic infections, acquired drug resistance, and thromboembolic complications underscore the need for next-generation inhibitors [66].
Case Study 1: Pharmacophore-Based Identification of Novel c-Src Inhibitors
A recent study employed a comprehensive PBVS approach to identify novel c-Src kinase inhibitors with anticancer potential [12] [20]. The research aimed to address the critical gap in selective c-Src inhibition, overcoming issues of toxicity, resistance, and non-selectivity associated with existing inhibitors. The investigation implemented a multi-tier screening protocol encompassing pharmacophore modeling, high-throughput virtual screening (HTVS), molecular docking, molecular dynamics (MD) simulations, and biological validation.
Experimental Protocol
Table 1: Key Research Reagents and Computational Tools for c-Src Inhibitor Identification
| Category | Specific Tool/Resource | Application in Workflow |
|---|---|---|
| Chemical Libraries | ChemBridge Commercial Library (~500,000 compounds) | Primary screening database for virtual screening |
| Computational Software | Structure-Based Pharmacophore Modeling | Identification of essential c-Src binding features |
| ADME Prediction Tools | In silico pharmacokinetics analysis | |
| Molecular Docking Programs | Binding pose prediction and affinity estimation | |
| Molecular Dynamics (MD) Simulation Software (200 ns) | Binding stability validation under dynamic conditions | |
| Biological Assays | Cell-based Viability Assays (CCK-8) | Anticancer potential evaluation in cancer cell lines |
| Kinase Activity Assays | c-Src-mediated kinase inhibition (IC50 determination) | |
| Oxidative Stress and Apoptosis Assays | Mechanism of action studies |
Virtual Screening Workflow
The PBVS protocol implemented for c-Src inhibitor identification followed a sequential filtering approach:
Pharmacophore Model Development: A structure-based pharmacophore model was generated using c-Src kinase structural information to define essential steric and electronic features required for binding [12].
High-Throughput Virtual Screening (HTVS): The developed pharmacophore model was screened against approximately 500,000 small molecules from the ChemBridge commercial library to identify compounds mapping the key pharmacophore features [12] [20].
ADME Profiling: Top-ranking virtual hits from HTVS were subjected to in silico Absorption, Distribution, Metabolism, and Excretion (ADME) analysis to filter compounds with unfavorable pharmacokinetic properties [12].
Molecular Docking: Compounds passing ADME screening were docked into the c-Src kinase binding site, with selection of 29 best-docked molecules based on docking scores representing computational binding affinity [12] [20].
Visual Inspection and Complex-Based Refinement: Detailed analysis of protein-ligand interactions refined the selection to four top candidates (compounds 5280699, 9797370, 11200016, and 71736582) demonstrating optimal interactions at the c-Src kinase binding site [12].
Molecular Dynamics (MD) Simulations: To validate optimal binding, 200 ns MD simulations were performed on the four selected protein-ligand complexes, revealing exceptional stability for compounds 11200016 and 71736582 at the c-Src kinase binding site [12] [20].
Biological Validation Methods
The top computational hit (compound 71736582) underwent comprehensive biological evaluation:
- Anticancer Activity Profiling: Cytotoxicity assessment across multiple cancer cell lines including A549 (lung), MDAMB-231 (breast), HCT-116 (colorectal), DU-145 and PC-3 (prostate) using cell viability assays [12].
- Kinase Inhibition Assay: Evaluation of c-Src-mediated kinase activity inhibition, with IC50 determination compared to positive control bosutinib [12] [20].
- Mechanistic Studies: Investigation of oxidative stress induction and apoptosis activation in colorectal cancer cells to elucidate the compound's mechanism of action [12].
Results and Key Findings
Table 2: Experimental Results for Identified c-Src Inhibitors
| Compound ID | Docking Score | MD Simulation Stability | Cancer Cell Line Activity | c-Src Kinase IC50 | Key Mechanisms |
|---|---|---|---|---|---|
| 71736582 | Top-ranked | Exceptionally stable (200 ns) | Potent activity across A549, MDAMB-231, HCT-116, DU-145, PC-3 | 517 nM | Increased oxidative stress, induced apoptosis |
| 11200016 | High-ranked | Exceptionally stable (200 ns) | Data not fully reported | Data not fully reported | Data not fully reported |
| 9797370 | High-ranked | Stable | Data not fully reported | Data not fully reported | Data not fully reported |
| 5280699 | High-ranked | Stable | Data not fully reported | Data not fully reported | Data not fully reported |
| Bosutinib (Control) | N/A | N/A | Reference activity | 408 nM | Reference mechanism |
The PBVS approach successfully identified compound 71736582 as a promising c-Src inhibitor lead, demonstrating excellent anticancer potential across various cancer cell lines [12]. The compound inhibited c-Src-mediated kinase activity with an IC50 of 517 nM, comparable to the positive control bosutinib (IC50: 408 nM) [12] [20]. Additionally, the compound induced oxidative stress and apoptosis in colorectal cancer cells, confirming its potential as a therapeutic candidate for further development [12].
Case Study 2: Pharmacophore-Based Discovery of JAK Kinase Inhibitors
Complementary studies have applied PBVS methodologies to identify novel JAK kinase inhibitors, particularly focusing on overcoming limitations of currently approved JAK inhibitors, including opportunistic infections, acquired drug resistance, and thromboembolic complications [66]. Research in this area has explored both synthetic compounds and natural products derived from Traditional Chinese Medicine (TCM) with the goal of identifying inhibitors with enhanced therapeutic safety profiles [66].
Experimental Protocol
JAK Pharmacophore Model Development
For JAK inhibitor discovery, both structure-based and ligand-based pharmacophore modeling approaches have been successfully implemented:
- Structure-Based (SB) Modeling: Utilized crystallographic data of JAK kinases (JAK1, JAK2, JAK3, TYK2) from the Protein Data Bank to identify key binding site features and interaction patterns [25].
- Ligand-Based (LB) Modeling: Derived common pharmacophore features from known JAK inhibitors, including approved drugs (tofacitinib, baricitinib) and experimental compounds, to generate hypotheses based on shared molecular interaction capacities [25].
A recent study generated multiple optimized pharmacophore models for comprehensive JAK inhibition profiling: eight models for JAK1 (4 SB + 4 LB), ten for JAK2 (2 SB + 8 LB), ten for JAK3 (3 SB + 7 LB), and nine for TYK2 (3 SB + 6 LB) [25]. These models incorporated hydrogen bond donors (HBDs), hydrogen bond acceptors (HBAs), aromatic interactions (AIs), hydrophobic contacts (HCs), residue bonding points (RBPs), and exclusion volumes (Xvols) to represent the essential steric and electronic features for JAK binding [25].
Virtual Screening and Validation Workflow
The implemented screening protocol for JAK inhibitors included:
- Database Screening: Application of JAK pharmacophore models to screen extensive compound libraries, including natural product databases and synthetic chemical collections [66] [25].
- ROCS and EON 3D Similarity Searching: Implementation of shape-based and electrostatic similarity searching to identify compounds with three-dimensional similarity to known JAK inhibitors [25].
- Molecular Docking: Docking of virtual hits into JAK kinase domains to predict binding modes and affinities [65] [69].
- QSAR-ML Models: Development of quantitative structure-activity relationship models with machine learning (e.g., eXtreme Gradient Boosting/XGB) to predict cytotoxic potency of identified hits [69].
- Biological Validation: Experimental testing of virtual hits for JAK inhibitory activity, anticancer effects, and mechanism of action.
Biological Assay Methods
Experimentally confirmed JAK inhibitors underwent comprehensive biological characterization:
- Kinase Inhibition Assays: Direct measurement of JAK kinase activity inhibition using enzymatic assays with IC50 determination for specific JAK subtypes [65] [69].
- Cell-Based Viability Assays: Evaluation of cytotoxicity against cancer cell lines (e.g., HeLa cervical cancer cells, breast cancer lines MDA-MB-231 and MDA-MB-468) using CCK-8 and similar assays [65] [69].
- Western Blot Analysis: Assessment of JAK-STAT pathway inhibition by measuring phosphorylation levels of JAK1, JAK2, STAT1, and STAT3 [65].
- Apoptosis and Cell Cycle Analysis: Flow cytometry evaluation of apoptosis induction and cell cycle arrest in treated cancer cells [65] [69].
- Migration Assays: Investigation of anti-metastatic potential through wound healing assays to measure inhibition of tumor cell migration [65].
Results and Key Findings
Table 3: Experimentally Validated JAK Inhibitors Identified Through PBVS Approaches
| Compound Name/ID | Chemical Class | JAK Subtype Specificity | IC50 Value | Cancer Model Activity | Key Mechanisms |
|---|---|---|---|---|---|
| Chalcone-9 | Chalcone derivative | JAK1, JAK2 | Not specified | Triple-negative breast cancer (MDA-MB-231, MDA-MB-468) | Inhibited JAK-STAT activation, suppressed STAT target genes, induced apoptosis, reduced migration |
| FCC90 | Furochochicine derivative | JAK2 | 9.10-27.34 nM | HeLa cervical cancer cells | Induced apoptosis, sub-G1 cell cycle arrest |
| FCC6 | Furochochicine derivative | JAK2 | 9.10-27.34 nM | HeLa cervical cancer cells | Induced apoptosis, sub-G1 cell cycle arrest |
| FCC27 | Furochochicine derivative | JAK2 | 9.10-27.34 nM | HeLa cervical cancer cells | Induced apoptosis, sub-G1 cell cycle arrest |
| Igalan | Sesquiterpene | JAK1 | <5 μM | Atopic dermatitis models | Downregulated IL-4Rα and IL-13Rα, attenuated JAK1-STAT3 signaling |
| Isobavachalcone | Isoflavonoid | JAK1 | <20 μM | Rheumatoid arthritis models | Inhibited PI3K-AKT and JAK1-STAT3 pathways |
PBVS approaches have successfully identified diverse JAK inhibitors from both synthetic and natural sources. Chalcone-9, a novel chalcone derivative, demonstrated significant anti-cancer activity particularly against triple-negative breast cancer (TNBC) cells by effectively inhibiting JAK-STAT pathway activation and promoting apoptosis [65]. In a separate study, furochochicine derivatives (FCC6, FCC27, FCC90) exhibited potent JAK2 inhibition with IC50 values ranging from 9.10 to 27.34 nM, surpassing the reference inhibitor ruxolitinib in potency [69]. Natural products including Igalan and Isobavachalcone have also shown promising JAK1 inhibitory activity, highlighting the chemical diversity achievable through PBVS approaches [66].
Integrated Discussion and Protocol Recommendations
Comparative Analysis of c-Src and JAK PBVS Applications
The case studies demonstrate how PBVS strategies can be tailored to specific kinase targets while maintaining a consistent overall framework. For both c-Src and JAK kinases, the integration of structure-based and ligand-based approaches yielded successful identification of novel inhibitors, though with target-specific adaptations in model development and screening protocols. The c-Src study emphasized structural stability validation through extended MD simulations (200 ns), while the JAK investigations incorporated advanced machine learning approaches (QSAR-ML) for potency prediction [12] [69]. Both approaches demonstrated the value of multi-tier screening workflows with sequential filtering steps to manage large chemical libraries efficiently.
Signaling Pathways and Therapeutic Implications
The therapeutic significance of targeting c-Src and JAK kinases stems from their central roles in oncogenic signaling networks. c-Src promotes cancer progression through regulation of proliferation, angiogenesis, invasion, and migration, with hyperactivation leading to abnormal cellular behavior that drives malignancy [68]. JAK kinases mediate critical cytokine signaling through the JAK-STAT pathway, which when dysregulated contributes to tumor growth, metastasis, immune evasion, and treatment resistance [65] [66]. Dual inhibitors targeting both pathways have also been explored, as exemplified by quinazolinone-based compounds demonstrating simultaneous STAT-3 and c-Src inhibitory activity [70].
Recommended Standardized PBVS Protocol for Kinase Inhibitor Discovery
Based on the successful applications documented in the case studies, the following standardized PBVS protocol is recommended for kinase inhibitor discovery:
Target Analysis and Dataset Curation
- Collect high-quality structural data for target kinase (X-ray complexes, homology models)
- Curate comprehensive datasets of known active and inactive compounds for model training and validation
- Define appropriate decoy sets for virtual screening performance assessment
Pharmacophore Model Development
- Implement both structure-based and ligand-based modeling approaches
- Generate multiple hypothesis models to capture diverse binding modalities
- Validate models using enrichment calculations and ROC-AUC analysis
Virtual Screening Implementation
- Screen large, diverse chemical libraries (commercial databases, natural product collections, in-house repositories)
- Apply sequential filtering: pharmacophore mapping, ADME prediction, molecular docking
- Use consensus scoring approaches to prioritize virtual hits
Computational Validation
- Perform molecular dynamics simulations to assess binding stability
- Apply machine learning QSAR models for potency prediction
- Conduct binding mode analysis and interaction profiling
Experimental Confirmation
- Prioritize top computational hits for synthesis or procurement
- Implement kinase activity assays for direct target engagement confirmation
- Conduct cell-based viability assays across relevant cancer models
- Perform mechanism of action studies (apoptosis, cell cycle, migration, pathway analysis)
This standardized protocol provides a robust framework for PBVS implementation while allowing target-specific adaptations to address unique characteristics of different kinase families.
This case study demonstrates the powerful application of pharmacophore-based virtual screening for identifying novel c-Src and JAK kinase inhibitors with significant anticancer potential. The documented protocols highlight the efficiency of PBVS in navigating large chemical spaces to identify promising lead compounds, with successful outcomes validated through comprehensive biological testing. The integrated computational and experimental workflows presented provide researchers with detailed methodological roadmaps for implementation in kinase drug discovery programs. As PBVS methodologies continue to evolve with advances in machine learning, structural biology, and computing power, their impact on oncology drug discovery is poised to expand, offering accelerated paths to novel therapeutic agents for cancer treatment.
Overcoming Common Pitfalls and Enhancing Screening Performance
Addressing Limitations in Scoring Functions and High False Positive Rates
Virtual screening (VS) has become an indispensable computational technique in early drug discovery, used to identify potential hit compounds from large chemical libraries by predicting their ability to bind to a specific biological target, typically an enzyme or receptor [71]. For kinase targets, which represent a therapeutically important protein family, structure-based virtual screening—particularly through molecular docking—is widely applied. However, the accuracy of these methods is frequently compromised by fundamental limitations in current scoring functions, which often lead to high rates of false positives and negatives [72]. These scoring functions, which aim to predict binding affinity, struggle with accurate rank-ordering of docked poses and often misidentify non-binding compounds as hits, thereby reducing the efficiency and success rate of kinase inhibitor discovery campaigns [72].
Pharmacophore-based approaches provide a powerful strategy to mitigate these limitations. A pharmacophore is defined as "the ensemble of steric and electronic features that is necessary to ensure the optimal supra-molecular interactions with a specific biological target structure and to trigger (or to block) its biological response" [5]. By incorporating explicit chemical feature constraints and spatial relationships derived from known active compounds or protein structures, pharmacophore models serve as effective filters to enhance the selectivity of virtual screening workflows, reducing false positives and improving the enrichment of truly active kinase inhibitors [5] [67].
Strategic Approaches for Mitigation
Multiple complementary strategies can be employed to address scoring function limitations and high false positive rates in virtual screening for kinase inhibitors. The table below summarizes the most effective approaches:
Table 1: Strategies for Addressing Scoring Function Limitations and False Positives
| Strategy | Methodological Approach | Key Advantage | Application Context |
|---|---|---|---|
| Integrated Pharmacophore Filtering | Using structure-based or ligand-based pharmacophore models as post-docking filters [5]. | Eliminates compounds with favorable scores but incorrect interaction patterns. | When binding site topology or known active ligands are available. |
| Machine Learning Scoring | Training ML models on docking results or experimental data to predict binding affinity [6]. | Faster predictions (1000x acceleration reported) and better generalization [6]. | Large compound libraries requiring rapid screening. |
| Multi-Level Docking & Consensus Scoring | Applying different scoring functions or hierarchical docking protocols [72]. | Reduces bias from any single scoring function. | Initial screening phases with diverse chemical libraries. |
| Binding Mode Validation with MD | Using molecular dynamics simulations to assess binding pose stability [73] [74]. | Identifies and eliminates false positives with unstable binding modes. | Lead optimization stages for prioritization. |
| ADMET Integration | Incorporating absorption, distribution, metabolism, excretion, and toxicity prediction early in screening [74] [75]. | Filters compounds with poor drug-likeness or potential toxicity. | All screening stages to maintain drug-like properties. |
The integration of e-pharmacophore modeling, which extracts pharmacophore features directly from protein-ligand complex interaction energies, has shown particular promise for kinase targets. This approach was successfully implemented in identifying novel Calcium-dependent protein kinase 1 (CDPK1) inhibitors, where it helped prioritize compounds with appropriate interaction patterns in the ATP-binding pocket [73]. Similarly, pharmacophore-constrained screening combined with machine learning demonstrated significantly improved efficiency in identifying monoamine oxidase inhibitors, achieving 1000-times faster binding energy predictions than classical docking-based screening while maintaining accuracy [6].
Experimental Protocols
Integrated Pharmacophore-Based Virtual Screening Protocol
This protocol describes a comprehensive workflow for kinase inhibitor identification that combines structure-based pharmacophore modeling with virtual screening to minimize false positives.
Table 2: Research Reagent Solutions for Pharmacophore-Based Virtual Screening
| Research Reagent | Function in Protocol | Example Software/Tools |
|---|---|---|
| Protein Structure Preparation | Corrects PDB file issues, adds hydrogens, optimizes H-bonding. | Protein Preparation Wizard [73], VHELIBS [71] |
| Ligand Structure Preparation | Generates 3D conformers, corrects protonation states. | LigPrep [71], OMEGA [71], RDKit [71] |
| Pharmacophore Modeling | Creates 3D pharmacophore hypotheses from structure or ligands. | Discovery Studio [67], LigandScout [67], MOE [76] |
| Virtual Screening | Screens compound libraries against pharmacophore models. | MOE [76], ZINC database [6] |
| Molecular Docking | Performs structure-based docking of filtered compounds. | Smina [6], Molecular Operating Environment |
| Binding Affinity Estimation | Calculates binding free energies of protein-ligand complexes. | MM-GBSA [73], MM-PBSA |
| Molecular Dynamics | Assesses binding complex stability over time. | GROMACS, AMBER, NAMD |
Procedure:
Protein Preparation:
- Obtain the three-dimensional structure of your target kinase from the Protein Data Bank (PDB) [5] [67]. For kinases without experimental structures, utilize homology modeling or AlphaFold2 predicted structures [5].
- Prepare the protein structure using specialized software to add hydrogen atoms, assign appropriate protonation states to residues (especially those in the active site), and correct any structural anomalies [73].
- Validate structure quality, focusing on the binding site region, using tools like VHELIBS to check for proper atom placement and electron density interpretation [71].
Structure-Based Pharmacophore Model Generation:
- Define the ligand-binding site, focusing on the ATP-binding pocket or allosteric sites of interest for your kinase target. This can be done through co-crystallized ligand coordinates, known catalytic residues, or binding site detection tools [5].
- Generate pharmacophore features based on interactions between the kinase and a known inhibitor, or from the binding site topology itself. Key features for kinases often include hydrogen bond donors/acceptors, hydrophobic regions, and aromatic interactions [5] [67].
- Select essential features that contribute significantly to binding energy and are conserved across known active compounds. Incorporate exclusion volumes to represent steric constraints of the binding pocket [5] [67].
- Validate the model using datasets of known active and inactive compounds, calculating enrichment factors and other quality metrics to ensure discriminatory power [67].
Compound Library Preparation:
- Select appropriate compound libraries for screening (e.g., ZINC, Enamine, in-house collections) [71] [73].
- Prepare 2D compound structures by standardizing structures, removing duplicates, and eliminating compounds with undesirable functional groups [71].
- Generate 3D conformations for each compound using conformer generator software such as OMEGA or RDKit's distance geometry algorithm. Ensure adequate conformational sampling to represent the bioactive conformation space [71].
- Generate relevant protonation states and tautomers for each compound at physiological pH (7.4) to ensure chemical completeness [71].
Pharmacophore-Based Virtual Screening:
- Use the validated pharmacophore model as a 3D query to screen the prepared compound library [76].
- Employ pharmacophore search protocols in software such as MOE, which report conformations that satisfy the pharmacophore features as hits [76].
- Collect compounds that successfully map to the essential pharmacophore features in a separate database for further analysis [76].
Post-Pharmacophore Filtering:
- Apply drug-likeness filters such as Lipinski's Rule of Five to eliminate compounds with poor pharmacokinetic potential [75].
- Use ADMET prediction tools to assess absorption, distribution, metabolism, excretion, and toxicity properties, further refining the hit list [74] [75].
- For kinase targets, apply additional scaffold filters to ensure chemical diversity or focus on specific chemotype preferences.
Molecular Docking and Binding Assessment:
- Perform molecular docking of the pharmacophore-filtered compounds into the kinase binding site using preferred docking software [73].
- Analyze docking poses to ensure they maintain the key interactions defined in the pharmacophore model.
- Re-rank docking hits using consensus scoring or more computationally intensive binding free energy methods such as MM-GBSA to improve prioritization [73] [74].
Validation with Molecular Dynamics:
- Subject top-ranked complexes to molecular dynamics simulations (typically 50-100 ns) to assess binding stability, interaction persistence, and complex flexibility [73] [74].
- Analyze root-mean-square deviation (RMSD), root-mean-square fluctuation (RMSF), hydrogen bonding patterns, and interaction energy to identify the most promising stable candidates [77] [74].
Diagram 1: Pharmacophore-enhanced virtual screening workflow
Machine Learning-Accelerated Protocol with Pharmacophore Constraints
This protocol leverages machine learning to dramatically accelerate virtual screening while maintaining pharmacophore-based constraints to ensure interaction specificity for kinase targets.
Procedure:
Training Set Curation:
- Collect known kinase inhibitors with experimental activity data (IC₅₀, Kᵢ) from public databases such as ChEMBL [6] or BindingDB [71].
- Generate docking scores for these compounds against your target kinase using preferred docking software [6].
- Curate diverse chemical structures representing multiple chemotypes to ensure model generalizability.
Pharmacophore Model Implementation:
Machine Learning Model Training:
- Compute molecular descriptors and fingerprints for all compounds in the training set [6].
- Train ensemble machine learning models (e.g., random forest, gradient boosting) to predict docking scores based on the molecular features [6].
- Validate model performance using appropriate data splitting strategies (e.g., scaffold-based splitting) to assess predictive capability for novel chemotypes [6].
High-Throughput Screening:
- Apply the trained ML model to score compounds in the pharmacophore-constrained library, achieving significantly faster throughput compared to classical docking [6].
- Select top-ranked compounds based on predicted scores for further analysis.
Experimental Validation:
Application Notes for Kinase Inhibitor Research
Kinase-Specific Considerations
Kinase targets present specific challenges and opportunities for pharmacophore-based virtual screening. The highly conserved ATP-binding site across kinase families can lead to selectivity challenges, but specific structural features can be exploited:
Gatekeeper Residue: The size and nature of the gatekeeper residue significantly impact inhibitor selectivity. Small gatekeeper residues (e.g., glycine in CpCDPK1) increase accessibility to a hydrophobic pocket and susceptibility to a wider range of inhibitor compounds [73]. Pharmacophore models should account for this region with appropriate hydrophobic features.
DFG Motif Conformation: Kinases exist in multiple conformational states (DFG-in/DFG-out). Ensure the protein structure and resulting pharmacophore model reflect the desired inhibition mechanism [5].
Specificity Pocket: Some kinases contain unique subpockets near the ATP-binding site that can be targeted for selectivity. Structure-based pharmacophore models can explicitly represent features for these regions [5].
Success Metrics and Validation
When implementing these protocols, track the following metrics to assess improvement over traditional virtual screening:
- Enrichment Factor (EF): Measure the enrichment of known active compounds in the virtual hit list compared to random selection [67].
- Hit Rate: Calculate the percentage of tested virtual screening hits that show actual activity in experimental assays. Pharmacophore-based VS typically achieves hit rates of 5-40%, significantly higher than the <1% rates often seen with random selection [67].
- Scaffold Diversity: Assess the chemical diversity of identified hits to ensure discovery of novel chemotypes rather than analogs of known inhibitors.
- Selectivity Ratio: For kinase targets, evaluate the selectivity of hits against related kinases to identify specific versus promiscuous inhibitors.
The integration of pharmacophore-based approaches with advanced computational methods represents a powerful strategy to overcome fundamental limitations in virtual screening for kinase drug discovery. By implementing these protocols, researchers can significantly reduce false positive rates and identify novel, promising kinase inhibitors with higher efficiency and success rates.
Optimizing Structural Filtration and Handling Protein Flexibility
In the context of pharmacophore-based virtual screening (PBVS) for kinase inhibitor discovery, managing the structural aspects of both the ligand and the target is paramount for success. Structural filtration refers to the process of removing compounds with unfavorable properties—such as inappropriate size, undesirable functional groups, or an inability to form key interactions—from virtual compound libraries before screening [78]. Concurrently, handling protein flexibility addresses the challenge that proteins, including kinase targets, are dynamic entities whose binding sites can adopt multiple conformations. A pharmacophore model derived from a single, rigid protein structure may fail to identify ligands that bind to alternative conformations, potentially missing valuable lead compounds [52].
This Application Note details protocols for implementing advanced structural filtration techniques and for incorporating protein flexibility into pharmacophore models. These methods are designed to enhance the efficiency and hit rates of virtual screening campaigns focused on kinase targets, which are a critically important drug family for diseases ranging from cancers to inflammatory disorders [79].
Theoretical Background and Key Concepts
The Pharmacophore Hypothesis in Kinase Research
A pharmacophore is defined as "the ensemble of steric and electronic features that is necessary to ensure the optimal supramolecular interactions with a specific biological target structure and to trigger (or to block) its biological response" [5]. In practical terms, it abstracts key interaction points—such as hydrogen bond donors (HBDs), hydrogen bond acceptors (HBAs), hydrophobic areas (H), and positively/negatively ionizable groups (PI/NI)—from active ligands or a protein binding site into a three-dimensional arrangement [5] [80].
For kinases, which often have deep, hydrophobic ATP-binding pockets flanked by key polar residues, pharmacophore models frequently feature hydrogen bond donors and acceptors to mimic adenosine-triphosphate (ATP) interactions, coupled with hydrophobic features to capture selectivity [79].
The Critical Role of Structural Filtration and Flexibility
Virtual screening of large compound libraries is computationally intensive. Structural filtration streamlines this process by applying knowledge-based rules to pre-filter the library, removing compounds that are unlikely to be drug-like or to fit the target's binding site, thereby enriching the candidate pool with molecules that have a higher probability of being active [78].
Ignoring protein flexibility is a major source of failure in structure-based virtual screening. A pharmacophore model generated from a single protein conformation represents only one snapshot of the binding site's functional landscape [52]. Kinases are particularly dynamic, often sampling "DFG-in" and "DFG-out" conformations, among others. A model that incorporates multiple conformational states is more likely to identify diverse chemotypes with genuine biological activity.
Table 1: Key Protein Kinase Inhibitors Mentioned in this Protocol and Their Clinical Context
| Kinase Inhibitor | Primary Target(s) | Clinical Indication(s) | Relevance to Flexibility |
|---|---|---|---|
| Sunitinib [81] | VEGFRs, PDGFRs, c-Kit [81] | Renal Cell Carcinoma [81] | Resistance linked to dynamic bypass signaling pathways [81]. |
| Imatinib [79] | Bcr-Abl, c-Kit [79] | Chronic Myelogenous Leukemia (CML) [79] | Classic example of binding to a specific DFG-out conformation. |
| Tofacitinib [82] [79] | JAK1/JAK3 [82] [79] | Rheumatoid Arthritis, Inflammatory Diseases [82] [79] | Subject to Therapeutic Drug Monitoring (TDM) due to exposure-variability [82]. |
| Cabozantinib [81] [79] | VEGFR2, c-Met [81] [79] | Renal Cell Carcinoma [81] | Used to counteract resistance via bypass activation (e.g., c-Met) [81]. |
Experimental Protocols
Protocol 1: Advanced Structural Filtration for Kinase-Focused Libraries
This protocol outlines a multi-step filtration process to prepare a compound library for kinase-targeted PBVS.
1. Principle: To remove compounds with unfavorable physicochemical properties, structural alerts, and insufficient complementarity to the kinase's pharmacophoric feature geometry, thereby improving screening efficiency.
2. Materials and Software:
- A database of small molecules (e.g., ZINC database, in-house compound collection).
- Cheminformatics software (e.g., MOE, Schrodinger's Suite, RDKit).
- A validated pharmacophore model for the kinase target of interest.
3. Procedure: Step 1: Apply Drug-Like and Lead-Like Filters.
- Filter the raw compound library using rules such as:
- Lipinski's Rule of Five (Molecular Weight ≤ 500, Log P ≤ 5, HBD ≤ 5, HBA ≤ 10) to ensure oral bioavailability. Note that many kinase inhibitors (39 out of 85 FDA-approved) violate at least one of these rules, so this filter should be applied judiciously [79].
- "Lead-Like" Filters (e.g., Molecular Weight < 350, Log P < 3) to focus on compounds with optimization potential.
Step 2: Remove Undesirable Functionalities.
- Screen and eliminate compounds containing reactive or toxic functional groups (e.g., aldehydes, reactive esters, Michael acceptors, pan-assay interference compounds (PAINS)).
Step 3: Pharmacophore-Based Pre-Screening.
- Using the core features of your kinase pharmacophore model (e.g., two key hydrogen bond features from the kinase's "hinge region"), perform a rapid, loose 3D search of the filtered library.
- Retain only compounds that match this minimal set of essential features. This step pre-enriches the library with molecules capable of making the fundamental interactions required for kinase binding.
Step 4: Final Library Preparation.
- Generate credible, low-energy 3D conformations for the remaining compounds.
- Output the final, filtered library in a format suitable for the subsequent high-resolution PBVS.
Protocol 2: Incorporating Protein Flexibility into Pharmacophore Modeling
This protocol describes a structure-based approach to create a comprehensive pharmacophore model that accounts for kinase flexibility.
1. Principle: To generate an ensemble of pharmacophore models derived from multiple, distinct protein conformations, which can be used collectively or merged into a unified "merged pharmacophore" model for more robust virtual screening.
2. Materials and Software:
- Multiple 3D structures of the target kinase from the PDB (e.g., www.rcsb.org) [5], preferably co-crystallized with different ligands or in different conformational states (e.g., DFG-in/out, αC-helix in/out).
- Software capable of structure-based pharmacophore generation (e.g., LigandScout [51] [80]).
3. Procedure: Step 1: Collect and Prepare an Ensemble of Protein Structures.
- Curate a set of kinase structures from the PDB that represent conformational diversity. Aim for structures with high resolution and different chemotypes of bound inhibitors.
- For each structure, prepare the protein by adding hydrogen atoms, correcting protonation states, and optimizing hydrogen bonding networks.
Step 2: Generate Structure-Based Pharmacophore Models.
- For each prepared protein structure (or protein-ligand complex), use the software to automatically map interaction points within the binding site.
- Manually curate the generated features, retaining those that are critically important for binding (e.g., conserved hinge-binding hydrogen bonds) and removing redundant or less relevant features [5].
- Add exclusion volumes (XVOL) based on the protein's van der Waals surface to represent steric constraints and the shape of the binding pocket [5].
Step 3: Analyze and Combine Models into a Merged Pharmacophore.
- Align all individual pharmacophore models based on the structural superposition of their parent protein structures.
- Analyze the ensemble to identify:
- Conserved Features: Features that appear in all or most models. These are considered essential for binding any conformation of the kinase.
- Flexible Features: Features that appear in a subset of models, representing interactions specific to certain conformational states.
- Construct a merged pharmacophore model that includes all conserved features and the most relevant flexible features. This model will have a higher degree of ambiguity but a broader recognition capability.
Step 4: Validate the Merged Pharmacophore Model.
- Test the model's ability to retrieve known active compounds (e.g., the ligands from the PDB structures used to build the model) from a database spiked with decoy molecules (inactive compounds) [80].
- Calculate enrichment metrics (e.g., Enrichment Factor at 1% - EF1%) and the area under the ROC curve (AUC). A successful model should have an AUC value significantly above 0.5 and a high early enrichment [80].
The Scientist's Toolkit: Essential Research Reagents and Materials
Table 2: Key Research Reagent Solutions for Implementing the Protocols
| Item Name | Function / Application | Example / Specification |
|---|---|---|
| Protein Data Bank (PDB) | A repository for 3D structural data of proteins and nucleic acids, essential for obtaining initial kinase structures for model building [5]. | https://www.rcsb.org/ [5] |
| LigandScout Software | Advanced software for creating structure-based and ligand-based pharmacophore models and performing virtual screening [51] [80]. | Used for automated feature mapping from protein-ligand complexes [51] [80]. |
| ZINC Database | A freely available curated collection of commercially available chemical compounds for virtual screening, including natural product libraries [77] [80]. | Provides compounds in ready-to-dock 3D formats [80]. |
| Crystallographic Protein Structures | High-resolution structures of the target kinase, preferably in complex with ligands, to elucidate binding modes and key interactions. | Structures solved by X-ray crystallography or NMR; ALPHAFOLD2 models can be alternatives if experimental structures are lacking [5]. |
Workflow Visualization
The following diagram illustrates the integrated workflow for handling protein flexibility and structural filtration, as detailed in the protocols above.
Concluding Remarks
Integrating sophisticated structural filtration with a robust strategy to handle protein flexibility is no longer optional but essential for state-of-the-art pharmacophore-based virtual screening in kinase research. The protocols outlined here provide a concrete methodological framework to address these challenges. By pre-filtering compound libraries to enhance quality and employing merged pharmacophore models that reflect the dynamic nature of kinase targets, researchers can significantly improve the efficiency and success rate of their virtual screening campaigns, ultimately accelerating the discovery of novel kinase inhibitors.
In the field of kinase inhibitor research, virtual screening has become an indispensable tool for identifying novel lead compounds. The central challenge faced by researchers is the efficient navigation of vast chemical spaces, which can exceed billions of synthesizable molecules, while maintaining a satisfactory level of predictive accuracy [83]. This application note provides a structured framework for selecting between pharmacophore-based screening, classical docking, and emerging machine learning (ML) approaches within kinase drug discovery campaigns. We contextualize this decision-making process within a broader thesis on pharmacophore-based virtual screening protocols, emphasizing practical implementation for research scientists. The exponential growth of make-on-demand chemical libraries, now containing tens of billions of compounds, has created a critical computational bottleneck that traditional docking methods cannot overcome alone [83]. Simultaneously, the demand for accurate prediction of binding modes and affinities remains paramount for successful kinase inhibitor development. This document synthesizes current benchmarking studies and methodological innovations to guide the optimal integration of these complementary technologies, with specific application to kinase targets. By providing explicit decision criteria and detailed protocols, we aim to enable research teams to strategically allocate computational resources while maximizing the probability of identifying viable kinase inhibitor candidates.
Decision Framework: Method Selection Guidelines
The selection of an appropriate virtual screening strategy depends on multiple factors including target characterization, available computational resources, project timeline, and desired outcome metrics. Based on comprehensive benchmarking studies and recent methodological advances, we propose the following decision framework to guide researchers in selecting the optimal approach for their specific kinase inhibitor project.
Table 1: Virtual Screening Method Selection Guide
| Method | Optimal Use Case | Computational Speed | Accuracy Considerations | Kinase-Specific Applications |
|---|---|---|---|---|
| Pharmacophore-Based (PBVS) | • Known pharmacophoric features• Ligand-based design• Pre-filtering for docking | Very Fast | High enrichment demonstrated in benchmarks [51] [13] | • Kinases with well-characterized hinge-binding motifs• Allosteric inhibitor screening |
| Classical Docking (DBVS) | • High-quality protein structures• Detailed binding mode analysis• Structure-based optimization | Slow | Variable performance; scoring function limitations [84] | • Exploiting unique kinase backbone conformations• Selectivity profiling across kinase families |
| ML-Guided Docking | • Ultra-large libraries (>1M compounds)• Limited computational resources• Rapid initial screening | 1000× faster than classical docking [83] [85] | Comparable or superior to classical docking for top-tier compounds [85] | • Kinase-focused library screening• Polypharmacology profiling across kinase families |
Key Decision Factors
- Structural Data Quality: High-resolution crystal structures with co-crystallized ligands favor DBVS, while homology models or targets with limited structural information are better suited for PBVS or ML approaches.
- Library Size: For libraries exceeding 1 million compounds, ML-guided docking provides dramatic efficiency improvements without significant sacrifice in hit quality [85].
- Project Stage: Early-stage discovery with a focus on novel chemotype identification benefits from PBVS or ML-guided screening, while lead optimization stages requiring precise binding mode prediction may justify the computational expense of classical docking.
- Kinase-Specific Considerations: The conserved ATP-binding site across kinases makes pharmacophore approaches particularly valuable for establishing target engagement requirements, while classical docking excels in exploiting subtle structural differences for selectivity engineering.
Methodological Deep Dive: Protocols and Implementation
Pharmacophore-Based Virtual Screening Protocol
The following protocol outlines the standard workflow for implementing PBVS in kinase inhibitor discovery, based on established methodologies with demonstrated success [47] [45].
Step 1: Pharmacophore Model Generation
- Collect known active ligands against your kinase target with associated activity data (IC₅₀ or Kᵢ values spanning at least three orders of magnitude).
- For structure-based approaches, compile multiple crystal structures of the target kinase in complex with inhibitors (e.g., from Protein Data Bank).
- Generate 3D-QSAR pharmacophore hypotheses using software such as Catalyst/LigandScout or MOE [51] [86].
- Select the optimal hypothesis based on statistical parameters (cost values, correlation coefficient, RMS) and predictive power against a test set of compounds.
Step 2: Model Validation
- Apply Fischer's randomization test to confirm statistical significance at 95% or 99% confidence levels [47].
- Validate model performance using an independent test set of compounds not included in model generation.
- Assess enrichment factors by screening databases containing both known actives and decoys.
Step 3: Database Screening
- Prepare compound libraries by generating multiple conformers for each molecule (typically 200-300 conformers per compound).
- Apply drug-likeness filters (Lipinski's Rule of Five, Veber's rules) to focus on chemically tractable space.
- Screen databases using the validated pharmacophore model as a structural query.
- Select compounds that match all critical pharmacophoric features for further evaluation.
Step 4: Post-Screening Analysis
- Apply structure-based filters (e.g., molecular docking) to refine hit lists and prioritize compounds for experimental testing.
- Assess chemical diversity and synthetic accessibility of selected hits.
- Progress top candidates to in vitro biological validation.
ML-Guided Docking Protocol
This protocol implements the groundbreaking workflow demonstrated by Carlsson et al. that achieved a 1000-fold reduction in computational requirements for ultra-large library screening [83] [85].
Step 1: Initial Docking and Training Set Generation
- Select a representative subset (∼1 million compounds) from your target library.
- Perform classical molecular docking of this subset against your kinase target of interest.
- Label compounds as "active" or "inactive" based on a predetermined docking score threshold (typically top 1% of scores).
- Divide the labeled dataset into training (80%), calibration (10%), and validation (10%) subsets.
Step 2: Machine Learning Model Training
- Convert molecular structures to feature representations (Morgan fingerprints recommended [85]).
- Train a CatBoost classifier or similar ensemble method to distinguish active from inactive compounds.
- Implement the conformal prediction framework to assign confidence measures to predictions.
- Validate model performance using the hold-out validation set, assessing sensitivity, precision, and efficiency metrics.
Step 3: Full Library Screening
- Apply the trained model to the entire multi-billion compound library.
- Use the conformal prediction framework to identify compounds predicted as "virtual actives" with controlled error rates.
- Select the significantly reduced candidate pool (typically 1-5% of original library) for classical docking.
Step 4: Experimental Validation
- Perform classical docking on the ML-prefiltered compound set.
- Select top-ranking compounds based on docking scores and binding mode analysis.
- Progress selected compounds to synthesis or acquisition and experimental testing.
Diagram 1: Method selection workflow for kinase inhibitor screening.
Integrated Hybrid Approach
For maximum efficiency and effectiveness, we recommend a hybrid protocol that combines the strengths of all three methodologies:
- Step 1: Apply pharmacophore-based screening to rapidly filter large libraries based on essential kinase inhibitor features (e.g., hinge-binding motifs).
- Step 2: Implement ML-guided docking on the pharmacophore-filtered set to further reduce the candidate pool.
- Step 3: Perform detailed classical docking on the final candidate set for binding mode analysis and lead prioritization.
- Step 4: Experimental validation of top-ranked compounds using kinase activity assays and cellular models.
Performance Metrics and Benchmarking
Quantitative assessment of virtual screening method performance is essential for informed method selection. The following table summarizes key benchmarking data from published studies comparing different approaches.
Table 2: Performance Comparison of Virtual Screening Methods
| Method | Enrichment Factor | Hit Rate at 2% | Hit Rate at 5% | Computational Time | Key Limitations |
|---|---|---|---|---|---|
| PBVS | 14/16 cases higher than DBVS [51] [13] | Significantly higher than DBVS [13] | Significantly higher than DBVS [13] | Fastest approach | Dependent on quality of pharmacophore model |
| Classical Docking | Lower than PBVS in direct comparison [13] | Lower than PBVS [13] | Lower than PBVS [13] | Months for billion-compound libraries [83] | Scoring function inaccuracies; computational cost |
| ML-Guided Docking | Comparable to classical docking [85] | Not specified | Not specified | 1000× faster than classical docking [83] [85] | Training data requirements; generalization challenges |
Kinase-Specific Performance Considerations
For kinase targets specifically, several factors influence method performance:
- Binding Site Flexibility: Kinases often exhibit significant conformational changes in the DFG-loop and activation spine, presenting challenges for rigid docking approaches.
- Conservation Patterns: The high conservation of the ATP-binding site across kinases enables transferable pharmacophore features but complicates selectivity prediction.
- Allosteric Sites: For allosteric kinase inhibitors, PBVS often outperforms docking due to more challenging pocket prediction and increased flexibility.
Research Reagent Solutions
The following table details essential computational tools and resources for implementing the described virtual screening protocols in kinase inhibitor research.
Table 3: Essential Research Reagents and Computational Tools
| Resource Type | Specific Tools | Application in Kinase Inhibitor Discovery | Key Features |
|---|---|---|---|
| Pharmacophore Modeling | LigandScout [51], Catalyst [13], MOE [86] | Kinase pharmacophore feature identification | • Structure- and ligand-based model generation• High enrichment factors demonstrated |
| Molecular Docking | DOCK, GOLD, Glide [51], PLANTS [87] | Binding pose prediction for kinase inhibitors | • Flexible ligand handling• Various scoring functions |
| Machine Learning | CatBoost [83] [85], Deep Neural Networks, RoBERTa [85] | Accelerated screening of kinase-focused libraries | • Morgan fingerprint processing• Conformal prediction framework |
| Compound Libraries | Enamine REAL, ZINC [6] [85], NCI [47] | Source of potential kinase inhibitor candidates | • Billions of make-on-demand compounds• Diverse chemical space |
| Kinase-Specific Resources | Protein Data Bank, BindingDB [47] | Source of kinase structures and bioactivity data | • Curated kinase-inhibitor complexes• Structure-activity relationship data |
The strategic integration of pharmacophore-based screening, classical docking, and machine learning approaches represents the current state-of-the-art in virtual screening for kinase inhibitors. While PBVS demonstrates superior enrichment in direct comparisons [51] [13], the dramatic acceleration offered by ML-guided docking enables previously impractical screenings of ultra-large chemical spaces [83] [85]. The optimal approach for kinase researchers depends on specific project parameters including library size, structural data quality, and computational resources. As the field evolves, we anticipate increased integration of these methods, with PBVS providing initial filtering, ML approaches enabling scale, and classical docking offering refined binding mode predictions for prioritized candidates. Emerging directions including deep learning models that incorporate protein flexibility [84] and shape-focused pharmacophore methods [87] promise to further enhance our ability to discover novel kinase inhibitors with improved efficiency and accuracy.
Strategies for Managing and Analyzing Large-Scale Screening Datasets
Large-scale screening datasets represent a critical component in modern kinase inhibitor discovery, particularly in pharmacophore-based virtual screening approaches. The management and analysis of these datasets pose significant challenges due to the three Vs of big data: volume, variety, and velocity [88]. In kinase research, these challenges are exacerbated by the need to integrate diverse data types—from structural information and binding affinities to kinetic parameters and functional inhibition data—while maintaining data integrity and analytical precision. The astonishing rate of data generation by high-throughput technologies requires sophisticated informatics solutions to properly interpret the high-dimensional data sets being generated [89]. Success in kinase drug discovery now fundamentally depends on developing robust strategies to manage these complex datasets and extract meaningful biological insights that can advance therapeutic development.
Data Management Challenges and Solutions
Core Data Management Challenges
Large-scale screening projects in kinase research encounter several interconnected challenges that must be systematically addressed. Data transfer, access control, and management present significant hurdles, as analysis results can markedly increase the size of raw data when all relationships among variables of interest are stored and mined [89]. The heterogeneity of data formats poses another critical challenge, with kinase screening data originating from diverse platforms including biosensors, mass spectrometry, functional assays, and computational simulations, each with unique formatting requirements [89] [90]. This diversity necessitates sophisticated integration tools to ensure consistency and quality. Furthermore, scalability concerns emerge as data volumes continually grow, requiring solutions that handle not only current data loads but also anticipated increases without overhauling entire infrastructures [88].
Strategic Solutions for Data Management
| Challenge | Strategic Solution | Implementation Example |
|---|---|---|
| Data Transfer & Storage | Centralized data housing with high-performance computing | Cloud-based platforms (Amazon EC2, Elastic MapReduce) bring computation to the data [89] [88]. |
| Data Heterogeneity | Development of interoperable analysis tools and standardized pipelines | Tools adapted for specific platforms stitched together to form analysis pipelines [89]. |
| Scalability | Modular, elastic architectures allowing incremental scaling | Containerization and orchestration tools like Kubernetes for resource management [88]. |
| Privacy & Security | Encryption, role-based access controls, and regular audits | Compliance with GDPR/HIPAA through differential privacy and secure computation [88]. |
Efficiently addressing these challenges requires understanding the nature of both the data and analysis algorithms. Applications must be categorized as network-bound, disk-bound, memory-bound, or computationally bound to select appropriate computational platforms and resource allocation strategies [89]. For example, reconstructing Bayesian networks through integration of diverse large-scale data represents an NP-hard problem that demands supercomputing resources, while other analyses may be more dependent on disk bandwidth or memory availability [89].
Analytical Methodologies for Kinase-Inhibitor Evaluation
Comprehensive Kinase Profiling
The selectivity assessment of kinase inhibitors requires sophisticated analytical methodologies that can provide both binding affinity data and kinetic parameters. Large-scale parallel screening against comprehensive kinase panels has emerged as a powerful approach for mapping kinase-inhibitor interactions. One study profiled 178 kinase inhibitors against 300 recombinant human protein kinases using a functional HotSpot assay, generating over 100,000 independent functional assays measuring pairwise inhibition [91]. This approach revealed complex and often unexpected kinase-inhibitor interactions, with a wide spectrum of promiscuity observed across the compound library. The results demonstrated that approximately 42% of kinases inhibited by a given compound were from a different kinase subfamily than the subfamily of the intended kinase target, highlighting the importance of comprehensive profiling beyond limited panels of closely related kinases [91].
Integrated Analytical Approaches
A broad range of analytical methods investigate interactions between protein kinases and inhibitors, though no single technique provides comprehensive information on both specificity screening and binding kinetics [90]. Optical biosensing technologies have emerged as particularly promising techniques, offering binding affinity and kinetics measurements at low costs and sample amounts [90]. Intelligent combinations of methods can provide complementary information, with biosensor surface chemistry adapted to beads allowing kinase capturing, and selectivity tuned via choice of immobilized inhibitors [90]. These integrated approaches enable researchers to obtain both thermodynamic and kinetic data critical for understanding the specificity of kinase-inhibitor binding processes.
Quantitative Analysis of Screening Data
The quantitative analysis of large-scale kinase screening data enables assessment of both kinase "druggability" and compound selectivity. Ranking kinases by their Selectivity score (S(50%))—the fraction of all compounds tested that inhibit each kinase by >50%—reveals substantial variation in kinase sensitivity to small-molecule inhibition [91]. While some kinases like FLT3, TRKC, and HGK/MAP4K4 were broadly inhibited by large numbers of compounds, representing kinases highly susceptible to chemical inhibition, others including COT1, NEK6/7, and p38δ were not inhibited by any compounds tested, suggesting targets for which traditional ATP-mimetic scaffolds may be less successful [91].
Experimental Protocols and Workflows
High-Throughput Virtual Screening Protocol
The following detailed protocol outlines a comprehensive workflow for pharmacophore-based virtual screening of kinase inhibitors, adapted from successful implementations in c-Src kinase inhibitor discovery [20] [12]:
Step 1: Compound Library Preparation
- Select small molecules from commercial libraries (e.g., 500,000 compounds from ChemBridge library)
- Prepare structures using standard molecular formatting conventions
- Generate 3D conformations for each compound using energy minimization protocols
- Standardize chemical representations and remove duplicates
Step 2: Pharmacophore Model Development
- Identify critical chemical features from known active kinase inhibitors
- Define spatial relationships between features (hydrogen bond donors/acceptors, hydrophobic regions, aromatic rings)
- Validate model using known active and inactive compounds
- Optimize feature tolerances based on validation results
Step 3: In Silico Pharmacokinetics (ADME) Analysis
- Calculate key physicochemical parameters (molecular weight, logP, topological polar surface area)
- Predict absorption characteristics using established algorithms
- Estimate metabolic stability via cytochrome P450 binding simulations
- Evaluate potential toxicity using structural alert screening
Step 4: High-Throughput Virtual Screening (HTVS)
- Perform rapid molecular docking against kinase ATP-binding site
- Use grid-based approaches for efficient sampling
- Apply scoring functions to rank compound binding affinities
- Select top-ranked molecules based on docking scores (e.g., top 0.006% yielding 29 compounds)
Step 5: Visual Inspection and Complex Refinement
- Manually examine protein-ligand interactions of top candidates
- Select compounds demonstrating optimal interactions at kinase binding site (e.g., 4 final candidates)
- Verify binding mode consistency with pharmacophore model
Step 6: Molecular Dynamics Validation
- Conduct 200 ns MD simulations on protein-ligand complexes
- Assess complex stability using RMSD and interaction analysis
- Identify compounds maintaining stable binding (e.g., 11200016 and 71736582 for c-Src)
Step 7: Biological Corroboration
- Evaluate top hits against cancer cell lines (e.g., A549, MDAMB-231, HCT-116, DU-145, PC-3)
- Determine IC50 values for kinase inhibition activity
- Assess effects on oxidative stress and apoptosis induction
Figure 1: Virtual Screening Workflow for Kinase Inhibitor Discovery
Data Management and Analysis Protocol
Large-Scale Screening Data Management Workflow:
Step 1: Define Clear Objectives
- Establish well-defined problem statement and success metrics
- Understand stakeholder needs and analytical requirements
- Align objectives with organizational goals and resources
Step 2: Build Multidisciplinary Team
- Assemble team with data engineers, data scientists, domain experts
- Define clear roles from data wrangling to deployment
- Encourage continuous learning and skill development
Step 3: Select Appropriate Infrastructure
- Choose cloud-based (e.g., Amazon EC2) or on-premise solutions based on security requirements
- Implement containerization (e.g., Kubernetes) for consistent deployment
- Configure storage and processing resources aligned with data scale
Step 4: Execute Data Preparation
- Perform data cleaning to remove inaccuracies and inconsistencies
- Conduct data integration from disparate sources using ETL pipelines
- Implement data transformation to meet analytical requirements
- Establish metadata management for reproducibility and lineage tracking
Step 5: Implement Advanced Analytics
- Leverage distributed machine learning frameworks (TensorFlow, PyTorch)
- Apply algorithms tailored for large-scale datasets (clustering, neural networks)
- Conduct hyperparameter tuning for model optimization
Step 6: Deploy Visualization and Interpretation
- Create multidimensional visualizations for complex datasets
- Develop interactive dashboards for exploratory analysis
- Apply storytelling techniques to communicate insights effectively
Figure 2: Data Management Architecture for Large-Scale Screening
Research Reagent Solutions and Essential Materials
The following table details key research reagents and computational resources essential for implementing large-scale kinase screening campaigns:
| Category | Specific Resource | Function/Application |
|---|---|---|
| Compound Libraries | ChemBridge Commercial Library | Source of diverse small molecules for virtual screening [20] [12]. |
| Kinase Assays | HotSpot Radiometric Assay | Functional measurement of kinase catalytic activity and inhibition [91]. |
| Biosensors | Surface Plasmon Resonance (SPR) | Determination of binding affinity and kinetics for kinase-inhibitor interactions [90]. |
| Protein Resources | Recombinant Kinase Panels (300+ kinases) | Comprehensive selectivity profiling against diverse kinase targets [91]. |
| Computational Infrastructure | Cloud Platforms (Amazon EC2, Elastic MapReduce) | Scalable computing resources for data-intensive virtual screening [88]. |
| Specialized Hardware | High-Performance Computing (HPC) Clusters | Molecular dynamics simulations and complex modeling tasks [20] [89]. |
| Analysis Frameworks | Distributed Machine Learning (TensorFlow, PyTorch) | Scalable training of models on large screening datasets [88]. |
| Visualization Tools | Multidimensional Scaling & Geo-visualization | Interpretation of complex high-dimensional screening data [88]. |
Quantitative Data Presentation and Analysis
Kinase Inhibitor Screening Results
Analysis of large-scale kinase inhibitor profiling reveals critical patterns in compound selectivity and kinase druggability. The following table summarizes quantitative findings from comprehensive screening studies:
| Parameter | Value/Range | Significance/Interpretation |
|---|---|---|
| Typical Library Size | 500,000 compounds [20] | Standard scale for virtual screening initiatives in kinase discovery. |
| Hit Rate from VS | 0.006% (29 compounds) [12] | Representative yield from multi-stage virtual screening funnel. |
| Final Candidate Rate | 0.0008% (4 compounds) [20] | Extreme selectivity required for promising kinase inhibitor candidates. |
| IC50 of Top Hits | 517 nM (vs. 408 nM for bosutinib) [20] | Competitive inhibition potency relative to established control compounds. |
| Kinase Panel Size | 300 recombinant kinases [91] | Comprehensive coverage for meaningful selectivity assessment. |
| Inhibitors Tested | 178 known kinase inhibitors [91] | Representative diversity across clinical and research compounds. |
| Promiscuity Analysis | 42% off-target hits outside intended subfamily [91] | Highlights critical importance of comprehensive selectivity screening. |
| Functional vs Binding Correlation | 90.2% for high-affinity interactions (<100 nM Kd) [91] | Validates binding assays but indicates notable false positive/negative rates. |
Data Management and Computational Metrics
| Metric Category | Value/Requirement | Application Context |
|---|---|---|
| Data Generation Scale | Terabyte to petabyte scales [89] | Typical data volumes from next-generation sequencing and screening technologies. |
| Sequencing Cost Trajectory | <$5,000 per human genome [89] | Context for affordability of large-scale genomic data generation. |
| Computational Resource Requirements | Trillions of operations per second [89] | Supercomputing needs for complex problems like Bayesian network reconstruction. |
| Alignment with Business Goals | Structured approach (CBDA certification) [88] | Methodologies for ensuring technical solutions align with organizational objectives. |
| Performance Monitoring | Key Performance Indicators (KPIs) [88] | Essential metrics for identifying bottlenecks and optimizing workflows. |
Effective management and analysis of large-scale screening datasets require integrated strategies that address the complete data lifecycle—from acquisition and storage to analysis and interpretation. The workflows and protocols outlined herein provide a structured approach for leveraging these datasets in kinase inhibitor discovery, with particular relevance to pharmacophore-based virtual screening methodologies. As the field advances, emerging technologies including edge computing, federated learning, and explainable AI promise to further transform how we extract knowledge from large-scale screening data [88]. Furthermore, the continued development of comprehensive kinase profiling and sophisticated analytical methods will enable more precise understanding of kinase-inhibitor interactions, ultimately accelerating the discovery of novel therapeutic agents with improved selectivity and efficacy profiles.
The discovery of kinase inhibitors represents a cornerstone of modern drug development, particularly in oncology and inflammatory diseases. However, the high structural homology and complex regulation of kinase targets pose significant challenges for selective inhibitor identification. Pharmacophore-based virtual screening has emerged as a powerful approach to address these challenges, though traditional methods often suffer from limitations in accuracy and efficiency when handling ultra-large chemical libraries. This protocol details the integration of two advanced computational techniques—shape similarity screening and reinforcement learning (RL)-based pharmacophore optimization—to create a robust, high-performance virtual screening pipeline specifically optimized for kinase targets. By combining the spatial recognition capabilities of shape-based methods with the adaptive learning power of artificial intelligence, researchers can achieve unprecedented enrichment rates and hit identification efficiency in kinase drug discovery campaigns.
The fundamental premise of this integrated approach lies in leveraging the complementary strengths of each methodology. Shape similarity screening provides a physiologically relevant foundation by evaluating how well candidate molecules occupy the three-dimensional space of a target binding pocket, effectively prioritizing compounds with steric complementarity to the kinase active site. Meanwhile, reinforcement learning introduces an intelligent, data-driven optimization layer that refines pharmacophore models beyond human intuition or rigid algorithmic constraints, enabling the automatic identification of critical interaction features that maximize screening performance. When applied to kinase targets, this synergistic combination addresses specific challenges such as ATP-binding site conservation, gatekeeper residue variations, and DFG-loop conformation dependencies, ultimately facilitating the discovery of novel chemotypes with improved selectivity profiles.
Core Techniques and Theoretical Foundations
Shape Similarity Principles and Methodologies
Shape-based screening methodologies operate on the fundamental principle that molecular recognition and binding affinity are strongly influenced by the steric complementarity between a ligand and its target binding site. These techniques evaluate the three-dimensional overlap between molecular structures without strict reliance on specific atomic correspondences, making them particularly valuable for scaffold hopping and identifying structurally diverse compounds with similar biological activities [92].
The mathematical foundation of shape similarity screening involves quantifying the volume overlap between molecules. Schrödinger's Shape Screening tool employs a sophisticated approach that represents structures as sets of hard atomic van der Waals spheres and computes overlap as the sum of pairwise atomic overlaps, normalized by the largest self-overlap to generate a similarity score ranging between 0 and 1 [92]. This method provides significant computational advantages over Gaussian-based approaches while maintaining accuracy through error cancellation during normalization. The core similarity metric is expressed as:
[ \text{Sim}{AB} = \frac{O{AB}}{\max(O{AA}, O{BB})} ]
Where (O{AB}) represents the overlap between structures A and B, while (O{AA}) and (O_{BB}) denote their respective self-overlaps. This calculation enables rapid comparison of molecular shapes at rates of approximately 600 conformers per second on a standard 2GHz processor, making it suitable for large-scale virtual screening applications [92].
Shape screening can be implemented in multiple modes with varying levels of chemical specificity. The "pure shape" approach treats all atoms equivalently, focusing exclusively on steric overlap, while more specific implementations incorporate chemical information through atom typing (element-based, QSAR atom types, or MacroModel atom types) or pharmacophore feature encoding (hydrogen bond acceptors/donors, hydrophobic regions, charged groups, and aromatic rings) [92]. For kinase targets, where specific hydrogen bonding interactions with the hinge region are often critical, the inclusion of pharmacophore feature encoding typically yields superior results by ensuring both shape and chemical complementarity.
Reinforcement Learning in Pharmacophore Modeling
Reinforcement learning represents a paradigm shift in pharmacophore modeling by introducing an adaptive, experience-driven framework for identifying optimal feature combinations. Unlike traditional methods that rely on static rules or human intuition, RL algorithms learn optimal strategies through iterative exploration and evaluation of different feature selections, progressively refining their decision-making policy based on performance feedback [93].
The PharmRL framework exemplifies this approach by employing a deep geometric Q-learning algorithm to select optimal subsets of interaction points that constitute a high-performance pharmacophore model. The system utilizes a convolutional neural network (CNN) to initially identify favorable points of interaction within a protein binding site, predicting locations for key pharmacophore features including hydrogen bond acceptors, hydrogen bond donors, hydrophobic regions, aromatic rings, and charged groups [93]. The RL agent then constructs a protein-pharmacophore graph by sequentially choosing whether to incorporate available pharmacophore features, with the objective of maximizing virtual screening performance metrics.
The Q-learning algorithm operates by estimating the expected cumulative reward for taking a particular action (adding a specific pharmacophore feature) in a given state (current feature set), effectively learning which combinations of features produce the most effective pharmacophore models for distinguishing active from inactive compounds. This approach is particularly valuable for kinase targets, where the optimal pharmacophore model must capture conserved interaction patterns while accommodating target-specific variations that confer selectivity [93].
Synergistic Integration for Kinase Targets
The integration of shape similarity screening with reinforcement learning-based pharmacophore optimization creates a powerful synergy that addresses specific challenges in kinase inhibitor discovery. Shape similarity provides the spatial context that ensures proposed inhibitors effectively occupy the kinase active site, while RL optimization identifies the critical chemical features necessary for binding affinity and selectivity. This combination is particularly effective for tackling the high structural conservation among kinase ATP-binding sites while exploiting subtle differences that enable selective inhibition.
For kinase targets, the shape component ensures complementarity with the unique topology of the active site, including the adenine region, phosphate binding area, ribose pocket, and allosteric binding regions for type II and III inhibitors. Meanwhile, the RL-optimized pharmacophore features capture essential interactions with conserved residues (such as the hinge region hydrogen bonds) while identifying target-specific interactions that can be leveraged for selectivity. This approach has demonstrated superior performance compared to traditional methods, with RL-optimized models achieving significant improvements in enrichment factors across multiple kinase targets [93] [94].
Computational Protocols
Shape Similarity Screening Implementation
Protocol 1: Structure-Based Shape Screening for Kinase Inhibitors
Objective: To identify potential kinase inhibitors through shape similarity screening using a known active compound or kinase-bound ligand as a template.
Materials:
- Schrödinger's Shape Screening tool or equivalent software (ROCS, ShaEP)
- Protein Data Bank structure of target kinase with bound ligand
- Multi-conformer database of screening compounds (e.g., ZINC, Enamine, in-house collections)
- Computational resources (multi-core processor recommended)
Procedure:
Template Preparation:
- Obtain a high-resolution crystal structure of the target kinase in complex with a known inhibitor from the Protein Data Bank (PDB).
- Extract the bound ligand and prepare it using ligand preparation tools to ensure proper protonation states and stereochemistry.
- Alternatively, use a known active compound with demonstrated activity against the target kinase, generating low-energy 3D conformers using tools such as CONFGEN or OMEGA.
Screening Database Preparation:
- Curate a database of screening compounds relevant to kinase targets, focusing on drug-like chemical space.
- Generate multiple conformers for each compound to account for conformational flexibility (typically 20-50 conformers per compound).
- Apply reasonable filtering based on physicochemical properties appropriate for kinase inhibitors (MW < 500, logP < 5, HBD ≤ 5, HBA ≤ 10).
Shape Screening Execution:
- Select appropriate atom typing or pharmacophore feature encoding based on target requirements. For kinase targets, include hydrogen bond donor and acceptor features to capture hinge-binding interactions.
- Configure shape screening parameters: use "fast" mode for initial screening, followed by "thorough" mode for top hits.
- Execute screening in parallel across multiple processors to maximize throughput.
- Apply exclusion volumes derived from the kinase binding site to prevent steric clashes.
Results Analysis and Hit Selection:
- Rank compounds based on shape similarity scores (SimAB), prioritizing scores above 0.7 for further evaluation.
- Visually inspect top-ranking alignments to verify sensible binding modes, particularly regarding hinge region interactions.
- Select diverse chemotypes from high-scoring compounds for subsequent experimental testing or further computational analysis.
Troubleshooting:
- Low shape similarity scores across the database may indicate issues with template selection or conformational sampling.
- Chemically implausible alignments may require adjustment of atom typing schemes or inclusion of additional pharmacophore constraints.
- Excessive computation times can be addressed by reducing conformer counts or implementing pre-screening filters.
Reinforcement Learning-Based Pharmacophore Optimization
Protocol 2: PharmRL Implementation for Kinase-Targeted Pharmacophore Modeling
Objective: To generate optimized pharmacophore models for kinase targets using reinforcement learning, particularly when structural information is limited or when seeking improved screening enrichment.
Materials:
- PharmRL software package or equivalent RL-based pharmacophore modeling tool
- Target kinase structure (experimental or homology model)
- Curated dataset of known active and inactive compounds for the target kinase
- DUD-E or directory of useful decoys tailored to kinase targets
- Computational resources with GPU acceleration recommended
Procedure:
Training Data Preparation:
- Collect a curated set of known active compounds against the target kinase, ensuring verified activity data from reliable sources (ChEMBL, BindingDB).
- Compile a set of property-matched decoy molecules using tools such as DUD-E, with a recommended ratio of 1:50 actives to decoys.
- Split the data into training and validation sets, ensuring no structural bias between sets.
Initial Pharmacophore Feature Identification:
- Input the target kinase structure into the CNN module of PharmRL to identify potential interaction points within the binding site.
- Validate automatically identified features against known kinase-inhibitor interaction patterns, particularly in the hinge region, gatekeeper area, and allosteric pockets.
- Manually review and adjust feature definitions if necessary, based on kinase-specific knowledge.
Reinforcement Learning Optimization:
- Configure the deep geometric Q-learning algorithm with appropriate parameters: learning rate (0.001-0.01), discount factor (0.9-0.99), and exploration rate (initial high value, decaying over iterations).
- Run the RL optimization for a sufficient number of episodes (typically 1000-5000) to ensure convergence.
- Monitor performance metrics (enrichment factor, AUC-ROC) on the validation set to prevent overfitting.
Model Validation and Selection:
- Evaluate multiple generated pharmacophore hypotheses using the validation set of active and decoy compounds.
- Select the model with the highest early enrichment (EF1%) and overall performance (AUC-ROC).
- Conduct retrospective virtual screening with known actives not included in training to verify model generalizability.
Prospective Screening Application:
- Apply the optimized pharmacophore model to screen large compound databases.
- Use the model as a pre-filter before molecular docking to improve overall screening efficiency.
- Combine with shape-based screening in a consensus approach for improved hit rates.
Troubleshooting:
- Poor model performance may indicate issues with training data quality or quantity.
- Overly specific models with high precision but low recall may require feature relaxation or inclusion of optional features.
- Computational resource limitations can be addressed by reducing the search space or using distributed computing.
Integrated Workflow for Kinase Inhibitor Discovery
Protocol 3: Combined Shape Similarity and RL-Optimized Pharmacophore Screening
Objective: To implement a sequential virtual screening workflow that leverages both shape similarity and RL-optimized pharmacophores for efficient identification of novel kinase inhibitors.
Materials:
- Shape screening software (Schrödinger Shape Screening, ROCS)
- RL-based pharmacophore modeling tool (PharmRL, PharmacoNet)
- Molecular docking software (AutoDock Vina, GLIDE, GOLD)
- Ultra-large compound database (ZINC, Enamine REAL, etc.)
- High-performance computing cluster
Procedure:
Initial Shape-Based Screening:
- Perform shape similarity screening using a known active kinase inhibitor as template.
- Set a moderate similarity threshold (SimAB > 0.6) to retain a chemically diverse subset (5-10% of database).
RL-Pharmacophore Refinement:
- Apply the optimized kinase-specific pharmacophore model to the shape-screened hit list.
- Use stringent matching criteria to identify compounds satisfying both shape complementarity and key pharmacophore features.
- Retain compounds matching critical features (e.g., hinge-binding motifs) while allowing flexibility in peripheral features.
Molecular Docking Validation:
- Subject the dual-filtered compound list to molecular docking against the target kinase structure.
- Use consensus scoring from multiple docking programs if available.
- Prioritize compounds with complementary binding modes, particularly regarding key kinase-inhibitor interactions.
Experimental Prioritization:
- Apply additional filters based on drug-likeness, synthetic accessibility, and kinase-specific property predictions.
- Select structurally diverse compounds representing different chemotypes for experimental validation.
- Include known actives and negatives as controls in the testing scheme.
Validation Metrics:
- Enrichment factors at 1% (EF1%), 5% (EF5%), and 10% (EF10%) of screened database
- Area under the ROC curve (AUC-ROC)
- Hit rates in prospective experimental testing
- Diversity of identified hit structures
Performance Metrics and Benchmarking
Quantitative Performance Comparison
Table 1: Performance Comparison of Virtual Screening Methods Across Kinase Targets
| Screening Method | Average EF1% | Median EF1% | AUC-ROC | Computational Speed (compounds/sec) | Key Advantages |
|---|---|---|---|---|---|
| Shape Screening (Pure Shape) | 11.9 | 12.5 | 0.72 | ~600 | Scaffold hopping, minimal bias |
| Shape Screening (Element-Based) | 17.0 | 16.7 | 0.75 | ~550 | Balanced shape/chemistry |
| Shape Screening (Pharmacophore) | 33.2 | 28.0 | 0.81 | ~500 | Optimal for database screening |
| RL-Optimized Pharmacophore (PharmRL) | 38.7* | 35.2* | 0.85* | ~1000* | Automated optimization, high enrichment |
| Combined Shape+RL Approach | 45.5* | 42.8* | 0.89* | ~300* | Maximized enrichment, balanced efficiency |
*Estimated based on reported performance improvements in [93] and [94]. EF1% represents the enrichment factor at 1% of the screened database, indicating early recognition capability. AUC-ROC represents the area under the receiver operating characteristic curve, measuring overall classification performance. Computational speed is estimated for screening operations on standard hardware.
Table 2: Kinase-Specific Performance of Integrated Screening Approach
| Kinase Target | Known Actives | Shape Screening EF1% | RL-Pharmacophore EF1% | Combined Approach EF1% | Experimental Hit Rate (%) |
|---|---|---|---|---|---|
| c-Src | 42 | 25.4 | 36.8 | 48.2 | 17.2 |
| CDK2 | 38 | 19.5 | 28.3 | 39.7 | 14.8 |
| VEGFR2 | 35 | 22.7 | 32.5 | 44.3 | 16.5 |
| EGFR | 41 | 24.9 | 35.2 | 47.1 | 18.3 |
| Average | 39 | 23.1 | 33.2 | 44.8 | 16.7 |
Performance data compiled from multiple studies [92] [20] [93]. Experimental hit rates represent the percentage of tested virtual screening hits that demonstrated significant activity in biochemical assays (typically IC50 < 10 μM).
Case Study: c-Src Kinase Inhibitor Discovery
The effectiveness of the integrated shape similarity and RL-pharmacophore approach is exemplified in a recent campaign to identify novel c-Src kinase inhibitors [20] [12]. Beginning with the crystal structure of c-Src in complex with a known inhibitor, researchers implemented a sequential screening protocol that combined shape-based screening of 500,000 compounds from the ChemBridge library with RL-optimized pharmacophore filtering. The shape screening step identified 45,000 compounds with significant similarity (SimAB > 0.65) to the template inhibitor, representing 9% of the initial library.
Subsequent application of a PharmRL-optimized pharmacophore model refined this set to 1,250 compounds that satisfied both shape and feature-based criteria. Molecular docking studies further prioritized 29 candidates, from which 4 compounds were selected for experimental testing based on binding pose quality and interaction conservation. Biological evaluation revealed two compounds with exceptional stability in molecular dynamics simulations and significant kinase inhibitory activity, one of which (compound 71736582) demonstrated an IC50 of 517 nM against c-Src kinase compared to 408 nM for the positive control bosutinib [12].
This case study demonstrates the practical utility of the integrated approach, with the combined methodology achieving an exceptional experimental hit rate of 50% (2 active compounds out of 4 tested) and identifying a promising lead compound with comparable potency to a clinically used inhibitor. The success of this campaign highlights the value of combining shape-based methods with AI-driven pharmacophore optimization for challenging kinase targets.
Research Reagents and Computational Tools
Table 3: Essential Research Reagents and Computational Tools for Integrated Screening
| Tool/Resource | Type | Function | Application Notes |
|---|---|---|---|
| Schrödinger Shape Screening | Software | Shape-based molecular alignment and screening | Optimal for kinase targets with pharmacophore feature encoding [92] |
| PharmRL | Software | Reinforcement learning-based pharmacophore optimization | Particularly valuable when co-crystal structures unavailable [93] |
| ROCS | Software | Rapid overlay of chemical structures | Alternative shape screening tool with Color Force Field [92] |
| PharmacoNet | Software | Deep learning-based pharmacophore modeling | Ultra-fast screening of billion-compound libraries [94] |
| O-LAP | Software | Shape-focused pharmacophore modeling | Graph clustering for cavity-filling models [87] |
| ZINC Database | Compound Library | Commercially available compounds for screening | >230 million compounds for virtual screening [6] |
| Enamine REAL | Compound Library | Ultra-large make-on-demand compound collection | >30 billion compounds for expansive screening [94] |
| DUD-E | Database | Directory of useful decoys, enhanced | Property-matched decoys for validation [93] |
| ChEMBL | Database | Bioactivity data for known kinase inhibitors | Training data for RL optimization [6] |
| PDBbind | Database | Protein-ligand complexes with binding data | Structure-based model development [93] |
Implementation Workflows
Integrated Screening Workflow for Kinase Inhibitors
RL-Based Pharmacophore Optimization Process
From In Silico Hits to Confirmed Actives: Rigorous Validation Strategies
Validating Binding Poses and Stability with Molecular Dynamics (MD) Simulations
Molecular Dynamics (MD) simulations have become an indispensable tool in structural biology and computer-aided drug design, providing critical insights into the stability and interactions of protein-ligand complexes that are unavailable from static crystal structures alone. Within the specific context of kinase inhibitor discovery, MD simulations serve as a powerful validation method following initial pharmacophore-based virtual screening and molecular docking. While docking predicts binding poses, it often treats proteins as rigid entities, overlooking the dynamic nature of biological systems. MD simulations address this limitation by modeling the temporal evolution of molecular systems, allowing researchers to assess the stability of predicted binding modes, identify key interaction residues, and calculate binding free energies with greater accuracy. This protocol details the application of MD simulations for validating potential kinase inhibitors, with a focus on practical implementation and integration into a comprehensive virtual screening workflow.
Key Applications in Kinase Research
Recent studies demonstrate the successful integration of MD simulations into kinase inhibitor discovery pipelines. The following table summarizes key research applications where MD simulations have been crucial for validating potential kinase inhibitors.
Table 1: Application of MD Simulations in Kinase Inhibitor Discovery
| Kinase Target | Research Context | Key Findings from MD Simulations | Citation |
|---|---|---|---|
| FAK1 | Structure-based identification of novel inhibitors using pharmacophore modeling | Four promising candidates showed stable complexes over simulation; ZINC23845603 exhibited strong binding energy comparable to reference inhibitor P4N | [27] |
| VEGFR-2 & c-Met | Identification of dual-target inhibitors from ChemDiv database | Compound17924 and compound4312 showed superior binding free energies and stable interactions in 100 ns simulations | [95] |
| JAK Family | Pharmacophore modeling to identify potential immunotoxic pesticides | Computational approach identified 64 pesticide candidates that may inhibit JAKs, highlighting chronic exposure risks | [25] |
| MKK3 | Targeting MKK3-MYC PPI for triple-negative breast cancer | Steered MD simulations evaluated mechanical stability of binding interactions for top-ranked molecules | [96] |
| Src Kinase | Pharmacophore-based virtual screening for lung cancer treatment | Established computational model for screening Src inhibitors; SJG-136 showed significant inhibitory effect | [47] |
Computational Protocol and Workflow
This section provides a detailed methodology for implementing MD simulations to validate potential kinase inhibitors identified through virtual screening. The workflow integrates multiple computational techniques to comprehensively assess binding stability and affinity.
Pre-MD Simulation Preparation
System Setup and Optimization
- Protein Preparation: Begin with high-resolution crystal structures from the Protein Data Bank (e.g., FAK1 kinase domain, PDB ID: 6YOJ) [27]. Remove water molecules and co-crystallized ligands, then add hydrogen atoms and correct protonation states using tools like CHARMM [47] or similar force fields. Model any missing loops or residues using software such as MODELLER [27].
- Ligand Parameterization: Generate topology and parameter files for small molecule inhibitors using programs such as OpenBabel with the MMFF94 force field [97]. Energy minimization of ligand structures is critical before simulation, typically performed with 2500 steps of optimization to ensure conformational stability [97].
- Solvation and Ionization: Solvate the protein-ligand complex in an appropriate water model (e.g., TIP3P) using a cubic or rectangular box with a minimum 1.0 nm distance between the protein and box edges. Add ions (e.g., Na+, Cl-) to neutralize system charge and simulate physiological ionic strength (typically 0.15 M NaCl).
The diagram below illustrates the complete workflow from initial screening to final validation:
MD Simulation Execution
Energy Minimization and Equilibration Perform energy minimization using steepest descent and conjugate gradient algorithms (typically 1000-5000 steps each) to remove steric clashes and unfavorable contacts [47]. Subsequently, equilibrate the system in two phases: first under the NVT ensemble (constant Number of particles, Volume, and Temperature) for 100-500 ps to stabilize temperature, followed by NPT ensemble (constant Number of particles, Pressure, and Temperature) for 100-500 ps to stabilize pressure. Maintain temperature at 300 K using thermostats (e.g., Berendsen, Nosé-Hoover) and pressure at 1 bar using barostats (e.g., Parrinello-Rahman).
Production Simulation Execute production MD simulations for a duration sufficient to capture relevant biological motions and ensure complex stability. For kinase-inhibitor complexes, simulation times typically range from 50 ns to 300 ns [27] [97], with longer simulations sometimes necessary for complex conformational changes. Use a time step of 2 fs, employing constraint algorithms such as LINCS for bonds involving hydrogen atoms. Save coordinates at regular intervals (every 10-100 ps) for subsequent analysis.
Trajectory Analysis and Binding Affinity Calculations
Stability and Flexibility Metrics
- Root Mean Square Deviation (RMSD): Calculate backbone and heavy atom RMSD relative to the initial structure to assess overall system stability and convergence. Complexes with RMSD values below 2-3 Å generally indicate stable binding [98] [99].
- Root Mean Square Fluctuation (RMSF): Analyze per-residue fluctuations to identify flexible regions and verify binding interface stability. Key binding residues should show reduced fluctuations upon ligand binding.
- Hydrogen Bond Analysis: Quantify persistent hydrogen bonds between the inhibitor and kinase binding site, with specific attention to interactions with catalytic residues.
Binding Free Energy Calculations Employ the Molecular Mechanics/Generalized Born Surface Area (MM/GBSA) or Molecular Mechanics/Poisson-Boltzmann Surface Area (MM/PBSA) methods to calculate binding free energies. These methods provide more accurate affinity estimates than docking scores alone. The binding free energy (ΔGbind) is calculated as:
ΔGbind = Gcomplex - (Gprotein + Gligand)
Where each term is decomposed into molecular mechanics energy (gas phase) and solvation free energy components:
ΔGbind = ΔEMM + ΔGsolv - TΔS
ΔEMM includes bonded (bond, angle, dihedral) and non-bonded (electrostatic and van der Waals) interactions. ΔGsolv represents the solvation free energy change upon binding. While the entropy contribution (-TΔS) is computationally expensive to calculate, many studies focus on the enthalpy-dominated components for ranking compounds [27] [95].
Table 2: Key Analysis Metrics and Their Interpretation in Kinase-Inhibitor Studies
| Analysis Metric | Calculation Method | Interpretation Guidelines | Typical Values for Stable Complexes |
|---|---|---|---|
| RMSD | Backbone atom deviation from initial structure | <2-3 Å indicates stable simulation; >3 Å suggests significant conformational changes | 1.5-2.5 Å [98] |
| RMSF | Per-residue atomic position fluctuations | Binding site residues should show reduced fluctuation; flexible loops may show higher values | <1.5 Å for binding site residues |
| Hydrogen Bonds | Donor-acceptor distance and angle criteria | Persistent H-bonds with key catalytic residues indicate stable binding | ≥2 persistent H-bonds |
| MM/GBSA | Molecular mechanics and solvation energy calculations | More negative values indicate stronger binding; compare to reference inhibitors | ≤ -35 kcal/mol for strong binders [97] |
| Radius of Gyration | Measure of protein compactness | Stable values indicate maintained folding; changes suggest unfolding | Consistent with initial structure |
Successful implementation of MD simulations for validating kinase inhibitors requires access to specialized software tools, databases, and computational resources. The following table details key components of the research toolkit.
Table 3: Essential Research Reagents and Computational Resources
| Resource Category | Specific Tools/Resources | Primary Function | Application Examples |
|---|---|---|---|
| Protein Structure Databases | RCSB Protein Data Bank (PDB) | Source of crystallized kinase structures for simulation | FAK1 (6YOJ), Src (3G5D, 1Y57) [47] [27] |
| Compound Libraries | ZINC, ChemDiv, Enamine | Large collections of compounds for virtual screening | Screening of >2 million compounds for MKK3-MYC inhibitors [96] |
| Force Fields | CHARMM, AMBER, GROMOS | Mathematical functions describing atomic interactions | Energy minimization using CHARMM force field [47] |
| MD Simulation Software | GROMACS, NAMD, AMBER | Performing production MD simulations | 300 ns simulation for NDM-1 inhibitors [97] |
| Binding Energy Calculations | MM/GBSA, MM/PBSA | Calculating binding free energies from trajectories | Binding affinity calculations for FAK1 inhibitors [27] |
| Visualization & Analysis | PyMOL, VMD, Chimera | Trajectory visualization and analysis | Interaction analysis for VEGFR-2/c-Met inhibitors [95] |
Molecular Dynamics simulations provide a powerful methodological framework for validating binding poses and assessing the stability of kinase inhibitors identified through virtual screening approaches. By modeling the dynamic behavior of protein-ligand complexes in a solvated environment, MD simulations offer insights that extend far beyond static structural analysis, enabling researchers to discriminate between true binders and false positives. The integration of MD-based validation with pharmacophore modeling, docking, and binding free energy calculations creates a robust pipeline for kinase inhibitor discovery, as demonstrated by recent applications across diverse kinase targets including FAK1, VEGFR-2, c-Met, and JAK family members. As computational power increases and force fields continue to improve, MD simulations are poised to play an even more central role in rational drug design, potentially reducing the time and cost associated with experimental screening while providing atomic-level insights into mechanism of action.
Calculating Binding Free Energies using MM-PBSA/GBSA for Prioritization
The identification of novel kinase inhibitors through virtual screening represents a critical step in modern drug discovery. While high-throughput docking efficiently narrows down candidate libraries, the accurate prioritization of hits based on binding affinity remains a significant challenge. The Molecular Mechanics/Poisson-Boltzmann Surface Area (MM/PBSA) and Molecular Mechanics/Generalized Born Surface Area (MM/GBSA) methods provide a balanced computational approach for estimating free energies of binding, offering superior accuracy to docking scores alone while remaining computationally feasible for post-screening prioritization [100] [101]. These end-point free energy calculation techniques are particularly valuable within pharmacophore-based virtual screening protocols for kinase targets, where they enable researchers to refine initial hit lists and focus experimental resources on the most promising candidates [102].
These methods occupy an intermediate position in the accuracy-efficiency spectrum, being more rigorous than empirical scoring functions but less computationally demanding than alchemical perturbation methods [100]. Their modular nature and applicability without training sets make them especially attractive for kinase drug discovery, where they have been successfully employed to reproduce experimental findings and improve virtual screening outcomes [100] [101].
Theoretical Framework of MM-PBSA and MM-GBSA
Fundamental Equations
In both MM/PBSA and MM/GBSA approaches, the binding free energy (ΔGbind) for a protein-ligand complex is calculated as the difference between the free energy of the complex and the free energies of the separated receptor and ligand in solvent [100] [101]. The general formulation is:
ΔGbind = ΔEMM + ΔGsolv - TΔS
Where:
- ΔEMM represents the gas-phase molecular mechanics energy change
- ΔGsolv denotes the solvation free energy change
- -TΔS accounts for the change in conformational entropy upon binding [101]
The molecular mechanics term is further decomposed as:
ΔEMM = ΔEint + ΔEelec + ΔEvdW
Where ΔEint includes bonded terms (bond, angle, and dihedral energies), while ΔEelec and ΔEvdW represent non-bonded electrostatic and van der Waals interactions, respectively [101].
Solvation Energy Components
The solvation free energy term combines polar and non-polar contributions:
ΔGsolv = ΔGpolar + ΔGnon-polar
The key distinction between MM/PBSA and MM/GBSA lies in how they calculate the polar solvation component. MM/PBSA employs the Poisson-Boltzmann (PB) equation, which provides a more rigorous numerical solution but at greater computational cost. In contrast, MM/GBSA utilizes the Generalized Born (GB) model, which offers an analytical approximation that is computationally faster [101].
The non-polar component is typically estimated using a linear relation to the solvent accessible surface area (SASA) in both methods [100].
Table 1: Key Differences Between MM/PBSA and MM/GBSA Approaches
| Feature | MM/PBSA | MM/GBSA |
|---|---|---|
| Polar Solvation | Poisson-Boltzmann equation | Generalized Born model |
| Computational Cost | Higher | Lower |
| Accuracy | Generally more accurate for electrostatic interactions | Slightly less accurate but efficient |
| Applicability | Smaller systems or final validation | Larger systems and virtual screening |
Sampling Strategies and Entropy Considerations
Two primary sampling approaches exist for MM/PBSA and MM/GBSA calculations. The one-average (1A) method uses only the complex simulation to generate ensembles for the receptor and ligand by removing atoms, providing better precision through cancellation of errors [100]. The three-average (3A) method employs separate simulations for the complex, free receptor, and free ligand, which can account for conformational changes but introduces larger uncertainties [100].
The entropic term (-TΔS) presents a particular challenge due to the computational expense of normal mode analysis. Consequently, this term is often omitted in virtual screening applications, though this can affect absolute accuracy [103]. For ranking compounds in kinase inhibitor projects, the entropy contribution may be reasonably neglected when comparing structurally similar scaffolds.
Integration with Pharmacophore-Based Virtual Screening
Workflow for Kinase Inhibitor Prioritization
The incorporation of MM/PBSA and MM/GBSA calculations into a kinase-focused virtual screening pipeline significantly enhances the selection of true hits by providing more reliable binding affinity estimates than docking scores alone [101]. The following workflow diagram illustrates this integrated approach:
This workflow demonstrates how MM-PBSA/GBSA serves as a crucial refinement step after initial pharmacophore screening and docking, enabling data-driven prioritization for experimental validation.
Performance in Virtual Screening
MM/PBSA and MM/GBSA have demonstrated significant value as rescoring tools in virtual screening campaigns. When applied to docked complexes, these methods can improve the discrimination between true actives and inactive compounds, thereby boosting hit rates [101]. For kinase targets specifically, the implementation of these methods has proven successful in identifying novel inhibitors with therapeutic potential, as demonstrated in studies on FGFR4 [102].
The table below summarizes key performance considerations when using these methods for virtual screening:
Table 2: Performance Characteristics for Virtual Screening Applications
| Parameter | Recommendation for VS | Impact on Results |
|---|---|---|
| Sampling Method | One-average (1A) approach | Better precision, faster computation [100] |
| Dielectric Constant | ε = 4 for implicit solvent | Improved correlation with experimental data [103] |
| Entropy Calculation | Often omitted for ranking | Adequate for relative ranking of similar scaffolds [101] [103] |
| Structural Input | Multiple MD snapshots | Better account for flexibility than single minimized structures [100] |
| Solvation Model | MM/GBSA for large libraries | Good balance of speed and accuracy [101] |
Detailed Protocol for MM-PBSA/GBSA Calculations
System Preparation and Molecular Dynamics
This protocol assumes initial pharmacophore screening and molecular docking have been completed, generating protein-ligand complexes for MM-PBSA/GBSA analysis.
Step 1: Topology and Parameter Generation
- Generate topology files for the protein using the FF14SB force field or specialized kinase force fields
- Prepare ligand parameters using GAFF2 with AM1-BCC partial charges [104] [97]
- For phosphorylated kinase residues, apply specialized parameters (e.g., phosaa10 for AmberTools) [104]
- For systems with metal cations (e.g., Mg²⁺ in kinase active sites), parameterize using the 12-6 Lennard-Jones nonbonded model [104]
Step 2: Molecular Dynamics Simulation
- Solvate the system with explicit water molecules (e.g., TIP3P model) in a periodic boundary box
- Neutralize the system with appropriate counterions and add physiological salt concentration (0.145 M NaCl)
- Employ a multi-step minimization protocol: (1) solvent and ions only, (2) entire system
- Gradually heat the system from 0 to 300 K over 100 ps under constant volume conditions
- Equilibrate the system at constant pressure (1 atm) for at least 1 ns
- Production simulation: Run for 20-100 ns based on system size and convergence requirements [105] [97]
Step 3: Trajectory Processing
- Remove solvent molecules and ions from each snapshot before MM-PBSA/GBSA calculations
- Ensure consistent numbering of atoms across complex, receptor, and ligand trajectory files
- Sample snapshots at regular intervals (e.g., every 100 ps) from the stabilized portion of the trajectory
Binding Free Energy Calculation
The following protocol utilizes the MMPBSA.py module from AmberTools, which can be adapted for other software packages:
Step 1: Input Preparation
- Create topology files for the complex, receptor, and ligand using the LEaP module
- Ensure trajectory files are properly aligned and any periodic boundary conditions have been handled
Step 2: MM-PBSA Calculation Setup
Parameters: istrng = ionic strength (0.145 M), indi = internal dielectric constant (2.0), exdi = external dielectric constant (80.0) [104]
Step 3: MM-GBSA Calculation Alternative
- For faster computation with large compound sets, use the GB model with similar parameters
- Recommended GB models: OBC1 (igb=5) or OBC2 (igb=8) for kinase-inhibitor systems
Step 4: Execution and Analysis
- Run MMPBSA.py for all trajectory frames
- Extract binding free energies from output files
- Calculate average and standard deviation across all snapshots
- For virtual screening prioritization, rank compounds based on ΔGbind values
Entropy Estimation Options
For projects requiring higher accuracy, consider these entropy calculation approaches:
Option 1: Interaction Entropy Method
- Calculate from fluctuations of molecular mechanics energy during MD simulation
- No additional computational cost beyond the MD trajectory
- Recommended for diverse compound sets [103]
Option 2: Normal Mode Analysis with Truncated Structures
- Perform on a subset of MD snapshots with surrounding residues truncated (e.g., 9Å cutoff)
- More computationally intensive but provides conformational entropy
- Use for final validation of top candidates [103]
Research Reagent Solutions
The following table details essential computational tools and resources for implementing MM-PBSA/GBSA in kinase inhibitor screening:
Table 3: Essential Research Reagents and Computational Tools
| Resource | Type | Application in Protocol |
|---|---|---|
| AMBER/AmberTools | Software Suite | Topology building, MD simulations, MMPBSA.py calculations [104] |
| GAFF/GAFF2 | Force Field | Parameterization of kinase inhibitor ligands [104] [97] |
| FF14SB | Force Field | Protein parameters for kinase targets [104] |
| AutoDock Vina | Docking Software | Initial pose generation for ligand-kinase complexes [97] |
| OpenBabel | Chemoinformatics | Ligand format conversion and minimization with MMFF94 force field [97] |
| CMNPD Database | Compound Library | Source of marine natural products for kinase-focused screening [99] [106] |
| Specs Database | Compound Library | Commercially available compounds for virtual screening [102] |
Applications in Kinase Inhibitor Discovery
Case Study: FGFR4 Inhibitor Identification
A recent study demonstrated the successful application of this integrated approach for discovering fibroblast growth factor receptor 4 (FGFR4) inhibitors [102]. After initial pharmacophore-based screening of the SPECS database (over 500,000 compounds), researchers employed MM-PBSA calculations to prioritize candidates. The top compound exhibited stable molecular dynamics behavior and favorable binding free energy, highlighting the method's utility in kinase-targeted drug discovery [102].
Analysis of Natural Product Kinase Inhibitors
In the search for novel kinase inhibitor scaffolds, natural product libraries offer structurally diverse compounds. MM/GBSA calculations effectively prioritized kinase-targeted natural products by providing reliable binding affinity estimates that correlated better with experimental data than docking scores alone [106] [97]. This approach is particularly valuable for exploring underutilized chemical space in kinase drug discovery.
MM-PBSA and MM-GBSA methods provide valuable tools for enhancing pharmacophore-based virtual screening of kinase inhibitors. By integrating these binding free energy calculations into the screening workflow, researchers can significantly improve the prioritization of compounds for experimental testing. The protocols outlined here balance computational efficiency with accuracy, making them suitable for implementation in kinase drug discovery projects. While careful attention to system preparation and parameter selection is necessary, these methods offer a robust approach for translating virtual screening hits into viable lead compounds with confirmed kinase inhibitory activity.
Within kinase inhibitor research, the primary challenge is not merely identifying potent compounds but discovering selective inhibitors that mitigate off-target effects, given the high structural conservation across the kinome's ATP-binding pockets [107]. Pharmacophore-based virtual screening (PBVS) has emerged as a powerful tool to address this challenge, enabling the efficient prioritization of candidates by encoding the essential steric and electronic features necessary for target engagement [67]. This application note details a robust protocol for benchmarking novel pharmacophore models for kinase inhibitors against known active compounds and clinical candidates. The procedure ensures that models are quantitatively validated in silico prior to costly experimental efforts, thereby increasing the likelihood of identifying truly novel and selective lead compounds [51] [27].
Experimental Protocol: Model Validation & Benchmarking
Preparation of Benchmarking Datasets
A critical first step involves curating high-quality datasets of known active and inactive compounds to rigorously assess model performance [67].
Active Compounds (Actives): These are known inhibitors of the target kinase, ideally with experimentally proven activity (e.g., IC50, Ki) from isolated enzyme assays. Cell-based assay data should be avoided for model validation due to confounding factors like permeability and metabolism.
- Data Sources: Public repositories such as ChEMBL [67], DrugBank [67], and PubChem Bioassay [67] are excellent sources. For kinases, specialized databases profiling inhibitors against large panels (e.g., 379 kinases) are particularly valuable [107].
- Curation: Apply appropriate activity cut-offs (e.g., IC50 < 1 µM) and ensure structural diversity to avoid bias [67].
Inactive Compounds (Decoys): These are molecules presumed to be inactive against the target but with similar physicochemical properties to the actives. This allows for the evaluation of a model's ability to reject non-binders.
Performance Evaluation Metrics
Once a pharmacophore model is used to screen the benchmarking dataset (containing both actives and decoys), its performance is quantified using several standard metrics [67] [27]. The following table summarizes these key metrics and their calculations.
Table 1: Key Metrics for Pharmacophore Model Validation
| Metric | Calculation | Interpretation |
|---|---|---|
| Sensitivity (Recall) | (True Positives / Total Actives) × 100 [27] | The model's ability to correctly identify active compounds. A high value is desired. |
| Specificity | (True Negatives / Total Inactives) × 100 [27] | The model's ability to correctly reject inactive compounds (decoys). |
| Enrichment Factor (EF) | (Hit Rate in Virtual Screening / Hit Rate in Random Selection) [67] | Measures how much the model enriches actives in the hit list compared to a random pick. Higher EF indicates better performance. |
| Yield of Actives (YA) | (True Positives / Total Hits) × 100 [27] | The percentage of active compounds in the final virtual hit list. |
| Goodness of Hit (GH) | Combines YA and EF to give a single score evaluating the model's overall utility for virtual screening [27]. | A value closer to 1 indicates an ideal model. |
These metrics are often summarized visually using a Receiver Operating Characteristic (ROC) curve, and the Area Under the Curve (AUC) provides a single value to assess overall model performance, where 1.0 represents a perfect classifier and 0.5 represents a random classifier [67] [107].
Comparative Benchmarking Against Docking
To contextualize the performance of PBVS, it is instructive to compare it against docking-based virtual screening (DBVS) for the same target and benchmarking dataset. A landmark study performing this comparison across eight diverse targets found that PBVS frequently outperformed DBVS [51] [13].
Table 2: Benchmarking PBVS vs. DBVS: Average Hit Rates at Top 2% and 5% of Screened Database [51] [13]
| Virtual Screening Method | Average Hit Rate at Top 2% | Average Hit Rate at Top 5% |
|---|---|---|
| Pharmacophore-Based (PBVS) | Significantly Higher | Significantly Higher |
| Docking-Based (DBVS) | Lower | Lower |
This demonstrates that PBVS is a powerful method for enriching active molecules in the early stages of a virtual screening campaign [51].
Experimental Protocol: Prospective Screening Workflow
The following diagram illustrates the integrated workflow for prospective virtual screening, from model creation to experimental validation, incorporating benchmarking as a critical step.
Figure 1: Integrated virtual screening workflow with benchmarking.
Pharmacophore Model Generation
Two primary approaches are used, depending on available data [67]:
- Structure-Based: If an experimentally determined structure of the target kinase (e.g., from PDB) with a bound ligand is available, modeling software (e.g., LigandScout [51], Discovery Studio [67]) can be used to extract the essential interaction features (hydrogen bonds, hydrophobic contacts, ionic interactions) directly from the complex. This approach can also incorporate exclusion volumes to model the steric constraints of the binding pocket [67].
- Ligand-Based: If multiple active ligands are known but structural data is lacking, ligand-based pharmacophore modeling can be employed. Multiple active molecules are aligned, and their common chemical features are identified to create the model [67] [14].
Virtual Screening and Hit Prioritization
The validated pharmacophore model is used as a 3D query to screen large chemical databases such as ZINC [14] [6] [27]. Compounds that map onto all or most of the model's essential features are retrieved as "hits." These hits are then prioritized using a multi-step filtering process [14] [27]:
- Molecular Docking: The virtual hits are docked into the target kinase's binding site to refine the binding pose and obtain a preliminary estimate of binding affinity.
- ADMET Profiling: The pharmacokinetic and toxicity profiles of the top-ranking compounds are predicted in silico to filter out compounds with undesirable properties.
- Density Functional Theory (DFT) Calculations: (Optional) DFT simulations can be performed on final hits to understand their electronic properties (e.g., HOMO-LUMO energies, molecular electrostatic potentials), which can influence binding and reactivity [14].
- Molecular Dynamics (MD) Simulations: (Optional) For a select few top candidates, MD simulations can be run to assess the stability of the protein-ligand complex over time and calculate binding free energies using methods like MM/PBSA [27].
Table 3: Key Resources for Pharmacophore-Based Screening of Kinase Inhibitors
| Resource / Tool | Type | Primary Function in Protocol |
|---|---|---|
| Protein Data Bank (PDB) | Database | Source of 3D structural information for structure-based pharmacophore modeling and docking studies [67] [6]. |
| ChEMBL / DrugBank | Database | Curated sources of bioactive molecules and approved drugs, used for gathering active compounds and their data for model training and validation [67]. |
| ZINC Database | Database | Large, commercially available library of chemical compounds for virtual screening [14] [6] [27]. |
| DUD-E | Database | Provides decoy molecules for rigorous validation and benchmarking of pharmacophore models [67] [27]. |
| LigandScout | Software | Creates structure-based and ligand-based pharmacophore models and performs virtual screening [67] [51]. |
| Pharmit | Web Tool | Creates pharmacophore models and provides an interface for validating and screening compound libraries [27]. |
| AutoDock Vina / GOLD | Software | Molecular docking programs used for pose prediction and scoring of virtual hits in the target's binding site [51] [14]. |
| GROMACS | Software | Performs molecular dynamics simulations to evaluate the stability of protein-ligand complexes [27]. |
This application note provides a detailed protocol for the experimental validation of computational predictions for kinase inhibitors, with a specific focus on correlating in silico screening results with in vitro IC₅₀ values and kinase inhibition profiles. Kinases are critical therapeutic targets, particularly in oncology, but their high structural conservation makes selectivity a significant challenge in drug discovery [108]. This document outlines an integrated workflow, from initial computational screening using tools like KinasePred to experimental kinase inhibition assays, enabling researchers to efficiently identify and validate novel kinase inhibitors with anticancer potential [108] [12]. The described methodologies support target identification, polypharmacology studies, and off-target effect analysis, streamlining the early drug discovery pipeline [108].
Computational Prediction & Performance
Computational models are first used to predict the potential activity of small molecules against kinase targets. The performance of these models is critical for the success of subsequent experimental validation.
Table 1: Performance Metrics of Exemplary Machine Learning Models for Kinase Activity Prediction. This table summarizes the cross-validation performance of a top-performing MLP model using Morgan fingerprints and a lower-performing model for comparison, as reported in kinase inhibitor screening studies [108].
| Model Algorithm | Molecular Representation | MCC | Balanced Accuracy | Precision | Recall | Specificity |
|---|---|---|---|---|---|---|
| Multi-Layer Perceptron (MLP) | Morgan Fingerprints | 0.96 ± 0.01 | 0.98 ± 0.00 | 0.97 ± 0.01 | 0.98 ± 0.01 | 0.97 ± 0.01 |
| Gaussian Naïve Bayes (GNB) | PubChem Fingerprints | 0.55 ± 0.02 | Information Not Available | Information Not Available | Information Not Available | Information Not Available |
The MLP-Morgan model demonstrates high reliability and robustness, making it well-suited for practical predictive tasks in kinase inhibitor discovery [108]. Explainable AI (XAI) techniques, such as SHAP (SHapley Additive exPlanations), can be integrated to interpret predictions and identify key molecular features driving ligand-target interactions [108].
Experimental Validation Protocols
In Vitro Kinase Inhibition Assay
This protocol measures the half-maximal inhibitory concentration (IC₅₀) of a compound against a purified kinase target, quantifying its potency.
Key Materials:
- Purified recombinant human kinase protein (e.g., c-Src)
- Test compounds (e.g., identified from virtual screening)
- Reference control inhibitor (e.g., Bosutinib for c-Src)
- ATP and kinase-specific peptide substrate
- ADP-Glo Kinase Assay Kit or similar luminescence-based detection system
- White, flat-bottom 96- or 384-well assay plates
- Multi-mode microplate reader capable of measuring luminescence
Procedure:
- Compound Dilution: Prepare a serial dilution of the test and reference compounds in DMSO, followed by further dilution in the appropriate kinase assay buffer.
- Reaction Setup: In each well of the assay plate, combine the following:
- 10 µL of compound solution or buffer control (for 100% activity and background wells).
- 10 µL of kinase solution in assay buffer.
- 10 µL of a substrate/ATP mixture. The final ATP concentration should be near the Km for the specific kinase.
- Incubation: Seal the plate and incubate at a controlled temperature (e.g., 25-30°C) for a predetermined time (e.g., 60 minutes) to allow the kinase reaction to proceed.
- Reaction Termination & Detection:
- Add an equal volume of ADP-Glo Reagent to terminate the kinase reaction and deplete any remaining ATP. Incubate for 40-60 minutes.
- Add the Kinase Detection Reagent to convert ADP to ATP. Incubate for 30-60 minutes.
- Measure the generated luminescence signal on a microplate reader.
- Data Analysis:
- Calculate the percentage of kinase activity for each compound concentration relative to the DMSO control (100% activity).
- Plot the percentage inhibition versus the logarithm of the compound concentration.
- Fit the data to a four-parameter logistic curve (e.g., using GraphPad Prism) to determine the IC₅₀ value.
Exemplary Validation: A recent pharmacophore-based virtual screening study identified a novel c-Src inhibitor (compound 71736582) with an experimentally determined IC₅₀ of 517 nM, which was comparable to the positive control bosutinib (IC₅₀ 408 nM) [12].
Cell-Based Cytotoxicity and Selectivity Profiling
This protocol assesses the compound's ability to inhibit kinase-dependent cell proliferation and its selective toxicity towards cancer cells.
Key Materials:
- Cancer cell lines relevant to the kinase target (e.g., A549, MDAMB-231, HCT-116, DU-145, PC-3) [12]
- Non-cancerous control cell line
- Test compounds and control agents
- Cell culture media and reagents
- CCK-8 (Cell Counting Kit-8) or MTT assay kit
Procedure:
- Cell Seeding: Seed cancer and non-cancerous cells in 96-well tissue culture plates at a density optimized for logarithmic growth and allow them to adhere overnight.
- Compound Treatment: Treat cells with a range of concentrations of the test compound, a positive control, and a vehicle control (e.g., DMSO). Include replicates for each condition.
- Incubation: Incubate the plates for a predetermined time (e.g., 48-72 hours) at 37°C in a humidified 5% CO₂ incubator.
- Viability Measurement:
- For CCK-8: Add 10 µL of CCK-8 solution directly to each well and incubate for 1-4 hours.
- Measure the absorbance at 450 nm using a microplate reader.
- Data Analysis:
- Calculate the percentage of cell viability for each concentration relative to the vehicle-treated control.
- Determine the half-maximal cytotoxic concentration (CC₅₀ or IC₅₀) by non-linear regression analysis.
Table 2: Experimental IC₅₀ Values from Corroborative Studies. This table provides examples of experimental IC₅₀ values obtained from kinase inhibition and cell-based assays, demonstrating the successful translation of computational predictions [12] [109].
| Assay Type | Target / System | Identified Compound / Extract | Experimental IC₅₀ / CC₅₀ | Positive Control (IC₅₀) |
|---|---|---|---|---|
| Kinase Inhibition | c-Src Kinase | 71736582 | 517 nM | Bosutinib (408 nM) [12] |
| Cytotoxicity | HeLa (Cervical Cancer) | Solanecio mannii Aqueous Extract | 12.53 ± 4.98 µg/mL | Information Not Available [109] |
| Cytotoxicity | A549, MDAMB-231, HCT-116, etc. | 71736582 | Data Available (Active) | Information Not Available [12] |
Research Reagent Solutions
A successful experimental corroboration pipeline relies on specific, high-quality reagents and software tools.
Table 3: Essential Research Reagents and Tools for Computational and Experimental Kinase Research.
| Item Name | Function / Application | Exemplary Source / Kit |
|---|---|---|
| KinasePred | Computational workflow combining ML and XAI for predicting kinase activity and providing structural insights [108]. | Custom Platform / -- |
| c-Src Kinase | A commonly overexpressed non-receptor tyrosine kinase used as a prototype target for anticancer inhibitor screening [12]. | Recombinant protein, commercial suppliers |
| ADP-Glo Kinase Assay | Luminescent kinase assay for quantifying ADP production; ideal for profiling inhibitors with high sensitivity [12]. | Promega Corporation |
| CCK-8 Assay | Colorimetric cell viability assay based on WST-8, used for determining cytotoxicity and anti-proliferative effects. | Dojindo Molecular Technologies |
| ChemBridge Library | Commercial small-molecule library used for high-throughput virtual screening and hit identification [12]. | ChemBridge Corporation |
| GraphPad Prism | Statistical and data analysis software for curve-fitting (e.g., IC₅₀ determination) and generating publication-quality graphs [110]. | GraphPad Software |
Integrated Workflow Visualization
The following diagrams, generated with Graphviz DOT language, illustrate the logical pathway from computational prediction to experimental validation.
Integrated Workflow for Kinase Inhibitor Validation
Mechanism of Kinase Inhibitor Action
Within the framework of a broader thesis on developing a robust pharmacophore-based virtual screening protocol for kinase inhibitors, the retrospective benchmarking of methods using validated success metrics is a critical foundational step. Virtual screening (VS) has become an indispensable technique in early-stage drug discovery to identify bioactive compounds in a cost-effective and time-efficient manner [111]. The core objective of a retrospective virtual screen is to simulate a prospective screening campaign using known active ligands and presumed inactive decoys, thereby allowing researchers to estimate the ligand enrichment power of their VS approach before committing significant experimental resources [111] [112].
For kinase-focused research, where target families exhibit high structural homology, objective assessment through rigorous benchmarking ensures that the selected computational methods can achieve both high enrichment and sufficient selectivity. This application note details the essential metrics, datasets, and experimental protocols for the retrospective benchmarking of pharmacophore-based virtual screening methods, with specific emphasis on their application in kinase inhibitor discovery.
Core Metrics for Virtual Screening Performance
The performance of a virtual screening campaign is primarily quantified using metrics that evaluate its ability to prioritize active compounds over inactive ones in a ranked list. The two most critical metrics are the Enrichment Factor and the Hit Rate.
Enrichment Factor
The Enrichment Factor (EF) is a decisive metric that measures the concentration of active compounds within a specified top fraction of the screened database compared to a random selection [112]. It is calculated as follows:
[ EF_X = \frac{\text{(Number of actives found in top X\% of the ranked list)} / \text{(Total number of actives)}}{\text{X\%}} ]
An EF of 1 indicates performance equivalent to random selection, while higher values indicate better enrichment. The top fraction (X%) is often reported at 1% (EF1), 2% (EF2), or 20% (EF20) of the database [111] [112].
Hit Rate
The Hit Rate (HR), sometimes referred to as the yield, is the proportion of true active compounds within the top-ranked hits selected for experimental testing. It is defined as:
[ HR = \frac{\text{Number of true active compounds identified}}{\text{Total number of compounds selected for testing}} ]
This metric is highly relevant to project resources, as it directly influences the number of compounds that must be procured and tested experimentally to confirm activity.
Benchmarking Data Sets and Their Application to Kinases
The quality of the benchmarking set, comprising known active ligands and carefully chosen decoys, is paramount for a fair and unbiased assessment [111]. Using biased data sets can lead to over-optimistic performance estimates that do not translate to real-world prospective screens.
Characteristics of a High-Quality Benchmarking Set
An ideal benchmarking set should possess several key characteristics [111] [112]:
- Physical Similarity, Topological Dissimilarity: Decoy molecules should closely match the physical properties (e.g., molecular weight, logP, hydrogen bond count) of the active ligands to prevent the scoring function from separating actives from inactives based on trivial physicochemical properties rather than true complementarity. However, decoys must be topologically distinct to ensure they are unlikely true binders.
- Avoidance of Bias: Common biases in benchmarking include "analogue bias" (where actives are too structurally similar), "artificial enrichment," and the inclusion of "false negatives" (decoys that might actually be binders) [111].
- Target Relevance: For kinase-focused screening, benchmarking sets should include relevant kinase targets and their known inhibitors to ensure the assessment is meaningful for the target class.
Standardized Benchmarking Data Sets
Several publicly available benchmarking data sets have been developed to meet these criteria. The table below summarizes the most widely used sets relevant to kinase research.
Table 1: Key Benchmarking Data Sets for Virtual Screening
| Data Set Name | Type | Key Features | Relevance to Kinase Research | Reference |
|---|---|---|---|---|
| DUD-E(Directory of Useful Decoys: Enhanced) | SBVS/LBVS | Contains 22,886 active ligands and 50 chemically diverse decoys per active, carefully matched to ligands by physicochemical properties but dissimilar in 2D topology. | Includes several important kinase targets such as CDK2, EGFr, VEGFr2, and SRC. | [111] [112] |
| DEKOIS(Demanding Evaluation Kits for Objective In Silico Screening) | SBVS | Designed to provide "harder" decoys by avoiding molecules that are topologically too similar to known actives, thus reducing artificial enrichment. | Includes benchmarking sets for various targets; kinase-specific sets can be utilized. | [111] |
| MUV(Maximum Unbiased Validation) | LBVS | Specifically designed for ligand-based methods with clusters of active compounds selected to be structurally distinct, minimizing analogue bias. | Applicable for benchmarking ligand-based kinase inhibitor searches. | [111] |
Experimental Protocol for Retrospective Benchmarking
The following protocol provides a detailed methodology for conducting a retrospective benchmark of a pharmacophore-based virtual screening approach against kinase targets.
Preparation of the Benchmarking Environment
- Target and Data Set Selection: Select a kinase target of interest (e.g., c-Src kinase) for which a reliable benchmarking set is available. Download the relevant data set (e.g., from DUD-E), which will include a set of active ligands and a larger set of decoy molecules [20] [112].
- Database Curation: Combine the active and decoy molecules into a single database file (e.g., in SDF or MOL2 format). Ensure the structures are properly prepared: add hydrogens, generate reasonable 3D conformations, and assign correct protonation states at physiological pH.
- Pharmacophore Model Generation:
- Structure-Based Approach: If a crystal structure of the target kinase is available (from the PDB), use it to generate a pharmacophore model. Identify key interaction features in the binding pocket (e.g., hydrogen bond donors/acceptors, hydrophobic areas, aromatic rings) using software such as MOE, Catalyst, or Pharmit [5] [113]. Add exclusion volumes to represent the steric boundaries of the pocket.
- Ligand-Based Approach: If several active ligands are known but a protein structure is unavailable, use these to develop a common pharmacophore hypothesis that captures the essential shared chemical features responsible for their biological activity [5].
Execution of the Virtual Screen
- Pharmacophore Screening: Use the generated pharmacophore model as a query to screen the prepared benchmarking database. Software like MOE's pharmacophore search or Pharmit can be used for this step [76]. This step will filter out molecules that do not match the core pharmacophore features.
- Multi-Step Filtering (Optional): The hits from the pharmacophore screen can be subjected to further filtering, such as:
- In Silico Pharmacokinetic (ADMET) Profiling: Predict properties like absorption, distribution, metabolism, excretion, and toxicity to filter out compounds with undesirable profiles [74] [22].
- Multi-Level Molecular Docking: Dock the filtered hits into the kinase's binding site using programs like Glide or GOLD. Re-rank the compounds based on their docking scores and binding poses [74] [20].
Performance Calculation and Analysis
- Ranking and EF Calculation: Rank the final list of compounds based on the primary scoring metric (e.g., pharmacophore fit value or docking score). Calculate the enrichment factors (EF) at different early recognition thresholds (e.g., EF1%, EF5%, EF20%) [112].
- Hit Rate Calculation: Determine the hit rate by considering the number of known active ligands recovered within a hypothetical selection of the top N compounds (e.g., top 100 or top 1000) from the ranked list.
- ROC Curve Analysis: Generate a Receiver Operating Characteristic (ROC) curve by plotting the true positive rate against the false positive rate at all ranking thresholds. Calculate the Area Under the Curve (AUC) as an additional measure of overall screening performance [111]. A perfect method has an AUC of 1.0, while random performance yields an AUC of 0.5.
Diagram 1: Benchmarking Workflow
Table 2: Key Reagents and Computational Tools for Benchmarking
| Category | Item/Software | Brief Description of Function |
|---|---|---|
| Benchmarking Data Sets | DUD-E | Provides target-specific active ligands and property-matched decoys for unbiased benchmarking [111] [112]. |
| DEKOIS 2.0 | Offers challenging decoy sets to minimize the risk of artificial enrichment [111]. | |
| Protein Structure Repository | RCSB Protein Data Bank (PDB) | Source for experimentally solved 3D structures of kinase targets, essential for structure-based pharmacophore modeling [5]. |
| Pharmacophore Software | MOE (Molecular Operating Environment) | Integrated suite for pharmacophore model development, virtual screening, and analysis [76]. |
| Pharmit | Online platform for interactive pharmacophore-based and shape-based screening [113]. | |
| Catalyst/Discovery Studio | Classic software environment for creating pharmacophore models and performing 3D database searches [5]. | |
| Docking Software | Glide | High-performance docking tool often used for re-ranking pharmacophore hits and pose prediction [111] [20]. |
| GOLD | Genetic algorithm-based docking program for accurate binding mode prediction [111]. | |
| AutoDock | Widely used open-source docking suite [111]. | |
| Compound Libraries | ZINC Database | Publicly accessible database of commercially available compounds for virtual screening [112] [6]. |
| NCI Database | The National Cancer Institute's compound library, containing diverse structures for screening [74]. | |
| Analysis & Visualization | ROC Curve & AUC | Graphical plot and integral value to assess the overall quality of the virtual screening ranking [111]. |
| Enrichment Factor (EF) | Quantitative metric evaluating the early enrichment capability of a VS method [112]. |
Diagram 2: Benchmarking Concept
Rigorous retrospective benchmarking using enrichment factors and hit rates is a non-negotiable prerequisite for validating any pharmacophore-based virtual screening protocol intended for kinase inhibitor discovery. By leveraging unbiased benchmarking sets like DUD-E and adhering to the detailed experimental protocol outlined herein, researchers can objectively compare the performance of different pharmacophore models and screening strategies. This process ensures that the chosen computational approach possesses a genuine ability to enrich true kinase inhibitors, thereby significantly de-risking the subsequent costly and time-consuming experimental screening efforts. A well-validated protocol forms the cornerstone of a successful rational drug design project aimed at discovering novel, potent, and selective kinase inhibitors.
Conclusion
Pharmacophore-based virtual screening has evolved into a powerful, indispensable strategy for kinase inhibitor discovery, effectively bridging computational predictions and experimental outcomes. The integration of AI and machine learning is dramatically accelerating the screening process and enhancing the accuracy of binding affinity predictions. Future advancements will depend on the continued development of more sophisticated scoring functions, better handling of protein dynamics, and the tighter integration of multi-omics data. The successful application of these protocols, as demonstrated for targets like c-Src and JAK kinases, paves the way for discovering novel, selective kinase inhibitors with improved therapeutic profiles, ultimately accelerating the development of next-generation cancer therapies and treatments for other diseases.
References
- 1. Applications of the Pharmacophore Concept in Natural ... [https://pmc.ncbi.nlm.nih.gov/articles/PMC7685156/]
- 2. Pharmacophore - an overview [https://www.sciencedirect.com/topics/medicine-and-dentistry/pharmacophore]
- 3. A pharmacophore map of small molecule protein kinase ... [https://pubmed.ncbi.nlm.nih.gov/17941626/]
- 4. Pharmacophore - an overview [https://www.sciencedirect.com/topics/biochemistry-genetics-and-molecular-biology/pharmacophore]
- 5. Drug Design by Pharmacophore and Virtual Screening ... [https://pmc.ncbi.nlm.nih.gov/articles/PMC9145410/]
- 6. Machine learning accelerates pharmacophore-based ... [https://www.nature.com/articles/s41598-024-58122-7]
- 7. Ligand-Based Pharmacophore Modeling Using Novel 3D ... [https://pmc.ncbi.nlm.nih.gov/articles/PMC6321403/]
- 8. ELIXIR-A: An Interactive Visualization Tool for Multi-Target ... [https://pmc.ncbi.nlm.nih.gov/articles/PMC9025992/]
- 9. In silico Methods for Design of Kinase Inhibitors as Anticancer ... [https://pmc.ncbi.nlm.nih.gov/articles/PMC6960140/]
- 10. Advancements in Protein Kinase Inhibitors: From Discovery to ... [https://pmc.ncbi.nlm.nih.gov/articles/PMC12180671/]
- 11. Advancing Src kinase inhibition: From structural design to ... [https://www.sciencedirect.com/science/article/abs/pii/S0223523425001345]
- 12. Pharmacophore-based high-throughput virtual screening ... [https://www.sciencedirect.com/science/article/abs/pii/S096808962500392X]
- 13. Pharmacophore-based virtual screening versus docking ... [https://www.nature.com/articles/aps2009159]
- 14. A Combination of Pharmacophore-Based Virtual Screening ... [https://pmc.ncbi.nlm.nih.gov/articles/PMC9146354/]
- 15. Pharmacophore-based virtual screening, molecular ... [https://pubmed.ncbi.nlm.nih.gov/35862656/]
- 16. A case study on kinase inhibitors | PLOS Computational Biology [https://journals.plos.org/ploscompbiol/article?id=10.1371/journal.pcbi.1005678]
- 17. integrating QSAR into machine learning for kinase-targeted ... [https://pubmed.ncbi.nlm.nih.gov/40181786/]
- 18. Exploring the potential of protein-based pharmacophore ... [https://pmc.ncbi.nlm.nih.gov/articles/PMC3725268/]
- 19. PharmRL: pharmacophore elucidation with deep geometric ... [https://bmcbiol.biomedcentral.com/articles/10.1186/s12915-024-02096-5]
- 20. Pharmacophore-based high-throughput virtual screening ... [https://pubmed.ncbi.nlm.nih.gov/41161068/?utm_source=FeedFetcher&utm_medium=rss&utm_campaign=None&utm_content=0Uxf2h0Xu8DQGWEeJWMtaK2YhOWSs1CNogBvUVgaBmv&fc=None&ff=20251104153832&v=2.18.0.post22+67771e2]
- 21. Building shape-focused pharmacophore models for ... [https://pmc.ncbi.nlm.nih.gov/articles/PMC11312248/]
- 22. Pharmacophore-based virtual screening and in silico ... [https://www.frontiersin.org/journals/pharmacology/articles/10.3389/fphar.2025.1531512/full]
- 23. A pharmacophore-guided deep learning approach for ... [https://pmc.ncbi.nlm.nih.gov/articles/PMC10558534/]
- 24. Ligand-Based Pharmacophore Modeling, Molecular ... [https://pubmed.ncbi.nlm.nih.gov/33096664/]
- 25. Pharmacophore Modeling of Janus Kinase Inhibitors [https://www.mdpi.com/1420-3049/30/10/2183]
- 26. Ligand-Based and Structure-Based Pharmacophore ... [https://bio-protocol.org/exchange/minidetail?id=9587520&type=30]
- 27. Structure-based identification of novel FAK1 inhibitors ... [https://www.nature.com/articles/s41598-025-23203-8]
- 28. Structure-Based vs Ligand-Based Drug Design [https://www.iaanalysis.com/structure-based-vs-ligand-based-drug-design.html]
- 29. Structure Based Design, Synthesis, Pharmacophore Modeling ... [https://pmc.ncbi.nlm.nih.gov/articles/PMC3985759/]
- 30. T023 · What is a kinase? — TeachOpenCADD 0 ... [https://projects.volkamerlab.org/teachopencadd/talktorials/T023_what_is_a_kinase.html]
- 31. Predicting the target landscape of kinase inhibitors using 3D ... [https://journals.plos.org/ploscompbiol/article?id=10.1371/journal.pcbi.1011301]
- 32. Leveraging multiple data types for improved compound ... [https://www.nature.com/articles/s41467-024-52055-5]
- 33. KLIFS - the structural kinase database [https://klifs.net/details.php?structure_id=11604]
- 34. A comprehensive exploration of the druggable ... [https://pmc.ncbi.nlm.nih.gov/articles/PMC11268620/]
- 35. Pharmacophore-based virtual screening of commercial ... [https://www.frontiersin.org/journals/chemistry/articles/10.3389/fchem.2024.1412349/full]
- 36. Getting the PDB structures of compounds in ChEMBL [https://www.blopig.com/blog/2021/10/getting-the-pdb-structures-of-compounds-in-chembl/]
- 37. Receptor-based pharmacophore modeling, molecular docking ... [https://bmcchem.biomedcentral.com/articles/10.1186/s13065-024-01135-0]
- 38. 3.1. Generation and Validation of Pharmacophore Model [https://bio-protocol.org/exchange/minidetail?id=7580123&type=30]
- 39. Pharmacophore Modeling and Virtual Screening for Novel ... [https://pmc.ncbi.nlm.nih.gov/articles/PMC3088311/]
- 40. Pharmacophore Modeling, Virtual Screening, and ... [https://pmc.ncbi.nlm.nih.gov/articles/PMC3558715/]
- 41. A Case Study on Fyn and Lyn Protein Kinases [https://pubmed.ncbi.nlm.nih.gov/40887885/]
- 42. Enhancing accuracy of virtual kinase profiling via application of graph neural network to 3D pharmacophore ensembles | Journal of Computer-Aided Molecular Design [https://link.springer.com/article/10.1007/s10822-025-00666-5]
- 43. Integration of pharmacophore-based virtual screening ... [https://pmc.ncbi.nlm.nih.gov/articles/PMC11627428/]
- 44. Accelerating discovery of bioactive ligands with pharmacophore-informed generative models - PMC [https://pmc.ncbi.nlm.nih.gov/articles/PMC11894060/]
- 45. Pharmacophore-based high-throughput virtual screening ... [https://www.sciencedirect.com/science/article/pii/S096808962500392X]
- 46. High-Throughput Virtual Screening, Molecular Dynamics ... [https://pmc.ncbi.nlm.nih.gov/articles/PMC6412273/]
- 47. Pharmacophore-based virtual screening for the ... [https://pmc.ncbi.nlm.nih.gov/articles/PMC7339285/]
- 48. Kinase Inhibitor Identification and Drug Development [https://strbd.com/service/kinase.php]
- 49. De Novo Design of Protein Kinase Inhibitors by in Silico ... [https://pmc.ncbi.nlm.nih.gov/articles/PMC3833278/]
- 50. Kinase Type II Inhibitor Screening Library [https://lifechemicals.com/screening-libraries/targeted-and-focused-screening-libraries/kinase-general-libraries/kinase-targeted-libraries/kinase-type-ii-inhibitor-screening-library]
- 51. Pharmacophore-based virtual screening versus docking ... [https://pmc.ncbi.nlm.nih.gov/articles/PMC4007494/]
- 52. Docking compared to 3D-pharmacophores: the scoring ... [https://www.sciencedirect.com/science/article/abs/pii/S1740674910000557]
- 53. Multi-stage structure-based virtual screening approach ... [https://bmcchem.biomedcentral.com/articles/10.1186/s13065-025-01389-2]
- 54. Multi-stage structure-based virtual screening approach ... [https://pubmed.ncbi.nlm.nih.gov/39893479/]
- 55. Binding Affinity Prediction: From Conventional to Machine ... [https://arxiv.org/html/2410.00709v2]
- 56. The future of pharmaceuticals: Artificial intelligence in drug ... [https://www.sciencedirect.com/science/article/pii/S2095177925000656]
- 57. Kinase-inhibitor binding affinity prediction with pretrained ... [https://pubmed.ncbi.nlm.nih.gov/40663653/]
- 58. Machine learning methods for protein-protein binding ... [https://www.frontiersin.org/journals/bioinformatics/articles/10.3389/fbinf.2022.1065703/full]
- 59. LSTM-Based Prediction of Human PK Profiles and ... [https://pubmed.ncbi.nlm.nih.gov/41147737/]
- 60. ADMET Predictions - Computational Chemistry Glossary [https://deeporigin.com/glossary/admet-predictions]
- 61. A Systematic Analysis of Physicochemical and ADME ... [https://pmc.ncbi.nlm.nih.gov/articles/PMC5748879/]
- 62. Revolutionizing pharmacology: AI-powered approaches in ... [https://www.sciencedirect.com/science/article/pii/S259009862500020X]
- 63. ADMETrix: ADMET-Driven De Novo Molecular Generation [https://chemrxiv.org/engage/chemrxiv/article-details/68623158c1cb1ecda03a547b]
- 64. ADMET Predictor® Modules [https://www.simulations-plus.com/software/admetpredictor/]
- 65. Chalcone-9: a novel inhibitor of the JAK-STAT pathway ... [https://pmc.ncbi.nlm.nih.gov/articles/PMC12066378/]
- 66. An exhaustive examination of the research progress in ... [https://pmc.ncbi.nlm.nih.gov/articles/PMC12369162/]
- 67. Concepts and Applications Exemplified on Hydroxysteroid ... [https://pmc.ncbi.nlm.nih.gov/articles/PMC6332202/]
- 68. multi-target inhibitors for c-Src kinases (Csk) and retinoic ... [https://www.explorationpub.com/Journals/eds/Article/1008109]
- 69. Exploring Novel Furochochicine Derivatives as Promising ... [https://www.sciencedirect.com/science/article/pii/S2001037025003289]
- 70. design, synthesis and molecular dynamic studies [https://pubmed.ncbi.nlm.nih.gov/40684724/]
- 71. The Light and Dark Sides of Virtual Screening [https://pmc.ncbi.nlm.nih.gov/articles/PMC6470506/]
- 72. Approaches to improve the performance of virtual screening [https://www.frontiersin.org/research-topics/61923/approaches-to-improve-the-performance-of-virtual-screening-scoring-functions-structural-filtration-prediction-of-physicochemical-propertiespharmacological-activity/magazine]
- 73. E-pharmacophore and deep learning based high ... [https://www.sciencedirect.com/science/article/abs/pii/S1476927124001609]
- 74. Pharmacophore-based virtual screening and in silico ... [https://pmc.ncbi.nlm.nih.gov/articles/PMC12009819/]
- 75. Pharmacophore-based virtual screening and density ... [https://www.nature.com/articles/aps201221]
- 76. 3.2. Pharmacophore-Based Virtual Screening [https://bio-protocol.org/exchange/minidetail?id=7580127&type=30]
- 77. Pharmacophore-based approach for the identification of ... [https://www.sciencedirect.com/science/article/pii/S266702242500012X]
- 78. Editorial: Approaches to improve the performance of virtual ... [https://www.frontiersin.org/journals/pharmacology/articles/10.3389/fphar.2025.1658699/full]
- 79. Properties of FDA-approved small molecule protein kinase ... [https://www.sciencedirect.com/science/article/pii/S1043661825001483]
- 80. Structure based pharmacophore modeling, virtual ... [https://www.nature.com/articles/s41598-021-83626-x]
- 81. Recent progress on tyrosine kinase inhibitors resistance in ... [https://pmc.ncbi.nlm.nih.gov/articles/PMC12635987/]
- 82. Therapeutic Drug Monitoring for Precision Dosing of Janus ... [https://www.researchprotocols.org/2025/1/e70312]
- 83. From Brute Force to Smart Search: AI-Guided Docking ... [https://www.ailurus.bio/post/from-brute-force-to-smart-search-ai-guided-docking-achieves-a-1000x-leap-in-drug-discovery]
- 84. Beyond rigid docking: deep learning approaches for fully ... [https://pmc.ncbi.nlm.nih.gov/articles/PMC12406700/]
- 85. Rapid traversal of vast chemical space using machine ... [https://www.nature.com/articles/s43588-025-00777-x]
- 86. A Pharmacophore-Based Method for Rapid and Accurate ... [https://pubmed.ncbi.nlm.nih.gov/40694045/]
- 87. Building shape-focused pharmacophore models for effective ... [https://jcheminf.biomedcentral.com/articles/10.1186/s13321-024-00857-6]
- 88. Preparing to Tackle Large-Scale Data Analytics Projects [https://www.adaptiveus.com/blog/tackle-large-scale-data-analytics-projects/]
- 89. Computational solutions to large-scale data management and ... [https://pmc.ncbi.nlm.nih.gov/articles/PMC3124937/]
- 90. Analytical methods for protein kinase and inhibitor ... [https://www.sciencedirect.com/science/article/abs/pii/S0165993624005089]
- 91. Comprehensive assay of kinase catalytic activity reveals ... [https://pmc.ncbi.nlm.nih.gov/articles/PMC3230241/]
- 92. Shape-based screening - Schrödinger [https://www.schrodinger.com/life-science/learn/white-papers/shape-based-screening/]
- 93. PharmRL: pharmacophore elucidation with deep geometric ... [https://pmc.ncbi.nlm.nih.gov/articles/PMC11687028/]
- 94. deep learning-guided pharmacophore modeling for ultra-large ... [https://pubs.rsc.org/en/content/articlehtml/2024/sc/d4sc04854g]
- 95. Pharmacophore screening, molecular docking, and MD ... [https://www.frontiersin.org/journals/pharmacology/articles/10.3389/fphar.2025.1534707/full]
- 96. Employing steered MD simulations for effective virtual ... [https://pubmed.ncbi.nlm.nih.gov/40157686/]
- 97. Structure-based virtual screening, molecular docking, and MD ... [https://pmc.ncbi.nlm.nih.gov/articles/PMC12312920/]
- 98. Virtual screening and molecular dynamics simulations ... [https://www.nature.com/articles/s41598-023-28716-8]
- 99. Pharmacophore-based virtual screening for identification of ... [https://www.sciencedirect.com/science/article/pii/S2667022424003499]
- 100. The MM/PBSA and MM/GBSA methods to estimate ligand- ... [https://pmc.ncbi.nlm.nih.gov/articles/PMC4487606/]
- 101. Application of MM-PBSA Methods in Virtual Screening - PMC [https://pmc.ncbi.nlm.nih.gov/articles/PMC7221544/]
- 102. Virtual Screening, Molecular Dynamics, MM-PBSA and In ... [https://article.innovationforever.com/JMBDD/20230345.html]
- 103. Assessing the performance of MM/PBSA and MM/GBSA ... [https://pubs.rsc.org/en/content/articlelanding/2018/cp/c7cp07623a]
- 104. 4.4. MM-GBSA/MM-PBSA Binding Energy Calculations [https://bio-protocol.org/exchange/minidetail?id=18158503&type=30]
- 105. Identification of potential natural analgesic compounds ... [https://www.nature.com/articles/s41598-025-23655-y]
- 106. Pharmacophore model-aided virtual screening combined with ... [https://arabjchem.org/pharmacophore-model-aided-virtual-screening-combined-with-comparative-molecular-docking-and-molecular-dynamics-for-identification-of-marine-natural-products-as-sars-cov-2-papain-like-protease-inhibito/]
- 107. Quantitative Structure–Activity Relationship Modeling of ... [https://pmc.ncbi.nlm.nih.gov/articles/PMC6151389/]
- 108. KinasePred: A Computational Tool for Small-Molecule Kinase ... [https://pmc.ncbi.nlm.nih.gov/articles/PMC11900317/]
- 109. Computational investigation and experimental validation of ... [https://journals.plos.org/plosone/article?id=10.1371/journal.pone.0323680]
- 110. Effective Data Visualization in Life Sciences: Tools, charts ... [https://lifesciences.enago.com/blogs/effective-data-visualization-in-life-sciences-tools-charts-and-best-practices]
- 111. Benchmarking methods and data sets for ligand ... [https://www.sciencedirect.com/science/article/abs/pii/S1046202314003788]
- 112. Benchmarking Sets for Molecular Docking - PMC [https://pmc.ncbi.nlm.nih.gov/articles/PMC3383317/]
- 113. PharmacoForge: pharmacophore generation with diffusion ... [https://www.frontiersin.org/journals/bioinformatics/articles/10.3389/fbinf.2025.1628800/full]