Advanced Digital PCR Protocols for KRAS Mutation Detection: A Comprehensive Guide for Precision Oncology Research
This article provides a comprehensive overview of digital PCR (dPCR) methodologies for sensitive and specific detection of KRAS mutations, crucial biomarkers in colorectal, pancreatic, and other cancers.
Advanced Digital PCR Protocols for KRAS Mutation Detection: A Comprehensive Guide for Precision Oncology Research
Abstract
This article provides a comprehensive overview of digital PCR (dPCR) methodologies for sensitive and specific detection of KRAS mutations, crucial biomarkers in colorectal, pancreatic, and other cancers. Covering foundational principles to advanced applications, we detail emerging techniques including drop-off assays and melting curve analysis for multiplexed detection in liquid biopsies. The content addresses critical optimization strategies for challenging samples like cell-free DNA, presents rigorous validation frameworks against next-generation sequencing, and explores the transformative potential of dPCR in therapeutic monitoring and drug development. This guide equips researchers and drug development professionals with practical protocols and insights to implement robust KRAS mutation detection in their precision oncology workflows.
KRAS Mutations and Digital PCR Fundamentals: Principles and Clinical Significance
KRAS (Kirsten rat sarcoma viral oncogene homolog) is one of the most frequently mutated oncogenes in human cancer, playing a critical role in the pathogenesis of multiple solid tumors [1]. This small GTPase functions as a molecular switch, cycling between an active GTP-bound state and an inactive GDP-bound state to regulate fundamental signal transduction pathways controlling cell growth, differentiation, and survival [2]. Oncogenic mutations—primarily at codons 12, 13, and 61—disrupt the GTPase cycle, leading to constitutive KRAS activation and persistent downstream signaling through pathways including RAF-MEK-ERK (MAPK) and PI3K-AKT-mTOR [3] [1]. This review examines the prevalence and clinical significance of KRAS mutations in two major gastrointestinal malignancies: colorectal adenocarcinoma and pancreatic ductal adenocarcinoma, with particular focus on their implications for diagnostic protocol development, especially using digital PCR technologies.
KRAS Mutation Prevalence and Spectrum
Colorectal Adenocarcinoma
Colorectal cancer (CRC) represents the third most frequent malignancy worldwide and the second leading cause of cancer-related mortality [4] [5]. Molecular profiling has revealed that KRAS mutations occur in approximately 40-47% of colorectal adenocarcinomas [4] [5] [2]. A recent large-scale multicenter study of 2,816 CRC patients reported KRAS mutations in 47.4% of cases, with the specific Gly12Asp (p.G12D) mutation detected in 23.9% of mutated tumors [4] [5].
Table 1: KRAS Mutation Profile in Colorectal Adenocarcinoma
| Parameter | Prevalence | Notes |
|---|---|---|
| Overall KRAS mutation frequency | 47.4% [4] | 2,816 patient multicenter study |
| Most common mutations | G12D (29.19%), G12V (22.17%), G12C (13.43%) [1] | Distribution among KRAS-mutated tumors |
| Gly12Asp (G12D) frequency | 23.9% of KRAS-mutated cases [5] | Most frequent single mutation |
| Associated clinicopathological features | Younger age (≤70 years), male predominance (58.6%), NOS histotype (87.1%), low pathologic grade (73.9%), high-grade budding (43.8%), lympho-vascular invasion (68.9%) [4] | Features specifically associated with G12D mutation |
Pancreatic Ductal Adenocarcinoma
Pancreatic ductal adenocarcinoma (PDAC) demonstrates one of the highest associations with KRAS mutations among all human cancers. Current data indicate that approximately 85-90% of PDAC cases harbor KRAS mutations [3] [6] [1]. The G12D and G12V mutations represent the most prevalent variants in pancreatic cancer, distinct from the mutation spectrum observed in other malignancies [3].
Table 2: KRAS Mutation Profile in Pancreatic Ductal Adenocarcinoma
| Parameter | Prevalence | Notes |
|---|---|---|
| Overall KRAS mutation frequency | 82.1-90% [1] [3] | Hallmark genetic alteration in PDAC |
| Most common mutations | G12D (37.0%), G12V (22.17%), G12R [1] [3] | G12R mutation is more specific to PDAC |
| Detection in liquid biopsy | 82.3% of patients with liver/lung metastases [6] | Using digital PCR on ctDNA |
| Clinical significance | Early event in pancreatic carcinogenesis (present in PanIN-1), therapeutic target [3] | Found in early precursor lesions |
KRAS Signaling Pathways and Oncogenic Mechanisms
The KRAS protein operates as a GDP-GTP-regulated molecular switch that is activated by guanine nucleotide exchange factors (GEFs, e.g., SOS) and inactivated by GTPase-activating proteins (GAPs, e.g., NF1) [1]. Upon activation by growth factor receptors, KRAS transduces signals through multiple effector pathways:
Oncogenic KRAS mutations—primarily at codons 12, 13, and 61—disrupt this regulatory cycle by impairing GTP hydrolysis, locking KRAS in its active GTP-bound state and driving constitutive downstream signaling regardless of upstream input [3] [1] [2]. This results in sustained activation of proliferative, survival, and metabolic programs that promote tumor development and progression.
Digital PCR Protocols for KRAS Mutation Detection
Digital PCR Workflow for Liquid Biopsy Applications
Digital PCR (dPCR) represents a leading technology for detection and quantification of rare KRAS mutations in liquid biopsy samples, enabling non-invasive cancer monitoring and treatment response assessment [7] [6]. The following workflow outlines a standardized protocol for KRAS mutation detection in circulating tumor DNA (ctDNA):
Optimized dPCR Protocol for KRAS Mutation Detection
Sample Preparation and cfDNA Extraction
- Collect whole blood in cell-stabilizing tubes (e.g., Streck) and process within 4-6 hours of collection [8]
- Perform double centrifugation: 1600×g for 10 minutes at 4°C, followed by plasma transfer and 16,000×g for 10 minutes to remove residual cells [6]
- Extract cell-free DNA using the QIAamp DNA Blood Mini Kit (Qiagen) or similar, with elution in low-EDTA TE buffer [9] [8]
- Quantify cfDNA using fluorometric methods (e.g., Qubit); expected yield ranges from 5-50 ng/mL plasma depending on tumor burden [9]
dPCR Reaction Setup
- Use the QuantStudio Absolute Q Digital PCR System (Thermo Fisher) or equivalent platform [7]
- Prepare 15-20μL reactions containing:
- For multiplex detection of 7 common KRAS mutations (G12D, G12R, G12V, G13D, G12A, G12C, G12S), use molecular beacon probes with distinct fluorophore-Tm combinations [6]
Thermal Cycling and Data Analysis
- Partition samples into 20,000 microwells using microfluidic array plates [6]
- Perform amplification with the following protocol:
- Enzyme activation: 95°C for 10 minutes
- 45 cycles of: 95°C for 30 seconds, 60°C for 60 seconds (annealing/extension)
- Final hold: 4°C [6]
- For melting curve analysis: Heat to 95°C, then cool to 35°C, followed by gradual heating to 80°C with continuous fluorescence measurement [6]
- Analyze using manufacturer's software with the following thresholds:
Key Optimization Strategies
- Short amplicon design (66bp): Enables efficient detection of fragmented cfDNA (average ~165bp) while suppressing pseudogene amplification through strategic primer placement in low-homology regions [6]
- Asymmetric PCR: Generates single-stranded amplicons complementary to molecular beacon probes, enhancing hybridization efficiency [6]
- Multiplexing with melting analysis: Combines fluorescent color with Tm values to discriminate multiple mutations beyond standard fluorophore limitations [6]
- Blocker oligonucleotides: Suppress amplification of processed pseudogenes (KRASP1) that may cause false positives [6]
Research Reagent Solutions
Table 3: Essential Reagents for KRAS Mutation Detection Experiments
| Reagent/Catalog | Manufacturer | Application | Key Features |
|---|---|---|---|
| Absolute Q Liquid Biopsy dPCR Assays | Thermo Fisher Scientific [7] | KRAS mutation detection | Preformulated assays; detect down to 0.1% VAF; 90-minute hands-on time |
| QIAamp DNA Blood Mini Kit | Qiagen [9] [8] | cfDNA extraction from plasma | High-purity DNA suitable for dPCR; minimal fragmentation |
| QuantStudio Absolute Q Digital PCR System | Thermo Fisher Scientific [7] | dPCR platform | Integrated workflow; absolute quantification; minimal pipetting steps |
| Pinpoint Slide DNA Isolation System | Zymo Research [9] | DNA extraction from FFPE | Macrodissection of tumor areas; compatible with degraded samples |
| Ion AmpliSeq Cancer Hotspot Panel | Life Technologies [9] | NGS validation | Covers KRAS, BRAF, EGFR; 50 cancer genes; low DNA input requirement |
Clinical Implications and Therapeutic Perspectives
KRAS mutation status has significant prognostic and predictive value in both colorectal and pancreatic cancers. In CRC, KRAS mutations confer resistance to anti-EGFR monoclonal antibodies (cetuximab, panitumumab), making mutation testing mandatory before treatment [4] [5] [2]. Additionally, specific KRAS mutations associate with distinct clinical outcomes; for instance, the Gly12Asp mutation correlates with younger patient age, male predominance, and specific histological features including high-grade budding and lympho-vascular invasion [4] [5].
Therapeutic targeting of KRAS has advanced significantly after decades of being considered "undruggable." KRAS G12C inhibitors (sotorasib, adagrasib) have shown clinical efficacy, though primarily in non-small cell lung cancer rather than gastrointestinal malignancies [1] [2]. For the more common G12D and G12V mutations prevalent in CRC and PDAC, several promising approaches are emerging:
- KRAS G12D inhibitors: MRTX1133 demonstrates selective inhibition of KRAS G12D in preclinical models [2]
- Pan-RAS inhibitors: RMC-6236 targets multiple RAS isoforms and mutations [2]
- SOS1 inhibitors: BI 1701963 prevents KRAS activation by blocking GDP/GTP exchange [2]
- mRNA vaccines: V941 (mRNA-5671) targets multiple prevalent KRAS mutations [2]
Liquid biopsy approaches using dPCR enable monitoring of therapeutic response and emerging resistance by tracking mutant KRAS allele frequencies in ctDNA over time [7] [6] [8]. This non-invasive approach facilitates real-time assessment of treatment efficacy and disease dynamics, potentially guiding therapeutic adjustments before radiographic progression.
KRAS mutations represent critical driver events in both colorectal and pancreatic ductal adenocarcinoma, with distinct prevalence patterns and clinical implications in each malignancy. The development of robust digital PCR protocols for KRAS mutation detection enables sensitive monitoring of tumor dynamics through liquid biopsy approaches, supporting personalized treatment strategies. As novel KRAS-targeted therapeutics continue to emerge, precise molecular characterization using these highly sensitive detection methods will become increasingly essential for optimal patient management and clinical trial stratification.
Digital PCR (dPCR) represents the third generation of polymerase chain reaction technology, enabling the absolute quantification of nucleic acids without the need for a standard curve. This core principle is achieved through three fundamental steps: partitioning of the PCR reaction mixture into thousands to millions of individual reactions, end-point amplification of these partitions, and precise counting of positive and negative reactions to calculate absolute target concentration using Poisson statistics [10].
The technology has evolved significantly since its conceptual origins in 1992 when Sykes et al. combined limiting dilution PCR with Poisson statistics [11] [10]. A landmark advancement came in 2003 with the development of BEAMing technology (beads, emulsion, amplification, and magnetics), which utilized water-in-oil droplets for compartmentalization, dramatically increasing partition numbers and simplifying the process [10]. Modern dPCR platforms now provide exceptional sensitivity for detecting rare mutations and precise quantification of nucleic acids, making the technology particularly valuable for liquid biopsy applications in oncology [12] [10].
Core Technological Principles
Partitioning Strategies
Partitioning is the foundational step that differentiates dPCR from other PCR technologies. The sample is randomly distributed across a large number of discrete partitions, effectively diluting the target molecules so that each partition contains zero, one, or a few template molecules according to Poisson distribution [10].
Table 1: Comparison of Major dPCR Partitioning Methods
| Partition Type | Technology Platforms | Typical Partition Volume | Number of Partitions | Key Advantages | Key Limitations |
|---|---|---|---|---|---|
| Droplet-based | Bio-Rad QX100, RainDance RainDrop | Picoliters to nanoliters | 20,000-10,000,000 | High scalability, cost-effective for large partition numbers | Requires surfactant stabilization, potential droplet coalescence |
| Microchamber-based | Fluidigm BioMark, Applied Biosystems QuantStudio | Nanoliters | 765-36,960 | Higher reproducibility, ease of automation | Fixed number of partitions, typically higher cost |
| Crystal Digital PCR | Stilla naica system | Nanoliters | 30,000+ per Sapphire chip | Combines 2D array format with droplet partitions, 3-6 color detection | Specialized microfluidic chips required [13] |
The partitioning process enables single-molecule sensitivity by effectively isolating individual DNA molecules within separate reaction compartments. This physical separation allows for the amplification of rare mutant sequences without competition from the abundant wild-type background, making dPCR exceptionally powerful for detecting low-frequency mutations in complex biological samples [11] [10].
End-Point Measurement
Unlike quantitative PCR (qPCR) which monitors amplification in real-time, dPCR utilizes end-point measurement following the completion of amplification cycles [14]. After thermal cycling, each partition is analyzed for fluorescence signal, classifying it as positive (containing the target sequence) or negative (lacking the target sequence) [10].
This binary readout is remarkably robust as it occurs during the plateau phase of PCR amplification when reaction kinetics have minimal impact on results. In contrast, qPCR relies on measurements during the exponential phase where slight variations in amplification efficiency can significantly affect quantification [14]. The endpoint approach of dPCR eliminates dependence on amplification efficiency, providing more consistent and reproducible results across different samples and operators [11].
Absolute Quantification
The absolute quantification capability of dPCR stems from the combination of partitioning and Poisson statistics. The fraction of negative partitions (p₀) is used to calculate the average number of target molecules per partition (λ) using the formula: λ = -ln(p₀) [10]. The target concentration in the original sample is then determined based on the known partition volume and dilution factors.
This approach provides calibration-free quantification that does not require standard curves, eliminating a major source of variability and potential error in molecular quantification [11] [10]. The statistical nature of this method also enables precise measurement of small fold changes (as low as 1.2-fold), surpassing the capabilities of qPCR which typically distinguishes 1.5-fold changes at best [11].
Application Note: KRAS Mutation Detection in Liquid Biopsies
Clinical Significance
KRAS mutations are highly prevalent in human malignancies, particularly in pancreatic ductal adenocarcinoma (90-95% of cases) and colorectal cancer [12] [15]. These mutations serve as critical biomarkers for therapeutic decisions, as they predict lack of response to anti-EGFR treatments in colorectal cancer [16]. The detection and monitoring of KRAS mutations in liquid biopsies represents a promising non-invasive approach for tumor molecular profiling, treatment response assessment, and minimal residual disease detection [12] [15].
Technical Approach: Drop-off ddPCR Assay
A novel KRAS exon 2 drop-off digital PCR assay has been developed to overcome the limitations of mutation-specific ddPCR assays [12] [15]. This innovative approach uses two locked nucleic acid (LNA)-based probes:
- A HEX-labeled drop-off probe spanning the mutation hotspot within codons 12/13, complementary to the wild-type sequence
- A FAM-labeled reference probe located 9 bp upstream within the same amplicon, complementary to a stable wild-type region [15]
In this design, wild-type molecules yield a double-positive (HEX+FAM) signal, while mutations in the hotspot region prevent hybridization of the drop-off probe, resulting in a "drop-off" of the HEX signal and a shift to FAM-only positive droplets [15]. This strategy enables detection of any mutation within the covered hotspot region, overcoming the limitation of having to design specific probes for each possible mutation [12].
Diagram Title: KRAS Drop-off ddPCR Workflow
Performance Validation
Table 2: Performance Metrics of KRAS Drop-off ddPCR Assay
| Parameter | Result | Methodology |
|---|---|---|
| Limit of Detection (LoD) | 0.57 copies/µL | Determined using serial dilutions of mutant DNA [12] |
| Limit of Blank (LoB) | 0.13 copies/µL | Measured using negative control samples [12] |
| Inter-assay Precision (r²) | 0.9096 | Calculated from repeated measurements of reference samples [12] |
| Clinical Sensitivity | 97.2% (35/36 samples) | Comparison with tissue sequencing results [12] [15] |
| Specificity | Superior to commercial KRAS multiplex assay | Cross-validation with reference methods [12] |
The assay demonstrated robust performance in clinical validation studies using plasma samples from patients with gastrointestinal malignancies, accurately identifying single nucleotide variants in 35 of 36 circulating tumor DNA-positive samples [12]. The use of LNA-modified probes enhanced binding specificity and allowed for shorter probe designs suitable for the fragmented nature of circulating tumor DNA [15].
Detailed Experimental Protocol
Sample Preparation and cfDNA Extraction
- Blood Collection: Collect venous blood into commercially available cfDNA blood collection tubes (e.g., Ruwag, cat. no. 218997) [15]
- Plasma Separation: Perform two sequential centrifugation steps (1,600-3,000 × g for 10-20 minutes) to isolate plasma while avoiding platelet disruption [15]
- cfDNA Extraction: Extract cfDNA from 2-4 mL plasma using the SEP/SBS protocol of the PME-free circulating DNA extraction kit (Analytik Jena, cat. no. 845-IR-0003050) [15]
- cfDNA Quantification: Measure DNA concentration using fluorometric quantification (e.g., Qubit 4 Fluorometer, Thermo Fisher Scientific) [15]
- Quality Control: Ensure DNA concentrations typically range from 0.1 to 20 ng/µL; store at -20°C until use [15]
KRAS Drop-off ddPCR Assay
Research Reagent Solutions:
Table 3: Essential Reagents for KRAS Drop-off ddPCR
| Reagent | Function | Specifications |
|---|---|---|
| LNA-based Probes | Sequence-specific detection | HEX-labeled drop-off probe (17 bp), FAM-labeled reference probe (19 bp) [15] |
| Primers | Target amplification | KRAS exon 2-specific; designed using Beacon Designer v.8.20 [15] |
| ddPCR Supermix | Reaction environment | Optimized for probe-based digital PCR; no dUTP if using UDG treatment |
| Nuclease-free Water | Reaction volume adjustment | PCR-grade, molecular biology quality |
| DNA Template | Target nucleic acid | 60 ng maximum input cfDNA per well to prevent droplet overload [15] |
Protocol Steps:
Reaction Setup:
- Prepare 20-22 µL reaction mixture containing:
- 10 µL of 2× ddPCR Supermix
- 1 µL of HEX-labeled drop-off probe (final concentration 250 nM)
- 1 µL of FAM-labeled reference probe (final concentration 250 nM)
- Forward and reverse primers (optimal concentration determined during assay optimization)
- 10 µL of template cfDNA (maximum 60 ng total) [15]
- Include negative controls (nuclease-free water) and positive controls (synthetic oligonucleotides with known mutations)
- Prepare 20-22 µL reaction mixture containing:
Droplet Generation:
- Follow manufacturer protocols for droplet generation using the appropriate automated droplet generator
- Transfer emulsified samples to a 96-well PCR plate
- Seal the plate with a foil heat seal
Thermal Cycling:
- Use the following optimized cycling conditions:
- Enzyme activation: 95°C for 10 minutes
- 40-45 cycles of:
- Denaturation: 95°C for 30 seconds
- Annealing/Extension: Optimized temperature (55-60°C) for 1 minute
- Enzyme deactivation: 98°C for 10 minutes
- Hold at 4°C until analysis [15]
- Use the following optimized cycling conditions:
Droplet Reading and Analysis:
- Process plate in droplet reader following manufacturer's instructions
- Analyze fluorescence data using associated software
- Apply Poisson correction to calculate absolute copy numbers
Diagram Title: KRAS Assay Reagent Workflow
Assay Optimization and Troubleshooting
- Temperature Optimization: Test a range of elongation temperatures (55-65°C) to determine the optimal temperature that provides good separability between positive and negative populations without non-specific amplification [17]
- Primer/Probe Concentration Titration: Perform checkerboard titrations of primer and probe concentrations to identify optimal concentrations that maximize signal-to-noise ratio
- Multiplexing Potential: The KRAS drop-off assay can be multiplexed with mutation-specific probes for simultaneous detection of specific mutations and the broader hotspot region [12]
- Sample Quality Assessment: Regularly monitor extraction efficiency and DNA fragmentation patterns to ensure consistent assay performance
Digital PCR represents a significant advancement in nucleic acid quantification technology, with particular utility for detecting low-frequency mutations in liquid biopsy samples. The KRAS exon 2 drop-off ddPCR assay exemplifies how this technology can be applied to clinical cancer management, providing a highly sensitive and specific method for monitoring tumor-associated mutations in circulating tumor DNA. The core dPCR principles of partitioning, end-point measurement, and absolute quantification without standard curves establish this technology as an indispensable tool for molecular diagnostics and personalized cancer therapy.
This application note details the superior performance characteristics of digital PCR (dPCR), specifically Droplet Digital PCR (ddPCR), for detecting KRAS mutations in circulating tumor DNA (ctDNA) from liquid biopsies. When compared to quantitative PCR (qPCR) and Next-Generation Sequencing (NGS), ddPCR demonstrates enhanced sensitivity and specificity for low-abundance targets, a rapid turnaround time, and a streamlined, absolute quantification workflow that does not require standard curves. These advantages make ddPCR an indispensable tool for applications in oncology research and drug development, including minimal residual disease (MRD) monitoring and therapy response assessment.
The analysis of circulating tumor DNA (ctDNA) from liquid biopsies presents a significant technical challenge. ctDNA often constitutes less than 0.1% of the total cell-free DNA (cfDNA) in a patient's plasma, demanding techniques with exceptional sensitivity and precision [18]. While qPCR and NGS are widely used, digital PCR, particularly ddPCR, has emerged as a powerful platform that optimally balances sensitivity, specificity, speed, and cost for targeted mutation detection.
This document provides a detailed comparison of these technologies and an optimized protocol for a novel KRAS codon 12/13 ddPCR "drop-off" assay, capable of detecting a broad spectrum of mutations within this critical hotspot with a limit of detection (LOD) of 0.57 copies/µL [15].
Technology Comparison: dPCR vs. qPCR vs. NGS
The table below summarizes the key performance metrics of the three primary nucleic acid quantification technologies in the context of liquid biopsy analysis.
Table 1: Comparative Analysis of Key Technologies for Liquid Biopsy Applications
| Feature | Digital PCR (dPCR/ddPCR) | Quantitative PCR (qPCR) | Next-Generation Sequencing (NGS) |
|---|---|---|---|
| Quantification Method | Absolute, via Poisson statistics | Relative, requires standard curve | Absolute, based on read counts [19] |
| Sensitivity (LoD) | Very High (<0.1% mutant allele frequency) [18] | Moderate (0.1-1.0% mutant allele frequency) [18] | High (~1% for targeted panels; can be lower with ultra-deep sequencing) [19] |
| Specificity | High [15] | High | High to Very High (with single-base resolution) |
| Discovery Power | Low: Detects only known, pre-defined mutations | Low: Detects only known, pre-defined mutations | High: Hypothesis-free; detects known and novel variants [19] |
| Throughput (Multiplexing) | Low to Moderate | Low to Moderate | Very High: Can profile >1000 targets in a single assay [19] |
| Turnaround Time | Rapid (~ hours to a day) [18] | Rapid (~ hours to a day) | Slow (days to weeks, including library prep and data analysis) [20] |
| Cost per Sample | Low to Moderate (for targeted analysis) | Low | High (instrumentation, reagents, and bioinformatics) |
| Ideal Application | Ultra-sensitive detection and absolute quantification of known, low-abundance mutations (e.g., MRD, therapy monitoring) | High-throughput screening for abundant targets (e.g., gene expression, pathogen detection with moderate sensitivity needs) | Comprehensive genomic profiling, discovery of novel variants, and analysis of complex genetic regions |
Experimental Protocol: KRAS Drop-Off ddPCR Assay
The following section provides a detailed methodology for detecting KRAS exon 2 hotspot mutations (codons 12 and 13) in ctDNA using a novel ddPCR drop-off assay, as described by Ondraskova et al. and a separate 2025 study in Diagnostic Pathology [15] [16].
Principle of the Drop-Off Assay
This assay uses two probes, both complementary to the wild-type KRAS sequence:
- A HEX-labeled "drop-off" probe spanning the mutation hotspot.
- A FAM-labeled "reference" probe binding upstream of the hotspot.
In a wild-type sequence, both probes bind, resulting in a double-positive (FAM+/HEX+) signal. A mutation in the hotspot causes the drop-off probe to fail to hybridize, leading to a "drop-off" in the HEX signal and a FAM-only positive droplet [15].
Required Materials and Equipment
Table 2: Research Reagent Solutions for KRAS ddPCR Drop-Off Assay
| Item | Function / Description | Example / Specification |
|---|---|---|
| ddPCR System | Partitions sample, performs PCR, and reads fluorescence of individual droplets. | QIAcuity (Qiagen), QuantStudio Absolute Q (Thermo Fisher) [10] |
| cfDNA Extraction Kit | Isolves cell-free DNA from plasma samples. | PME-free circulating DNA extraction kit (Analytik Jena) [15] |
| DNA Fluorometer | Precisely quantifies isolated cfDNA concentration. Critical for determining optimal input. | Qubit 4 Fluorometer (Thermo Fisher) [15] |
| LNA-based Probes & Primers | Enhances probe specificity and affinity, allowing for shorter probe designs ideal for fragmented ctDNA. | Custom ordered from Integrated DNA Technologies (IDT) [15] |
| ddPCR Supermix | Optimized PCR reaction mix for droplet-based digital PCR. | ddPCR Supermix for Probes (Bio-Rad) |
| Drop-off Probe (HEX) | Binds to wild-type KRAS codon 12/13; signal "drops off" if mutation is present. | 17-bp, HEX-labeled, LNA-modified [15] |
| Reference Probe (FAM) | Binds to a stable wild-type region upstream; confirms successful amplification. | 19-bp, FAM-labeled, LNA-modified [15] |
| Primers | Amplifies the region of KRAS exon 2 containing codons 12 and 13. | Designed using Beacon Designer software [15] |
Step-by-Step Protocol
Step 1: Plasma Collection and cfDNA Extraction
- Collect peripheral blood into cfDNA-stabilizing blood collection tubes (e.g., Streck, Ruwag) [15].
- Isolate plasma via a two-step centrifugation protocol (e.g., 1,600 × g for 10 min, then 16,000 × g for 10 min) to remove cells and debris.
- Extract cfDNA from 2-4 mL of plasma using a specialized cfDNA extraction kit, following the manufacturer's instructions (e.g., SEP/SBS protocol) [15].
- Elute DNA in a low TE buffer or nuclease-free water and store at -20°C.
Step 2: cfDNA Quantification and Quality Control
- Quantify the extracted cfDNA using a fluorescence-based method (e.g., Qubit). DNA concentrations typically range from 0.1 to 20 ng/µL [15].
- Critical Note: Do not exceed 60 ng of cfDNA per ddPCR well to prevent droplet overcrowding and ensure accurate Poisson statistics.
Step 3: ddPCR Reaction Setup
- Prepare a reaction mix on ice as follows. A typical 20-22 µL reaction volume is used for droplet generation:
- 10 µL: ddPCR Supermix for Probes (2X)
- 1 µL: Drop-off Probe (HEX-labeled, 20 µM stock)
- 1 µL: Reference Probe (FAM-labeled, 20 µM stock)
- 1.8 µL: Forward Primer (20 µM stock)
- 1.8 µL: Reverse Primer (20 µM stock)
- 4.4 µL: Nuclease-free water
- 10 µL: Template cfDNA
- Gently mix the reaction by pipetting. Do not vortex after adding the supermix.
Step 4: Droplet Generation and PCR Amplification
- Transfer the entire reaction mix to a droplet generation cartridge or chip according to your specific ddPCR instrument's protocol.
- Generate tens of thousands of nanoliter-sized droplets.
- Transfer the emulsified sample to a 96-well PCR plate and seal.
- Perform PCR amplification on a thermal cycler using the following cycling conditions, optimized for LNA probes:
- Step 1: Enzyme activation at 95°C for 10 minutes.
- Step 2: 40 cycles of:
- Denaturation: 94°C for 30 seconds.
- Annealing/Extension: 55-60°C (optimize for your assay) for 60 seconds.
- Step 3: Enzyme deactivation at 98°C for 10 minutes.
- Step 4: Hold at 4°C.
- Ramp Rate: Use a slow ramp rate (e.g., 2°C/second) for optimal droplet stability.
Step 5: Droplet Reading and Data Analysis
- Load the PCR plate into the droplet reader.
- The reader will flow droplets one-by-one past a two-color (FAM/HEX) detector.
- Analyze the data using the instrument's accompanying software.
- Set thresholds to distinguish positive and negative droplets for each channel. The software will automatically calculate the absolute concentration (copies/µL) of both wild-type and mutant KRAS molecules based on the fraction of positive droplets and Poisson statistics.
Performance and Validation Data
The described KRAS drop-off ddPCR assay has been rigorously validated, demonstrating performance characteristics that underscore the advantages of the ddPCR platform.
Table 3: KRAS Drop-Off ddPCR Assay Performance Metrics
| Performance Metric | Result | Methodology / Notes |
|---|---|---|
| Limit of Detection (LoD) | 0.57 copies/µL | Determined by testing dilution series of mutant DNA in wild-type background [15] |
| Limit of Blank (LoB) | 0.13 copies/µL | Measured by repeatedly testing negative control (wild-type only) samples [15] |
| Inter-Assay Precision (r²) | 0.9096 | High correlation coefficient indicating excellent reproducibility across multiple runs [15] |
| Clinical Validation (Sensitivity) | 97.2% (35/36) | Accurately identified KRAS mutations in ctDNA-positive patient samples [15] |
| Specificity | Outperformed a commercial multiplex assay | The drop-off design reduces false positives [15] |
| Dynamic Range | Linear from >0.1% to 100% mutant allele frequency | Suitable for detecting both low-level MRD and high tumor burden [18] |
For researchers and drug development professionals focusing on targeted oncogene detection, ddPCR provides a compelling alternative to both qPCR and NGS. Its calibration-free absolute quantification, ultra-high sensitivity for rare alleles, and rapid turnaround time make it ideally suited for liquid biopsy applications such as monitoring MRD and tracking therapy response dynamics in near real-time [18]. The KRAS drop-off ddPCR protocol detailed herein offers a robust, highly sensitive, and specific method for monitoring a key oncogenic driver in gastrointestinal and other malignancies, accelerating research in precision oncology.
Digital PCR (dPCR) represents a fundamental shift in nucleic acid quantification, enabling absolute quantification without the need for standard curves. The core principle involves partitioning a sample into thousands of individual reactions, performing end-point PCR amplification, and applying Poisson statistics to calculate absolute target concentration based on the ratio of positive to negative partitions [21] [22]. This technical note traces the historical evolution of dPCR from its limiting dilution origins to modern automated systems, with specific application to KRAS mutation detection in clinical oncology research. KRAS mutations are crucial predictive markers in metastatic colorectal cancer, pancreatic cancer, and lung cancer, with mutation frequencies ranging from 30% to 90% across different cancer types [23] [24]. The precision of dPCR makes it particularly valuable for detecting low-abundance mutations in heterogeneous tumor samples and liquid biopsies, enabling improved therapeutic targeting and patient stratification.
Historical Development: From Limiting Dilution to Digital PCR
Early Foundations: Limiting Dilution PCR (1990-1999)
The conceptual foundation of digital PCR was established in 1990 through "limiting dilution PCR," where researchers performed PCR on multiple replicate samples at extreme dilutions to quantify HIV provirus molecules [22]. This method relied on Poisson distribution statistics to calculate target molecule concentration based on the proportion of negative amplifications. Throughout the 1990s, this approach was independently developed by multiple research groups who recognized that limiting dilution to single molecule levels followed by PCR amplification enabled both qualitative analysis of individual molecules and absolute quantification of nucleic acid targets [22]. The technique proved valuable for studying viral diversity and quantifying minimal residual disease in leukemia, but remained laborious and prone to contamination due to its open-tube format [22].
Conceptual Formalization: Digital PCR (1999)
The term "digital PCR" was formally introduced by Vogelstein and Kinzler in 1999 to describe the quantitation of ras mutations by partitioning samples across 384-well plates [22]. This landmark publication conceptualized the approach as a digital analysis of nucleic acids, where individual molecules are isolated into separate reaction chambers and amplified to detectable levels. The transition to fluorescence-based endpoint detection eliminated the need for gel electrophoresis, representing a significant technical advancement [22]. Despite this innovation, adoption remained limited due to the manual partitioning process and the concurrent emergence of real-time quantitative PCR, which offered simpler workflow and closed-tube formats [22].
Technological Renaissance: Automated Partitioning Systems (2007-Present)
Beginning around 2007, dPCR experienced a renaissance driven by engineering advances in microfluidics and partitioning technologies [22]. Commercial systems evolved along two primary technological pathways: droplet-based dPCR (ddPCR) systems that generate water-in-oil emulsions, and chip-based or nanoplate-based dPCR systems that partition samples into nanoscale chambers [21] [23]. These automated platforms addressed the key limitations of early dPCR by providing closed-system workflows, higher throughput, and simplified operation, leading to exponential growth in dPCR publications and applications across diverse fields including oncology, virology, and environmental monitoring [21] [23] [22].
Table 1: Evolution of Digital PCR Technologies
| Era | Technology | Partitioning Method | Key Advantages | Limitations |
|---|---|---|---|---|
| 1990-1999 | Limiting Dilution PCR | Manual serial dilution in multiwell plates | Absolute quantification, single molecule sensitivity | Laborious, low throughput, contamination risk |
| 1999-2007 | Early Digital PCR | 384-well plates | Fluorescence endpoint detection, digital readout | Manual partitioning, limited partitions |
| 2007-Present | Droplet Digital PCR (ddPCR) | Water-in-oil emulsion droplets | High partition count (20,000), flexible assay design | Droplet stability concerns, complex oil-phase handling |
| 2007-Present | Chip/Nanoplate dPCR | Microfabricated chambers | Uniform partition volume, stable partitions, integrated design | Fixed partition count, custom chips required |
Modern dPCR Platforms: Performance Comparison and Applications
Technology Comparison: ddPCR vs. Nanoplate dPCR
Contemporary dPCR platforms primarily utilize either droplet-based or chamber-based partitioning systems. The QX200 droplet digital PCR system (Bio-Rad) generates approximately 20,000 nanoliter-sized droplets per sample, while the QIAcuity One nanoplate-based system (QIAGEN) uses microfluidic chips with up to 21,384 predefined partitions [21] [23]. Both platforms demonstrate similar limits of detection and quantification for synthetic oligonucleotides and biological samples, with minor variations in dynamic range and precision characteristics [21]. The optimal platform selection depends on specific application requirements, with droplet systems offering flexibility in partition number and chamber-based systems providing more consistent partition volumes and simplified workflows.
Performance Characteristics for KRAS Mutation Detection
Digital PCR demonstrates exceptional performance for KRAS mutation detection, with a limit of detection as low as 0.01%-0.1% mutant alleles in a wild-type background [24]. This sensitivity significantly exceeds conventional sequencing methods (approximately 20% LOD) and ARMS-PCR (approximately 1% LOD), enabling identification of rare mutant subclones in heterogeneous tumor samples [24] [25]. The precision of dPCR quantification for KRAS mutations shows high concordance with gravimetrically prepared reference materials (concordance >0.95), establishing it as a reference method for characterizing KRAS reference standards [24].
Table 2: Performance Comparison of dPCR Platforms for KRAS Mutation Detection
| Parameter | Droplet Digital PCR (QX200) | Nanoplate dPCR (QIAcuity) | Microfluidic Chip dPCR |
|---|---|---|---|
| Partition Number | ~20,000 droplets | Up to 21,384 chambers | 20,000-30,000 chambers |
| Partition Volume | Nanoliter range | Uniform nanoliter volumes | Defined chamber volumes |
| Limit of Detection | 0.01% mutant alleles [24] | Similar to ddPCR [21] | 0.2% mutation detection [23] |
| Dynamic Range | 4-6 orders of magnitude | 4-6 orders of magnitude | 4 orders of magnitude [23] |
| Multiplexing Capacity | 2-color detection standard | Integrated multicolor detection | 4-color system demonstrated [23] |
| Precision (CV) | 6-13% for quantification [21] | 7-11% for quantification [21] | Not specified |
| KRAS Codon Coverage | Codons 12, 13, 61, 146 | Codons 12, 13, 61, 146 | Codons 12, 13 primarily |
Advanced dPCR Protocol for KRAS Mutation Detection
Sample Preparation and DNA Extraction
Materials Required:
- FFPE tumor tissue sections (5-10 μm thickness)
- QIAamp DNA FFPE tissue kit (Qiagen) or equivalent
- Hematoxylin and eosin for pathological assessment
- Macrodissection tools
- Nanodrop spectrophotometer or Qubit fluorometer
Protocol:
- Pathologist qualification of tumor content (>20% tumor cells recommended) on H&E-stained section [25]
- Macrodissection of tumor-rich areas from consecutive unstained sections
- DNA extraction using dedicated FFPE kits according to manufacturer's instructions
- DNA quality assessment: A260/A280 ratio 1.8-2.0, A260/A230 ratio >2.0 [24]
- DNA quantification using fluorometric methods for improved accuracy
- Optional DNA digestion with restriction enzymes (EcoRI or HaeIII) to improve amplification efficiency of tandemly repeated sequences [21] [24]
Reaction Setup and Partitioning
Materials Required:
- ddPCR Supermix for Probes (No dUTP)
- Primers and FAM/VIC-labeled probes for KRAS mutations and reference genes
- DG8 cartridges and gaskets (ddPCR) or nanoplates (QIAcuity)
- Droplet Generation Oil for Probes (ddPCR)
Reaction Setup:
- Prepare 20-40 μL reaction mix containing:
- 10 μL of 2× ddPCR Supermix
- 1 μL of 5 μM primer mix
- 0.2 μL of 5 μM wild-type probe (VIC-labeled)
- 0.2 μL of 5 μM mutant probe (FAM-labeled)
- 2 μL template DNA (50-100 ng total)
- Nuclease-free water to final volume [24]
- For droplet-based systems:
- Transfer reaction mix to DG8 cartridge
- Generate droplets using droplet generator [26]
- Transfer droplets to 96-well PCR plate
- For nanoplate-based systems:
- Pipette reaction mix directly into nanoplate wells
- Seal plate with thermal seal [21]
Thermal Cycling and Signal Detection
Thermal Cycling Conditions:
- Enzyme activation: 95°C for 10 minutes
- 40 cycles of:
- Denaturation: 95°C for 15 seconds
- Annealing/Extension: 60°C for 60 seconds
- Enzyme deactivation: 98°C for 10 minutes
- Signal stabilization: 4°C hold [24]
Signal Detection and Analysis:
- For ddPCR: Read droplets using QX200 droplet reader
- For nanoplate dPCR: Image plates using integrated imager
- Analyze using manufacturer's software (QuantaSoft for Bio-Rad)
- Set fluorescence amplitude thresholds to distinguish positive and negative partitions
- Apply Poisson correction to calculate absolute copy numbers:
[ \text{Concentration} = -\ln(1 - \frac{\text{Positive Partitions}}{\text{Total Partitions}}) \times \frac{\text{Total Partitions}}{\text{Volume}} ]
Diagram 1: Comprehensive workflow for KRAS mutation detection using digital PCR, showing platform-specific steps for both droplet-based and nanoplate-based systems.
The Scientist's Toolkit: Essential Reagents and Materials
Table 3: Essential Research Reagent Solutions for dPCR-Based KRAS Detection
| Reagent/Material | Function/Application | Example Products |
|---|---|---|
| DNA Extraction Kits | Isolation of high-quality DNA from FFPE tissue | QIAamp DNA FFPE tissue kit (Qiagen) [25] |
| Restriction Enzymes | Improve amplification efficiency by digesting tandem repeats | EcoRI, HaeIII [21] [24] |
| dPCR Supermix | Optimized reaction buffer for partitioning and amplification | ddPCR Supermix for Probes (Bio-Rad) [26] [24] |
| Mutation-Specific Probes | Selective detection of wild-type and mutant KRAS alleles | FAM/VIC-labeled TaqMan MGB probes [24] |
| Partitioning Consumables | Generation of nanoscale reactions | DG8 Cartridges (ddPCR), QIAcuity Nanoplates [21] [26] |
| Droplet Generation Oil | Creates stable water-in-oil emulsions (ddPCR) | Droplet Generation Oil for Probes (Bio-Rad) [26] |
| Quantification Standards | Assay validation and quality control | Gravimetrically prepared reference materials [24] |
Applications in KRAS Mutation Research and Clinical Development
The exceptional precision and sensitivity of modern dPCR systems make them invaluable for multiple applications in oncology drug development. dPCR enables absolute quantification of mutant allele frequencies with precision sufficient to monitor minimal residual disease and emerging resistance mutations during targeted therapy [24]. The technology's low limit of detection (0.01-0.1%) facilitates non-invasive monitoring of KRAS mutations in liquid biopsies, enabling dynamic assessment of tumor burden and heterogeneity without repeated tissue biopsies [24]. Furthermore, dPCR serves as a reference method for characterizing KRAS reference materials and validating companion diagnostic assays, providing traceability to international standards [24]. The multiplexing capabilities of advanced dPCR systems allow simultaneous detection of multiple KRAS mutation types in a single reaction, conserving precious patient samples while providing comprehensive mutation profiles [23].
Diagram 2: Research and clinical applications of digital PCR in KRAS mutation detection, highlighting both technical and clinical uses.
The evolution from limiting dilution PCR to modern automated dPCR systems represents a paradigm shift in nucleic acid quantification, with particular significance for KRAS mutation detection in oncology. Contemporary droplet-based and nanoplate-based platforms offer robust, precise, and sensitive solutions for absolute quantification of mutant allele frequencies, enabling applications ranging from basic research to clinical diagnostics. The continued refinement of dPCR technologies, including increased multiplexing capabilities, improved workflow efficiency, and enhanced analytical performance, promises to further expand its utility in personalized cancer medicine and targeted therapeutic development.
The Kirsten rat sarcoma viral oncogene homolog (KRAS) is one of the most frequently mutated oncogenes in human cancers, driving tumorigenesis through constitutive activation of critical signaling pathways that regulate cell growth, proliferation, and survival [1]. KRAS mutations occur in over one-third of colorectal cancers (CRC) and demonstrate particularly high prevalence in pancreatic ductal adenocarcinoma (PDAC, ~82%), colorectal cancer (~40%), and non-small cell lung cancer (NSCLC, ~21%) [27] [1]. These mutations primarily cluster at specific hotspots within the GTPase domain, with codons 12 and 13 representing the most common alteration sites, accounting for approximately 98% of all KRAS mutations in human cancers [27] [1].
The KRAS protein functions as a molecular switch, cycling between an active GTP-bound state and an inactive GDP-bound state [27]. This cycling is regulated by guanine nucleotide exchange factors (GEFs like SOS) that promote GTP loading and GTPase-activating proteins (GAPs like NF1) that accelerate GTP hydrolysis [27] [1]. Mutations at codons 12 and 13 fundamentally disrupt this regulatory cycle by impairing GAP-mediated GTP hydrolysis, thereby locking KRAS in a constitutively active GTP-bound state that perpetually signals through downstream effectors including the RAF-MEK-ERK (MAPK) and PI3K-AKT-mTOR pathways [27]. This persistent signaling promotes uncontrolled cellular proliferation, impairs differentiation, and suppresses apoptosis – hallmark capabilities of cancer cells [27].
Table 1: Prevalence of Major KRAS Mutations Across Solid Tumors
| Mutation | Overall Cancer Prevalence | Pancreatic Cancer | Colorectal Cancer | Non-Small Cell Lung Cancer |
|---|---|---|---|---|
| G12D | 29.19% | 37.0% | 12.5% | - |
| G12V | 22.17% | - | 8.5% | - |
| G12C | 13.43% | - | - | 13.6% |
| All KRAS | ~11.2% (TCGA) | 82.1% | ~40% | 21.20% |
KRAS Mutation Hotspots: Codons 12 and 13
Biochemical Consequences of Codon 12 and 13 Mutations
The KRAS protein contains a highly conserved catalytic domain responsible for nucleotide exchange and GTP hydrolysis [1]. Codons 12 and 13 reside within the phosphate-binding loop (P-loop) of the G domain, which is critical for coordinating the phosphate groups of GTP and stabilizing the transition state during GTP hydrolysis [27]. Wild-type glycine at these positions provides the structural flexibility necessary for proper GAP-induced conformational changes that accelerate GTP hydrolysis [27].
Missense mutations at codon 12 (most commonly G12D, G12V, G12C) and codon 13 (primarily G13D) introduce amino acid substitutions with larger side chains that sterically hinder the GAP-binding interface and transition state stabilization [27]. This structural interference dramatically reduces intrinsic GTP hydrolysis rates by up to 1000-fold and renders the protein insensitive to GAP-mediated hydrolysis acceleration [27]. Consequently, mutant KRAS remains persistently GTP-bound and actively engaged with its effectors, leading to constitutive downstream signaling regardless of extracellular growth signals [27].
The specific amino acid substitution determines both the biochemical activity and transforming capacity of mutant KRAS, with different mutations exhibiting unique signaling properties, metabolic dependencies, and clinical behaviors [27]. For instance, cells harboring different KRAS mutations display distinct profiles in glycolysis, glutamine usage, and amino acid, choline, and nucleotide hexosamine metabolism, potentially influencing their responses to anticancer treatments [27].
Spectrum and Distribution of Mutations
The mutation spectrum at codons 12 and 13 demonstrates distinct patterns across cancer types, reflecting tissue-specific mutagenic processes and biological selection pressures [27]. The seven most common mutations in these codons include G12D, G12R, G12V, G13D, G12A, G12C, and G12S, though their prevalence varies significantly between cancer types [6].
In pancreatic ductal adenocarcinoma, G12D represents the most frequent KRAS mutation (37%), followed by G12V and G12R [1] [6]. Colorectal cancers show a more diverse distribution with G12D, G13D, and G12V as predominant variants [27] [1]. In non-small cell lung cancer, the G12C mutation is most common (13.6%), largely attributable to its association with tobacco carcinogen exposure [1]. Beyond these major cancer types, KRAS mutations at codons 12 and 13 also occur in biliary tract cancers (23.4% overall), with G12D being most prevalent across all biliary subtypes [28].
Table 2: Common KRAS Mutations at Codons 12 and 13 and Their Functional Impact
| Mutation | Amino Acid Change | Biochemical Effect | Transforming Potential |
|---|---|---|---|
| G12D | Glycine → Aspartic Acid | Steric hindrance of GAP binding, reduced GTP hydrolysis | High |
| G12V | Glycine → Valine | Steric hindrance of GAP binding, reduced GTP hydrolysis | High |
| G12C | Glycine → Cysteine | Steric hindrance of GAP binding, reduced GTP hydrolysis, creates allosteric pocket | Moderate-High |
| G13D | Glycine → Aspartic Acid | Alters switch I region, impairs GAP binding and GTP hydrolysis | Moderate |
| G12R | Glycine → Arginine | Steric hindrance and charge alteration impairs GAP binding | High (especially in pancreatic cancer) |
| G12S | Glycine → Serine | Moderate steric hindrance of GAP binding | Moderate |
| G12A | Glycine → Alanine | Mild steric hindrance of GAP binding | Moderate |
Therapeutic Implications of KRAS Mutations
Historical Context and Treatment Challenges
For decades, KRAS was considered "undruggable" due to several formidable challenges: the picomolar affinity of KRAS for GTP/GDP, high intracellular GTP concentrations, lack of well-defined allosteric regulatory sites, and the extensive protein-protein interaction surfaces that are inherently difficult to target with small molecules [27]. Early therapeutic strategies focused on indirect approaches, including inhibition of membrane localization through farnesyltransferase inhibitors (FTIs) and disruption of KRAS-effector interactions [1]. However, these strategies demonstrated limited clinical efficacy, as FTIs failed to completely block KRAS localization due to alternative prenylation pathways, and effector inhibition led to feedback reactivation of upstream signaling components [1].
The breakthrough in KRAS targeting came with the discovery that the KRAS G12C mutation creates a unique, druggable pocket adjacent to the nucleotide-binding site in the switch-II region [27] [1]. This revelation enabled the development of covalent inhibitors that specifically target the cysteine residue at position 12 and trap KRAS in its inactive GDP-bound state [27]. The subsequent FDA approvals of sotorasib (Lumakras) in 2021 and adagrasib (Krazati) in 2022 marked a paradigm shift in targeting KRAS-mutant cancers, demonstrating that direct KRAS inhibition was clinically achievable [27] [29] [1].
Mutation-Specific Therapeutic Approaches
The therapeutic landscape for KRAS-mutant cancers has evolved to include mutation-specific approaches that leverage the unique structural features of individual variants:
KRAS G12C Inhibitors: Sotorasib and adagrasib covalently bind to the cysteine-12 residue of mutant KRAS, locking it in its inactive GDP-bound state and preventing SOS-catalyzed nucleotide exchange and downstream signaling [27]. These agents have demonstrated clinical efficacy in NSCLC and colorectal cancer harboring the G12C mutation, leading to their regulatory approval [27] [29]. However, they are ineffective against other KRAS mutants lacking the cysteine residue [27].
Emerging KRAS G12D Inhibitors: The G12D mutation represents the most common KRAS variant across solid tumors but lacks a cysteine residue for covalent targeting. MRTX1133, a first-in-class KRAS G12D inhibitor, binds the switch II pocket through noncovalent interactions and demonstrates high selectivity for KRAS G12D over wild-type KRAS and other mutants [27]. This compound induces tumor regression in multiple preclinical models, including CRC, and represents a promising therapeutic approach for the most prevalent KRAS mutation [27].
Pan-KRAS and RAS(ON) Inhibitors: Next-generation KRAS inhibitors aim to overcome the limitations of mutation-specific agents through broader targeting strategies. Pan-RAS inhibitors like RMC-6236 (daraxonrasib) target multiple mutant and wild-type RAS isoforms, offering potential applicability across various KRAS mutations [27] [29]. RAS(ON) inhibitors represent another innovative approach, targeting the active GTP-bound state of KRAS rather than the inactive GDP-bound state targeted by first-generation inhibitors [27]. Compounds like RMC-9805 (zoldonrasib, targeting G12D) and RMC-5127 (targeting G12V) stabilize a ternary complex between mutant KRAS, a chaperone protein, and the inhibitor, effectively blocking KRAS-effector interactions [27]. Preclinical studies demonstrate sustained suppression of RAS pathway signaling and prolonged tumor regression with these agents, potentially overcoming adaptive resistance commonly observed with first-generation inhibitors [27].
Clinical Implications and Resistance Mechanisms
Despite the initial success of KRAS G12C inhibitors, their clinical efficacy remains limited by several factors. Response rates to single-agent therapy are approximately 30-40% with median progression-free survival of around 6 months, followed by the inevitable emergence of resistance mechanisms [1]. Resistance can occur through both primary and acquired mechanisms, including:
- Adaptive feedback reactivation: Treatment with KRAS G12C inhibitors triggers feedback activation of wild-type RAS and upstream receptor tyrosine kinases, leading to pathway reactivation [27].
- Secondary KRAS mutations: Acquisition of additional mutations in KRAS (such as Y96D, R68S, H95D/Q) that interfere with drug binding [27] [1].
- Bypass signaling activation: Activation of alternative signaling pathways (e.g., MET amplification, BRAF fusions) that circumvent KRAS dependency [1].
- Histological transformation: Transformation to alternative histological subtypes with different oncogenic dependencies [1].
To overcome these resistance mechanisms, combination strategies are being actively investigated, including pairing KRAS inhibitors with SHP2 inhibitors, SOS1 inhibitors, EGFR inhibitors, MEK inhibitors, and immune checkpoint inhibitors [27] [29]. Additionally, novel therapeutic modalities such as adoptive T-cell therapies and mRNA-based vaccines (e.g., V941/mRNA-5671) targeting multiple KRAS mutations are in clinical development, offering promising alternatives for overcoming therapeutic resistance [27].
Digital PCR for KRAS Mutation Detection
Principles and Advantages of Digital PCR
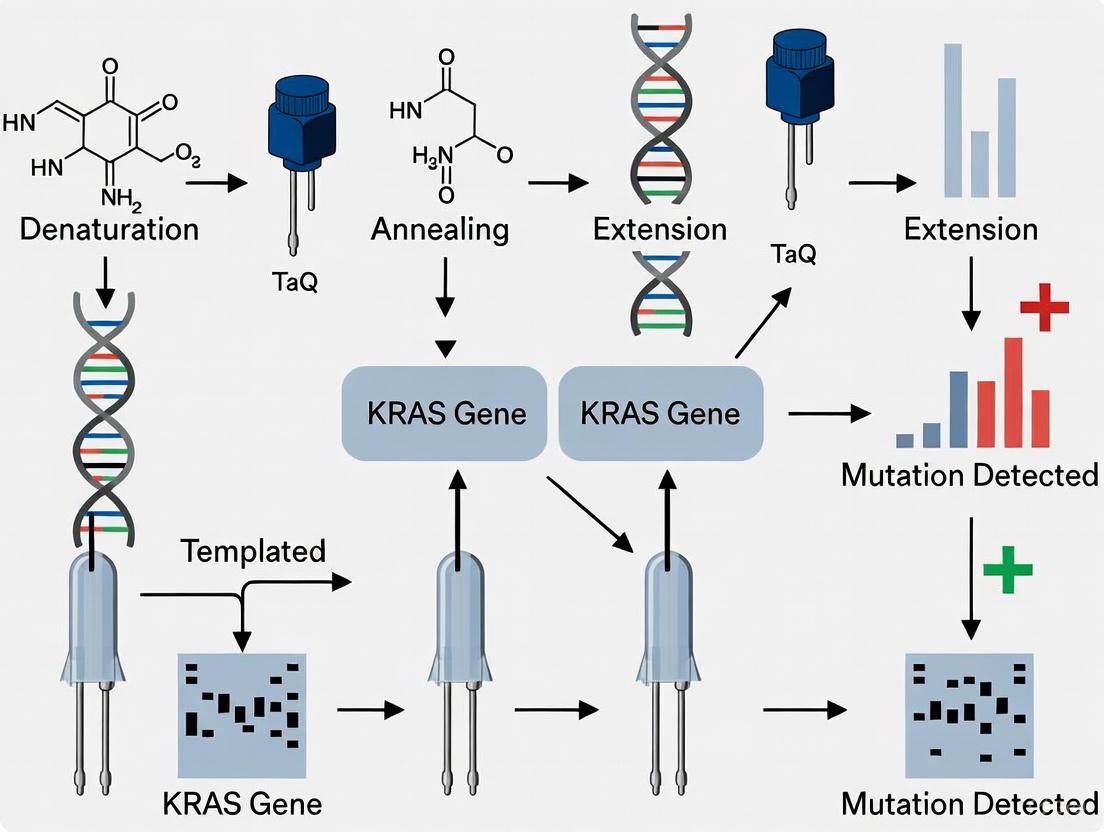
Digital PCR (dPCR) represents a highly sensitive nucleic acid quantification technology that enables absolute quantification of rare mutations without the need for standard curves [7] [6]. The method works by partitioning a PCR reaction into thousands of individual microchambers or droplets, each containing zero, one, or a few target DNA molecules [7] [6]. Following endpoint PCR amplification, each partition is analyzed for fluorescence signals to determine the presence or absence of specific targets, allowing for absolute quantification through Poisson statistics [7] [6].
For KRAS mutation detection in circulating cell-free DNA (cfDNA), dPCR offers several critical advantages:
- Exceptional sensitivity: dPCR can detect rare mutations with variant allele frequencies as low as 0.1% against a background of wild-type DNA, making it ideal for liquid biopsy applications where circulating tumor DNA (ctDNA) is often present at low concentrations [7].
- Absolute quantification: By counting individual DNA molecules, dPCR provides absolute quantification without requiring standard curves, improving accuracy and reproducibility compared to quantitative real-time PCR [7] [6].
- High precision: The partitioning process effectively enriches low-level targets, enabling precise quantification even at very low mutant allele frequencies [7].
- Multiplexing capabilities: Advanced dPCR platforms combined with melting curve analysis can simultaneously discriminate multiple KRAS genotypes beyond the limitations of fluorescent dye colors alone [6].
These technical advantages position dPCR as a powerful tool for detecting and monitoring KRAS mutations in clinical samples, particularly in the context of liquid biopsies where sensitivity and accuracy are paramount for tracking treatment response and emerging resistance [7] [6].
Optimized Digital PCR Protocol for KRAS Mutation Detection
The following protocol describes an optimized approach for detecting the seven most common KRAS mutations (G12D, G12R, G12V, G13D, G12A, G12C, and G12S) in circulating tumor DNA from plasma samples using dPCR combined with melting curve analysis [6].
Sample Preparation and DNA Extraction
- Blood Collection and Plasma Separation: Collect whole blood in EDTA-containing tubes. Process within 2 hours of collection by centrifugation at 1600 × g for 10 minutes at 4°C. Transfer the supernatant to a fresh tube and centrifuge at 16,000 × g for 10 minutes to remove residual cells.
- cfDNA Extraction: Extract cell-free DNA from plasma using commercially available cfDNA extraction kits according to manufacturer's instructions. Elute DNA in low-EDTA TE buffer or nuclease-free water.
- DNA Quantification: Quantify cfDNA using fluorometric methods. Typical yields range from 5-30 ng/mL of plasma, with fragment sizes predominantly around 165 bp.
Primer and Probe Design
- Primer Design: Design primers to generate short amplicons (optimally 66 bp) to enhance detection efficiency of fragmented cfDNA. Position primers to exploit mismatched bases between the KRAS gene and pseudogenes (KRASP1 and processed pseudogene KRASP1) located near codons 12 and 13 to suppress amplification of pseudogenes [6].
- Probe Selection: Use molecular beacon probes with stem-loop structures rather than hydrolysis probes. Molecular beacons are not degraded by polymerase during PCR and enable melting curve analysis. Label probes with different fluorescent dyes (FAM, HEX, Cy5) to enable multiplex detection [6].
dPCR Reaction Setup
Reaction Composition:
- 10 μL of 2× dPCR Master Mix
- 1.0 μL of primer-probe mix (final concentration 900 nM primers, 250 nM probes)
- 5-20 ng of cfDNA template
- Nuclease-free water to 20 μL total volume
Partitioning: Load the reaction mixture onto a silicon chip with 20,000 wells or generate droplets using a droplet generator according to manufacturer's protocols [6].
Thermal Cycling:
- Initial denaturation: 95°C for 10 minutes
- 45 cycles of:
- Denaturation: 95°C for 30 seconds
- Annealing/Extension: 60°C for 60 seconds
- Final extension: 72°C for 5 minutes
- Hold at 4°C
Melting Curve Analysis and Genotyping
- Melting Curve Acquisition: Place the partitioned samples on a temperature control stage and capture fluorescence images while ramping temperature from 45°C to 75°C in 0.5°C increments [6].
- Tm Determination: Plot fluorescence intensity against temperature for each positive partition and calculate melting temperature (Tm) by differentiating the melting curve.
- Genotype Calling: Determine the genotype of DNA in each partition based on fluorescence color and Tm value. Use a mutation type determination algorithm to accurately distinguish between different KRAS mutations [6].
Data Analysis
- Mutation Frequency Calculation: Calculate mutant allele frequency using the formula: [ MAF = \frac{\text{Number of mutant partitions}}{\text{Number of mutant partitions + Number of wild-type partitions}} \times 100\% ]
- Limit of Detection: The optimized protocol achieves a limit of detection below 0.2% for all target KRAS mutations [6].
Diagram Title: KRAS Signaling Pathway in Normal and Mutant States
Research Reagent Solutions
Table 3: Essential Reagents for KRAS Mutation Detection via Digital PCR
| Reagent/Category | Specific Examples | Function/Application |
|---|---|---|
| dPCR Systems | QuantStudio Absolute Q Digital PCR System | Partitioning and fluorescence detection platform for absolute quantification of nucleic acids |
| dPCR Chips/Cartridges | Microfluidic Array Plates (MAP) | Create thousands of individual partitions for digital PCR reactions |
| Detection Chemistry | TaqMan Assays, Molecular Beacons | Fluorescent probe systems for target-specific detection in dPCR |
| Reference Materials | Horizon Discovery Multiplex Reference Standards | Validated controls for assay development and validation |
| DNA Extraction Kits | cfDNA Extraction Kits | Specialized reagents for isolation of cell-free DNA from plasma samples |
| Primer Design Tools | Self-service design tools, Commercial design services | Enable development of mutation-specific detection assays |
| Liquid Biopsy Assays | Absolute Q Liquid Biopsy dPCR Assays | Pre-formulated, validated assays for detection of somatic mutations in ctDNA |
The comprehensive characterization of KRAS mutation hotspots at codons 12 and 13 has transitioned from biological curiosity to clinical necessity with the emergence of mutation-specific targeted therapies. The distinct biochemical properties and clinical behaviors associated with different KRAS variants underscore the importance of precise genotyping beyond simple mutant versus wild-type classification. Digital PCR technology provides the sensitivity, accuracy, and quantitative precision required for detecting and monitoring these critical mutations in both tissue and liquid biopsy specimens.
As the therapeutic landscape for KRAS-mutant cancers continues to evolve, with promising agents targeting G12D, G12V, and other non-G12C mutations advancing through clinical development, the role of sensitive molecular diagnostics will become increasingly important for patient selection, response monitoring, and resistance detection. The optimized dPCR protocols presented herein offer researchers and clinicians a robust methodology for interrogating KRAS status with the precision necessary to guide targeted therapeutic interventions and advance personalized cancer treatment strategies.
Implementing dPCR for KRAS: Step-by-Step Protocols and Liquid Biopsy Applications
The analysis of cell-free DNA (cfDNA) in plasma has become a cornerstone of liquid biopsy, enabling non-invasive access to tumor-derived genetic material. This is particularly vital in oncology for detecting driver mutations, such as those in the KRAS gene, which are associated with resistance to anti-EGFR therapies in colorectal cancer [30]. The reliability of downstream digital PCR (dPCR) analysis for sensitive KRAS mutation detection is profoundly dependent on the quality of the starting material [6] [31]. This application note provides a detailed protocol for the preparation of high-quality plasma and the subsequent extraction and quantification of cfDNA, framed within a research workflow for KRAS genotyping using dPCR.
Pre-Analytical Phase: Plasma Preparation
The pre-analytical phase is critical, as improper sample handling can lead to genomic DNA contamination from lysed blood cells, compromising the accuracy of mutant allele detection [32].
Materials for Blood Collection and Processing
- Blood Collection Tubes: K3EDTA tubes or specialized cell-free DNA BCT tubes (e.g., from Streck) [33] [30].
- Centrifuges: Capable of low-speed (~1600–2300 ×g) and high-speed (~6000–20,000 ×g) runs at room temperature (20°C) [32] [31] [33].
- Plasma Storage: 1.5/2.0 mL cryogenic tubes (e.g., Eppendorf Safe-Lock).
Detailed Protocol: Double-Centrifugation
- Blood Collection and Initial Handling: Draw blood via venipuncture into appropriate tubes. Invert tubes gently to mix anticoagulant. Process samples within 60 minutes of collection to minimize cell lysis [32].
- First Centrifugation (Cell Separation): Centrifuge tubes at 1600–2300 ×g for 10 minutes at 20°C. This step pellets blood cells [32] [33].
- Plasma Transfer: Carefully transfer the upper plasma layer to a new 15 mL Falcon tube using a pipette, avoiding the buffy coat and cell pellet.
- Second Centrifugation (Debris Clearance): Centrifuge the transferred plasma at a higher speed of 6000–16,000 ×g for 10 minutes at 20°C. This pellets any remaining cells and cellular debris [32] [31].
- Final Plasma Aliquoting: Transfer the clarified plasma into 1.5 mL Eppendorf tubes. Aliquot to avoid repeated freeze-thaw cycles. Freeze at -80°C within 30 minutes of the second centrifugation [32].
The following workflow diagram summarizes the entire process from blood draw to dPCR analysis:
cfDNA Extraction from Plasma
Efficient extraction is crucial for obtaining pure cfDNA with minimal fragment size bias, which directly impacts the detection efficiency of KRAS mutations, especially given the fragmented nature of cfDNA (~165 bp) [6].
Comparison of Commercial Kits
Commercial kits based on silica membrane or magnetic bead technologies are widely used. The table below summarizes the performance of several kits as reported in a comparative study [32].
Table 1: Performance Comparison of Commercial cfDNA Extraction Kits
| Product Name | Technology | Automation Potential | Input Volume (mL) | Elution Volume (µL) | Key Performance Notes |
|---|---|---|---|---|---|
| QIAamp Circulating Nucleic Acid Kit (Qiagen) | Spin Column (Vacuum) | No | 1 | 50 | Highest yield and reproducibility in comparative study [32] |
| MagNA Pure 24 Total NA Isolation Kit (Roche) | Magnetic Beads (Automated) | Yes | 2 | 100 | High yield and reproducibility; suitable for high-throughput workflows [32] |
| NucleoSpin Plasma XS (Macherey-Nagel) | Spin Column | No | 0.24 | 5-30 | Lower yield due to small input volume [32] |
| QIAmp MinElute ccfDNA Mini Kit (Qiagen) | Magnetic Beads | Yes | 1-4 | 20-80 | -- |
| MagMAX Cell-Free DNA Isolation Kit (Thermo Fisher) | Magnetic Beads | Yes | 0.5-10 | 15-50 | -- |
Generic Protocol for Manual cfDNA Extraction
This protocol is adaptable for spin-column or magnetic bead-based kits. Always follow the manufacturer's instructions for your specific kit.
- Thaw Plasma: Thaw frozen plasma aliquots at room temperature or in a refrigerator at 4°C.
- Lysis and Binding: Mix plasma with a lysis buffer containing a chaotropic salt (e.g., guanidine hydrochloride) to denature proteins and release cfDNA. For bead-based kits, magnetic silica beads are added to bind the cfDNA. For column-based kits, the lysate is loaded onto the silica membrane.
- Washes: Perform two or more wash steps with an ethanol-based wash buffer to remove salts, proteins, and other contaminants.
- Elution: Elute the purified cfDNA in a small volume of low-EDTA TE buffer or nuclease-free water (e.g., 20-100 µL, see Table 1). Use pre-heated elution buffer (50-70°C) and let it incubate on the membrane/beads for 2-5 minutes to increase elution efficiency.
- Storage: Store extracted cfDNA in DNA low-bind tubes at -20°C or -80°C for long-term storage [32].
cfDNA Quantification and Quality Control
Accurate quantification is essential for normalizing input into dPCR reactions. Fluorometric methods are preferred over spectrophotometry for their sensitivity and specificity for dsDNA.
Quantification Methods
- Fluorometric Quantification (Qubit): Uses DNA-intercalating dyes highly specific for dsDNA. The Qubit dsDNA HS Assay has a quantification range of 10 pg/µL–100 ng/µL, making it ideal for low-concentration cfDNA samples [32] [31]. It is not affected by contaminants like RNA or salts.
- Spectrophotometry (NanoDrop): Less recommended for cfDNA as it overestimates concentration in the presence of RNA, nucleotides, and other contaminants [34].
Quality Assessment and Fragment Analysis
- Purity Ratios: Assess spectrophotometric 260/280 and 260/230 ratios. Ideal ratios are ~1.8 and ~2.0, respectively, indicating minimal protein or chemical contamination [34].
- Fragment Size Profiling: Use the Agilent Bioanalyzer with the High-Sensitivity DNA kit or similar platforms to confirm the cfDNA fragment size profile. A peak at ~160-170 bp (mononucleosomal) is characteristic of cfDNA [32] [6]. This step is crucial for verifying that the extraction has not been biased against the shorter fragments.
Table 2: Key Parameters for Assessing cfDNA Extraction Success
| Parameter | Assessment Method | Optimal Outcome/Goal |
|---|---|---|
| Yield | Fluorometry (e.g., Qubit) | Maximize yield from available plasma; typical plasma concentration is 10-30 ng/mL [32]. |
| Purity | Spectrophotometry (A260/A280, A260/A230) | A260/A280 ~1.8; A260/A230 ~2.0 [34]. |
| Fragment Size | Bioanalyzer/TapeStation | Dominant peak at ~165 bp [32] [6]. |
| Inhibitor Presence | Downstream PCR efficiency | Successful amplification in dPCR with expected sensitivity. |
| Reproducibility | Consistency of yield/purity across samples | Low coefficient of variation in yield from replicate isolations. |
The Scientist's Toolkit: Research Reagent Solutions
The table below lists essential materials and reagents for establishing a robust cfDNA-to-dPCR workflow for KRAS mutation research.
Table 3: Essential Research Reagents for cfDNA and KRAS Mutation Analysis
| Item | Function/Application | Example Products/Assays |
|---|---|---|
| cfDNA Extraction Kit | Isolation of pure, high-integrity cfDNA from plasma. | QIAamp Circulating Nucleic Acid Kit [32], MagMAX Cell-Free DNA Isolation Kit [32]. |
| Fluorometer & dsDNA HS Assay | Sensitive and specific quantification of low-abundance cfDNA. | Qubit Fluorometer with dsDNA HS Assay Kit [32] [31]. |
| Fragment Analyzer | Quality control of cfDNA, confirming the characteristic ~165 bp peak. | Agilent Bioanalyzer with High-Sensitivity DNA Kit [32] [30]. |
| dPCR System | Absolute quantification and rare allele detection of KRAS mutations. | Bio-Rad ddPCR [6] [30], QIAcuity [35]. |
| KRAS Mutation Assay | Specific detection of KRAS hotspot mutations (e.g., in codons 12/13). | Bio-Rad ddPCR KRAS G12/G13 Screening Kit [30], Custom TaqMan Assays [31]. |
| NGS Library Prep Kit | For broader mutation screening or validation; compatible with fragmented DNA. | IDT xGen cfDNA Library Prep Kit [34]. |
Connecting Sample Preparation to dPCR for KRAS Mutation Detection
The quality of the prepared cfDNA directly influences the performance of the final dPCR assay. dPCR's superiority for detecting low-frequency mutations (<1%) in cfDNA is well-established [35] [33]. Key considerations linking sample prep to dPCR success include:
- Input DNA Quality: The absence of PCR inhibitors from the extraction step is critical for robust dPCR amplification. dPCR is generally more tolerant of inhibitors than qPCR, but efficient removal is still necessary [35].
- Input DNA Quantity: The absolute quantification from dPCR allows for precise calculation of mutant allele frequency, which can be as low as 0.06% with optimized assays [6]. Accurate cfDNA quantification via fluorometry is essential for loading the correct amount of DNA into the dPCR reaction.
- Assay Design for cfDNA: To maximize the detection efficiency of fragmented cfDNA, dPCR assays should be designed with short amplicon sizes (e.g., 66 bp as in [6]) to ensure efficient amplification of the target sequence.
The following diagram illustrates the logical and technical relationship between sample quality and dPCR performance:
A meticulously optimized and consistently executed workflow for plasma preparation, cfDNA extraction, and quantification forms the foundational pillar for reliable and sensitive detection of KRAS mutations using dPCR. Attention to pre-analytical variables and rigorous quality control are non-negotiable for generating clinically actionable research data. The protocols and data summarized here provide a template for establishing a robust sample preparation pipeline in a research setting focused on liquid biopsy for oncology.
The detection of KRAS mutations is a critical component of precision oncology, guiding treatment decisions for patients with colorectal cancer, pancreatic cancer, and other solid tumors [16] [36]. Digital PCR (dPCR) has emerged as a powerful tool for detecting these mutations with the sensitivity and precision required for clinical applications, particularly in the analysis of circulating tumor DNA (ctDNA) from liquid biopsies [10] [15]. The performance of dPCR assays depends fundamentally on the careful design and selection of probes and primers. This application note details strategic methodologies for employing three key technologies—TaqMan probes, Molecular Beacons, and Locked Nucleic Acid (LNA)—in the context of dPCR protocols for KRAS mutation detection.
Probe Technologies: Mechanisms and Applications
TaqMan Probes
TaqMan probes are hydrolysis probes that rely on the 5'→3' exonuclease activity of DNA polymerase. Each probe is labeled with a fluorescent reporter at the 5' end and a quencher at the 3' end.
- Mechanism: During PCR amplification, the probe hybridizes to its complementary target sequence. As the polymerase extends the primer, it cleaves the probe, separating the reporter from the quencher and generating a fluorescent signal [36].
- dPCR Application: In digital PCR, the reaction mixture is partitioned into thousands of individual reactions. After amplification, each partition is analyzed for fluorescence. Partitions containing the target sequence will fluoresce, while those without it will not. The absolute quantification of mutant alleles is calculated using Poisson statistics [10] [37].
- Design Considerations: TaqMan probes are typically 15-30 nucleotides long. To ensure specific binding, the melting temperature (Tm) of the probe should be 5-10°C higher than that of the primers. The guanine base has natural quenching properties; therefore, its location in the probe sequence must be carefully evaluated to avoid unintended quenching effects.
Molecular Beacons
Molecular Beacons are stem-loop structured probes that use a quencher and fluorophore held in close proximity by a complementary stem sequence.
- Mechanism: In its free form, the stem-loop structure brings the fluorophore and quencher together, suppressing fluorescence. Upon hybridization to the exact target sequence, the probe undergoes a conformational change that separates the fluorophore from the quencher, emitting fluorescence [38].
- Advantage for Melting Curve Analysis: A significant advantage of Molecular Beacons is their suitability for post-amplification melting curve analysis. Unlike TaqMan probes, which are destroyed during amplification, Molecular Beacons remain intact, allowing for thermal denaturation profiling. This enables genotype discrimination based on melting temperature (Tm), which is highly stable and independent of PCR amplification efficiency [36] [38]. This is particularly useful for distinguishing between different KRAS mutant genotypes (e.g., G12D vs. G12V) within a dPCR platform.
- Design Considerations: The loop sequence (typically 15-30 nucleotides) must be complementary to the target. The stem (typically 5-7 bp) should be designed to be stable at the assay's annealing temperature but must denature when the loop binds to its target. Using Molecular Beacons with hydrophobic stems (e.g., incorporating non-natural bases) can minimize background fluorescence fluctuations during temperature changes, significantly improving the signal-to-background ratio in melting curve analysis [38].
Locked Nucleic Acid (LNA) Technology
LNA is a modified RNA nucleotide in which the ribose ring is "locked" in an ideal conformation for hybridization by a methylene bridge connecting the 2'-O and 4'-C atoms.
- Effect: Incorporating LNA bases into oligonucleotides dramatically increases the thermal stability (Tm) of the duplex, typically by 2-8°C per modification. This allows for the design of shorter probes and primers without sacrificing binding affinity or specificity [15].
- Application in KRAS Assays: The enhanced specificity of LNA is crucial for discriminating between single-nucleotide polymorphisms (SNPs) in the KRAS gene, such as the common G12 and G13 mutations. LNA-based probes can be designed to span mutational hotspots, where even a single base mismatch significantly destabilizes the probe-target duplex [15].
- Design Considerations: LNA bases should be strategically placed to overlap the mutation site. Software tools like Beacon Designer are commonly used for LNA oligonucleotide design. The placement of LNA bases should aim to maximize specificity at the mutation locus rather than solely to increase Tm. Over-modification with LNA can lead to self-folding or mispriming, so careful in silico analysis is essential [15].
Table 1: Comparative Analysis of Probe Technologies in Digital PCR
| Feature | TaqMan Probes | Molecular Beacons | LNA-Modified Probes |
|---|---|---|---|
| Primary Mechanism | Hydrolysis | Conformational change | Enhanced hybridization stability |
| Suitability for Melting Analysis | No | Yes | Yes (when used with beacons) |
| Probe Length | 15-30 nt | Loop: 15-30 nt; Stem: 5-7 bp | Can be shorter than DNA probes |
| Key Design Parameter | Tm 5-10°C > primers | Stem stability, loop specificity | Strategic placement of LNA monomers |
| Ideal Use Case | Standard multiplexed quantification | Genotyping via melting temperature | Discrimination of single-base mutations |
Experimental Protocol: KRAS Drop-off ddPCR Assay
The following protocol details the establishment of a novel KRAS codon 12/13 drop-off ddPCR assay as described by Perret et al. (2025) [15]. This "drop-off" design is efficient for screening a mutational hotspot, as it can detect any mutation within the covered region.
Probe and Primer Design
- Drop-off Probe: A 17-bp, HEX-labeled, LNA-based TaqMan probe was designed to be perfectly complementary to the wild-type KRAS sequence spanning codons 12 and 13. Any mutation in this region causes a mismatch, leading to a "drop-off" in the HEX signal [15].
- Sequence (from [15]): 5'-HEX/+HEX/CAC TCT TGC CTA CGC CA/3IABkFQ/-3'
- Reference Probe: A 19-bp, FAM-labeled, LNA-based TaqMan probe was designed to bind a wild-type sequence 9 bp upstream of the drop-off probe region, within the same amplicon. This probe serves as an internal control for the presence of the DNA fragment [15].
- Sequence (from [15]): 5'-FAM/+FAM/GGC TGG CGC TGT GGA AGT/3IABkFQ/-3'
- Primers: Primers were designed to generate a short amplicon (approximately 66 bp) suitable for the fragmented nature of ctDNA. The forward primer was strategically designed with mismatched bases relative to KRAS pseudogenes to suppress their amplification [15] [36].
Recommended Workflow
Detailed Methodology
cfDNA Extraction and Quantification:
- Extract cell-free DNA (cfDNA) from 2-4 mL of patient plasma using a commercial circulating DNA extraction kit (e.g., PME-free circulating DNA extraction kit, Analytik Jena) [15].
- Elute DNA in a suitable buffer (e.g., 50 µL nuclease-free water).
- Quantify the extracted cfDNA using a fluorometer (e.g., Qubit 4 Fluorometer). The typical concentration range is 0.1 to 20 ng/µL.
ddPCR Reaction Setup:
- Prepare the reaction mixture containing:
- 10 µL of extracted cfDNA (not to exceed 60 ng total input to prevent droplet overloading).
- 1x ddPCR Supermix for Probes.
- Primers and LNA probes at optimized concentrations (e.g., 900 nM primers, 250 nM probes, determined during assay validation) [15].
- A no-template control (NTC) should be included to confirm the absence of contamination.
- Prepare the reaction mixture containing:
Droplet Generation and PCR Amplification:
- Generate droplets using an automated droplet generator (e.g., QX200 Droplet Generator, Bio-Rad).
- Transfer the emulsified samples to a 96-well PCR plate and seal it.
- Perform PCR amplification on a thermal cycler using a standard protocol, for example:
- Initial Denaturation: 95°C for 10 minutes.
- 40-45 Cycles:
- Denature: 94°C for 30 seconds.
- Anneal/Extend: 55-60°C for 60 seconds.
- Final Hold: 4-12°C.
Droplet Reading and Data Analysis:
- Place the PCR plate in a droplet reader (e.g., QX200 Droplet Reader, Bio-Rad) which measures the fluorescence (FAM and HEX) of each droplet.
- Analyze the data using the manufacturer's software (e.g., QuantaSoft, Bio-Rad).
- Interpretation:
- Double-positive droplets (FAM+HEX+): Contain wild-type KRAS sequences.
- FAM-only positive droplets (FAM+HEX-): Contain mutant KRAS sequences (the HEX signal has "dropped off").
- The concentration of mutant and wild-type alleles is calculated absolutely based on the fraction of positive droplets and Poisson statistics.
Advanced dPCR: Melting Curve Analysis for Multiplexing
To overcome the multiplexing limitations imposed by the number of available fluorescent dyes, dPCR can be combined with melting curve analysis [36] [38]. This method is highly compatible with Molecular Beacons.
Workflow for dPCR with Melting Curve Analysis
Key Technical Considerations
- Use of Molecular Beacons: As they are not degraded during PCR, they are ideal for post-amplification melting analysis [38].
- Asymmetric PCR: This is performed to generate an excess of single-stranded amplicons complementary to the Molecular Beacon probe, which is essential for obtaining a clear melting curve signal [38].
- Hydrophobic Stems: Incorporating Molecular Beacons with hydrophobic stems minimizes background fluorescence fluctuations during temperature changes, greatly improving the signal-to-background ratio [38].
- Genotyping: Positive partitions are identified by fluorescence intensity at a low temperature. The genotype (e.g., KRAS wild-type vs. G12D vs. G12R) is then determined by the specific Tm of the probe-target hybrid, which is highly stable and sequence-specific. This approach has been shown to distinguish genotypes with a Tm standard deviation as low as 0.2°C [38].
Performance and Validation
The described KRAS drop-off ddPCR assay has been technically and clinically validated [15].
Table 2: Performance Metrics of a Validated KRAS ddPCR Drop-off Assay
| Performance Parameter | Result | Experimental Detail |
|---|---|---|
| Limit of Detection (LoD) | 0.57 copies/µL | Determined using serial dilutions of mutant DNA in wild-type background [15]. |
| Limit of Blank (LoB) | 0.13 copies/µL | Measured by analyzing multiple replicates of a non-target (wild-type) sample [15]. |
| Inter-Assay Precision (r²) | 0.9096 | Calculated from correlation analysis across multiple independent runs [15]. |
| Clinical Validation Accuracy | 97.2% (35/36) | Correctly identified KRAS mutations in ctDNA-positive patient samples [15]. |
| Key Advantage | Detects all mutations in codon 12/13 hotspot, not just pre-defined variants. |
The Scientist's Toolkit: Research Reagent Solutions
Table 3: Essential Reagents and Kits for dPCR-based KRAS Mutation Detection
| Item | Function/Application | Example Product/Catalog Number |
|---|---|---|
| Circulating DNA Extraction Kit | Isolation of high-quality cfDNA from plasma samples. | PME-free circulating DNA extraction kit (Analytik Jena, cat. no. 845-IR-0003050) [15]. |
| Fluorometer | Accurate quantification of low-concentration cfDNA extracts. | Qubit 4 Fluorometer (Thermo Fisher Scientific, cat. no. Q32866) [15]. |
| ddPCR Supermix | Optimized buffer, enzymes, and dNTPs for probe-based digital PCR. | ddPCR Supermix for Probes (No dUTP) (Bio-Rad, cat. no. 1863024). |
| Droplet Generator & Reader | Instrumentation for droplet generation and fluorescence reading. | QX200 Droplet Generator and Reader (Bio-Rad) [37]. |
| LNA-based Probes & Primers | Custom synthesis of oligonucleotides for high-sensitivity/specificity assays. | Manufactured by Integrated DNA Technologies (IDT) [15]. |
| Bisulfite Conversion Kit | (For methylation assays) Chemical conversion of unmethylated cytosine to uracil. | EZ DNA Methylation-Lightning Kit (Zymo Research) [39]. |
The analysis of circulating tumor DNA (ctDNA) has emerged as a cornerstone of precision oncology, enabling non-invasive tumor molecular profiling and treatment monitoring [40] [15]. Among the most critical targets in human malignancies are KRAS exon 2 mutations, which are highly prevalent in gastrointestinal cancers and present in 90-95% of pancreatic ductal adenocarcinoma (PDAC) cases [40] [15]. Traditional digital PCR (dPCR) assays face significant limitations when targeting mutational hotspots like KRAS codons 12 and 13, where multiple possible nucleotide substitutions can occur. The finite number of available fluorophores in standard dPCR systems restricts the number of mutations that can be detected in a single reaction, thereby limiting clinical utility [40] [15].
Drop-off assays represent an innovative architectural solution to this challenge. These assays are designed to span entire mutational hotspots, enabling detection of any mutated allele within the covered region through a single reaction channel [40] [15]. This approach fundamentally differs from mutation-specific assays by exploiting the principle that even a single base alteration can prevent a carefully designed probe from hybridizing to its target sequence. The development of such assays is particularly valuable for monitoring treatment response and disease progression in cancer patients through liquid biopsies, offering a broadly applicable molecular monitoring tool that complements but does not replace comprehensive molecular diagnostics [40] [15].
Digital PCR technology provides the ideal platform for implementing drop-off assays due to its exceptional sensitivity, absolute quantification capabilities, and ability to detect rare mutations in background wild-type sequences [10]. By partitioning samples into thousands of individual reactions, dPCR enables the detection of single DNA molecules, making it uniquely suited for analyzing the low tumor fractions often present in cell-free DNA (cfDNA) [10]. The combination of drop-off assay architecture with dPCR detection creates a powerful tool for clinical research and potential diagnostic applications.
Assay Design and Working Principle
Core Design Elements
The KRAS codon 12/13 drop-off assay employs a dual-probe system that strategically targets the mutational hotspot within exon 2 of the KRAS gene [40] [15]. The assay design incorporates several critical elements:
Drop-off Probe: A 17-bp locked nucleic acid (LNA)-based probe labeled with HEX fluorophore, designed to be perfectly complementary to the wild-type sequence spanning codons 12 and 13. The placement of LNA bases was optimized to enhance specificity at the G12/G13 loci rather than solely increasing melting temperature (Tm) [40] [15].
Reference Probe: A 19-bp LNA-based probe labeled with FAM fluorophore, complementary to a conserved wild-type KRAS sequence located within the same amplicon but 9 bp upstream of the drop-off probe target region, without overlap [40] [15].
Primer Design: Forward (5'-CAA GAT TTA CCT CTA TTG TTG GA-3') and reverse (5'-GTG TGA CAT GTT CTA ATA TAG TC-3') primers flanking the target region, with all oligonucleotides designed to be as short as possible to accommodate the fragmented nature of ctDNA [40].
The use of LNA technology enables the design of shorter probes while maintaining high binding specificity, which is particularly advantageous for detecting the short DNA targets typically found in ctDNA fragments resulting from nucleosomal degradation and apoptotic processes [15].
Mechanism of Action
The fundamental working principle of the drop-off assay leverages the high affinity required for TaqMan probe hybridization, where even a single altered base in the DNA sequence can prevent probe binding [40] [15]. The mechanism operates as follows:
Wild-type Detection: When no mutations are present in codons 12/13, both the drop-off (HEX) and reference (FAM) probes bind efficiently to their target sequences, resulting in a double-positive (HEX+FAM) fluorescent signal [40] [15].
Mutant Detection: In the presence of a mutation within the drop-off probe target region, the resulting mismatch prevents optimal hybridization of the drop-off probe. This leads to a reduced or absent HEX signal, causing a shift in the droplet population to a FAM-only positive signal [40] [15].
Quantification: The ratio of FAM-only droplets to total positive droplets provides quantitative information about the proportion of mutant molecules in the sample, while the reference probe serves as an internal control confirming the presence of the target cfDNA fragment [15].
Diagram 1: KRAS Drop-off Assay Mechanism. The assay discriminates between wild-type and mutant sequences based on differential probe binding.
This elegant design enables comprehensive coverage of all possible mutations within the targeted codons without requiring individual probes for each specific nucleotide substitution, effectively overcoming the fluorophore limitation of traditional multiplex dPCR assays.
Performance Validation and Analytical Metrics
Analytical Sensitivity and Specificity
The KRAS drop-off assay underwent rigorous validation to establish its performance characteristics for clinical research applications [40] [15]. The assay demonstrated exceptional analytical sensitivity, with a limit of detection (LoD) of 0.57 copies/µL and a limit of blank (LoB) of 0.13 copies/µL, enabling reliable detection of low-frequency mutations in cfDNA samples [40] [15]. The inter-assay precision, measured as r², was 0.9096, indicating excellent reproducibility across experimental runs [40] [15].
In clinical validation studies using plasma samples from patients with KRAS-mutated gastrointestinal malignancies, the drop-off assay accurately identified single nucleotide variants in 35/36 (97.2%) of circulating tumor DNA-positive samples from the patient validation cohort [40] [15]. This high detection rate confirms the assay's robustness for clinical research applications.
Cross-validation studies demonstrated that the novel KRAS codon 12/13 ddPCR drop-off assay outperformed a commercially available KRAS multiplex ddPCR assay in terms of specificity, highlighting the advantage of the drop-off approach for comprehensive mutation screening [40] [15]. Furthermore, the assay proved suitable for multiplexing with mutation-specific probes, extending its utility for more complex analytical scenarios [40] [15].
Performance Comparison
Table 1: Analytical Performance Metrics of KRAS Drop-off Assay
| Parameter | Performance Value | Experimental Context |
|---|---|---|
| Limit of Detection (LoD) | 0.57 copies/µL | Lowest mutant concentration reliably detected |
| Limit of Blank (LoB) | 0.13 copies/µL | Background signal in negative controls |
| Inter-assay Precision (r²) | 0.9096 | Consistency across experimental replicates |
| Clinical Sensitivity | 97.2% (35/36 samples) | Detection in ctDNA-positive patient samples |
| Specificity | Superior to commercial multiplex assay | Cross-validation study |
Comparison with Alternative Methods
Table 2: Comparison of dPCR Methods for KRAS Mutation Detection
| Method | Advantages | Limitations | Best Application Context |
|---|---|---|---|
| Drop-off ddPCR | Comprehensive codon coverage; High specificity; Suitable for multiplexing | Does not identify exact nucleotide change | Monitoring known hotspot regions; Treatment response assessment |
| Mutation-specific Multiplex ddPCR | Identifies specific mutations; Established protocols | Limited by available fluorophores; May miss rare variants | Targeting known specific mutations; Clinical validation |
| Next-generation Sequencing | Comprehensive genomic coverage; Discovery of novel variants | Higher cost; Complex bioinformatics; Lower sensitivity | Exploratory analysis; Complex mutational profiling |
The exceptional performance of the KRAS drop-off assay positions it as an ideal tool for longitudinal monitoring of treatment response and disease progression in oncology research, particularly in cancers with high prevalence of KRAS mutations such as pancreatic, colorectal, and non-small cell lung carcinomas [40] [15].
Experimental Protocol
Sample Collection and cfDNA Extraction
Proper sample collection and processing are critical for successful cfDNA analysis [40] [15]. The recommended protocol includes:
- Blood Collection: Collect venous blood samples using commercially available cfDNA blood collection tubes (e.g., Ruwag, cat. no. 218997) [40] [15].
- Plasma Isolation: Perform two sequential centrifugation steps (details not specified in search results) to isolate plasma from other blood components [40] [15].
- Storage: Freeze plasma at -80°C until cfDNA extraction to preserve nucleic acid integrity [40] [15].
- cfDNA Extraction: Extract cfDNA from 2-4 mL plasma using a PME-free circulating DNA extraction kit (Analytik Jena, cat. no. 845-IR-0003050) following the manufacturer's SEP/SBS protocol [40] [15].
- Quantification: Measure DNA concentration using a Qubit 4 fluorometer (Thermo Fisher Scientific). Typical concentrations range from 0.1 to 20 ng/µL from up to 5 mL of plasma [40] [15].
- Storage: Store extracted DNA at -20°C until ddPCR analysis [40] [15].
Droplet Digital PCR Setup
The ddPCR reaction setup requires careful optimization to ensure accurate partitioning and amplification [40]:
- Reaction Volume: Use a standardized DNA sample volume of 10 µL per well [40].
- DNA Input: Apply a maximum of 60 ng cfDNA per well to prevent droplet damage and ensure proper partitioning [40].
- Probes and Primers: Utilize the optimized LNA-based probes and primers as described in Section 2.1 [40] [15].
- Partitioning: Generate droplets according to the manufacturer's protocol for the specific ddPCR system being used.
- Thermal Cycling: Amplify using appropriate cycling conditions for KRAS target amplification (specific temperatures and durations not provided in search results).
Data Analysis and Interpretation
Following amplification, analyze the ddPCR results using the following approach:
- Droplet Reading: Process plates using a droplet reader capable of detecting FAM and HEX fluorescence [40] [15].
- Gating Strategy: Identify four distinct droplet populations based on fluorescence signals:
- Quantification: Calculate the mutant allele frequency based on the ratio of FAM-only droplets to total positive droplets, applying Poisson correction for absolute quantification [40] [15].
Diagram 2: KRAS Drop-off Assay Workflow. The complete experimental procedure from sample collection to data analysis.
Research Reagent Solutions
Table 3: Essential Reagents and Materials for KRAS Drop-off Assay
| Reagent/Material | Specification | Function/Purpose |
|---|---|---|
| Blood Collection Tubes | cfDNA stabilization tubes (e.g., Ruwag cat. no. 218997) | Preserves cell-free DNA integrity during transport and storage |
| DNA Extraction Kit | PME-free circulating DNA extraction kit (Analytik Jena cat. no. 845-IR-0003050) | Isolves cell-free DNA from plasma samples |
| Quantification Instrument | Qubit 4 fluorometer (Thermo Fisher Scientific cat. no. Q32866) | Accurately measures DNA concentration prior to ddPCR |
| LNA Probes | KRAS drop-off probe (HEX-labeled) and reference probe (FAM-labeled) | Detect wild-type and mutant sequences with high specificity |
| PCR Primers | KRAS-forward: 5'-CAA GAT TTA CCT CTA TTG TTG GA-3'KRAS-reverse: 5'-GTG TGA CAT GTT CTA ATA TAG TC-3' | Amplify target region containing codons 12/13 |
| ddPCR System | Droplet digital PCR instrument with two-color detection capability | Partitions samples and detects fluorescence signals |
Applications in Cancer Research
The KRAS codon 12/13 drop-off assay provides researchers with a powerful tool for multiple applications in oncology research [40] [15]:
- Treatment Response Monitoring: Serial monitoring of KRAS mutant allele frequency in cfDNA can provide early indicators of treatment efficacy or emergence of resistance [40] [15].
- Minimal Residual Disease Detection: The high sensitivity of the assay enables detection of low-frequency mutations following curative-intent therapy, potentially identifying patients at risk of recurrence [40] [15].
- Tumor Heterogeneity Assessment: The comprehensive coverage of codon 12/13 mutations facilitates analysis of clonal heterogeneity and evolution without requiring multiple mutation-specific assays [40] [15].
- Longitudinal Study Enabler: The non-invasive nature of liquid biopsy allows frequent sampling to track disease dynamics with high temporal resolution [40] [15].
The drop-off assay architecture represents a significant advancement in dPCR technology, effectively balancing comprehensive mutation coverage with practical implementation requirements for clinical research settings.
Digital PCR (dPCR) represents a powerful nucleic acid quantification technology that provides absolute quantification of target sequences without requiring standard curves. While conventional dPCR discriminates multiple targets using different fluorescent probe colors, this approach fundamentally limits multiplexing capacity due to spectral overlap constraints. The integration of melting curve analysis with dPCR overcomes this limitation by adding a secondary discrimination parameter—melting temperature (Tm)—that enables highly multiplexed genotyping beyond conventional fluorescence-based multiplexing [6] [41] [38].
This application note details experimental protocols and technical considerations for implementing dPCR with melting curve analysis, with specific application to KRAS mutation detection in circulating tumor DNA (ctDNA). The KRAS oncogene, particularly mutations in codons 12 and 13, represents an ideal model system for this approach due to the diversity of clinically relevant single nucleotide variants that must be discriminated for treatment selection in pancreatic, colorectal, and non-small cell lung cancers [6]. The methodology described herein enables researchers to simultaneously identify multiple KRAS mutations with detection limits below 0.2% variant allele frequency, making it particularly suitable for liquid biopsy applications where tumor DNA represents only a small fraction of total cell-free DNA [6] [42].
Fundamental Principles
The combination of dPCR with melting curve analysis creates a two-dimensional discrimination system where targets are identified by both fluorescence color and melting temperature [41] [38]. This approach partitions PCR reactions into thousands of individual compartments, followed by endpoint amplification and subsequent melting curve analysis through precise temperature control and fluorescence monitoring [38]. The Tm value of the probe-target hybrid remains largely independent of PCR amplification efficiency, addressing a key limitation of conventional dPCR where fluorescence intensity fluctuations can reduce genotyping accuracy [38] [43].
Comparison of dPCR Multiplexing Strategies
Table 1: Comparison of dPCR Multiplexing Approaches for KRAS Mutation Detection
| Multiplexing Strategy | Maximum Multiplexity | Limit of Detection | Key Advantages | Key Limitations |
|---|---|---|---|---|
| Conventional Multi-Color dPCR | Limited by fluorescent dye colors (typically 4-6 targets) | Varies by assay; typically ~0.1% VAF | Simple data analysis; established protocols | Limited multiplexing capacity; spectral overlap issues |
| dPCR with Melting Curve Analysis | 10+ targets demonstrated [41] | <0.2% VAF for KRAS mutations [6] | High multiplexing capacity; stable Tm values reduce false calls | Requires specialized instrumentation; more complex data analysis |
| Drop-off ddPCR Assay | Detects all mutations in hotspot region [15] | 0.57 copies/µL [15] | Broad mutation coverage in targeted region; no prior knowledge of specific variant needed | Does not identify exact mutation without additional probes |
| Highly Multiplexed dPCR (14-plex) | 14 targets demonstrated [44] | <0.2% VAF while quantifying CNAs [44] | Simultaneously detects SNVs and copy number alterations | Increased assay optimization complexity |
Experimental Protocol: KRAS Genotyping via dPCR with Melting Curve Analysis
The following diagram illustrates the complete workflow for dPCR combined with melting curve analysis:
Step-by-Step Protocol
Reaction Solution Preparation
Materials:
- DNA template (1-10 ng cfDNA or ctDNA)
- Forward and reverse primers (concentration optimized empirically)
- Molecular beacon probes with hydrophobic stems (250-500 nM each)
- dPCR master mix (including DNA polymerase with proofreading activity, dNTPs, MgCl₂)
- Nuclease-free water
Primer and Probe Design Considerations:
- Design primers to generate 66 bp amplicons for efficient cfDNA detection [6]
- Place primers in regions with mismatches to pseudogenes (KRASP1) to suppress amplification
- Use asymmetric primer ratios (typically 50:1) to generate single-stranded amplicons
- Design molecular beacons with hydrophobic stems to maintain background fluorescence stability
- Select stem sequences that form stable hairpins without interfering with target binding
- Incorporate locked nucleic acid (LNA) bases in probes to enhance specificity when needed [15]
Table 2: Molecular Beacon Probes for KRAS Codon 12/13 Mutations
| Target | Dye Color | Typical Tm Range (°C) | Key Design Features |
|---|---|---|---|
| Wild-type KRAS | FAM | 68.5-69.0 | Complementary to GGT(Gly) sequence at codons 12/13 |
| G12D | HEX | 62.5-63.0 | Designed to match GAT(Asp) mutation with central mismatch |
| G12V | CAL Fluor Red 610 | 64.0-64.5 | Matches GTT(Val) mutation; adjusted stem for Tm separation |
| G12C | Quasar 670 | 63.5-64.0 | Specific to TGT(Cys) mutation with LNA modifications |
| G13D | FAM | 65.0-65.5 | Different Tm than wild-type despite same dye color |
Partitioning and PCR Amplification
- Load the reaction mixture onto a silicon chip containing 20,000 microwells (e.g., QuantStudio 3D, Thermo Fisher Scientific) [6] [38]
- Ensure complete partitioning to achieve single-molecule distribution following Poisson statistics
- Perform asymmetric PCR amplification using the following cycling conditions:
- Initial denaturation: 95°C for 10 minutes
- 45-50 cycles of:
- Denaturation: 95°C for 30 seconds
- Annealing: 60°C for 60 seconds (optimized from 55°C to suppress pseudogene amplification) [6]
- Extension: 72°C for 30 seconds
- Final extension: 72°C for 5 minutes
Melting Curve Analysis and Genotyping
- Transfer the post-PCR chip to a temperature-controlled stage capable of precise temperature control (±0.1°C)
- Gradually increase temperature from 50°C to 80°C in 0.1-0.5°C increments
- Capture fluorescence images at each temperature step for all fluorescent channels
- For each positive well, plot fluorescence intensity versus temperature to generate melting curves
- Calculate Tm values from the negative derivative of the melting curves (-dF/dT)
- Perform genotyping using a two-dimensional algorithm that combines:
- Initial classification by fluorescence color
- Secondary discrimination by Tm value within each color channel
The following diagram illustrates the molecular mechanism of molecular beacon hybridization and melting analysis:
Critical Optimization Parameters
Enhancing Detection Efficiency for ctDNA
- Amplicon size optimization: Reduce amplicon size from 103 bp to 66 bp to improve detection efficiency from 25.9% to 45.2% for fragmented cfDNA [6]
- Primer localization: Design primers to anneal to regions with maximal mismatch to pseudogenes while maintaining target specificity
- Blocker oligonucleotides: Incorporate non-fluorescent blocker oligonucleotides complementary to pseudogene sequences to suppress background amplification [6]
Algorithmic Improvements for Genotyping Accuracy
- Implement mutation type determination algorithms that specifically address challenging discriminations (e.g., G12A)
- Apply statistical clustering methods to distinguish true positive partitions from background
- Utilize multi-parameter analysis combining fluorescence intensity, Tm values, and curve shape characteristics
Performance Validation
Table 3: Performance Metrics of Optimized dPCR with Melting Curve Analysis
| Parameter | Pre-Optimization Performance | Post-Optimization Performance | Clinical Validation |
|---|---|---|---|
| Limit of Detection | 0.41% VAF (for G12A) | <0.2% VAF (all target mutations) [6] | Detected in 82.3% of pancreatic cancer patients with metastasis [6] |
| Detection Efficiency | 25.9% of input DNA | 45.2% of input DNA [6] | Correlation with conventional dPCR (total KRAS mutants) [6] |
| Multiplexing Capacity | 2-3 mutations per color | 10-plex demonstrated (KRAS & BRAF) [41] | 14-plex achieved for KRAS, GNAS, and CNAs [44] |
| Inter-assay Precision | Not specified | r² = 0.9096 for drop-off assays [15] | 97.2% concordance in clinical samples [15] |
Research Reagent Solutions
Table 4: Essential Research Reagents for dPCR with Melting Curve Analysis
| Reagent Category | Specific Product/Type | Function in Protocol | Optimization Notes |
|---|---|---|---|
| Probe Technology | Molecular beacons with hydrophobic stems [38] | Target-specific hybridization with minimal background | Superior to TaqMan probes for melting curve analysis; resistant to polymerase degradation |
| Polymerase | High-fidelity DNA polymerase with proofreading activity [45] | Amplification with minimal errors | Reduces false-positive mutations during amplification; essential for low VAF detection |
| Primers | HPLC-purified oligonucleotides with pseudogene-discriminating sequences [6] | Target-specific amplification | Asymmetric primer ratios (50:1) to generate single-stranded amplicons |
| Reference Gene | RPP30 [44] | Copy number alteration quantification and quality control | Enables simultaneous VAF and CNA analysis in multiplex assays |
| Chip Platform | Silicon microwell chips (20,000 wells) [6] [38] | Sample partitioning for digital quantification | Compatible with temperature control for melting curve analysis |
| Blocking Oligonucleotides | Non-fluorescent pseudogene-specific blockers [6] | Suppression of homologous sequence amplification | Critical for KRAS genotyping due to KRASP1 and KRASP2 pseudogenes |
Applications in Cancer Research and Clinical Translation
The combination of dPCR with melting curve analysis enables multiple applications in oncology research:
Comprehensive KRAS genotyping for treatment selection, particularly with the advent of mutation-specific KRAS inhibitors (e.g., sotorasib for G12C) [6]
Longitudinal monitoring of treatment response through ctDNA analysis in pancreatic, colorectal, and lung cancers [42]
Detection of minimal residual disease with sensitivity sufficient to predict clinical relapse months before radiographic progression [42]
Simultaneous variant allele frequency and copy number alteration quantification in precursor lesions like pancreatic intraepithelial neoplasia (PanIN) and intraductal papillary mucinous neoplasms (IPMN) [44]
This methodology provides researchers with a powerful tool for multiplexed mutation detection that bridges the gap between conventional dPCR and more complex next-generation sequencing approaches, offering an optimal balance of sensitivity, multiplexing capacity, and cost-effectiveness for focused genomic analyses.
Liquid biopsy, particularly the analysis of circulating tumor DNA (ctDNA), has emerged as a transformative tool in precision oncology. This minimally invasive approach provides access to tumor-derived genetic material circulating in the bloodstream, offering a dynamic window into tumor heterogeneity and evolution [46]. The analysis of ctDNA in liquid biopsy material shows significant promise due to advances in DNA technologies that have made detection and sample screening possible [46]. This protocol focuses on the application of a novel KRAS exon 2 drop-off digital PCR (ddPCR) assay for detecting hotspot mutations in patient plasma, a methodology particularly relevant for monitoring treatment response in gastrointestinal malignancies including colorectal and pancreatic cancer [15] [40].
Technical Background
Circulating Tumor DNA Biology
CtDNA consists of small, fragmented DNA molecules released into the bloodstream through cellular processes such as apoptosis and necrosis of tumor cells [46]. These fragments typically range from 120-180 base pairs in length, reflecting their nucleosomal origin. Unlike tissue biopsy, which provides a static snapshot of a single tumor site, liquid biopsy captures tumor heterogeneity and enables longitudinal monitoring of disease dynamics [15]. The fraction of ctDNA within total cell-free DNA (cfDNA) varies considerably (0.01%-90%) depending on tumor type, stage, and burden, presenting analytical challenges requiring highly sensitive detection methods [46] [15].
KRAS Mutational Significance
The KRAS proto-oncogene is a critical effector in the EGFR signaling pathway, and mutations in KRAS exon 2 (particularly codons 12 and 13) represent key drivers in multiple human cancers [15]. These mutations occur in approximately 90-95% of pancreatic ductal adenocarcinomas (PDAC), 40-45% of colorectal cancers (CRC), and 25-30% of non-small cell lung cancers (NSCLC) [15] [40]. Specific KRAS mutations confer constitutive GTPase activity, leading to continuous proliferation signals independent of EGFR regulation, and have emerged as important predictive biomarkers for targeted therapies [15].
Digital PCR Drop-Off Assay Principle
Traditional mutation-specific ddPCR assays are limited by the number of available fluorescent channels, typically detecting only a few predefined mutations per reaction [15]. The drop-off assay format overcomes this limitation by employing a different detection strategy. This approach uses two probes complementary to the wild-type sequence: a drop-off probe spanning the mutation hotspot and a reference probe located upstream within the same amplicon [15] [40]. When no mutation is present, both probes bind, generating a double-positive fluorescent signal. A mutation within the drop-off probe binding site prevents its hybridization, resulting in a "dropped-off" signal while the reference probe continues to bind, confirming the presence of the DNA fragment [15].
Figure 1: KRAS Drop-off Assay Detection Principle
Materials and Equipment
Research Reagent Solutions
Table 1: Essential Research Reagents and Materials
| Item | Specification | Function | Storage |
|---|---|---|---|
| Blood Collection Tubes | Cell-free DNA blood collection tubes (e.g., Ruwag cat. no. 218997) | Preserves cell-free DNA integrity by inhibiting nuclease activity and preventing white blood cell lysis | Room temperature |
| cfDNA Extraction Kit | PME-free circulating DNA extraction kit (Analytik Jena) | Isolves and purifies cell-free DNA from plasma samples | Room temperature |
| Quantification Instrument | Qubit 4 fluorometer with dsDNA HS assay | Precisely quantifies extracted cfDNA concentration | - |
| ddPCR Supermix | ddPCR Supermix for Probes (no dUTP) | Provides optimal environment for droplet generation and PCR amplification | -20°C |
| KRAS Primers/Probes | LNA-enhanced primers and TaqMan probes (Table 2) | Specifically amplifies and detects KRAS exon 2 sequences | -20°C |
| Droplet Generation Oil | Droplet Generation Oil for Probes | Creates monodisperse water-in-oil emulsions for digital PCR | 4°C |
Specialized Equipment
- Droplet Digital PCR System (Bio-Rad QX200 or equivalent)
- Thermal Cycler with deep-well block compatible with ddPCR plates
- Microcentrifuge with cooling capability for 1.5-2.0 mL tubes
- Vortex Mixer with tube adapter
- Droplet Reader or plate analyzer compatible with ddPCR
- Plasma Extraction Centrifuge with swing-bucket rotor
Methods
Patient Plasma Collection and Processing
Blood Collection: Draw venous blood into commercially available cfDNA blood collection tubes (e.g., Ruwag). Invert tubes 8-10 times immediately after collection to ensure proper mixing with preservatives [15] [40].
Plasma Separation: Process blood samples within 2 hours of collection using a two-step centrifugation protocol [40]:
- Initial centrifugation: 800-1,600 × g for 10 minutes at 4°C to separate plasma from cellular components.
- Secondary centrifugation: 16,000 × g for 10 minutes at 4°C to remove residual cells and debris.
Plasma Storage: Transfer cleared plasma to sterile cryovials and freeze at -80°C until cfDNA extraction. Avoid repeated freeze-thaw cycles.
Cell-free DNA Extraction
Extract cfDNA from 2-4 mL plasma using the PME-free circulating DNA extraction kit according to the manufacturer's SEP/SBS protocol [40]:
- Add 400 μL plasma to 400 μL binding buffer and mix thoroughly.
- Transfer mixture to spin columns and centrifuge at 16,000 × g for 1 minute.
- Wash columns twice with 700 μL wash buffer.
- Elute cfDNA in 20-50 μL elution buffer.
- Store extracted cfDNA at -20°C until quantification and analysis.
cfDNA Quantification and Quality Control
- Fluorometric Quantification: Precisely measure cfDNA concentration using the Qubit 4 fluorometer with the dsDNA HS assay [40].
- Input Normalization: Normalize samples to a maximum input of 60 ng per ddPCR reaction to prevent droplet overloading and ensure optimal amplification [15].
- Fragment Analysis (Optional): Assess cfDNA fragment size distribution using a bioanalyzer or tape station to confirm typical cfDNA fragmentation patterns (peak ~160-170 bp).
KRAS Drop-off ddPCR Assay
Primer and Probe Design
Table 2: KRAS Drop-off Assay Oligonucleotides
| Component | Sequence (5' → 3') | Modifications | Target |
|---|---|---|---|
| Forward Primer | CAA GAT TTA CCT CTA TTG TTG GA | None | KRAS exon 2 |
| Reverse Primer | GTG TGA CAT GTT CTA ATA TAG TC | None | KRAS exon 2 |
| Drop-off Probe | CTA C* GC C* AC C* AG C* TC CA | 5' HEX, 3' IABkFQ, LNA bases (*) | Codons 12/13 |
| Reference Probe | ATT AG* C TG* T AT* C GT* C AAG G | 5' FAM, 3' IABkFQ, LNA bases (*) | Upstream region |
LNA (Locked Nucleic Acid) bases are incorporated to enhance specificity at the G12/G13 loci rather than solely to increase melting temperature, ensuring effective discrimination between mutant and wild-type sequences [15] [40].
Reaction Setup and Droplet Generation
Prepare ddPCR reaction mix in a total volume of 20-22 μL:
- 10 μL ddPCR Supermix for Probes (no dUTP)
- 1 μL each of forward and reverse primers (final concentration 900 nM)
- 0.5 μL each of drop-off and reference probes (final concentration 250 nM)
- 10 μL template cfDNA (maximum 60 ng)
- Nuclease-free water to final volume
Generate droplets using the QX200 Droplet Generator:
- Transfer 20 μL reaction mix to DG8 Cartridge wells
- Add 70 μL Droplet Generation Oil to appropriate wells
- Place DG8 Gaskets and generate droplets
- Carefully transfer 40 μL emulsified reactions to a 96-well PCR plate
- Seal plate with foil using a plate sealer (heat seal: 180°C for 5 seconds)
Thermal Cycling
Amplify target sequences using the following thermal cycling conditions:
- Initial Denaturation: 95°C for 10 minutes
- 40 Cycles:
- Denaturation: 94°C for 30 seconds
- Annealing/Extension: 55°C for 60 seconds
- Enzyme Deactivation: 98°C for 10 minutes
- Final Hold: 4°C ∞
- Ramp Rate: 2°C/second for all steps
Droplet Reading and Analysis
- Place the PCR plate in the Droplet Reader and analyze droplets according to manufacturer's instructions.
- Set appropriate fluorescence detection thresholds for FAM and HEX channels.
- Analyze data using proprietary analysis software (QuantaSoft or equivalent):
- Identify four droplet populations: double-positive (wild-type), FAM-only (mutant), HEX-only (rare, potential artifact), and double-negative (empty)
- Calculate mutant allele frequency (MAF) using the formula: MAF = [mutant droplets/(mutant + wild-type droplets)] × 100
- Apply Poisson correction to account for multiple copies per droplet
Figure 2: KRAS ctDNA Analysis Workflow
Assay Validation and Performance
Analytical Validation
The KRAS codon 12/13 ddPCR drop-off assay was extensively validated using clinical plasma samples from patients with KRAS-mutated gastrointestinal malignancies [15] [40].
Table 3: Assay Performance Characteristics
| Parameter | Result | Method of Determination |
|---|---|---|
| Limit of Detection (LoD) | 0.57 copies/μL | Serial dilution of synthetic mutants in wild-type background |
| Limit of Blank (LoB) | 0.13 copies/μL | Analysis of no-template and wild-type controls |
| Inter-assay Precision | r² = 0.9096 | Repeated measures of identical samples across multiple runs |
| Clinical Sensitivity | 97.2% (35/36) | Detection in ctDNA-positive patient samples |
| Specificity | Superior to commercial multiplex assay | Comparison with validated reference methods |
| Dynamic Range | 0.1% to 95% MAF | Linear detection across clinically relevant frequencies |
Sample Analysis and Data Interpretation
The KRAS drop-off assay accurately identified single nucleotide variants in 35/36 (97.2%) of circulating tumor DNA-positive samples from the patient validation cohort [15]. The assay demonstrated robust performance across different KRAS mutation subtypes (G12D, G12V, G13D, etc.) and showed excellent concordance with tissue-based testing results [40].
Troubleshooting and Technical Notes
- Low Droplet Count: Ensure proper sample mixing before loading and check droplet generator gaskets for wear.
- Poor Amplification: Verify cfDNA quality and concentration; consider inhibitor removal if necessary.
- High Background in HEX Channel: Optimize drop-off probe concentration and check for degradation of fluorescent dye.
- Rain Effect (Intermediate droplets): Adjust temperature gradient during annealing/extension steps.
- Low Mutant Allele Frequency Precision: Increase input cfDNA mass while maintaining ≤60 ng/reaction limit.
Applications in Clinical Research
This protocol enables precise mutation detection and monitoring for multiple clinical applications:
- Treatment Response Monitoring: Serial monitoring of KRAS mutant allele frequency can provide early indication of treatment efficacy or emergence of resistance [46] [15].
- Minimal Residual Disease (MRD) Detection: The high sensitivity (LoD 0.57 copies/μL) enables detection of residual disease following curative-intent surgery [15].
- Tumor Heterogeneity Assessment: Liquid biopsy captures mutations from all tumor subclones, providing a more comprehensive molecular profile than single-site tissue biopsy [46].
- Clinical Trial Stratification: Enables real-time patient selection for KRAS-targeted therapies and monitoring of therapeutic resistance [40].
This optimized ddPCR drop-off assay provides a robust, highly sensitive, and specific method for KRAS exon 2 hotspot mutation detection in cell-free DNA, with broad applicability for both clinical research and diagnostic development [15] [40].
Optimizing dPCR Performance: Sensitivity Enhancement and Technical Troubleshooting
The analysis of circulating tumor DNA (ctDNA) presents a significant technical challenge in molecular diagnostics. A critical preanalytical factor governing the success of downstream detection methods, particularly digital PCR (dPCR), is the fragmented nature of cell-free DNA (cfDNA). This protocol details the strategic optimization of amplicon size to maximize the detection efficiency of KRAS mutations in ctDNA, a crucial biomarker for colorectal cancer, pancreatic ductal adenocarcinoma (PDAC), and other solid tumors [36] [16] [15].
Circulating tumor DNA is released into the bloodstream primarily through apoptosis and necrosis of tumor cells and exhibits a characteristic fragmentation pattern. In plasma from healthy individuals, cfDNA shows a dominant peak at approximately 167 base pairs (bp), corresponding to DNA wrapped around a nucleosome plus a linker sequence [47]. The efficiency of PCR amplification is directly influenced by the length of the DNA template. Therefore, designing short amplicons that fit within this fragmented landscape is essential for efficient detection, especially given that ctDNA often constitutes less than 1% of the total cfDNA background [36] [16].
The following diagram illustrates the core concept of designing short amplicons to fit the physical size of fragmented cfDNA for efficient PCR amplification.
The Critical Role of Amplicon Size in cfDNA Analysis
The impact of amplicon size on detection efficiency is not merely theoretical; it has been quantitatively demonstrated in clinical research settings. A pivotal study focusing on KRAS mutation detection systematically compared a 103 bp amplicon to a redesigned 66 bp amplicon. The results were significant: the shorter amplicon increased mutation detection efficiency from 25.9% to 45.2%, effectively nearly doubling the assay's ability to capture mutant molecules from the same sample [36]. This enhancement directly improves the sensitivity of the assay, which is paramount for detecting low-frequency mutations.
Furthermore, shorter amplicons contribute to improved assay performance by increasing amplification efficiency and robustness. This is particularly important for achieving a low limit of detection (LOD), a key metric for liquid biopsy applications. Optimized short amplicon assays have been shown to achieve an LOD for KRAS mutations of less than 0.2% allele frequency, with some reports reaching down to 0.01%-0.1% [36] [24]. This level of sensitivity is necessary for early cancer detection, monitoring of minimal residual disease, and tracking tumor evolution.
Experimental Data and Performance Comparison
The following table summarizes key quantitative data from studies that have implemented amplicon size optimization for KRAS mutation detection, highlighting the performance gains achieved.
Table 1: Impact of Amplicon Size Optimization on KRAS Mutation Detection Performance
| Study Focus | Original Amplicon Size | Optimized Amplicon Size | Key Performance Improvement |
|---|---|---|---|
| Multiplex dPCR with Melting Curve Analysis [36] | 103 bp | 66 bp | Detection efficiency increased from 25.9% to 45.2%; LOD < 0.2% for all target KRAS mutations. |
| KRAS Exon 2 Drop-off ddPCR Assay [15] | Not Specified | Designed for short, fragmented ctDNA | Achieved a limit of detection (LOD) of 0.57 copies/µL and high accuracy (97.2%) in clinical validation. |
| ddPCR for Characterizing DNA Reference Material [24] | N/A (Method Comparison) | N/A (Method Comparison) | Demonstrated ddPCR's reliable limit of quantification (LOQ) at 0.1% for KRAS mutations, underscoring the technique's high sensitivity. |
The selection of an appropriate and stable reference gene is another critical component for reliable DNA quantification in dPCR. A recent development involves the use of a pentaplex reference gene panel to quantify total genome equivalents. This multiplex approach mitigates potential biases from genomic instability in cancer samples and provides a more reliable calibration method for applications like copy number variation analysis and next-generation sequencing library quantification [48]. The stability of the reference gene is a key factor in achieving accurate results.
Table 2: Essential Research Reagent Solutions for cfDNA dPCR
| Reagent / Kit | Primary Function | Key Consideration |
|---|---|---|
| Silica-based cfDNA Kits (e.g., QIAamp CNA, Maxwell RSC) [47] [49] | Extraction of cell-free DNA from plasma. | Shows reproducible efficiency (~84% for a 180 bp spike-in) and consistent size profile recovery [47]. |
| Short, LNA-modified Probes [15] [49] | Enhances hybridization specificity for mutant alleles in short amplicons. | Locked Nucleic Acid (LNA) bases allow for shorter probe design while maintaining high binding specificity and discrimination [15]. |
| Synthetic DNA Spike-ins (e.g., gBlocks, CEREBIS) [47] [49] | Controls for extraction efficiency and PCR inhibition. | A 180 bp fragment (CEREBIS) mimics mononucleosomal cfDNA. Adding a spike-in before extraction allows for precise correction of technical losses [47]. |
| Multiplex Reference Gene Panel [48] | Absolute quantification of total DNA input. | Using multiple reference genes (e.g., DCK, HBB, RPPH1) provides a more robust quantification standard than a single gene, reducing measurement uncertainty [48]. |
| Restriction Enzymes (e.g., HindIII, EcoRI) [24] [48] | Digests long genomic DNA to improve partitioning efficiency in dPCR. | Pre-digestion of gDNA prevents "blocker" effects in partitions, ensuring more accurate digital counting [24]. |
Step-by-Step Protocol: Amplicon Design and Workflow
This section provides a detailed methodology for developing and executing an optimized dPCR assay for fragmented cfDNA.
Primer and Probe Design for Short Amplicons
- Target Region Analysis: Identify the mutation hotspot (e.g., KRAS codons 12 and 13). Analyze the sequence for homologous pseudogenes (e.g., KRASP1) which can lead to false-positive signals [36].
- Primer Design:
- Place forward and reverse primers as close as possible to the target mutation site.
- Amplicon Size Goal: Aim for 60-80 bp. This ensures the entire amplicon fits within the dominant cfDNA fragment population [36].
- To suppress pseudogene amplification, intentionally place primers over genomic regions with high specificity, even utilizing single mismatches between the true gene and pseudogene located near the mutation site [36].
- Verify primer specificity using in silico PCR tools and BLAST.
- Probe Design:
- For superior endpoint fluorescence in dPCR, use molecular beacons or LNA-modified TaqMan probes [36] [49].
- LNA (Locked Nucleic Acid) incorporation allows for the use of shorter probes without sacrificing melting temperature (Tm), which is ideal for targeting short, variable regions with high specificity [15].
- For a "drop-off" assay strategy that can detect multiple mutations within a hotspot (e.g., KRAS G12/G13), design a wildtype-specific "drop-off" probe labeled with one fluorophore (e.g., HEX) and a reference probe for a stable upstream sequence labeled with another fluorophore (e.g., FAM) [15].
Optimized Workflow for KRAS Mutation Detection in ctDNA
The following diagram outlines the complete experimental workflow, from sample collection to data analysis, integrating the key optimization steps discussed in this protocol.
dPCR Setup and Execution
- Reaction Assembly:
- Prepare a 20-22 µL dPCR reaction mix containing:
- Include negative controls (water, elution buffer) and positive controls (synthetic DNA fragments or DNA from mutated cell lines) in each run [49].
- Partitioning and Amplification:
- Generate droplets or load the reaction mix into a microchamber chip according to the manufacturer's instructions (e.g., Bio-Rad QX200, QIAcuity, QuantStudio) [10].
- Perform PCR amplification using a thermal profile optimized for the assay. An example profile is:
- Enzyme Activation: 95°C for 10 minutes.
- Denaturation: 95°C for 15 seconds.
- Annealing/Extension: 60°C for 60 seconds (ramp rate of 2°C/second).
- Repeat for 40-45 cycles.
- Data Analysis and Normalization:
- Read the plate or droplet cartridge on the appropriate instrument.
- Set fluorescence amplitude thresholds to clearly distinguish positive and negative partitions for each channel.
- Calculate the raw concentration (copies/µL) of mutant and wild-type targets using the instrument's software, which applies Poisson statistics.
- Normalize for extraction efficiency: Calculate the recovery percentage of the spike-in control and use it to correct the measured mutant and wild-type concentrations [47] [49].
- Report the mutant allele frequency (MAF) as: [Mutant copies / µL] / ([Mutant copies / µL] + [Wild-type copies / µL]).
Optimizing amplicon size to match the fragmented nature of cfDNA is a fundamental and highly effective strategy for maximizing the detection efficiency of KRAS mutations in liquid biopsies. By reducing amplicon size from over 100 bp to approximately 60-80 bp, researchers can achieve a dramatic increase in detection efficiency and sensitivity, enabling the reliable detection of mutant alleles at frequencies below 0.2% [36]. This protocol, which integrates careful primer and probe design with robust experimental workflows and appropriate normalization controls, provides a reliable framework for developing clinical-grade dPCR assays. This approach ensures high-quality data for cancer monitoring, treatment response assessment, and the detection of minimal residual disease.
The ability to detect genetic variants present at frequencies of 0.1% or lower represents a critical frontier in molecular diagnostics, particularly for oncology applications where rare mutant alleles serve as crucial biomarkers. Digital PCR (dPCR) has emerged as a leading technology for this challenge, enabling precise absolute quantification of rare mutations without standard curves by partitioning samples into thousands of individual reactions [7] [10]. This technical capability is especially valuable in liquid biopsy analysis, where circulating tumor DNA (ctDNA) fragments often constitute less than 1% of total cell-free DNA (cfDNA) in early-stage cancer [7] [50]. For KRAS mutation detection, this sensitivity is paramount, as KRAS mutations drive numerous malignancies and often exist in heterogeneous tumor populations or minimal residual disease [15] [51].
The fundamental principle underlying dPCR's exceptional sensitivity is statistical partitioning, which effectively enriches low-level targets by distributing a sample across numerous individual microchamber or droplet reactions [7] [10]. According to Poisson statistics, this partitioning allows precise calculation of target concentration based on the ratio of positive to negative partitions, achieving detection sensitivity for mutation allele frequencies (MAFs) as low as 0.1% [7]. This review details standardized protocols and experimental considerations for achieving consistent, reliable detection at this sensitivity threshold, with particular emphasis on KRAS mutation detection in cancer research.
Technology Comparison and Selection
dPCR Versus qPCR for Rare Allele Detection
When targeting variant allele frequencies ≤0.1%, the selection of appropriate molecular detection technology is paramount. Digital PCR offers distinct advantages over quantitative PCR (qPCR) for this application, primarily through its ability to provide absolute quantification without standard curves and enhanced resistance to PCR inhibitors [52] [53].
Table 1: Comparative Analysis of qPCR and dPCR for Rare Variant Detection
| Parameter | Quantitative PCR (qPCR) | Digital PCR (dPCR) |
|---|---|---|
| Quantification Method | Relative (requires standard curve) | Absolute (no standard curve) |
| Detection Sensitivity | Moderate (typically 1-5% VAF) | High (as low as 0.1% VAF) [7] |
| Precision at Low VAF | Limited by standard curve accuracy | High due to binary counting [54] |
| Impact of PCR Inhibitors | Significant effect on Ct values | Reduced impact due to endpoint detection [53] |
| Throughput | High | Moderate to high [52] |
| Multiplexing Capability | Well-established | Developing, limited by channel availability [15] |
| Cost Per Reaction | Lower | Higher, especially for consumables [54] |
The fundamental difference in quantification approach makes dPCR particularly suited for rare mutation detection. While qPCR relies on comparing amplification curves to standards, dPCR uses binary detection in partitions to directly count molecules, providing superior accuracy and precision for low-abundance targets [52]. This precision is especially valuable for longitudinal monitoring of treatment response in oncology, where small changes in mutant allele concentration can signify emerging resistance [51].
dPCR Platform Considerations
Multiple dPCR platforms are commercially available, employing either droplet-based or chip-based partitioning technologies. Droplet digital PCR (ddPCR) systems generate thousands of nanoliter-sized droplets, while systems like the QIAcuity employ microchambers embedded in nanoplate technology [54] [10]. The QuantStudio Absolute Q system utilizes microfluidic array plate (MAP) technology that integrates partitioning and thermal cycling [7]. Selection between platforms should consider partition density, workflow integration, and compatibility with existing laboratory infrastructure.
Experimental Design for Ultra-Sensitive Detection
Sample Preparation and Quality Control
Robust sample preparation is foundational to achieving reliable ≤0.1% variant detection. For liquid biopsy applications, blood collection and plasma processing protocols must be optimized to preserve cfDNA integrity and prevent background contamination.
Blood Collection and Processing:
- Collect blood into cell-stabilizing tubes (e.g., cfDNA blood collection tubes) to prevent genomic DNA contamination from leukocyte lysis [15]
- Process within recommended timeframes (typically 4-6 hours for standard EDTA tubes)
- Perform double centrifugation: first at 1,600-2,000 × g for 10 minutes to separate plasma, then at 16,000 × g for 10 minutes to remove residual cells [15]
- Store plasma at -80°C if not extracting immediately
cfDNA Extraction:
- Use specialized cfDNA extraction kits designed for low-concentration samples
- Extract from 2-4 mL plasma depending on expected yield [15]
- Elute in appropriate buffers (typically TE or molecular grade water)
- Quantify using fluorometric methods (e.g., Qubit fluorometer) for accuracy at low concentrations [15]
DNA Quantification and Quality Assessment:
- Precisely quantify cfDNA using fluorescence-based methods
- Assess fragment size distribution (expected peak ~166 bp for mononucleosomal cfDNA)
- Establish minimum input mass requirements; 25 ng cfDNA is typically sufficient for >95% of metastatic cancer patients [55]
- Avoid overloading partitions; for ddPCR, typically 1-10 ng/μL per reaction [15]
Assay Design Strategies
Drop-off Assay Design for KRAS Hotspots: For detecting diverse KRAS mutations within codon 12/13, drop-off assays provide comprehensive coverage without requiring numerous mutation-specific probes. This approach uses:
- A wild-type probe labeled with HEX spanning the mutation hotspot
- A reference probe labeled with FAM targeting a stable upstream region
- Locked Nucleic Acid (LNA) technology in probes to enhance specificity and binding affinity [15]
In this design, wild-type molecules produce double-positive signals (HEX+FAM+), while mutant molecules exhibit reduced HEX signal due to probe mismatch, appearing as FAM-only partitions [15]. This approach efficiently captures multiple mutation types within a confined genomic region.
Mutation-Specific Assay Design: For monitoring known specific mutations (e.g., KRAS G12C):
- Design primers to generate amplicons of 60-120 bp to accommodate fragmented cfDNA
- Utilize TaqMan hydrolysis probes with appropriate quenchers
- Optimize primer and probe concentrations through empirical testing
- Validate specificity against wild-type-only samples
Multiplexing Strategies:
- Combine multiple mutation-specific probes with different fluorophores
- Employ reference probes for quality control
- Balance fluorophore intensities to prevent channel crosstalk
- Verify minimal cross-reactivity between assays [45]
Wet-Lab Protocol: KRAS Mutation Detection in cfDNA
Required Materials and Equipment
Table 2: Essential Research Reagents and Equipment
| Category | Specific Product/Model | Application Notes |
|---|---|---|
| dPCR System | QuantStudio Absolute Q, QIAcuity, or droplet-based systems | Platform selection depends on throughput needs and existing infrastructure [7] [54] |
| dPCR Master Mix | Absolute Q dPCR Master Mix or equivalent | Use probe-based mixes for TaqMan assays [7] |
| KRAS Assays | Predesigned Absolute Q Liquid Biopsy assays or custom TaqMan assays | Validate against known positive controls [7] |
| cfDNA Extraction Kit | PME-free circulating DNA extraction kit or equivalent | Optimized for low-concentration cfDNA [15] |
| Quantification | Qubit fluorometer with dsDNA HS assay | Essential for accurate input measurement [15] |
| LNA Probes | Custom-designed LNA probes for drop-off assays | Enhance binding specificity for short targets [15] |
Step-by-Step dPCR Protocol
Reaction Setup:
- Prepare dPCR reaction mix on ice:
- Mix thoroughly by pipetting 10-15 times; do not vortex
- Centrifuge briefly to collect solution at tube bottom
Partitioning and Amplification:
- Load samples into dPCR cartridge/chip according to manufacturer specifications
- Perform partitioning (varies by system):
- Droplet generators: Generate 20,000 droplets per sample
- Microchamber systems: Load into pre-formed nanowells
- Seal cartridge/chip to prevent evaporation
- Transfer to thermal cycler and run amplification protocol:
Data Acquisition and Analysis:
- Read partitions using appropriate imaging system (varies by platform)
- Set fluorescence thresholds using no-template and wild-type controls
- Export count data (positive and negative partitions for each channel)
- Apply Poisson statistics to calculate target concentration:
[ \text{Target Concentration} = -\ln(1 - p) \times \frac{\text{Total Partitions}}{\text{Volume}} ]
Where ( p ) is the fraction of positive partitions [10]
- Calculate variant allele frequency:
[ \text{VAF} = \frac{\text{Mutant Concentration}}{\text{Mutant Concentration} + \text{Wild-type Concentration}} \times 100\% ]
Technical Validation and Quality Control
Establishing Assay Performance
Rigorous validation is essential before implementing ultra-sensitive detection in research studies. The following parameters must be established:
Limit of Detection (LoD):
- Determine using dilution series of mutant DNA in wild-type background
- Prepare samples at 1%, 0.5%, 0.2%, 0.1%, and 0.05% VAF
- Process minimum of 12 replicates per concentration
- Establish lowest VAF detectable with ≥95% confidence [15]
- For KRAS drop-off assays, LoD of 0.57 copies/μL has been demonstrated [15]
Limit of Blank (LoB):
- Analyze multiple replicates (≥12) of wild-type-only samples
- Establish threshold for false positive rate
- For KRAS assays, LoB of 0.13 copies/μL has been achieved [15]
Precision and Reproducibility:
- Assess inter-assay precision across multiple runs, operators, and days
- Target coefficient of variation <15% for samples near LoD
- For KRAS drop-off assays, r² = 0.9096 for inter-assay precision has been reported [15]
Linearity and Dynamic Range:
- Evaluate across 3-4 orders of magnitude
- Confirm R² > 0.98 for expected concentration range
Control Strategies
Implement comprehensive controls in each run:
- No-template control: Monitor contamination
- Wild-type control: Establish background signal
- Positive control: Verify assay performance
- Reference gene control: Normalize for input variations
Troubleshooting and Optimization
Common Challenges and Solutions
Table 3: Troubleshooting Guide for Ultra-Sensitive dPCR
| Issue | Potential Causes | Solutions |
|---|---|---|
| High Background Signal | Non-specific probe binding, degraded reagents | Redesign probes with LNA bases, prepare fresh reagents, optimize annealing temperature [15] |
| Poor Partition Resolution | Improper droplet generation, chip defects | Verify partitioning quality, use fresh cartridges, check instrument calibration |
| Low Positive Partitions | Insufficient input DNA, PCR inhibition | Increase input mass (up to system capacity), add inhibition-resistant polymerases |
| Inconsistent Replicates | Pipetting error, inadequate mixing | Use calibrated pipettes, mix thoroughly by pipetting, include technical replicates |
| Failed Positive Control | Reagent degradation, protocol deviation | Check reagent storage conditions, verify thermal cycler calibration |
Optimization Strategies
Input Mass Titration:
- Test various input masses (10-100 ng total DNA) to determine optimal signal-to-noise ratio
- Balance sensitivity with potential inhibition at high inputs
Thermal Cycling Optimization:
- Perform temperature gradient for annealing/extension steps
- Validate with known low-VAF samples
Probe Concentration Optimization:
- Titrate probe concentrations (50-900 nM) to maximize signal separation
- Balance fluorescence intensity with specificity
Data Interpretation and Analysis
Statistical Considerations for Low VAF
Accurate interpretation of ≤0.1% VAF data requires appropriate statistical handling:
Poisson Correction:
- Apply Poisson statistics to account for multiple targets per partition
- Use formula: λ = -ln(1 - p), where λ is the average number of targets per partition and p is the positive partition fraction [10]
Confidence Interval Calculation:
- Use binomial proportion confidence intervals for VAF estimates
- For very low counts, employ Clopper-Pearson exact intervals
Minimum Template Requirements:
- Ensure sufficient total partitions to detect desired VAF
- For 0.1% detection with 95% confidence, approximately 300,000 wild-type partitions needed
Reporting Standards
Include these essential parameters in research reports:
- Total partitions analyzed
- Raw mutant and wild-type counts
- Poisson-corrected concentrations
- 95% confidence intervals for VAF
- Assay LoD and LoB values
- Quality control metrics
Digital PCR technology provides a robust, reproducible platform for detecting genetic variants at frequencies of 0.1% and below, enabling critical applications in liquid biopsy and minimal residual disease monitoring. The protocols detailed herein for KRAS mutation detection exemplify the rigorous approach required for ultra-sensitive molecular analysis.
As dPCR technology continues to evolve, several emerging trends promise to enhance its capabilities further. Increased multiplexing through novel probe chemistries and expanded detection channels will enable more comprehensive mutation profiling from limited samples [45]. Workflow simplification through integrated systems reduces hands-on time and potential for operator error [7]. Cost reduction strategies through miniaturization and higher-throughput platforms will improve accessibility.
For researchers implementing these protocols, success hinges on attention to pre-analytical factors, rigorous validation, and appropriate statistical analysis. When properly executed, dPCR provides unparalleled sensitivity for rare variant detection, advancing our ability to monitor cancer dynamics and therapeutic resistance through non-invasive means.
The detection of KRAS mutations is a critical component of personalized cancer therapy, particularly in colorectal cancer where these mutations predict response to anti-EGFR treatments [56]. However, this analysis is complicated by the presence of pseudogenes—non-functional genomic sequences with high homology to their parent genes—which can severely interfere with molecular assays [57]. The KRAS gene has at least two known pseudogenes: KRASP1 and a processed pseudogene [36]. When using highly sensitive techniques like digital PCR (dPCR) for liquid biopsy applications, pseudogene co-amplification can generate false-positive and false-negative results, compromising clinical decision-making [57]. This application note provides detailed strategies to overcome pseudogene interference through optimized primer design and blocker oligonucleotides, framed within the context of dPCR protocol development for KRAS mutation detection.
Primer Design Strategies to Avoid Pseudogene Amplification
Strategic Primer Placement
Careful primer design represents the first line of defense against pseudogene interference. The fundamental principle involves positioning primers in genomic regions that differ between the functional KRAS gene and its pseudogenes.
- Intron-Targeting Approach: One effective method involves designing forward primers within intronic regions that lack homology between KRAS and its pseudogenes. Although this approach successfully suppresses pseudogene amplification, it results in longer amplicons (approximately 103 bp) that are suboptimal for detecting fragmented circulating tumor DNA (ctDNA) [36].
- Mismatch-Targeting Approach: To better accommodate ctDNA analysis, researchers have redesigned primers to exploit mismatched bases located near KRAS codons 12 and 13. This strategy enables the creation of shorter, more efficient amplicons (66 bp) while maintaining specificity by suppressing pseudogene amplification [36]. The shorter fragment size significantly improves detection efficiency for ctDNA, which typically fragments to ~165 bp [36].
Table 1: Comparison of Primer Design Strategies for Avoiding Pseudogene Interference
| Design Strategy | Mechanism of Specificity | Amplicon Size | Advantages | Limitations |
|---|---|---|---|---|
| Intron-Targeting | Places primers in non-homologous intronic regions | ~103 bp | Effective pseudogene suppression | Less efficient for fragmented ctDNA |
| Mismatch-Targeting | Exploits sequence differences near target mutations | ~66 bp | Optimal for ctDNA; high specificity | Requires detailed knowledge of pseudogene sequences |
Design Considerations for ctDNA Analysis
When designing primers for liquid biopsy applications, several additional factors must be considered. The fragmented nature of ctDNA necessitates shorter amplicons (typically <100 bp) to maximize detection efficiency [36]. Furthermore, primer specificity must be rigorously validated through melting curve analysis and other quality control measures to ensure pseudogene amplification has been sufficiently suppressed [36].
Locked Nucleic Acid (LNA) Blocker Oligonucleotides
Fundamentals of LNA Technology
When primer design alone cannot resolve pseudogene interference, Locked Nucleic Acid (LNA) blockers provide a powerful alternative approach. LNA nucleotides contain a methylene bridge that locks the ribose ring in a specific conformation, enhancing thermal stability and binding specificity compared to standard DNA oligonucleotides [58]. This property makes LNA blockers particularly effective for distinguishing between highly similar sequences, such as KRAS and its pseudogenes.
Optimal LNA Blocker Design Parameters
Extensive research has identified key parameters for designing effective LNA blockers:
- Length Optimization: LNA blockers between 18-24 nucleotides demonstrate optimal effectiveness [58]. This length provides sufficient specificity for unique genomic targeting while maintaining strong binding affinity.
- LNA Positioning: An alternating pattern of LNA and DNA nucleotides throughout the oligonucleotide maximizes blocking efficiency [58]. Starting the sequence with the second position as LNA (rather than the first) typically yields higher melting temperatures and improved performance [58].
- Concentration Considerations: Effective blocking typically occurs at concentrations of 1 μM or higher, though this should be empirically determined for each specific application [58].
Table 2: Optimal Design Parameters for LNA Blockers
| Parameter | Recommendation | Impact on Performance |
|---|---|---|
| Length | 18-24 nucleotides | Balances specificity and binding affinity |
| LNA Pattern | Alternating LNA/DNA, starting at position 2 | Maximizes blocking efficiency and thermal stability |
| Concentration | ≥1 μM | Ensures complete coverage of pseudogene targets |
| Specificity | Centrally-located mismatch for discrimination | Enhances differentiation between similar sequences |
Application to KRAS Genotyping
In KRAS genotyping, LNA blockers are designed to be complementary to pseudogene sequences but not the functional KRAS gene. These blockers bind specifically to pseudogenes during the PCR annealing step, preventing their amplification by inhibiting polymerase elongation [58]. For maximal effectiveness, pairs of partially overlapping blockers on opposite strands with centrally-located mismatches can be employed [58].
Integrated Experimental Protocols
dPCR with Melting Curve Analysis for KRAS Mutation Detection
The combination of dPCR with melting curve analysis enables highly multiplexed detection of KRAS mutations while overcoming pseudogene interference.
Workflow Overview:
- Reaction Preparation: Prepare dPCR reaction mix with specimen, enzymes, primers, and molecular beacon probes [36].
- Partitioning: Distribute the reaction solution into thousands of individual wells [36].
- Amplification: Perform asymmetric PCR to generate single-stranded amplicons [36].
- Melting Curve Analysis: Measure fluorescence while controlling temperature to generate melting curves [36].
- Genotyping: Determine mutation status based on fluorescence intensity, probe color, and melting temperature (Tm) [36].
Key Optimization Steps:
- Amplicon Size Reduction: Designing primers to produce 66 bp amplicons (versus 103 bp) increases mutation detection efficiency from 25.9% to 45.2% of input DNA [36].
- Algorithm Improvement: Enhancing mutation type determination algorithms improves the limit of detection from 0.41% to 0.06% for challenging mutations like G12A [36].
Drop-off Digital PCR Assay for KRAS Codon 12/13
The KRAS drop-off ddPCR assay represents an innovative approach for detecting multiple mutation types within a hotspot region.
Assay Design Principles:
- Drop-off Probe: A 17-bp, HEX-labeled, LNA-containing probe spans the mutation hotspot and is complementary to the wild-type sequence [15].
- Reference Probe: A 19-bp, FAM-labeled, LNA-containing probe binds upstream of the mutation site to quantify total DNA molecules [15].
- Detection Mechanism: Wild-type sequences produce double-positive (HEX+FAM) signals, while mutations cause reduced HEX signal, shifting droplets to FAM-only positivity [15].
Performance Characteristics:
- Limit of Detection: 0.57 copies/μL [15]
- Limit of Blank: 0.13 copies/μL [15]
- Inter-assay Precision: r² = 0.9096 [15]
- Clinical Accuracy: Correctly identified 97.2% of mutations in validation samples [15]
The Scientist's Toolkit: Essential Research Reagents
Table 3: Key Reagents for Addressing Pseudogene Interference in KRAS Detection
| Reagent/Category | Specific Examples | Function/Application |
|---|---|---|
| Digital PCR Systems | QX200 System (Bio-Rad), QuantStudio 3D (Thermo Fisher) | Absolute quantification of mutant alleles with high sensitivity |
| LNA Oligonucleotides | Custom LNA blockers (Integrated DNA Technologies) | Suppress amplification of pseudogenes through high-affinity binding |
| PCR Enzymes/Master Mixes | ddPCR Super Mix for Probe (Bio-Rad) | Provide optimal reaction conditions for specific amplification |
| Nucleic Acid Extraction Kits | PME-free circulating DNA extraction kit (Analytik Jena) | Isolate high-quality cfDNA from plasma samples |
| Probe Chemistries | Molecular beacons, TaqMan probes with LNA modifications | Enable specific detection of mutant sequences in multiplex assays |
| Design Software | Beacon Designer (Premier Biosoft) | Facilitate design of specific primers and probes with LNA components |
Effective management of pseudogene interference is essential for accurate KRAS mutation detection in both tissue and liquid biopsy samples. The integrated application of strategic primer design and LNA blocker oligonucleotides provides a robust solution to this challenge. By implementing the protocols and design principles outlined in this application note, researchers can develop highly specific and sensitive dPCR assays capable of detecting low-frequency KRAS mutations without pseudogene interference. These advancements support the growing importance of liquid biopsy in precision oncology, enabling non-invasive monitoring of treatment response and disease progression through reliable KRAS genotyping.
In the field of molecular oncology, the accurate detection of KRAS mutations is paramount for both diagnostic precision and guiding targeted therapeutic interventions [6]. Digital PCR (dPCR) has emerged as a powerful tool for this purpose, enabling the absolute quantification of mutant alleles from challenging samples like circulating tumor DNA (ctDNA) [10] [15]. However, the ultimate sensitivity and specificity of a dPCR assay are not solely determined by biochemistry and instrumentation; they are critically dependent on the advanced data analysis pipelines and mutation call algorithms applied to the raw data. This application note details the implementation of sophisticated data analysis strategies to enhance genotyping accuracy, with a specific focus on a dPCR protocol for KRAS mutation detection. The principles outlined herein are designed to be integrated into a broader thesis on dPCR methodology, providing researchers and drug development professionals with a framework to maximize data fidelity.
Key Algorithmic Strategies for Enhanced Genotyping
The transition from basic threshold-based calling to advanced genotype determination significantly reduces misclassification. The following strategies are central to improving accuracy.
Melting Curve Analysis for Multiplexing
Conventional dPCR discriminates targets based on fluorescent probe color, which limits multiplexing capacity. Integrating melting curve analysis post-amplification adds a secondary discrimination parameter based on the melting temperature (Tm) of the probe-target duplex [6] [59].
- Workflow: After endpoint PCR in partitions, the chip is subjected to a controlled temperature gradient while fluorescence is continuously measured. A melting curve is generated for each partition, and the Tm is calculated from the negative derivative of the fluorescence versus temperature plot [6].
- Benefit: This allows for the discrimination of multiple mutations that share a fluorescent label but differ in sequence, thereby overcoming the spectral overlap limitation of fluorescent dyes. One study demonstrated simultaneous discrimination of 10 different genotypes using this method [6].
- Algorithm Improvement: Tanaka et al. reported that refining the mutation type determination algorithm for specific mutations like G12A improved the limit of detection (LOD) from 0.41% to 0.06% [6] [59].
Drop-off Assay Design for Broad Hotspot Coverage
Traditional mutation-specific assays require a unique probe for each variant, which is inefficient for regions with multiple possible point mutations, such as KRAS codons 12 and 13. The drop-off assay design offers a solution.
- Principle: Two probes are used: a "reference" probe binding to a stable upstream or downstream sequence, and a "drop-off" probe that spans the entire mutation hotspot and is perfectly complementary to the wild-type sequence [15].
- Analysis Logic:
- Wild-type DNA: Both probes bind, yielding a double-positive (FAM+HEX+) signal.
- Mutant DNA: The drop-off probe fails to hybridize due to the mismatch, resulting in a signal that is positive only for the reference channel (FAM+HEX-). This "drop-off" in the second fluorescence channel indicates any mutation within the targeted hotspot [15].
- Benefit: This design provides a highly sensitive and specific method to screen for any mutation within a defined hotspot using only two fluorescence channels, which is more efficient and cost-effective than designing multiple singleplex assays [15].
Locked Nucleic Acid Probes and Assay Optimization
The use of Locked Nucleic Acid technology in probes is a critical reagent-level choice that directly influences data quality and analytical outcomes.
- Function: LNA nucleotides confer higher binding affinity and stability to the probe-DNA duplex, allowing for the design of shorter probes that are more sensitive to single-base mismatches [15] [49].
- Impact on Analysis: The enhanced specificity of LNA probes results in clearer cluster separation in 2D amplitude plots, facilitating more accurate and automated calling of positive and negative partitions, which in turn reduces the false-positive rate [49].
Table 1: Impact of Advanced Data Analysis on Key Performance Metrics
| Analytical Method | Key Parameter | Performance Improvement | Citation |
|---|---|---|---|
| Melting Curve Analysis | Limit of Detection (LOD) for G12A | Improved from 0.41% to 0.06% | [6] [59] |
| Melting Curve Analysis | Mutation Detection Efficiency (cfDNA) | Increased from 25.9% to 45.2% of input DNA | [6] |
| Drop-off Assay Design | Specificity (vs. commercial multiplex assay) | Outperformed commercial assay in specificity | [15] |
| Multiplexing & LNA Probes | False Positive Rate | Systematically minimized through optimized probe design and validation | [49] |
Experimental Protocol: Implementing an Advanced KRAS Drop-off ddPCR Assay
Sample Preparation and cfDNA Extraction
- Blood Collection: Collect venous blood into cfDNA-stabilizing blood collection tubes (e.g., Streck Cell-Free DNA BCT) [49].
- Plasma Isolation: Perform two-step centrifugation (e.g., 1,600 × g for 10 min at 4°C, then 16,000 × g for 10 min at 4°C) to obtain platelet-poor plasma.
- cfDNA Extraction: Extract cfDNA from 2-4 mL plasma using a commercial kit (e.g., PME-free circulating DNA extraction kit, Analytik Jena) per manufacturer's instructions [15].
- Quantification: Quantify cfDNA using a fluorescence-based method (e.g., Qubit Fluorometer). A maximum of 60 ng of cfDNA per ddPCR reaction is recommended to prevent droplet overcrowding [15].
Probe and Primer Design
- Drop-off Probe: Design a 17-bp LNA probe complementary to the KRAS wild-type sequence spanning codons 12 and 13. Label with HEX. The placement of LNA bases should be optimized for specificity, not just for increasing Tm [15].
- Reference Probe: Design a 19-bp LNA probe complementary to a stable wild-type region 9 bp upstream of the drop-off probe binding site. Label with FAM [15].
- Primers: Design primers to generate an amplicon of approximately 66-80 bp to accommodate the fragmented nature of cfDNA [6] [15]. Ensure primers are located in regions that suppress amplification of homologous pseudogenes [6].
Droplet Digital PCR Setup and Run
- Reaction Mix (22 µL):
- 11 µL of 2x ddPCR SuperMix for Probes (no dUTP)
- Forward and Reverse Primers (optimized concentration, typically 400-900 nM each)
- FAM-labeled Reference Probe and HEX-labeled Drop-off Probe (optimized concentration)
- 1-60 ng of extracted cfDNA template
- Nuclease-free water to volume
- Droplet Generation: Generate droplets using an Automated Droplet Generator (e.g., Bio-Rad AutoDG) [49].
- PCR Amplification: Transfer droplets to a 96-well plate, seal, and perform PCR on a thermal cycler.
- Droplet Reading: Read the plate on a droplet reader (e.g., QX200 Droplet Reader) to measure fluorescence in each droplet for both FAM and HEX channels [49].
Data Acquisition and Analysis Workflow
The core analysis involves a multi-step process to accurately identify and quantify mutant molecules.
Diagram 1: Logical workflow for analyzing data from a KRAS drop-off ddPCR assay, culminating in genotype assignment and absolute quantification.
- Quality Control: Exclude wells with low droplet counts or signs of amplification failure.
- Cluster Identification: In the 2D plot (FAM vs. HEX), four primary clusters are identified [15]:
- FAM+ HEX+: Wild-type molecules (successful binding of both probes).
- FAM+ HEX-: Mutant molecules (reference probe bound, drop-off probe did not).
- FAM- HEX+ & FAM- HEX-: Negative droplets (no target DNA).
- Algorithm Application: The analysis software counts droplets in each cluster. The variant allele frequency (VAF) is calculated as: [Mutant copies / (Mutant copies + Wild-type copies)].
- Validation with Controls: Every run must include:
- No-Template Controls (NTCs): To monitor and establish the false-positive rate.
- Positive Controls: Both wild-type and mutant DNA to verify assay performance and cluster positioning [49].
Table 2: Research Reagent Solutions for KRAS ddPCR
| Reagent / Material | Function / Rationale | Example Product / Note |
|---|---|---|
| LNA-modified TaqMan Probes | Enhances specificity and allelic discrimination; allows for shorter probe design ideal for fragmented cfDNA. | Custom-designed, HPLC-purified probes (e.g., from Integrated DNA Technologies) [15] [49] |
| cfDNA Extraction Kit | Isolves cell-free DNA from plasma with high efficiency and minimal contamination. | Kits from Promega, Omega BioTek, or Qiagen [49] |
| ddPCR Supermix | Provides optimized buffer, polymerase, and dNTPs for robust amplification in water-in-oil emulsions. | Bio-Rad ddPCR Supermix for Probes (no dUTP) [49] |
| Synthetic DNA Controls | Acts as a non-human extraction spike-in control and positive control for assay optimization. | Xenopus tropicalis gBlock (IDT) [49] |
| Reference Gene Assay | Quantifies total human DNA content, serving as a internal control for sample quality. | RPP30 gene assay (Bio-Rad) [49] |
| DNA Reference Standards | Provides validated material with known mutation status for assay validation and determining LOD. | Horizon Discovery gDNA Reference Standards [49] |
The integration of advanced data analysis and mutation call algorithms is not merely an incremental improvement but a fundamental requirement for achieving high-fidelity genotyping in digital PCR. The methodologies detailed herein—melting curve analysis, drop-off assay logic, and the use of LNA probes—directly address key challenges in ctDNA analysis, such as low tumor fraction, the need for multiplexing, and the imperative for ultra-low limits of detection [6] [15] [49].
For researchers, the critical takeaway is that a protocol is only as good as its data interpretation framework. Establishing a rigorous, validated analytical workflow, complete with appropriate controls and a clear understanding of the algorithm's decision logic, is essential for generating reliable and reproducible results. This is especially crucial in a clinical research or drug development context, where decisions may be based on these findings. The application of these advanced analytical techniques will significantly enhance the robustness of dPCR-based KRAS mutation detection, contributing valuable data to the broader thesis of optimizing liquid biopsy protocols for precision oncology.
Digital PCR (dPCR) represents a transformative advancement in nucleic acid quantification, enabling absolute quantification of target sequences without the need for standard curves [10]. This technique operates by partitioning a PCR reaction into thousands of individual reactions, allowing for the detection and quantification of rare mutations with high precision and sensitivity [60]. The critical parameters of template input, partition number, and reaction condition optimization are particularly crucial for applications such as KRAS mutation detection, where accurate identification of oncogenic drivers directly impacts therapeutic decisions in oncology [15].
Within the broader thesis on dPCR protocol development for KRAS mutation research, this application note provides a detailed framework for method establishment. We present optimized protocols and analytical validation data to support researchers in developing robust dPCR assays for detecting KRAS mutations in clinical and research specimens, with particular emphasis on liquid biopsy applications where tumor DNA is often scarce [15] [10].
Critical Parameter Optimization
Optimizing digital PCR assays requires careful consideration of three interconnected parameters that fundamentally influence assay performance. The table below summarizes the optimal ranges and their impact on the KRAS mutation detection assay.
Table 1: Critical Parameters for dPCR Assay Optimization
| Parameter | Optimal Range for KRAS Detection | Impact on Assay Performance |
|---|---|---|
| Template Input (cfDNA) | 1-60 ng per reaction [15] | Prevents droplet saturation; maintains reaction efficiency in fragmented DNA [15]. |
| Partition Number | 20,000+ partitions [10] [60] | Higher partitions enhance detection sensitivity and precision for rare mutants [10]. |
| Reaction Volume | 20-40 µL (platform-dependent) [15] [21] | Must be compatible with the partitioning system. |
| Probe Chemistry | LNA-modified TaqMan probes [15] | Increases binding specificity and Tm, ideal for short cfDNA targets [15]. |
| Limit of Detection (LOD) | 0.17-0.57 copies/µL [15] [21] | Function of input, partitions, and probe specificity. |
| Limit of Blank (LOB) | 0.13 copies/µL [15] | Ensures specificity and minimizes false positives. |
Template Input Quantity and Quality
The quantity and quality of input template DNA are primary determinants of dPCR data reliability. For cell-free DNA (cfDNA) analysis, inputs between 1-60 ng per reaction are recommended, with precise quantification prior to setup being crucial [15]. Exceeding this range risks droplet saturation, where multiple target molecules co-partition, violating the Poisson distribution assumption and leading to underestimation of concentration [10]. For formalin-fixed paraffin-embedded (FFPE) samples, DNA fragmentation must be assessed, as excessive fragmentation can reduce amplification efficiency. The use of locked nucleic acid (LNA) probes is highly recommended for cfDNA applications, as their high binding affinity allows for shorter, more specific probes that are ideal for the fragmented nature of ctDNA [15].
Partition Number and Volume
The number of partitions generated defines the upper limit of detection sensitivity and quantitative precision. Generating ≥20,000 partitions is considered standard for rare variant detection [10] [60]. A higher number of partitions provides a larger statistical sample size, which directly improves the precision and accuracy of the absolute quantification, especially when detecting mutant KRAS alleles at very low frequencies (<0.1%) [10]. The reaction volume must be optimized for the specific dPCR platform, with 20 µL being standard for droplet-based systems (ddPCR) and up to 40 µL for some nanoplate-based systems [15] [21]. The fundamental goal is to maximize the number of partitions while ensuring consistent and monodisperse droplet or well formation.
Reaction Condition Optimization
Probe and primer design is the foundation of a specific dPCR assay. For the KRAS drop-off assay, a wild-type-specific "drop-off" probe (HEX-labeled) spans the mutation hotspot at codons 12/13, while a reference probe (FAM-labeled) binds to a stable upstream sequence within the same amplicon [15]. This design allows mutants to be identified by a loss of the HEX signal. Annealing temperature optimization via gradient PCR is essential to maximize the signal-to-noise ratio between mutant and wild-type clusters. Furthermore, the choice of restriction enzymes for genomic DNA digestion can significantly impact precision, with enzymes like HaeIII sometimes yielding superior results (CV <5%) compared to alternatives like EcoRI [21].
Experimental Protocols
KRAS Codon 12/13 Drop-off ddPCR Assay
This protocol describes a validated "drop-off" ddPCR method for detecting any mutation within the KRAS exon 2 hotspot using plasma-derived cfDNA [15].
Reagent Preparation
- Primers and LNA Probes: Resuspend lyophilized primers and probes in TE buffer to create a 100 µM stock. Prepare a 20x working primer-probe mix with the following sequences at indicated concentrations [15]:
- Drop-off probe: 5'-HEX-[LNA]-CACTGGTGG-3' (final concentration 0.25 µM)
- Reference probe: 5'-FAM-[LNA]-ACCAGCTCCAACCA-3' (final concentration 0.25 µM)
- Forward Primer: 5'-AGGCCTGCTGAAAATGACT-3' (final concentration 0.9 µM)
- Reverse Primer: 5'-CTGTATCAAAGAATGGTCCTGC-3' (final concentration 0.9 µM)
- ddPCR Supermix: Use ddPCR Supermix for Probes (No dUTP).
- cfDNA Template: Quantify using a fluorometer (e.g., Qubit). Input 1-60 ng of cfDNA per reaction.
Reaction Setup and Partitioning
- Prepare Reaction Mix (22 µL total volume):
- ddPCR Supermix: 11 µL
- 20x Primer-Probe Mix: 1.1 µL
- Nuclease-free water: 4.9 µL
- Template cfDNA: 5 µL (containing 1-60 ng DNA)
- Generate Droplets: Transfer the 22 µL reaction mix to a DG8 cartridge. Add 70 µL of droplet generation oil. Generate droplets using the QX200 Droplet Generator.
- PCR Amplification: Transfer the generated droplets to a 96-well PCR plate. Seal the plate and run the following thermal cycling protocol [15]:
- Enzyme activation: 95°C for 10 minutes
- 40-45 cycles of:
- Denaturation: 94°C for 30 seconds
- Annealing/Extension: 56°C for 60 seconds (optimize temperature)
- Enzyme deactivation: 98°C for 10 minutes
- Hold: 4°C (until ready for reading)
Data Acquisition and Analysis
- Read Plate: Place the plate in the QX200 Droplet Reader. The reader will count and analyze each droplet.
- Analyze Results: Use the manufacturer's software (e.g., QuantaSoft) to analyze the data.
- Wild-type droplets: Double-positive (FAM+ / HEX+).
- Mutant droplets: FAM-positive only (HEX signal has "dropped off").
- Calculate Concentration: The software uses Poisson statistics to calculate the absolute concentration (copies/µL) of wild-type and mutant alleles from the ratio of positive to negative droplets.
Multiplexed Reference Gene Assay for DNA Quantification
This protocol uses a pentaplex dPCR assay to accurately quantify total human genomic DNA by simultaneously targeting five reference genes, which is critical for normalizing input material for KRAS testing [48].
Restriction Digestion of gDNA
- Digest DNA: To ensure long DNA molecules are accessible for amplification, digest 1 µg of gDNA with 10 units of HindIII restriction enzyme in a 50 µL reaction at 37°C for 1 hour [48].
- Dilute DNA: Perform a ten-fold dilution of the digested DNA in 1x TE buffer.
Multiplex dPCR Setup
- Prepare Reaction Mix:
- 2x dPCR Master Mix: 12.5 µL
- 20x Pentaplex Assay Mix (Hydrolysis or Rainbow probes): 2.5 µL
- Diluted, digested gDNA: 5 µL
- Nuclease-free water: to 25 µL
- Partitioning and Amplification:
- For nanoplate systems (QIAcuity): Load the 25 µL reaction into the designated nanoplate and run the integrated partitioning/cycling program.
- For droplet systems (QX200): Generate droplets from the 20 µL reaction and amplify using a standard cycling protocol.
- Analysis: The concentration of each reference gene is absolutely quantified. The combined result provides a highly precise measure of the total number of genome equivalents in the sample, which is superior to using a single reference gene [48].
The Scientist's Toolkit
Table 2: Essential Research Reagent Solutions for dPCR
| Reagent/Category | Function & Importance | Specific Examples & Notes |
|---|---|---|
| LNA-modified Probes | Enhance hybridization specificity and thermal stability; crucial for short amplicons in cfDNA analysis [15]. | KRAS codon 12/13 drop-off and reference probes [15]. |
| Reference Gene Assays | Accurate quantification of total human DNA for input normalization and copy number variation analysis [48]. | Pentaplex panel (DCK, HBB, PMM1, RPS27A, RPPH1) provides robust normalization [48]. |
| Restriction Enzymes | Fragment high molecular weight DNA to ensure uniform amplification and access to target sequences [21] [48]. | HindIII for gDNA; HaeIII can offer improved precision for some targets [21] [48]. |
| Hybrid Amplicon Controls | Synthetic quality control materials for assay validation; contain both target and reference sequences [61]. | WPRE-RPP30 hybrid amplicon for duplex ddPCR assay validation [61]. |
| Droplet Generation Oil/Surfactant | Create stable, monodisperse water-in-oil emulsions; prevent droplet coalescence during thermal cycling [10]. | Critical for maintaining partition integrity and data quality. |
Workflow and Data Analysis
The following workflow diagram illustrates the complete process for the KRAS drop-off ddPCR assay, from sample preparation to final mutation detection.
Diagram 1: KRAS Mutation Detection Workflow.
The underlying principle of the KRAS drop-off assay is based on differential probe binding. The following logic diagram details the probe binding events that lead to the final fluorescence readout.
Diagram 2: Drop-off Assay Detection Logic.
The rigorous optimization of template input, partition number, and reaction conditions is fundamental to developing a robust dPCR assay for KRAS mutation detection. The protocols and data presented herein provide a validated roadmap for achieving high sensitivity and specificity, which is critical for applications in cancer research, patient stratification, and therapy monitoring. Adherence to these optimized parameters ensures reliable detection of low-frequency mutations, thereby supporting the advancement of precision oncology.
Assay Validation and Technology Comparison: Establishing Clinical-Grade Performance
The detection of KRAS mutations is a critical component of precision oncology, guiding treatment decisions for patients with various gastrointestinal malignancies [40] [15]. Digital PCR (dPCR), particularly droplet digital PCR (ddPCR), has emerged as a powerful technology for detecting these mutations in cell-free DNA (cfDNA) due to its exceptional sensitivity and absolute quantification capabilities without the need for a standard curve [10]. This application note details the technical validation metrics—Limit of Detection (LoD), Limit of Blank (LoB), and Precision—for a novel KRAS exon 2 drop-off ddPCR assay, providing a framework for researchers and drug development professionals to implement robust mutation detection protocols in their laboratories.
Core Technical Validation Metrics
Technical validation ensures that an analytical method is fit for its intended purpose, providing confidence in the results it generates. For dPCR assays targeting low-abundance mutations in complex biological samples like cfDNA, establishing LoD, LoB, and precision is paramount [62] [63].
Limit of Blank (LoB)
LoB represents the highest apparent analyte concentration expected to be found in replicates of a blank sample containing no analyte. It is determined by evaluating the false positive rate of the assay [63].
Limit of Detection (LoD)
LoD is the lowest concentration of an analyte that can be reliably distinguished from the LoB. It signifies the minimal mutant allele frequency that the assay can detect with a defined confidence level (typically 95%) [63]. Factors influencing LoD include the false positive rate, the total amount of DNA analyzed, and the partitioning efficiency of the dPCR system [63].
Precision
Precision quantifies the random variation in a series of replicate measurements and is usually expressed as a coefficient of variation (CV%) or a correlation coefficient (r²). It encompasses repeatability (within-run precision) and reproducibility (between-run, between-operator, between-laboratory precision) [40] [21].
Table 1: Key Validation Metrics for the KRAS Exon 2 Drop-off ddPCR Assay
| Validation Metric | Result | Description |
|---|---|---|
| Limit of Detection (LoD) | 0.57 copies/µL | The lowest mutant concentration reliably detected [40] [15]. |
| Limit of Blank (LoB) | 0.13 copies/µL | Determined from false-positive signals in non-template controls [40] [15]. |
| Inter-Assay Precision (r²) | 0.9096 | High correlation coefficient indicating excellent reproducibility [40]. |
| Clinical Sensitivity | 97.2% (35/36) | Accurately identified SNVs in ctDNA-positive patient samples [40] [15]. |
Table 2: Comparison of Platform Performance for LOD and LOQ [21]
| Platform | LOD (copies/µL input) | LOQ (copies/µL input) | Best Model Fit for LOQ |
|---|---|---|---|
| QIAcuity One (ndPCR) | 0.39 | 1.35 (54 copies/reaction) | 3rd Degree Polynomial |
| QX200 (ddPCR) | 0.17 | 4.26 (85.2 copies/reaction) | 3rd Degree Polynomial |
Experimental Protocols
KRAS Codon 12/13 Drop-off ddPCR Assay Protocol
Probe and Primer Design
- Design Principle: The drop-off assay uses two locked nucleic acid (LNA)-based TaqMan probes, both complementary to the wild-type sequence within KRAS exon 2 [40] [15].
- Drop-off Probe: A 17-bp, HEX-labeled probe spanning the mutation hotspot (codons 12/13). A mutation prevents its binding, leading to a "drop-off" in the HEX signal [40].
- Reference Probe: A 19-bp, FAM-labeled probe binding to a stable upstream region within the same amplicon. It serves as an internal control for the total number of amplifiable DNA molecules [40].
- Primers: Forward: 5'-CAA GAT TTA CCT CTA TTG TTG GA-3'; Reverse: 5'-GTG TGA CAT GTT CTA ATA TAG TC-3' [40].
- Rationale: LNA bases enhance specificity at the G12/G13 loci, allowing for shorter probe designs ideal for the fragmented nature of cfDNA [40] [15].
Sample Preparation and cfDNA Extraction
- Blood Collection: Collect venous blood into commercially available cfDNA blood collection tubes [40] [15].
- Plasma Isolation: Perform two sequential centrifugation steps to isolate plasma, which is then frozen at -80°C until DNA extraction [40].
- cfDNA Extraction: Extract cfDNA from 2-4 mL of plasma using a specialized circulating DNA extraction kit, following the manufacturer's SEP/SBS protocol [40] [15].
- Quantification: Quantify extracted cfDNA using a fluorometer. Input for ddPCR should not exceed 60 ng per well to prevent droplet overload [40].
ddPCR Reaction Setup and Thermal Cycling
- Reaction Mix (20µL): Combine 10µL of 2x ddPCR Supermix, 1µL of primer mix (5µM each), 0.2µL of each probe (5µM), 2µL of template cfDNA, and nuclease-free water to 20µL [24].
- Droplet Generation: Generate droplets using a commercial droplet generator.
- Thermal Cycling: Amplify using the following profile: 10 min at 95°C (enzyme activation); 40 cycles of 15 sec at 95°C (denaturation) and 60 sec at 60°C (combined annealing/extension); followed by a 10 min hold at 98°C for enzyme deactivation [24].
- Droplet Reading: Read the stabilized droplets on a droplet reader. Positive and negative droplets are counted using instrument software [40] [24].
Diagram 1: Experimental workflow for KRAS mutation detection via ddPCR.
Protocol for Determining Limit of Blank (LoB)
- Prepare Blanks: Process multiple replicates (recommended n ≥ 5) of a blank sample, such as nuclease-free water or plasma from healthy donors, through the entire cfDNA extraction and ddPCR workflow [63].
- Run ddPCR: Analyze all blank replicates using the established KRAS drop-off ddPCR assay.
- Calculate LoB: The LoB is defined as the 95th percentile of the mutant copy concentration measured in the blank replicates. In the referenced study, the LoB was determined to be 0.13 copies/µL [40] [15].
Protocol for Determining Limit of Detection (LoD)
- Prepare Positive Controls: Create samples with known, low concentrations of mutant KRAS alleles. This can be done by serially diluting DNA from a KRAS-mutant cell line (e.g., SW620 for G12V) into wild-type DNA [24].
- Run Replicates: Analyze multiple replicates (recommended n ≥ 5) of each dilution level, including a blank, using the ddPCR assay.
- Calculate LoD: The LoD is the lowest concentration at which the mutant allele is detected in ≥95% of replicates. The formula often used is: LoD = LoB + 1.645×(SD of low-concentration sample). The validated LoD for this assay was 0.57 copies/µL [40] [15] [63].
Protocol for Determining Precision
- Experimental Design:
- Repeatability: Run multiple replicates (n=3-5) of the same sample at different mutant allele frequencies (high, medium, low) within the same experiment (same run, same operator, same instrument) [40] [62].
- Reproducibility: Repeat the above across different days, by different operators, or using different instruments [62].
- Statistical Analysis:
- Calculate the mean concentration and standard deviation (SD) for each set of replicates.
- Compute the Coefficient of Variation (CV% = (SD/Mean) × 100). Lower CV% indicates higher precision. The inter-assay precision for the KRAS drop-off assay was reported as r² = 0.9096 [40].
The Scientist's Toolkit
Table 3: Essential Research Reagents and Solutions
| Item | Function / Rationale | Example / Specification |
|---|---|---|
| cfDNA Blood Collection Tubes | Stabilizes nucleases in blood to prevent cfDNA degradation before processing [40]. | Commercial BCTs (e.g., Ruwag, cat. no. 218997) [15]. |
| Circulating DNA Extraction Kit | Optimized for low-concentration, short-fragment cfDNA isolation from plasma [40]. | PME-free circulating DNA extraction kit (Analytik Jena) [40] [15]. |
| LNA TaqMan Probes | Locked Nucleic Acids increase probe binding affinity and specificity, crucial for discriminating single-nucleotide variants [40]. | Custom-designed 17-19bp probes with FAM/HEX labels [40]. |
| ddPCR Supermix | Provides optimized buffer, polymerase, and dNTPs for efficient amplification in water-in-oil emulsions [24]. | Bio-Rad ddPCR Supermix for Probes (no dUTP) [62] [24]. |
| Restriction Enzymes | Digests genomic DNA to improve PCR amplification efficiency and accessibility of target regions [21] [24]. | EcoRI or HaeIII (choice can impact precision) [21] [24]. |
Diagram 2: Logical relationship between assay design components and detection outcomes.
Rigorous determination of LoD, LoB, and precision is fundamental to deploying a reliable ddPCR assay for KRAS mutation detection in clinical research. The KRAS exon 2 drop-off ddPCR assay, with a LoD of 0.57 copies/µL, LoB of 0.13 copies/µL, and high inter-assay precision (r² = 0.9096), demonstrates performance metrics suitable for monitoring low-abundance mutations in cfDNA [40] [15]. Adherence to the detailed protocols for assay design, validation, and execution will provide researchers with a powerful tool for advancing cancer diagnostics and personalized medicine.
The detection of somatic mutations, such as those in the KRAS gene, is critical for molecular pathology, guiding targeted therapies, and predicting treatment responses in cancers including colorectal cancer and non-small cell lung cancer (NSCLC) [64] [65]. The choice of detection platform significantly impacts the sensitivity, specificity, and scope of mutation analysis. This application note provides a detailed comparison of three cornerstone technologies—digital PCR (dPCR), next-generation sequencing (NGS), and quantitative PCR (qPCR)—focusing on their application in KRAS mutation detection. We summarize performance data from recent meta-analyses and primary studies, provide validated protocols for dPCR and NGS, and offer guidance for selecting the optimal methodology based on specific research objectives.
Technology Comparison and Performance Data
The selection of a mutation detection platform involves balancing multiple factors, including sensitivity, throughput, discovery power, and cost. The tables below summarize the core characteristics and diagnostic performance of dPCR, NGS, and qPCR.
Table 1: Key Characteristics of dPCR, NGS, and qPCR
| Feature | Digital PCR (dPCR) | Next-Generation Sequencing (NGS) | Quantitative PCR (qPCR) |
|---|---|---|---|
| Primary Use | Rare variant detection & absolute quantification [7] | Multi-gene profiling & novel discovery [19] | Targeted analysis of known variants [19] |
| Discovery Power | Low (targets known sequences only) | High (hypothesis-free; detects novel variants) [19] | Low (targets known sequences only) [19] |
| Throughput | Low to medium (one to a few targets per run) | Very high (hundreds to thousands of targets) [19] | Medium (suited for ≤ 20 targets) [19] |
| Sensitivity (Limit of Detection) | Very High (0.01% - 0.1% VAF) [7] | Medium (1% - 5% VAF) [66] | Medium (~1% VAF) [66] |
| Quantification | Absolute, without standard curves [7] | Relative or absolute based on read counts | Relative, requires standard curves |
| Best Application | Liquid biopsy, tracking minimal residual disease [7] | Comprehensive genomic profiling, discovery [19] | Rapid, low-cost screening of few known targets [19] |
Table 2: Diagnostic Performance for KRAS Mutation Detection in Cell-Free DNA (Meta-Analysis Data)
| Technology | Pooled Sensitivity (95% CI) | Pooled Specificity (95% CI) | Diagnostic Odds Ratio (95% CI) | AUC of SROC |
|---|---|---|---|---|
| Digital PCR | 0.83 (0.79–0.86) [64] | 0.91 (0.88–0.93) [64] | 41.00 (21.07–79.78) [64] | 0.9322 [64] |
| NGS | Varies by study; high agreement with dPCR [65] | Varies by study; high agreement with dPCR [65] | Not separately pooled | >0.90 typical |
| qPCR/ARMS | Part of overall pooled accuracy [66] | Part of overall pooled accuracy [66] | Part of overall pooled accuracy [66] | 0.8992 (All methods) [66] |
| All Methods Combined | 0.77 (0.74–0.79) [66] | 0.87 (0.85–0.89) [66] | 23.96 (13.72–41.84) [66] | 0.8992 [66] |
A meta-analysis of 33 studies confirmed that dPCR, amplification refractory mutation system (ARMS, a qPCR method), and NGS all possess high accuracy for detecting KRAS mutations in cell-free DNA, with dPCR demonstrating exceptional pooled sensitivity and specificity [66]. Another meta-analysis focusing specifically on dPCR for KRAS detection in plasma reported a pooled sensitivity of 0.83 and specificity of 0.91 [64]. In a head-to-head study on NSCLC samples, NGS and dPCR showed no statistically significant difference in detection rates, with a 95.83% sensitivity and 98.11% specificity for NGS when using dPCR as a reference [65].
Experimental Protocols
Detailed Protocol: KRAS Mutation Detection using Digital PCR
This protocol is designed for the detection of low-frequency KRAS mutations (e.g., G12D, G13D) in cell-free DNA from plasma using the QuantStudio Absolute Q Digital PCR System [7].
Table 3: Key Research Reagent Solutions for dPCR
| Item | Function | Example Product |
|---|---|---|
| Absolute Q Liquid Biopsy dPCR Assays | Pre-formulated, validated assays for specific somatic mutations (e.g., KRAS G12D). Contain primers and TaqMan probes for mutant and wild-type sequences [7]. | Thermo Fisher Scientific Absolute Q Assays |
| Digital PCR Master Mix | Optimized buffer, enzymes, and dNTPs for partitioning and amplification in dPCR. | QuantStudio Absolute Q Master Mix |
| Microfluidic Array Plate (MAP) | Consumable containing thousands of nanoscale reaction chambers for sample partitioning. | QuantStudio Absolute Q MAP |
| Proteinase K | Enzymatic digestion of proteins to release and purify nucleic acids. | Included in various DNA extraction kits |
| cfDNA Extraction Kit | For isolation of high-purity, short-fragment cell-free DNA from plasma samples. | QIAamp Circulating Nucleic Acid Kit |
Procedure:
- Sample Preparation: Extract cell-free DNA from 1-4 mL of patient plasma using a commercial cfDNA extraction kit. Quantify DNA using a fluorometer.
- Reaction Setup: Prepare a 20 µL dPCR reaction mix containing:
- 1X Absolute Q Master Mix
- 1X Absolute Q Liquid Biopsy Assay (e.g., for KRAS G12D)
- 5-20 ng of extracted cfDNA
- Partitioning and Loading: Pipette the reaction mix onto the inlet of a Microfluidic Array Plate. The Absolute Q system will automatically partition the sample into ~20,000 individual nanoreactions.
- Amplification: Place the MAP into the thermocycler and run the following program:
- Hold: 95°C for 10 minutes (enzyme activation)
- Cycle (50x): 95°C for 15 seconds (denaturation), 60°C for 1 minute (annealing/extension)
- Imaging and Analysis: The instrument automatically performs fluorescence imaging of each chamber post-amplification. The software counts the positive (mutant and wild-type) and negative partitions.
- Data Interpretation: The concentration of mutant and wild-type DNA (in copies/µL) is calculated using Poisson statistics. The variant allele frequency (VAF) is calculated as: [Mutant concentration / (Mutant concentration + Wild-type concentration)] × 100%.
Detailed Protocol: Multi-Gene Profiling using Targeted NGS
This protocol outlines the steps for using an NGS panel (e.g., the Ion AmpliSeq Lung Panel) to simultaneously profile mutations in key oncogenes, including KRAS, EGFR, and BRAF, from formalin-fixed paraffin-embedded (FFPE) tissue DNA [65].
Procedure:
- DNA Extraction and QC: Extract DNA from FFPE tissue sections. Quality control is critical; assess DNA concentration and fragmentation. A minimum of 15 ng of input DNA is often sufficient [65].
- Library Preparation: This involves several steps:
- Amplification: Amplify the target regions (e.g., exons of KRAS, EGFR, etc.) using a targeted gene panel with multiplexed primers.
- Fragmentation and Adapter Ligation: Partially digest the amplicons and ligate sequencing adapters and sample barcodes to create a library.
- Template Preparation: Clonally amplify the library fragments onto beads using emulsion PCR (Ion OneTouch/OneTouch ES system) [65].
- Sequencing: Enrich the template-positive beads and load them onto a sequencing chip (e.g., Ion 318 Chip). Perform sequencing on a Personal Genome Machine (PGM) or similar system using semiconductor sequencing technology [65].
- Data Analysis: The sequencing data is processed through a bioinformatics pipeline:
- Alignment: Map sequence reads to the human reference genome (hg19).
- Variant Calling: Identify and filter sequence variants against the reference. A minimum threshold of 1% mutant allele frequency is typical for clinical samples [65].
- Annotation: Interpret the functional and clinical significance of the identified variants.
Diagram 1: A comparison of the core workflows for digital PCR and next-generation sequencing.
The Scientist's Toolkit: Essential Research Reagent Solutions
The following table details key materials required for establishing robust dPCR and NGS assays in a research setting.
Table 4: Essential Research Reagent Solutions for Mutation Detection
| Item | Function | Key Considerations |
|---|---|---|
| TaqMan Mutation Detection Assays (qPCR) | Allele-specific PCR assays for known somatic mutations. Use a blocker to suppress wild-type amplification [67]. | Ideal for validating NGS findings or screening a few known hotspots. Compatible with standard real-time PCR systems [20]. |
| Absolute Q dPCR Assays | Pre-validated, ready-to-use assays for liquid biopsy. Guaranteed sensitivity down to 0.1% VAF [7]. | Simplifies workflow; minimizes optimization. Essential for rare mutation detection in cfDNA. |
| Targeted NGS Panels | Multiplexed primer pools for amplifying specific gene sets (e.g., cancer hot-spot panels). | Balances breadth of coverage with cost and data complexity. Offers a middle ground between whole-genome and single-gene assays [19] [65]. |
| Internal Positive Controls (IPC) | Non-human synthetic DNA sequence added to each reaction [67]. | Critical for distinguishing true negatives from PCR failure, especially in qPCR/dPCR. |
| DNA Integrity Kits | Assess the quality and fragmentation of DNA, particularly from FFPE samples. | Crucial pre-sequencing QC step; poor DNA quality is a major source of NGS failure. |
Choosing the right platform depends entirely on the research question. The following decision framework can guide scientists in selecting the most appropriate technology.
Diagram 2: A decision framework for selecting the appropriate mutation detection technology based on key research parameters.
Use qPCR/ARMS when the goal is fast, cost-effective profiling of a limited number of known mutations (e.g., ≤20 targets) and maximum sensitivity is not the primary concern [19]. Its familiar workflow and accessible instrumentation make it ideal for routine screening.
Choose dPCR when the highest possible sensitivity and absolute quantification are required for a known variant. This is particularly vital for liquid biopsy applications—such as monitoring minimal residual disease or tracking therapy resistance—where the variant allele frequency can be extremely low [64] [7]. Its ability to detect mutations with a VAF as low as 0.1% without standard curves makes it the gold standard for rare allele quantification.
Opt for NGS when the research demands a comprehensive view of the genomic landscape. It is the undisputed choice for discovering novel variants, detecting fusion genes, analyzing splice variants, and simultaneously profiling hundreds of genes across many samples [19] [65]. While its per-sample sensitivity for a single variant may be lower than dPCR, its unparalleled breadth and discovery power make it essential for exploratory research and complex biomarker studies.
In conclusion, dPCR, NGS, and qPCR are not mutually exclusive but are complementary tools in the modern molecular laboratory. The strategic selection and integration of these platforms, based on clearly defined research needs, are fundamental to advancing precision oncology and drug development.
The detection of KRAS mutations is a critical determinant in guiding targeted therapy decisions for patients with colorectal cancer (CRC) and other solid tumors. While tissue biopsy remains the gold standard for molecular profiling, its invasiveness and inability to capture dynamic tumor heterogeneity limit its utility. Liquid biopsy, which analyzes circulating tumor DNA (ctDNA) from blood plasma, presents a minimally invasive alternative for genotyping. Digital PCR (dPCR) technologies have emerged as highly sensitive and precise tools for detecting low-frequency mutations in ctDNA, offering a promising solution for routine clinical monitoring. This document outlines a comprehensive clinical validation framework for dPCR assays designed to detect KRAS mutations, focusing on key performance metrics including analytical sensitivity, specificity, and concordance with standard tissue biopsy results.
Performance Benchmarks for KRAS Mutation Detection
Validation of any diagnostic assay requires a clear definition of its performance characteristics against a reference standard. The following data summarizes the performance of various ctDNA-based methods from recent clinical studies.
Table 1: Clinical Performance of ctDNA-Based KRAS Mutation Detection versus Tissue Biopsy
| Detection Method | Sensitivity (%) | Specificity (%) | Overall Concordance (%) | Clinical Context | Source (Study) |
|---|---|---|---|---|---|
| BEAMing dPCR | 77.3 | 94.3 | 83.2 | Metastatic CRC (ColoBEAM) [68] | |
| BEAMing dPCR(Chemotherapy-naive patients) | 86.1 | 91.3 | - | Metastatic CRC (ColoBEAM) [68] | |
| ddPCR (Drop-off Assay) | - | - | 97.2 | Gastrointestinal Cancers [15] | |
| Exosomal DNA (qPCR) | - | - | ~85* | Early-Stage (I-III) CRC [69] | |
| Multiplex dPCR with Melting Curve Analysis | LOD: 0.06%-0.2% VAF | - | - | Pancreatic Cancer [6] |
Table 2: Comparison of dPCR with Alternative Technologies for ctDNA Analysis
| Technology | Reported Sensitivity | Key Advantages | Key Limitations |
|---|---|---|---|
| dPCR / ddPCR | 0.01% - 0.1% VAF [15] [10] | High sensitivity/specificity, absolute quantification, cost-effective for few targets [37] [10] | Limited multiplexing capability without advanced designs [6] |
| Next-Generation Sequencing (NGS) | ~1% VAF (for panel sequencing) [37] | High multiplexing, discovery of novel variants [37] | Higher cost, lower sensitivity for low-VAF, complex data analysis [37] |
| E-ice-COLD-PCR | Comparable to dPCR for low VAF [70] | Detects/identifies/quantifies mutations without prior knowledge, uses standard lab equipment [70] | Requires calibration for accurate quantification [70] |
Experimental Protocols for Validation
Sample Collection and Processing
Proper pre-analytical sample handling is paramount for reliable ctDNA analysis.
- Blood Collection: Collect venous blood (e.g., 3 x 9 mL) in cell-free DNA blood collection tubes (e.g., Streck Cell-Free DNA BCT) [37] [68]. Invert tubes gently 8-10 times and store upright on ice or at room temperature for a maximum of 24 hours before processing.
- Plasma Isolation: Centrifuge tubes at 1,600 × g for 10 minutes at 4°C. Transfer the supernatant (plasma) to a new tube without disturbing the buffy coat. Perform a second centrifugation at 6,000 × g for 10 minutes at 4°C to remove residual cells and platelets [68] [69]. Aliquot the clarified plasma and store at -80°C until DNA extraction.
- cfDNA Extraction: Use commercial kits designed for low-concentration DNA (e.g., QIAamp Circulating Nucleic Acid Kit) [68]. Extract cfDNA from 3-4 mL of plasma per the manufacturer's protocol. Elute DNA in a low-EDTA TE buffer or nuclease-free water.
- DNA Quantification: Quantify cfDNA using a fluorescence-based method (e.g., Qubit dsDNA HS Assay) [15]. Assess DNA fragment size distribution, if possible, via bioanalyzer or agarose gel electrophoresis to confirm a peak at ~165 bp.
dPCR Assay Execution
This protocol is adapted for a KRAS codon 12/13 drop-off ddPCR assay [15].
- Assay Principle: The assay uses two probes: a FAM-labeled reference probe binding upstream of the hotspot and a HEX-labeled "drop-off" probe spanning codons 12/13. Wild-type molecules produce a FAM+/HEX+ double-positive signal. Any mutation in the drop-off probe binding site prevents its hybridization, resulting in a FAM+/HEX- signal [15].
- Reaction Setup:
- Reagents: ddPCR Supermix for Probes (no dUTP), KRAS drop-off primer/probe mix (e.g., final concentration 900 nM primers, 250 nM probes), and template cfDNA (up to 60 ng per well) [15].
- Volume: Prepare a 20-40 µL reaction mixture per sample.
- Partitioning: Load the reaction mix into a droplet generator cartridge. Generate droplets according to the instrument manufacturer's protocol (targeting 20,000 droplets per sample).
- Thermal Cycling:
- Enzyme Activation: 95°C for 10 minutes.
- Amplification: 40-45 cycles of:
- Denaturation: 94°C for 30 seconds.
- Annealing/Extension: 55°C for 60 seconds.
- Enzyme Deactivation: 98°C for 10 minutes.
- Hold: 4°C ∞.
- Droplet Reading: Transfer the PCR plate to a droplet reader. Measure the fluorescence endpoint for FAM and HEX in each droplet.
- Data Analysis: Use the instrument's analysis software to generate 2D amplitude plots. Set thresholds to distinguish four droplet populations: FAM+/HEX+ (wild-type), FAM+/HEX- (mutant), FAM-/HEX+ (invalid), and FAM-/HEX- (empty). The variant allele frequency (VAF) is calculated as:
[Mutant droplets / (Mutant droplets + Wild-type droplets)] × 100.
Concordance Study Design
To validate the dPCR assay against the tissue biopsy gold standard, a rigorous study design is essential.
- Cohort Selection: Enroll a prospectively defined cohort of patients with confirmed CRC. Inclusion criteria should encompass various disease stages (early to metastatic) to evaluate assay performance across tumor burdens [68].
- Matched Samples: For each patient, collect a tumor tissue sample (FFPE block from biopsy or resection) and a paired blood sample for liquid biopsy. Blood samples should be drawn prior to surgery or initiation of new therapy [68] [69].
- Blinded Analysis: Perform tissue genotyping (via PCR or NGS) and plasma ctDNA dPCR analysis in separate, blinded laboratories to avoid bias.
- Statistical Analysis: Calculate sensitivity, specificity, positive predictive value (PPV), and negative predictive value (NPV) using tissue results as the reference standard. Report overall percent agreement and Cohen's kappa coefficient for concordance.
The Scientist's Toolkit
Table 3: Essential Research Reagent Solutions for dPCR-based ctDNA Analysis
| Item | Function/Application | Example Products / Components |
|---|---|---|
| cfDNA Blood Collection Tubes | Stabilizes nucleated blood cells to prevent genomic DNA contamination and preserve ctDNA profile during storage and transport. | Streck Cell-Free DNA BCT [37] [68] |
| cfDNA Extraction Kit | Isletes and purifies low-abundance, fragmented cfDNA from plasma samples with high efficiency and reproducibility. | QIAamp Circulating Nucleic Acid Kit (Qiagen) [68] |
| dPCR System | Partitions samples, performs PCR amplification, and reads fluorescence signals for absolute quantification of targets. | Bio-Rad QX200, Thermo Fisher QuantStudio, QIAcuity [10] |
| KRAS Assay Reagents | Specifically detects and quantifies KRAS wild-type and mutant sequences in the partitioned samples. | Custom LNA-based primers and TaqMan/Molecular Beacon probes [15] [6] |
| Fluorometric DNA Quantification Kit | Precisely measures low concentrations of double-stranded DNA to ensure correct input into dPCR reactions. | Qubit dsDNA HS Assay Kit [15] [71] |
Workflow and Pathway Diagrams
The detection of specific mutations, such as those in the KRAS oncogene, is a critical component of personalized cancer therapy. Researchers and clinical diagnosticians are often faced with a choice between two primary digital PCR (dPCR) strategies: mutation-specific singleplex assays, which detect one variant per reaction, and multiplex assays, which screen for multiple variants simultaneously. The decision between these approaches has significant implications for efficiency, cost, reagent consumption, and data accuracy. This application note systematically compares the performance of multiplex and singleplex assays within the context of KRAS mutation detection, providing structured data, detailed protocols, and evidence-based recommendations to guide researchers and drug development professionals in optimizing their experimental designs for circulating tumor DNA (ctDNA) analysis.
Performance Comparison: Multiplex vs. Singleplex dPCR
The performance characteristics of multiplex and singleplex dPCR assays have been quantitatively evaluated across multiple studies, particularly for detecting KRAS mutations in ctDNA. The table below summarizes key comparative metrics.
Table 1: Quantitative Performance Comparison of Multiplex and Singleplex dPCR Assays for KRAS Mutation Detection
| Performance Parameter | Multiplex dPCR Assays | Mutation-Specific Singleplex dPCR Assays | Supporting Evidence |
|---|---|---|---|
| Limit of Detection (LOD) | ~0.2% Mutant Allele Frequency (MAF) [72] | <0.1% Mutant Allele Frequency (MAF) [72] | Bio-Rad KRAS G12/G13 screening kit vs. mutation-specific assays [72] |
| Sensitivity | 84% (initial, vs. tissue) [72] | Not directly compared, but implied higher via LOD | Clinical sample analysis [72] |
| Specificity | 88% (initial, vs. tissue) [72] | Can be enhanced by drop-off designs (97.2% accuracy) [15] | Clinical sample analysis; novel drop-off assay validation [72] [15] |
| Multiplexing Capacity | Detects 7 major KRAS G12/G13 mutations in one reaction [72] | One mutation per reaction | Commercial kit specifications [72] |
| Sample Consumption | 16 ng unamplified cfDNA for a 7-plex assay [72] | Requires separate reactions for each target, consuming more sample | Study on unamplified cfDNA [72] |
| Precision (Inter-assay) | High linearity (R² > 0.99) and low intra-assay variability (median CV: 4.5%) in multiplex dPCR [73] | Highly reproducible, but variability exists between individual assay optimizations [49] | Technical validation studies [49] [73] |
Experimental Protocols
Protocol 1: Two-Step Multiplex ddPCR for Low-Abundance ctDNA
This protocol is optimized to overcome the subsampling issue when quantifying low-frequency mutant alleles in a limited cfDNA pool, as described by Iwaya et al. (2017) [74].
1. Sample Preparation and cfDNA Isolation
- Collect blood in EDTA-containing tubes. Perform two-step centrifugation: first at 1,100 g for 10 min at room temperature, then collect and recentrifuge the plasma at 18,000 g for 10 min at 4°C.
- Isolate cfDNA from 2 mL of plasma using the QIAamp Circulating Nucleic Acid Kit (Qiagen). Elute DNA in 100 μL of elution buffer.
- Quantify the extracted cfDNA using a fluorescence-based method (e.g., Qubit dsDNA HS Assay Kit).
2. Preamplification (First-Step PCR)
- Objective: To increase the copy number of the target sequence and mitigate subsampling error.
- Set up a multiplex preamplification reaction using primers for the eight major KRAS mutations (codons 12 and 13).
- Cycling Conditions: 8 cycles of amplification.
- Expected Yield: Approximately 5,000-10,000 amplified copies per ng of input cfDNA.
3. Droplet Digital PCR (Second-Step PCR)
- Probe Design: Use mutation-specific TaqMan probes containing Locked Nucleic Acid (LNA) bases to enhance binding specificity and discrimination [74].
- Reaction Setup: Prepare a 22 μL reaction mixture containing 11 μL of 2x ddPCR SuperMix for Probes (no dUTP), target-specific primers, and FAM/HEX-labeled LNA probes at optimized concentrations. Use 9.3 μL of the preamplified product as template.
- Droplet Generation: Generate approximately 22,000 droplets per sample using the QX200 droplet generator (Bio-Rad).
- Thermal Cycling: Perform PCR on a thermal cycler with optimized conditions for the LNA probes.
- Droplet Reading and Analysis: Read the plate on a QX200 droplet reader and analyze using Poisson distribution to determine the absolute concentration of mutant and wild-type alleles.
Protocol 2: KRAS Drop-off ddPCR Assay
This protocol describes a "drop-off" assay design that detects any mutation within a defined hotspot (e.g., KRAS codons 12/13), offering a balance between multiplexing and specificity [15].
1. Probe and Primer Design
- Drop-off Probe: Design a short (e.g., 17 bp), HEX-labeled LNA probe that is perfectly complementary to the wild-type sequence spanning the mutation hotspot.
- Reference Probe: Design a FAM-labeled LNA probe (e.g., 19 bp) that binds to a stable wild-type region upstream of the hotspot, within the same amplicon but without overlap.
- Primers: Design primers to generate a short amplicon (~66 bp) compatible with fragmented ctDNA.
2. Assay Principle and Workflow
- Wild-type DNA: Binds both the drop-off and reference probes, producing a double-positive (FAM+/HEX+) signal.
- Mutant DNA: Contains a mismatch within the drop-off probe binding site, preventing its hybridization. This results in a loss of HEX signal, causing the molecule to be detected as FAM-only positive.
- The ratio of FAM-only droplets to total positive droplets (FAM-only + double-positive) determines the mutant allele frequency.
3. ddPCR Setup and Analysis
- Use 10 μL of cfDNA sample per well, with a total input not exceeding 60 ng to prevent droplet overcrowding.
- Follow standard ddPCR workflows for droplet generation, PCR amplification, and droplet reading.
- In the 2D plot (FAM vs. HEX), wild-type molecules cluster in the double-positive quadrant, while mutant molecules cluster in the FAM-only quadrant.
The following diagram illustrates the logical relationship and workflow choice between singleplex and multiplex assay approaches.
The Scientist's Toolkit: Essential Reagents and Materials
Successful implementation of dPCR assays, whether singleplex or multiplex, relies on a core set of optimized reagents and materials.
Table 2: Key Research Reagent Solutions for dPCR Mutation Detection
| Reagent/Material | Function/Description | Example Use Case |
|---|---|---|
| LNA (Locked Nucleic Acid) Probes | Modified nucleic acid analogs incorporated into TaqMan probes to significantly increase binding affinity and specificity, improving allele discrimination [49] [74]. | Essential for detecting single-base mutations in a high background of wild-type DNA, used in both singleplex and multiplex formats [74] [15]. |
| cfDNA Extraction Kits | Specialized kits for isolating low-concentration, fragmented cell-free DNA from plasma samples while preserving integrity. | QIAamp Circulating Nucleic Acid Kit is widely used for obtaining analyzable cfDNA from patient plasma [74] [72]. |
| ddPCR SuperMix for Probes | A master mix optimized for probe-based digital PCR reactions, providing enzymes, dNTPs, and buffer in a single solution. | Bio-Rad's ddPCR SuperMix for Probes (no dUTP) is a standard choice for setting up ddPCR reactions [49]. |
| Reference Gene Assays | Assays targeting a conserved, single-copy gene (e.g., RPP30) to quantify total human DNA content and control for sample quality and input [49]. | Used to assess cfDNA extraction efficiency and to normalize data, crucial for accurate absolute quantification. |
| Synthetic DNA Controls | Commercially available or custom-designed DNA fragments (e.g., gBlocks, plasmid standards) containing known wild-type or mutant sequences. | Served as essential positive and negative controls for assay validation and determining limits of detection (LOD) [49] [75]. |
The choice between multiplex and singleplex dPCR assays is not a matter of superiority but of strategic application. Multiplex assays offer an unparalleled screening efficiency, allowing for the simultaneous Interrogation of multiple mutations from a minimal amount of precious sample, which is invaluable in clinical research and drug development settings where sample volume is often limited [72]. However, this broad screening capability can come with a slight trade-off in ultimate sensitivity and may require subsequent confirmation with more specific tests.
For applications demanding the highest possible sensitivity and specificity for a known, single mutation, or for the validation of findings from a multiplex screen, mutation-specific singleplex assays remain the gold standard [72]. The emergence of drop-off assays presents a powerful hybrid approach, offering a pragmatic solution for screening defined hotspots with a single reaction while maintaining high accuracy [15]. This design is particularly advantageous for monitoring regions like KRAS codons 12/13, where multiple possible mutations have clinical relevance.
In conclusion, a tiered testing strategy often proves most effective: initial rapid screening using a multiplex or drop-off assay, followed by confirmatory quantification of specific mutations with targeted singleplex assays. This combined approach leverages the strengths of both methods, ensuring comprehensive, accurate, and efficient mutational profiling for advanced cancer research and therapeutic development.
KRAS mutations are a critical biomarker in gastrointestinal malignancies, influencing both prognosis and treatment selection, particularly for therapies targeting the epidermal growth factor receptor (EGFR). The detection of these mutations has evolved with the advent of liquid biopsy, which analyzes circulating tumor DNA (ctDNA) from blood samples. This method provides a less invasive alternative to tissue biopsies and allows for real-time monitoring of tumor genomics. Within this field, droplet digital PCR (ddPCR) has emerged as a powerful technology for the absolute quantification of mutant KRAS alleles in ctDNA due to its exceptional sensitivity and precision [12] [66].
This application note details the establishment and clinical validation of a novel KRAS exon 2 drop-off ddPCR assay, evaluating its real-world performance in a cohort of patients with gastrointestinal cancers. The data and methodologies presented herein are framed within the broader objective of standardizing highly sensitive, specific, and robust ddPCR protocols for KRAS mutation detection in clinical research and drug development.
The clinical validity of the KRAS ddPCR drop-off assay was rigorously tested in a cohort of patients with confirmed KRAS-mutated gastrointestinal malignancies. The assay demonstrated high efficacy in detecting mutations in patient-derived ctDNA.
- Detection Accuracy: The assay successfully identified KRAS mutations in 35 out of 36 circulating tumor DNA-positive plasma samples, corresponding to a detection accuracy of 97.2% [12].
- Comparative Performance: In a cross-validation study, the novel drop-off assay outperformed a commercially available KRAS multiplex ddPCR assay in terms of specificity [12].
- Sensitivity in Metastatic Disease: Supporting its clinical utility, a related study using a multiplex dPCR approach with melting curve analysis detected KRAS mutations in 82.3% of pancreatic cancer patients with liver or lung metastases [36].
The table below summarizes the key analytical performance metrics of the optimized ddPCR assay.
Table 1: Analytical Validation Metrics of the KRAS ddPCR Drop-Off Assay
| Performance Parameter | Result | Description |
|---|---|---|
| Limit of Detection (LOD) | 0.57 copies/µL | The lowest concentration of mutant KRAS that can be reliably detected [12]. |
| Limit of Blank (LOB) | 0.13 copies/µL | The background signal measured in negative controls [12]. |
| Inter-Assay Precision (r²) | 0.9096 | A measure of the reproducibility and precision of the assay across multiple runs [12]. |
| Mutation Detection Accuracy | 97.2% (35/36) | The proportion of positive clinical samples correctly identified [12]. |
Experimental Protocols for ddPCR Assay
Core Principle: The Drop-Off Assay
Traditional mutation-specific ddPCR assays are limited to detecting known, pre-defined mutations. The drop-off assay format overcomes this by spanning an entire mutational hotspot (e.g., KRAS codons 12 and 13). It uses a single fluorescent probe that binds perfectly to the wild-type sequence in this region. If any mutation is present within the probe's binding site, the probe will not bind or will bind inefficiently, resulting in a "drop-off" in the fluorescent signal. This allows for the detection of any mutation within the covered hotspot, known or unknown, thereby providing a broader screening capability [12].
Detailed Step-by-Step Workflow
The following diagram illustrates the complete workflow for the KRAS mutation detection using the drop-off ddPCR assay, from sample collection to data analysis.
Figure 1: Workflow for KRAS Mutation Detection via Drop-Off ddPCR.
Step 1: Sample Collection and Plasma Preparation
- Collect peripheral blood from patients into EDTA-containing tubes.
- Perform double centrifugation (e.g., 1,600 × g for 10 min, then 16,000 × g for 10 min) to separate plasma from cellular components [12].
- Store plasma at -80°C until cfDNA extraction.
Step 2: Cell-free DNA (cfDNA) Extraction
- Extract cfDNA from plasma using commercially available kits (e.g., QIAamp Circulating Nucleic Acid Kit from QIAGEN) according to the manufacturer's instructions [56].
- Quantify cfDNA concentration using a fluorometer (e.g., Qubit).
Step 3: ddPCR Reaction Setup
- Prepare a 20-22 µL reaction mixture containing [12] [24]:
- 10 µL of 2x ddPCR Supermix for Probes (no dUTP).
- 1 µL of KRAS drop-off probe (e.g., 5 µM, labeled with FAM).
- 1 µL of reference assay (e.g., wild-type confirmatory probe or a reference gene like EPCAM, labeled with HEX/VIC).
- 5-10 µL of cfDNA template (exact volume depends on yield).
- Nuclease-free water to the final volume.
- For the drop-off assay, a wild-type probe is designed to bind to the wild-type sequence of KRAS codons 12/13. A loss of this signal indicates a mutation in the hotspot [12].
Step 4: Droplet Generation and PCR Amplification
- Transfer the reaction mixture to a droplet generator cartridge.
- Generate approximately 20,000 nanodroplets per sample using a droplet generator (e.g., Bio-Rad QX200 Droplet Generator).
- Transfer the emulsified sample to a 96-well PCR plate and seal.
- Perform PCR amplification on a thermal cycler using the following optimized protocol [24]:
- 95°C for 10 minutes (enzyme activation)
- 40 cycles of:
- 94°C for 30 seconds (denaturation)
- 60°C for 60 seconds (combined annealing/extension)
- 98°C for 10 minutes (enzyme deactivation)
- 4°C hold
Step 5: Droplet Reading and Data Analysis
- Place the PCR plate in a droplet reader (e.g., Bio-Rad QX200 Droplet Reader) which reads the fluorescence (FAM and HEX/VIC) from each droplet.
- Analyze the data using the instrument's software (e.g., QuantaSoft).
- The software generates a 2-dimensional plot of fluorescence amplitudes. Droplets are classified as:
- FAM-positive & HEX-negative: Potential mutant (drop-off event).
- FAM-negative & HEX-positive: Wild-type.
- Double-positive: Non-specific or background.
- Double-negative: Negative droplets.
- The concentration of mutant and wild-type alleles is calculated using Poisson statistics to determine the mutant allele frequency [12] [24].
Technical Optimization and Troubleshooting
Optimizing for Short Fragment cfDNA
A key challenge in ctDNA analysis is the efficient detection of short, fragmented DNA (~165 bp). To address this, the amplicon size for the KRAS assay was reduced.
- Primer Redesign: Primers were redesigned to be closer to the mutational hotspot, reducing the amplicon size from 103 bp to 66 bp. This significantly improved the detection efficiency of cfDNA, increasing it from 25.9% to 45.2% of the input DNA [36].
- Pseudogene Suppression: The new primers were designed to include mismatched bases specific to the KRAS gene, effectively suppressing the amplification of highly homologous pseudogenes (KRASP1 and processed KRASP1) [36].
Critical Reagents and Materials
The table below lists the essential reagents and materials required to establish the KRAS ddPCR drop-off assay.
Table 2: Research Reagent Solutions for KRAS ddPCR Assay
| Reagent / Material | Function / Description | Example Product / Note |
|---|---|---|
| ddPCR System | Instrument platform for partitioning, thermal cycling, and droplet fluorescence reading. | QX200 Droplet Digital PCR System (Bio-Rad) [24]. |
| ddPCR Supermix | Optimized PCR master mix for digital PCR applications. | ddPCR Supermix for Probes (no dUTP) [12]. |
| KRAS Drop-Off Probes | Fluorescently-labeled probes (e.g., FAM) designed to bind the wild-type KRAS codon 12/13 sequence. | Custom TaqMan-MGB probes [12] [24]. |
| Reference Assay Probe | Control probe for a reference gene or wild-type confirmation, labeled with a different fluorophore. | HEX or VIC-labeled probe [24]. |
| cfDNA Extraction Kit | For the isolation of high-quality, PCR-amplifiable cell-free DNA from plasma samples. | QIAamp Circulating Nucleic Acid Kit (QIAGEN) [56]. |
| Nuclease-Free Water | To make up reaction volume without degrading nucleic acids. | PCR-grade water. |
| Primers | Forward and reverse primers generating a short amplicon (~66 bp) covering KRAS exon 2. | Custom DNA Oligos [36]. |
The validated KRAS exon 2 drop-off ddPCR assay represents a significant advancement in liquid biopsy for gastrointestinal malignancies. Its demonstrated high sensitivity (97.2% accuracy), low limit of detection (0.57 copies/µL), and superior specificity in a real-world patient cohort underscore its robustness for clinical research applications [12]. The ability to detect any mutation within a key hotspot, coupled with the potential for multiplexing with mutation-specific probes, makes this protocol a powerful tool for researchers and drug developers. It facilitates non-invasive patient stratification, therapy monitoring, and the development of targeted therapies, thereby contributing meaningfully to the field of precision oncology.
Conclusion
Digital PCR has emerged as a powerful, precise, and clinically actionable technology for KRAS mutation detection, particularly in liquid biopsy applications. The development of novel assay formats like drop-off ddPCR and dPCR combined with melting curve analysis enables highly sensitive, multiplexed detection of hotspot mutations, overcoming limitations of traditional methods. With capabilities to detect variant allele frequencies as low as 0.1% and excellent concordance with NGS, optimized dPCR protocols offer researchers and drug developers a robust tool for monitoring treatment response, tracking resistance, and guiding targeted therapies. Future directions will focus on increasing multiplexing capabilities, standardizing protocols for clinical adoption, and integrating dPCR with artificial intelligence for automated analysis, further solidifying its role in personalized cancer medicine and therapeutic development.
References
- 1. Targeting KRAS mutations: orchestrating cancer evolution ... [https://www.nature.com/articles/s41392-025-02473-8]
- 2. KRAS-targeted therapies in colorectal cancer [https://www.nature.com/articles/s41698-025-01166-3]
- 3. KRAS mutation in Pancreatic Cancer - PMC - PubMed Central [https://pmc.ncbi.nlm.nih.gov/articles/PMC8380752/]
- 4. KRAS Mutations in Colorectal Adenocarcinoma [https://pubmed.ncbi.nlm.nih.gov/40940818/]
- 5. KRAS Mutations in Colorectal Adenocarcinoma [https://www.mdpi.com/2072-6694/17/17/2721]
- 6. Efficient and accurate KRAS genotyping using digital PCR ... [https://www.nature.com/articles/s41598-023-30131-y]
- 7. Digital PCR for Rare Mutation Detection [https://www.thermofisher.com/us/en/home/life-science/pcr/digital-pcr/mutation-detection.html]
- 8. Clinical validation of the detection of KRAS and BRAF ... [https://www.nature.com/articles/nm.3511]
- 9. Clinical Validation of KRAS, BRAF, and EGFR Mutation ... [https://pmc.ncbi.nlm.nih.gov/articles/PMC4332779/]
- 10. Digital PCR: from early developments to its future application ... [https://pubs.rsc.org/en/content/articlehtml/2025/lc/d5lc00055f]
- 11. Digital PCR [https://www.sigmaaldrich.com/US/en/technical-documents/protocol/genomics/pcr/digital-pcr]
- 12. A novel KRAS exon 2 drop-off digital PCR assay for ... [https://pubmed.ncbi.nlm.nih.gov/40413426/]
- 13. Data analysis method for multiplex digital pcr using color- ... [https://patents.google.com/patent/EP4372100A1/en]
- 14. Introduction to Quantitative PCR (qPCR) Gene Expression ... [https://www.thermofisher.com/us/en/home/life-science/pcr/real-time-pcr/real-time-pcr-learning-center/gene-expression-analysis-real-time-pcr-information/introduction-gene-expression.html]
- 15. A novel KRAS exon 2 drop-off digital PCR assay for mutation ... [https://diagnosticpathology.biomedcentral.com/articles/10.1186/s13000-025-01637-y]
- 16. Detection of KRAS, NRAS and BRAF mutations in liquid ... [https://www.medrxiv.org/content/10.1101/2025.10.08.25337549v1.full-text]
- 17. Guidelines for 3-color multiplex assay design for optimized ... [https://www.stillatechnologies.com/digital-pcr/naica-system-analysis/guidelines-for-3-color-multiplex-assay-design-for-optimized-performance-with-crystal-digital-pcr/]
- 18. Ultrasensitive MRD Assays for Rapid Turn - Around Times [https://www.clinicallab.com/ultrasensitive-mrd-assays-for-rapid-turn-around-times-27487]
- 19. NGS vs qPCR [https://www.illumina.com/science/technology/next-generation-sequencing/beginners/advantages/ngs-vs-qpcr.html]
- 20. Real-Time PCR (qPCR) and Whole-Transcriptome NGS [https://www.thermofisher.com/us/en/home/life-science/pcr/real-time-pcr/ngs-comparison.html]
- 21. Comparing the precision of two digital PCR applications for ... [https://www.nature.com/articles/s41598-025-13143-8]
- 22. Digital PCR: A brief history - PMC [https://pmc.ncbi.nlm.nih.gov/articles/PMC5129430/]
- 23. A Chamber-Based Digital PCR Based on a Microfluidic ... [https://pmc.ncbi.nlm.nih.gov/articles/PMC10452697/]
- 24. Evaluation of droplet digital PCR and next generation ... [https://www.nature.com/articles/s41598-018-27368-3]
- 25. Optimization of routine KRAS mutation PCR-based testing ... [https://pmc.ncbi.nlm.nih.gov/articles/PMC3797557/]
- 26. Polymerase Chain Reaction (PCR) and Droplet Digital ... [https://www.protocols.io/view/polymerase-chain-reaction-pcr-and-droplet-digital-dbb22iqe.html]
- 27. KRAS-targeted therapies in colorectal cancer - PubMed Central [https://pmc.ncbi.nlm.nih.gov/articles/PMC12658183/]
- 28. Association of KRAS variants with survival and therapeutic ... [https://www.sciencedirect.com/science/article/pii/S2059702925011755]
- 29. KRAS Inhibitors Market to Witness Explosive Growth at a ... [https://finance.yahoo.com/news/kras-inhibitors-market-witness-explosive-180000964.html]
- 30. Performance of four platforms for KRAS mutation detection ... [https://www.nature.com/articles/s41598-020-64822-7]
- 31. Detection of KRAS mutations in plasma cell-free DNA ... [https://pmc.ncbi.nlm.nih.gov/articles/PMC6944046/]
- 32. Isolation and Quantification of Plasma Cell-Free DNA ... [https://pmc.ncbi.nlm.nih.gov/articles/PMC9601152/]
- 33. Measuring KRAS Mutations in Circulating Tumor DNA by ... [https://pmc.ncbi.nlm.nih.gov/articles/PMC6085225/]
- 34. Exploring Cell free DNA extraction and testing | IDT [https://www.idtdna.com/page/support-and-education/decoded-plus/cfdna-extraction-here-s-what-you-need-to-know/]
- 35. dPCR vs qPCR [https://www.qiagen.com/us/applications/digital-pcr/beginners/dpcr-vs-qpcr]
- 36. Efficient and accurate KRAS genotyping using digital PCR ... [https://pmc.ncbi.nlm.nih.gov/articles/PMC9944920/]
- 37. Performance Comparison of Droplet Digital PCR and Next ... [https://pmc.ncbi.nlm.nih.gov/articles/PMC12062871/]
- 38. KRAS genotyping by digital PCR combined with melting ... [https://www.nature.com/articles/s41598-019-38822-1]
- 39. Development and validation of a methylation-specific ... [https://www.nature.com/articles/s41598-025-15228-w]
- 40. A novel KRAS exon 2 drop-off digital PCR assay for ... [https://pmc.ncbi.nlm.nih.gov/articles/PMC12103757/]
- 41. 10-Plex Digital Polymerase Chain Reaction with Four-Color Melting Curve Analysis for Simultaneous KRAS and BRAF Genotyping - PubMed [https://pubmed.ncbi.nlm.nih.gov/32786457/]
- 42. How Digital PCR Enables Early Molecular Relapse Detection [https://www.thermofisher.com/blog/behindthebench/early-molecular-relapse-detection-dpcr]
- 43. KRAS genotyping by digital PCR combined with melting curve analysis - PubMed [https://pubmed.ncbi.nlm.nih.gov/30796246/]
- 44. Highly multiplexed digital PCR assay for simultaneous ... [https://pubmed.ncbi.nlm.nih.gov/40077847/]
- 45. Multiplex Digital PCR Assay to Detect Multiple KRAS and ... [https://www.sciencedirect.com/science/article/pii/S1525157823000521]
- 46. A Review of Circulating Tumor DNA (ctDNA) and the Liquid ... [https://pmc.ncbi.nlm.nih.gov/articles/PMC12032849/]
- 47. Evaluation of variability in cell-free DNA extraction ... [https://www.nature.com/articles/s41598-025-06563-z]
- 48. Multiplexed Digital PCR Reference Gene Measurement for ... [https://pmc.ncbi.nlm.nih.gov/articles/PMC12523864/]
- 49. Optimisation of robust singleplex and multiplex droplet ... [https://www.nature.com/articles/s41598-019-49043-x]
- 50. A set cover algorithm identifies minimal circulating tumour ... [https://www.nature.com/articles/s41598-025-24719-9]
- 51. Advances in biomarkers of resistance to KRAS mutation ... [https://pmc.ncbi.nlm.nih.gov/articles/PMC12508421/]
- 52. Digital PCR (dPCR) vs Real-Time PCR (qPCR) [https://firalismolecularprecision.com/2025/04/09/dpcr-qpcr-differences/]
- 53. Quantitative or digital PCR? A comparative analysis for ... [https://www.sciencedirect.com/science/article/abs/pii/S0165993624001584]
- 54. Comparative Performance of Digital PCR and Real-Time RT ... [https://pmc.ncbi.nlm.nih.gov/articles/PMC12474457/]
- 55. Ultra-sensitive mutation detection and genome-wide DNA ... [https://pmc.ncbi.nlm.nih.gov/articles/PMC6214522/]
- 56. Improvement of digital PCR conditions for direct detection ... [https://pmc.ncbi.nlm.nih.gov/articles/PMC7439326/]
- 57. Dealing with Pseudogenes in Molecular Diagnostics in the ... [https://pubmed.ncbi.nlm.nih.gov/34165726/]
- 58. LNA blockers for improved amplification selectivity [https://www.nature.com/articles/s41598-023-31871-7]
- 59. Efficient and accurate KRAS genotyping using digital PCR ... [https://pubmed.ncbi.nlm.nih.gov/36810451/]
- 60. Digital PCR: from early developments to its future application ... [https://pmc.ncbi.nlm.nih.gov/articles/PMC12278255/]
- 61. A method to validate viral copy-number assay involving a ... [https://www.sciencedirect.com/science/article/pii/S2329050125000786]
- 62. In-house validation of a droplet digital PCR system using ... [https://www.sciencedirect.com/science/article/pii/S0003267025005665]
- 63. Determining lower limits of detection of digital PCR assays ... [https://www.sciencedirect.com/science/article/pii/S2214753514000047]
- 64. Reliability of digital PCR in detecting KRAS mutation ... [https://pmc.ncbi.nlm.nih.gov/articles/PMC7360253/]
- 65. Next-generation sequencing-based detection of EGFR, ... [https://pmc.ncbi.nlm.nih.gov/articles/PMC6072231/]
- 66. A systematic review and meta-analysis | PLOS One [https://journals.plos.org/plosone/article?id=10.1371/journal.pone.0248775]
- 67. Mutation Detection With Real-Time PCR [https://www.thermofisher.com/us/en/home/life-science/pcr/real-time-pcr/real-time-pcr-applications/mutation-detection-with-real-time-pcr.html]
- 68. Sensitive cell-free DNA assay for accurate detection of RAS ... [https://pmc.ncbi.nlm.nih.gov/articles/PMC12606561/]
- 69. Performance of KRAS mutation detection in plasma exosomes ... [https://translational-medicine.biomedcentral.com/articles/10.1186/s12967-025-06710-0]
- 70. Comparison of the quantification of KRAS mutations by ... [https://www.sciencedirect.com/science/article/pii/S0009898116304983]
- 71. A Novel Digital PCR Assay for Accurate Detection and ... [https://www.mdpi.com/2072-6694/17/5/811]
- 72. Multiplex KRASG12/G13 mutation testing of unamplified cell ... [https://pmc.ncbi.nlm.nih.gov/articles/PMC5834133/]
- 73. Digital PCR outperforms quantitative real-time PCR for the ... [https://pmc.ncbi.nlm.nih.gov/articles/PMC12288185/]
- 74. An improved digital polymerase chain reaction protocol to ... [https://pmc.ncbi.nlm.nih.gov/articles/PMC5623814/]
- 75. A Multiplex SNaPshot Assay as a Rapid Method for ... [https://pmc.ncbi.nlm.nih.gov/articles/PMC3157611/]