Ligand-Based Pharmacophore Modeling with LigandScout: A Comprehensive Workflow for Drug Discovery
This article provides a comprehensive guide to ligand-based pharmacophore modeling using LigandScout, tailored for researchers and drug development professionals.
Ligand-Based Pharmacophore Modeling with LigandScout: A Comprehensive Workflow for Drug Discovery
Abstract
This article provides a comprehensive guide to ligand-based pharmacophore modeling using LigandScout, tailored for researchers and drug development professionals. It covers the foundational principles of extracting essential chemical features from a set of known active ligands to create a 3D pharmacophore model. The scope includes a detailed, step-by-step methodological workflow for building and applying models in virtual screening, practical strategies for troubleshooting and optimizing model quality, and rigorous techniques for validating model performance and comparing it to other computational methods. The integration of these four intents offers a complete framework for leveraging LigandScout to efficiently identify novel hit compounds in the drug discovery pipeline.
Understanding Ligand-Based Pharmacophore Modeling: Core Concepts and Prerequisites
The pharmacophore concept stands as one of the most enduring and fundamental frameworks in medicinal chemistry and drug discovery. It provides an abstract representation of the molecular features essential for a compound to elicit a specific biological response through interactions with a biological target. According to the modern IUPAC definition, a pharmacophore is "the ensemble of steric and electronic features that is necessary to ensure the optimal supramolecular interactions with a specific biological target structure and to trigger (or to block) its biological response" [1]. This definition emphasizes that a pharmacophore is not a specific molecule or functional group, but rather an abstract concept that captures the common molecular interaction capacities of a group of compounds toward their target structure [2]. This article traces the historical evolution of this concept, details its contemporary applications in computational drug discovery, and provides specific experimental protocols for ligand-based pharmacophore modeling, with particular emphasis on workflows utilizing LigandScout software within a broader thesis research context.
Historical Evolution of the Pharmacophore Concept
The conceptual foundation of the pharmacophore was laid by Paul Ehrlich in the late 19th century, who defined it as "a molecular framework that carries (phoros) the essential features responsible for a drug's (pharmacon) biological activity" [3]. Although Ehrlich himself used the term "toxophore" rather than "pharmacophore" in his 1898 paper to describe the features of a molecule responsible for biological effects, his work established the core principle that specific chemical groups are responsible for binding and subsequent biological effects [4]. For many years, the origin of the pharmacophore concept was erroneously credited to Ehrlich due to a misattribution, while the modern term was actually popularized by Lemont B. Kier in a series of publications between 1967 and 1971 [5] [4]. The concept underwent a critical transformation in 1960 when F. W. Schueler extended it beyond specific chemical groups to spatial patterns of abstract features in his book "Chemobiodynamics and Drug Design," forming the basis for the contemporary IUPAC definition [4]. This evolution reflects a shift from thinking about concrete chemical groups to abstract patterns of features responsible for molecular recognition.
Table: Historical Evolution of the Pharmacophore Concept
| Time Period | Key Contributor | Conceptual Contribution |
|---|---|---|
| Late 19th Century | Paul Ehrlich | Introduced precursor concept of "toxophore" as features responsible for biological effects [4] |
| 1960 | F. W. Schueler | Extended concept to spatial patterns of abstract features, moving beyond specific chemical groups [4] |
| 1967-1971 | Lemont B. Kier | Popularized the term "pharmacophore" in modern sense through publications [5] |
| 1998 | IUPAC | Formalized standard definition as "ensemble of steric and electronic features" [1] |
| 2015 | IUPAC | Reaffirmed and updated definition in computational drug design terminology [1] |
Core Features and Methodological Foundations
Essential Pharmacophore Features
A pharmacophore model consists of a three-dimensional arrangement of chemical features that a ligand must possess to effectively bind to its biological target. These features represent the key interaction points between the ligand and the target protein's active site. The core features include [5]:
- Hydrophobic areas (H): Represent regions of the molecule that participate in hydrophobic interactions, often corresponding to aliphatic chains or aromatic ring systems.
- Hydrogen bond acceptors (HBA): Atoms that can act as acceptors in hydrogen bond formation, typically oxygen or nitrogen atoms with lone electron pairs.
- Hydrogen bond donors (HBD): Groups containing a hydrogen atom bonded to an electronegative atom (like O-H or N-H) that can donate a hydrogen bond.
- Aromatic rings (AR): Planar ring systems that can participate in cation-π or π-π stacking interactions.
- Positively/negatively ionizable groups (PI/NI): Functional groups that can carry positive or negative charges under physiological conditions, enabling electrostatic interactions.
These features need to match different chemical groups with similar properties to identify novel ligands, making pharmacophore models powerful tools for scaffold hopping and virtual screening [5].
Pharmacophore Model Development Workflow
The standard workflow for developing a ligand-based pharmacophore model involves several methodical stages [5]:
- Training Set Selection: A structurally diverse set of known active molecules is selected, ideally including both active and inactive compounds to define essential features.
- Conformational Analysis: For each molecule in the training set, a set of low-energy conformations is generated, which should include the potential bioactive conformation.
- Molecular Superimposition: Multiple low-energy conformations of the molecules are superimposed to identify the best spatial alignment of common pharmacophore features.
- Feature Abstraction: The aligned molecular structures are transformed into an abstract representation using generalized pharmacophore features (e.g., hydrogen-bond donors, hydrophobic areas).
- Model Validation: The pharmacophore hypothesis is validated by testing its ability to discriminate between known active and inactive compounds, often using receiver operating characteristic (ROC) curve analysis.
Ligand-Based Pharmacophore Modeling with LigandScout: Protocols and Applications
Experimental Protocol: Ligand-Based Model Generation
Purpose: To create a validated ligand-based pharmacophore model using LigandScout for virtual screening of novel bioactive compounds. Software Requirement: LigandScout 4.3 or higher [6]. Input Materials: A set of 10-30 known active compounds with demonstrated activity against the target of interest, along with decoy molecules for validation.
Procedure:
- Training Set Preparation:
- Collect 3D structures of known active compounds in SDF or MOL2 format.
- Ensure structural diversity while maintaining comparable potency ranges (ideally within 2 log units of IC50/Ki values).
- Include known inactive compounds (or decoys) for model validation.
Pharmacophore Model Generation:
- Import all active compounds into LigandScout.
- Access the "Create Pharmacophore from Ligands" function.
- Adjust algorithm parameters: set feature tolerance to 1.5-2.0 Å, energy threshold to 20 kcal/mol above global minimum.
- Run the multiple alignment and feature detection algorithm.
- Generate 10-15 alternative pharmacophore hypotheses.
Model Selection and Validation:
- Evaluate generated models using built-in ROC curve analysis.
- Select the model with the highest area under curve (AUC) value (≥0.7 indicates acceptable discrimination) [6].
- Validate model specificity using a test set of active and inactive compounds not included in training.
- Manually refine features if necessary, removing redundant or poorly positioned features.
Virtual Screening Application:
Diagram 1: Ligand-based pharmacophore modeling and virtual screening workflow
Case Study: Dual Tyrosine Kinase Inhibitor Discovery
A 2020 study demonstrated the application of ligand-based pharmacophore modeling for identifying dual tyrosine kinase inhibitors of EGFR and VEGFR2 [6]. Researchers developed separate pharmacophore models for each target using LigandScout 4.3. The EGFR pharmacophore consisted of one hydrophobic group, three aromatic rings, two hydrogen bond acceptors, and one hydrogen bond donor, while the VEGFR2 model contained one hydrophobic group, one aromatic ring, one hydrogen bond acceptor, and one hydrogen bond donor [6]. Sequential screening of the ZINC database with both models identified 6,896 compounds satisfying both pharmacophore requirements. Subsequent molecular docking and molecular dynamics simulations refined these to two promising compounds (ZINC16525481 and ZINC38484632) that demonstrated stable binding interactions with both targets [6]. This case highlights the power of pharmacophore approaches for multi-target drug discovery.
Case Study: 17β-HSD2 Inhibitor Identification
In a 2014 study, ligand-based pharmacophore models were constructed to identify novel inhibitors of 17β-hydroxysteroid dehydrogenase type 2 (17β-HSD2), a target for osteoporosis treatment [7]. Three complementary pharmacophore models were developed based on common chemical features of known active compounds. These models successfully retrieved 87% of active compounds from a test set while excluding inactive compounds. Virtual screening of the SPECS database (containing 202,906 compounds) followed by Lipinski filtering identified 1,381 druglike hits [7]. Experimental validation of 29 selected compounds revealed 7 active inhibitors with low micromolar IC50 values, demonstrating the effectiveness of this approach for scaffold hopping and lead identification.
Table: Research Reagent Solutions for Pharmacophore Modeling
| Reagent/Resource | Type | Function in Research | Example Source |
|---|---|---|---|
| LigandScout | Software Platform | Pharmacophore model generation, validation, and virtual screening | [6] |
| ZINC Database | Compound Library | Source of purchasable compounds for virtual screening | [8] [6] |
| SPECS Database | Compound Library | Commercial database of diverse chemical structures | [7] |
| Protein Data Bank (PDB) | Structural Database | Source of 3D protein structures for structure-based modeling | [2] |
| Known Active Compounds | Chemical Structures | Training set for ligand-based model development | [7] [6] |
Advanced Applications in Drug Discovery
Virtual Screening and Scaffold Hopping
Pharmacophore-based virtual screening represents one of the primary applications of pharmacophore models in drug discovery. By using a pharmacophore as a query to search large chemical databases, researchers can identify structurally diverse compounds that share the essential features required for biological activity [3]. This approach is particularly valuable for scaffold hopping - identifying novel core structures (scaffolds) that maintain similar biological activity to known active compounds [9]. Successful scaffold hopping can lead to compounds with improved pharmacokinetic properties, reduced toxicity, or the ability to circumvent existing patents [9]. Traditional methods for scaffold hopping utilize molecular fingerprinting and structural similarity searches, while modern AI-driven approaches employ graph neural networks and generative models to explore broader chemical spaces [9].
Integration with Structure-Based Methods and Molecular Docking
While ligand-based approaches rely solely on known active compounds, structure-based pharmacophore modeling utilizes 3D structural information of the target protein, typically from X-ray crystallography or homology models [2] [3]. These complementary approaches can be integrated to enhance the reliability of virtual screening. In practice, pharmacophore models often serve as pre-filters before more computationally intensive molecular docking simulations [6]. This hierarchical approach significantly reduces the number of compounds subjected to docking while maintaining sensitivity for identifying true active compounds. The combination of pharmacophore screening and molecular docking has proven effective in numerous drug discovery campaigns, including the identification of novel antimicrobial compounds targeting DNA gyrase [8] and dual inhibitors of tyrosine kinases [6].
Diagram 2: Integrated drug discovery screening workflow combining multiple computational approaches
The pharmacophore concept has evolved significantly from Ehrlich's early ideas to the sophisticated computational tools used in modern drug discovery. The IUPAC definition now provides a standardized framework for understanding and applying this fundamental concept. Ligand-based pharmacophore modeling, particularly when implemented using tools like LigandScout, offers a powerful methodology for identifying novel bioactive compounds through virtual screening and scaffold hopping. The integration of pharmacophore approaches with other computational techniques such as molecular docking and molecular dynamics simulations creates a robust pipeline for accelerating drug discovery. As AI-driven molecular representation methods continue to advance, pharmacophore modeling will likely remain a cornerstone of computational drug design, enabling more efficient exploration of chemical space and identification of therapeutic agents for challenging drug targets.
In the landscape of computational drug discovery, researchers primarily utilize two methodological paradigms: structure-based drug design (SBDD) and ligand-based drug design (LBDD). While structure-based methods rely on the availability of the three-dimensional structure of the target protein, ligand-based strategies infer binding characteristics and biological activity from the structural and physicochemical properties of known active molecules [10]. This application note delineates the specific scenarios where a ligand-based approach is not merely an alternative, but the most rational and effective choice. This is particularly pertinent within a workflow utilizing LigandScout for advanced pharmacophore modeling, where the chemical information from active ligands can be transformed into powerful, predictive three-dimensional queries for virtual screening [7] [11] [12].
The core principle underpinning LBDD is the "molecular similarity principle," which posits that structurally similar molecules are likely to exhibit similar biological activities [12]. This principle enables researchers to build predictive models even in the absence of direct structural information about the biological target, making LBDD an indispensable tool in the early stages of drug discovery.
Key Scenarios for Selecting a Ligand-Based Approach
The decision to employ a ligand-based approach is strategic and should be guided by the specific context of the research project and the available data. The following scenarios represent conditions where LBDD is particularly advantageous.
Table 1: Scenarios Favoring a Ligand-Based Approach
| Scenario | Rationale | Recommended LBDD Method |
|---|---|---|
| No 3D protein structure available | SBDD is not feasible without a protein structure from X-ray crystallography, cryo-EM, or a reliable homology model [10]. | Pharmacophore modeling, QSAR [10] [13]. |
| Target is structurally elusive or difficult to model | For membrane proteins (e.g., GPCRs) or highly flexible targets where obtaining a stable structure is challenging [12]. | Molecular similarity search, QSAR, pharmacophore modeling. |
| Requirement for high-speed virtual screening | LBDD methods like similarity searching and pharmacophore screening are computationally faster, allowing for the rapid filtering of large libraries [10] [12]. | 2D/3D similarity screening, pharmacophore screening. |
| Availability of abundant ligand structure-activity data | When a set of known active (and inactive) compounds is available, this data can be leveraged to build robust predictive models [10] [13]. | QSAR, Pharmacophore modeling. |
| Scaffold hopping to discover novel chemotypes | To identify structurally diverse compounds that retain biological activity, thereby helping to overcome patent limitations or improve drug-like properties [9]. | 3D pharmacophore screening, shape-based similarity. |
Ligand-based approaches are not only a fallback when structural data is missing but a primary choice for specific objectives. A primary scenario is the absence of a reliable 3D protein structure. When the target's structure is unknown, experimentally undetermined, or predicted with low confidence (e.g., via homology modeling), SBDD methods like molecular docking cannot be reliably applied [10]. In such cases, LBDD becomes the foundational computational strategy.
Furthermore, LBDD excels in scaffold hopping, a process aimed at discovering new core structures (scaffolds) that retain the biological activity of a known lead compound [9]. This is crucial for designing novel chemical entities that circumvent existing patents or for optimizing lead compounds to improve their pharmacokinetic and safety profiles. Because pharmacophore models capture the essential, abstract features necessary for bioactivity—such as hydrogen bond donors/acceptors and hydrophobic regions—they can identify molecules with different backbone structures that still fulfill these fundamental interaction criteria [9] [6].
Finally, the speed and scalability of many LBDD methods make them ideal for the initial screening of ultralarge chemical libraries. Techniques like 2D fingerprint similarity searching or pharmacophore screening can rapidly prioritize a manageable number of candidates from millions of compounds, which can subsequently be processed with more computationally intensive structure-based methods [10] [12] [14]. This sequential integration optimizes resource allocation in virtual screening campaigns.
Integrating Ligand-Based and Structure-Based Methods
While powerful on its own, LBDD often reveals its full potential when integrated with SBDD in a combined virtual screening workflow. This hybrid approach leverages the strengths of both paradigms to improve the efficiency and success rate of hit identification [12].
A common and effective strategy is the sequential approach, where a large compound library is first filtered using a fast ligand-based method, and the resulting subset is then analyzed with a more computationally demanding structure-based technique [10] [12]. For instance, a pharmacophore model can reduce a multi-million compound library to a few thousand hits, which are then subjected to molecular docking. This workflow balances speed with the detailed insight provided by protein-ligand interactions, ensuring that computational resources are focused on the most promising candidates [12].
Diagram: Sequential Virtual Screening Workflow
An alternative is the parallel screening approach, where both LBDD and SBDD are run independently on the same library. The results are then combined using a consensus scoring framework, which favors compounds that are ranked highly by both methods [10] [12]. This approach mitigates the inherent limitations of each method; for example, a true active might be missed by docking due to an inaccurate scoring function but recovered by a ligand-based similarity search.
Practical Application: Ligand-Based Pharmacophore Modeling with LigandScout
The following protocol provides a detailed methodology for constructing and validating a ligand-based pharmacophore model using LigandScout software, a key component of the research workflow.
Table 2: Research Reagent Solutions for Pharmacophore Modeling
| Item / Resource | Function / Description | Application Context |
|---|---|---|
| LigandScout Software | Advanced platform for creating and exploiting structure- and ligand-based pharmacophore models for virtual screening [6] [11]. | Core software for model building, optimization, and screening. |
| OMEGA Conformer Generator | Integrated tool for generating representative, energy-optimized 3D conformations for each input ligand [11]. | Essential for exploring ligand flexibility during model creation. |
| ZINC Database | A free public resource of commercially available compounds for virtual screening [6]. | Typical compound library screened against the pharmacophore model. |
| DUD-E Server | Database of Useful Decoys: Enhanced; generates decoy molecules with similar physical properties but dissimilar chemical structures to actives [11]. | Used for model validation and benchmarking. |
| MMFF94 Force Field | A widely used force field for molecular mechanics energy minimization and conformational analysis [11]. | Used for 3D structure optimization of input ligands. |
Protocol: Ligand-Based Pharmacophore Generation & Validation
Objective: To generate a validated ligand-based pharmacophore model from a set of active compounds and use it for virtual screening.
Materials and Software:
- LigandScout software (e.g., version 4.3 or higher) [6] [11].
- A set of 2-5 known active compounds with nanomolar inhibition activity [7] [11].
- A computer with sufficient RAM (≥ 8 GB recommended) for processing compound libraries.
Methodology:
Input Ligand Preparation:
Conformational Sampling:
- Use the OMEGA conformer generator within LigandScout to generate an ensemble of conformations for each active compound. Set parameters to generate a maximum of 500 unique conformations per molecule, with an RMS threshold for duplicate conformers of 0.4 Å [11]. This step is critical for capturing the flexible nature of the ligands.
Pharmacophore Model Generation:
- In the ligand-based module, dynamically align the generated conformations of the training set compounds.
- The software will produce multiple merged pharmacophore models. Select the model with the highest inbuilt score (e.g., >0.90), which combines pharmacophore fit and atom shape overlap [11]. The model will consist of features like Hydrogen Bond Acceptors (HBA), Hydrogen Bond Donors (HBD), Hydrophobic areas (H), and Aromatic Rings (AR), potentially with exclusion volumes (XVOL) [7].
Model Validation (Critical Step):
- To ensure the model can distinguish active from inactive compounds, perform a validation screening against a set of decoys.
- Use the DUD-E server to generate ~50 decoys per active compound by inputting the SMILES strings of the actives. Decoys have similar physicochemical properties but distinct 2D structures [11].
- Screen this validation set (actives + decoys) with your pharmacophore model. A good model will retrieve a high proportion of the known actives while excluding most decoys. Optimize the model's features (e.g., making some optional, adjusting tolerance radii) to maximize this enrichment [7] [11].
Virtual Screening:
- Apply the validated pharmacophore model to screen a large database of purchasable compounds (e.g., the ZINC database, SPECS database) [7] [6].
- The screening will output a "hit list" of compounds that match the pharmacophore features. These virtual hits are predicted to be active and can be prioritized for further computational analysis (e.g., molecular docking) or experimental testing [7] [6] [12].
Diagram: Ligand-Based Pharmacophore Modeling Workflow
Case Study: Discovery of 17β-HSD2 Inhibitors
A study aimed at discovering novel inhibitors for 17β-hydroxysteroid dehydrogenase 2 (17β-HSD2) for osteoporosis treatment provides a compelling example of a successful ligand-based virtual screening campaign [7].
- Scenario: The 3D structure of 17β-HSD2 was unavailable, necessitating a ligand-based approach.
- Method: Researchers constructed multiple ligand-based pharmacophore models based on the common chemical features of structurally diverse known inhibitors. These models were refined to recognize active compounds from a test set while filtering out inactives [7].
- Validation: The combined models correctly identified 87% of the active compounds (sensitivity of 0.87) from the test set without retrieving any inactive compounds, demonstrating high specificity [7].
- Outcome: The models were used to screen the SPECS database (~202,900 compounds). From 29 compounds selected for experimental testing, 7 showed low micromolar inhibitory activity, with the most potent having an IC₅₀ of 240 nM. This highlights the power of the approach to identify novel, potent, and selective inhibitors from a large chemical space without any protein structural information [7].
Ligand-based approaches are a cornerstone of modern computational drug discovery, offering a powerful and often indispensable strategy for identifying and optimizing lead compounds. The decision to employ this methodology is strongly justified in scenarios where protein structural data is lacking, when high-speed screening is required, or when the project goal is scaffold hopping to explore novel chemical space. When integrated into a structured workflow using tools like LigandScout for pharmacophore modeling, and when combined with structure-based insights where possible, ligand-based drug design provides a robust pathway from chemical information to novel bioactive compounds, streamlining the early drug discovery pipeline.
In the field of computer-aided drug discovery, a pharmacophore is defined as the ensemble of steric and electronic features that is necessary to ensure optimal supramolecular interactions with a specific biological target and to trigger its biological response [15]. These features include hydrogen bond acceptors (HBA), hydrogen bond donors (HBD), hydrophobic areas (H), and aromatic rings (Ar) [15]. In ligand-based pharmacophore modeling, which is employed when the 3D structure of the target protein is unavailable, these features are derived from the structural alignment and analysis of known active compounds [15]. This application note details the role of these essential features within a LigandScout workflow, providing validated protocols for their identification and application in virtual screening.
The following table summarizes the core pharmacophore features, their geometric properties, and functional roles in molecular interactions.
Table 1: Essential Pharmacophore Features and Their Characteristics
| Feature | Symbol | Geometric Representation | Functional Role in Binding |
|---|---|---|---|
| Hydrogen Bond Acceptor | HBA | Vector (Directional) | Forms electrostatic interactions with hydrogen bond donors in the protein target, often with backbone or side-chain NH groups [15]. |
| Hydrogen Bond Donor | HBD | Vector (Directional) | Forms electrostatic interactions with hydrogen bond acceptors in the protein target, such as carbonyl oxygen atoms [15]. |
| Hydrophobic Area | H | Sphere (Volume) | Drives binding through van der Waals interactions and desolvation effects, often with aliphatic or aromatic side chains [15]. |
| Aromatic Ring | Ar | Sphere or Plane (Volume) | Enables π-π stacking, cation-π, and amide-π interactions with protein residues like phenylalanine, tyrosine, or histidine [15]. |
Experimental Protocols for Ligand-Based Pharmacophore Modeling
Protocol 1: Common Feature Pharmacophore Generation with LigandScout
This protocol describes the generation of a shared-feature pharmacophore model using multiple known active ligands, a common step in lead identification and optimization [8] [16].
Step 1: Training Set Selection and Preparation
- Objective: Curate a set of known active compounds with diverse structures but common biological activity.
- Procedure:
- Identify and select 3-5 known active compounds. For example, in a study on fluoroquinolone antibiotics, Ciprofloxacin, Delafloxacin, Levofloxacin, and Ofloxacin were used [8].
- Retrieve their 3D structures in SDF (Structure Data File) format from databases like PubChem [16].
- Import the SDF files into LigandScout.
Step 2: Conformational Analysis
Step 3: Common Feature Pharmacophore Generation
- Objective: Identify and model the spatial arrangement of chemical features common to all active compounds.
- Procedure:
- Initiate the "create Ligand-based pharmacophore" process in LigandScout [16].
- Based on chemical structure alignment, the software will generate multiple pharmacophore hypotheses.
- Select the model with the highest pharmacophoric fitting score and the best coverage of key features (HBA, HBD, H, Ar) [8] [16].
- Use the "merged features" option to consolidate features across different conformers and ligands. A robust model is often indicated by a high Goodness-of-Hit (GH) score (e.g., 0.739) [16].
- For increased selectivity, consider adding exclusion volumes to define regions in space that are occupied by the receptor and thus forbidden for ligands [17].
Protocol 2: Virtual Screening with a Validated Pharmacophore Model
This protocol uses a generated pharmacophore model to screen large compound libraries and identify novel hit candidates.
Step 1: Database Preparation
Step 2: Pharmacophore-Based Virtual Screening
- Objective: Identify compounds that match the essential chemical features of the pharmacophore model.
- Procedure:
- Use the pharmacophore as a 3D search query to screen the database.
- The software will return a list of "hits" that fit the model. For example, a study screened 160,000 compounds and identified 25 initial hits with high fit scores (97.85 to 116) and low RMSD values (0.28 to 0.63) [8].
Step 3: Post-Screening Analysis
- Objective: Filter and prioritize hits for further investigation.
- Procedure:
- Apply drug-likeness filters such as Lipinski's Rule of Five to assess the oral bioavailability potential of the hits [8].
- Analyze the physicochemical properties and scaffold of the top hits to ensure novelty and desired properties.
- Subject the filtered hits to molecular docking against the target protein (if structure is available) to evaluate binding pose and affinity, using the original active compound (e.g., Ciprofloxacin) as a control [8].
Workflow Visualization
The following diagram illustrates the integrated workflow for ligand-based pharmacophore modeling and virtual screening using LigandScout.
Diagram 1: Ligand-based pharmacophore modeling and screening workflow.
The Scientist's Toolkit
The following table lists essential software tools and databases used in a typical ligand-based pharmacophore modeling workflow.
Table 2: Key Research Reagent Solutions for Pharmacophore Modeling
| Tool/Resource | Type | Primary Function in Workflow | Access/Reference |
|---|---|---|---|
| LigandScout | Software | Primary platform for generating and analyzing ligand-based and structure-based pharmacophore models, and performing virtual screening [16] [18] [17]. | Commercial (Inte:Ligand) |
| PubChem | Database | Public repository to retrieve 2D and 3D structural information (SDF files) of known active compounds for the training set [16]. | https://pubchem.ncbi.nlm.nih.gov |
| ZINC/ ZINCPharmer | Database & Tool | A publicly available database of commercially compounds, integrated with the Pharmit web server for pharmacophore-based screening [8] [16]. | https://zincpharmer.csb.pitt.edu/ |
| Pharmit | Online Tool | An interactive online platform for pharmacophore-based and shape-based virtual screening of large compound libraries [19]. | https://pharmit.csb.pitt.edu |
| OMEGA | Software (Conformational Generator) | Integrated within LigandScout to generate a representative ensemble of low-energy 3D conformations for each ligand in the training set [17]. | Part of LigandScout |
The table below summarizes quantitative results from two recent studies that successfully applied the described workflow to identify novel antimicrobial compounds.
Table 3: Case Study Applications of the Pharmacophore Workflow
| Study Target | Training Set Ligands | Key Pharmacophore Features | Screening Results | Top Identified Candidate |
|---|---|---|---|---|
| Fluoroquinolone Antibiotics [8] | Ciprofloxacin, Delafloxacin, Levofloxacin, Ofloxacin | Hydrophobic, HBA, HBD, Aromatic rings [8] | 25 hits from 160,000 compounds; Docking scores: -7.3 to -7.4 kcal/mol [8] | ZINC26740199 (Docking: -7.4 kcal/mol; passed drug-likeness) [8] |
| Cephalosporin Antibiotics [16] | Cephalothin, Ceftriaxone, Cefotaxime | HBA, HBD, Aromatic rings, Hydrophobic, Negative ionizable [16] | 7 promising candidates identified; Model GH Score: 0.739 [16] | Molecule 23 & Molecule 5 (Superior binding to PBP) [16] |
In the ligand-based pharmacophore modeling workflow, the assembly and curation of a training set of active ligands is a critical foundational step that profoundly influences the success and predictive power of the resulting model. Within the LigandScout framework, a pharmacophore represents a three-dimensional arrangement of chemical features—such as hydrogen bond donors, acceptors, hydrophobic areas, and aromatic rings—essential for a ligand's biological activity [20] [21]. When structural data for the biological target is unavailable, deriving these models from a set of known active ligands becomes the primary strategy [22]. The quality, diversity, and representativeness of the training set directly determine the model's ability to identify genuine actives during virtual screening while avoiding false positives. This protocol details the systematic procedure for constructing a robust training set, a prerequisite for generating a shared-feature pharmacophore in LigandScout that accurately captures the essential interaction patterns required for binding.
Theoretical Foundations of Training Set Composition
A well-curated training set should embody several key principles to ensure the derived pharmacophore model is both discriminating and generalizable.
Principles of Training Set Selection
- Activity and Selectivity: All ligands selected for the training set must demonstrate confirmed biological activity against the target of interest. Preferably, quantitative activity data (e.g., IC₅₀, Ki) should be available to prioritize the most potent compounds for model generation [23].
- Structural Diversity: The set must encompass a broad range of core scaffolds and chemical classes. This diversity ensures the resulting model identifies the essential common features responsible for activity, rather than memorizing specific structural motifs. As demonstrated in a study on fluoroquinolone antibiotics, using diverse ligands like Ciprofloxacin, Delafloxacin, Levofloxacin, and Ofloxacin helps in mapping a comprehensive pharmacophore [8].
- Feature Representativeness: The chosen ligands must collectively present all the chemical features hypothesized to be critical for target interaction. A comprehensive pharmacophore model typically accounts for hydrogen-bond donors (HBD), hydrogen-bond acceptors (HBA), hydrophobic regions (Hy), aromatic rings (Ar), and ionizable groups [21] [24].
Table 1: Key Chemical Features in Pharmacophore Modeling and Their Descriptions
| Pharmacophore Feature | Atomic/Functional Group Representatives | Role in Molecular Recognition |
|---|---|---|
| Hydrogen Bond Acceptor (HBA) | Carbonyl oxygen, Nitrogens in heterocycles, Ethers | Forms hydrogen bonds with donor groups on the target protein. |
| Hydrogen Bond Donor (HBD) | Primary and secondary amines, Amides, Hydroxyls | Forms hydrogen bonds with acceptor groups on the target protein. |
| Hydrophobic (Hy) | Alkyl chains, Cycloalkanes, Aromatic rings | Engages in van der Waals interactions and desolvation. |
| Aromatic Ring (Ar) | Phenyl, Pyridine, Other heteroaromatic rings | Enables π-π and cation-π interactions. |
| Positive Ionizable (PI) | Primary, secondary, or tertiary amines (when protonated) | Engages in electrostatic interactions with negatively charged residues. |
| Negative Ionizable (NI) | Carboxylic acids, Tetrazoles, Phosphates | Engages in electrostatic interactions with positively charged residues. |
The Shared Feature Pharmacophore Model
LigandScout excels at creating a shared-feature pharmacophore from multiple aligned ligands [20]. This process involves superimposing the bioactive conformations of the training set ligands and identifying the spatial consensus of their chemical features. The final model is an abstraction of the indispensable interaction points common to all active compounds, effectively filtering out noise from individual ligand structures. This approach was central to a study that identified potential antimicrobial compounds by modeling shared features of fluoroquinolone antibiotics [8]. Advanced protocols for generating consensus models from large ligand sets, such as those using the ConPhar tool, further enhance model robustness by systematically integrating features from numerous ligand-target complexes [19].
Experimental Protocol: Assembling and Curating the Training Set
This section provides a detailed, step-by-step methodology for preparing a training set suitable for ligand-based pharmacophore modeling in LigandScout.
Step 1: Ligand Sourcing and Data Collection
Objective: To gather a comprehensive set of known active ligands from reliable data sources.
- Procedure:
- Query Public Databases: Extract structures and associated activity data from specialized chemical databases such as:
- Literature Mining: Collect compounds and their activity data from peer-reviewed publications relevant to the target of interest. For example, a study on acetylcholinesterase inhibitors started with 4,643 known inhibitors from the literature [23].
- Internal Compound Libraries: If available, include data from proprietary corporate or academic screening collections.
Technical Note: When exporting structures, ensure you retrieve the correct stereochemistry, as this significantly impacts 3D conformation and molecular alignment. Save the initial compound list in a standard format such as SDF or MOL2.
Step 2: Conformational Analysis and Generation
Objective: To generate a representative set of low-energy conformations for each ligand in the training set, as the bioactive conformation is typically unknown.
- Procedure:
- Select a Conformation Generation Method:
- Employ Conformer Generation Software: Use tools integrated within LigandScout or external applications like OMEGA, CONFGEN, or the conformer generation functions in MOE to produce an ensemble of conformers for each ligand.
- Set Generation Parameters:
- Energy Window: A common setting is 10-20 kcal/mol above the calculated global minimum energy to ensure coverage of biologically relevant conformations.
- Maximum Conformer Count: Limit the number of conformers per molecule (e.g., 50-100) to balance computational cost and coverage.
- Use RMSD Clustering: Apply a root-mean-square deviation (RMSD) threshold to cluster and select diverse conformers, avoiding redundant structures.
Step 3: Ligand Alignment and Final Training Set Preparation
Objective: To align the generated conformers and select the optimal conformation for each ligand to represent its putative bioactive pose.
- Procedure:
- Molecular Alignment: Use the alignment algorithms within LigandScout, which are based on pharmacophoric feature points rather than chemical structure, to superimpose the training set molecules [20].
- Select a Representative Conformation: For each ligand, choose the conformation that best fits the emerging consensus of features from the aligned set. This often requires iterative refinement.
- Finalize the Training Set: The output of this step is a set of pre-aligned ligands in their putative bioactive conformations, saved in a format compatible with LigandScout (e.g., SDF). This curated set is now ready for pharmacophore model generation.
The Scientist's Toolkit: Research Reagent Solutions
Table 2: Essential Software and Data Resources for Training Set Curation
| Tool/Resource Name | Type | Primary Function in Training Set Curation |
|---|---|---|
| LigandScout | Software Platform | Creates 3D pharmacophores from aligned ligand sets; performs virtual screening [20] [21]. |
| ZINC Database | Chemical Database | Public source of commercially available compounds for virtual screening and training set assembly [8] [24]. |
| ChEMBL Database | Bioactivity Database | Manually curated repository of bioactive molecules with quantitative data for selecting potent ligands. |
| PyMOL | Molecular Visualization | Aligns protein-ligand complexes and analyzes binding poses for structure-informed curation [19]. |
| ConPhar | Informatics Tool | Generates consensus pharmacophore models from extensive sets of ligand-target complexes [19]. |
| Pharmit | Online Tool | Interactive pharmacophore tool used to generate pharmacophore JSON files for further processing [19]. |
Quality Control and Validation
A rigorously curated training set must be validated before proceeding to pharmacophore generation.
Assessment of Training Set Composition
- Chemical Space Analysis: Employ techniques like Principal Component Analysis (PCA) or t-SNE on molecular descriptors (e.g., ECFP4 fingerprints) to visualize the structural diversity of the training set. The set should cover a broad chemical space, as demonstrated in the creation of the LigPhoreSet dataset [24].
- Pharmacophore Feature Audit: Manually verify that the aligned training set ligands collectively present a consistent and logical pattern of key features (HBA, HBD, Hy, etc.). The spatial arrangement should be sterically plausible.
Key Performance Metrics
- Fit Score and RMSD: When the model is generated, evaluate its quality by examining the fit scores and RMSD values of the training ligands to the model. A good model will have high fit scores and low RMSD values for its training compounds. For example, a successful virtual screening study reported fit scores from 97.85 to 116 and RMSD values from 0.28 to 0.63 for their top hits [8].
- Model Robustness: A robust training set enables the creation of a model that performs well in virtual screening, successfully identifying known active compounds not included in the training set (decoy set) while ranking them highly.
The meticulous assembly and curation of a training set of active ligands is an indispensable first step in the ligand-based pharmacophore modeling workflow. By adhering to the principles of activity, diversity, and feature representativeness, and by rigorously following the experimental protocol outlined herein, researchers can construct a high-quality training set. This foundation enables LigandScout to generate a pharmacophore model that accurately encapsulates the essential molecular interactions required for biological activity. Such a model is a powerful tool for streamlining virtual screening campaigns, ultimately accelerating the discovery of novel lead compounds in drug development.
LigandScout is a specialized software platform for molecular modeling and design, developed by Inte:Ligand GmbH, which enables researchers to create three-dimensional (3D) pharmacophore models from structural data [20]. At its core, LigandScout provides a complete definition of 3D chemical features—such as hydrogen bond donors, acceptors, lipophilic areas, and positively or negatively ionizable chemical groups—that describe the interactions between a bound small organic molecule (ligand) and the surrounding binding site of a macromolecule [20]. The software is utilized primarily in drug design to predict new lead structures, exemplified by its successful application in predicting biological activity of novel HIV reverse transcriptase inhibitors [20].
A key advancement is LigandScout Remote, an interface that seamlessly integrates high-performance computing (HPC) and cloud resources into the desktop application [25] [26]. This technology handles necessary data conversion and network communication transparently, eliminating traditional HPC usability barriers and allowing scientists to leverage powerful computing resources directly from the familiar LigandScout graphical interface without command-line expertise [25] [27].
Table 1: Key Capabilities of LigandScout
| Capability Category | Specific Features | Application in Research |
|---|---|---|
| Pharmacophore Modeling | Automatic creation of 3D pharmacophores from protein-ligand complexes (SB) or sets of active molecules (LB); Advanced handling of co-factors, ions, and water molecules [28] [29]. | Identifies essential chemical interactions for virtual screening and drug design [20]. |
| Virtual Screening | Uses pharmacophores as filters for screening compound databases; Includes high-performance alignment algorithms [28]. | Rapid identification of potential hit compounds from large libraries (e.g., 202,906 molecules) [7]. |
| Molecular Alignment | Pattern-matching based alignment algorithm using pharmacophoric feature points [20]. | Superimposes molecules based on interaction patterns rather than chemical structure. |
| HPC Integration | LigandScout Remote for transparent access to cluster computing resources [25] [26]. | Accelerates computationally intensive tasks like large virtual screens without manual file handling. |
Experimental Protocols for Pharmacophore Modeling
LigandScout supports two primary approaches for creating pharmacophore models: Structure-Based (SB) and Ligand-Based (LB). The following protocols detail the methodologies for both, as applied in published research.
Structure-Based (SB) Pharmacophore Modeling Protocol
This protocol is used when an experimentally determined 3D structure of the macromolecule (e.g., from PDB) is available [29].
- Input Preparation: Obtain the 3D structure of the target macromolecule in complex with a ligand from a database such as the PDB.
- Automatic Pharmacophore Generation: The LigandScout algorithm automatically tags the key chemical features of the ligand that are interacting with residues of the receptor protein [29].
- Exclusion Volume Generation: An ensemble of exclusion volume spheres is generated to represent the shape of the protein's active site, which defines spatial regions that should not be occupied by a potential inhibitor [29].
- Model Validation: The generated model is typically validated by screening a set of known active and inactive compounds to assess its ability to discriminate between them.
Ligand-Based (LB) Pharmacophore Modeling Protocol
This protocol is employed when the 3D structure of the target is unknown, and the model is derived from a set of known active ligands. The workflow below illustrates this multi-step process.
Detailed Steps:
- Data Set Curation: Gather known active and inactive compounds. Divide them into a training set (e.g., 75% of actives and inactives) and a test set (the remaining 25%) [29].
- Cluster Analysis: Cluster the active compounds in the training set using the i-cluster tool within LigandScout (default parameters: cluster_dis = 0.4 with average method) [29]. This groups molecules with similar structural properties.
- Conformational Generation: For each cluster, generate multiple low-energy conformations for each ligand using the ICON algorithm provided in LigandScout [29].
- Pharmacophore Creation and Ranking:
- Feature Alignment: The common features of the highest-ranking pharmacophores are aligned to all conformations of the next molecule in the set. This process iterates until all molecules in the cluster are processed, resulting in a final consensus LB-pharmacophore model for that cluster [29].
Pharmacophore Model Optimization Protocol
After generating SB or LB models, they must be refined and optimized for virtual screening.
- Initial Screening: Use the pharmacophore to screen the training set with the "Max. number of omitted features" parameter set to 0 [29].
- Identify Non-Essential Features:
- If the initial screening yields a high Positive Predictive Value (PPV), perform a second screening with "Max. number of omitted features" set to 1 [29].
- This helps identify features that are not critical for activity. These features can then be removed or set to "optional".
- Validation and Iteration:
- Perform a third screening with the modified pharmacophore (omitted features set back to 0).
- If the PPV increases, the change is validated. If it decreases, the pharmacophore is reverted, and other features are investigated [29].
- This protocol is repeated until three core pharmacophoric features are retained or no further non-essential features can be identified [29].
- Remove Redundancy: To create a concise and efficient screening library, redundant pharmacophores (those that do not retrieve unique hits) are identified and removed [29].
LigandScout Remote: Interface for High-Performance Computing
LigandScout Remote is designed to overcome the traditional usability barriers associated with HPC clusters [25]. It integrates these resources directly into the LigandScout desktop application, handling data conversion and network communication transparently [26]. This allows scientists to run large-scale virtual screens on HPC clusters or cloud resources (like Amazon Web Services) without manual preparation and transfer of input data or gathering of results, combining the usability of a local graphical application with the performance of HPC [25] [27].
Case Study: Application in Identifying 17β-HSD2 Inhibitors
A research study successfully used LigandScout's ligand-based pharmacophore modeling for virtual screening to discover inhibitors of 17β-hydroxysteroid dehydrogenase 2 (17β-HSD2), a target for osteoporosis treatment [7].
Table 2: Summary of Ligand-Based Virtual Screening Campaign for 17β-HSD2 Inhibitors
| Parameter | Description / Value |
|---|---|
| Target | 17β-HSD2 (for osteoporosis treatment) [7]. |
| Method | Ligand-based pharmacophore modeling with 3 complementary models [7]. |
| Training Set | Structurally diverse known active compounds (e.g., 5, 6, 7, 8) [7]. |
| Test Set | 15 active and 30 inactive compounds [7]. |
| Virtual Screen | SPECS database (202,906 compounds) [7]. |
| Screening Hits | Model 1: 573 hits; Model 2: 825 hits; Model 3: 318 hits (1,716 total, 1,381 after druglikeness filtering) [7]. |
| Experimental Validation | 29 compounds tested in vitro; 7 showed low micromolar IC₅₀ values [7]. |
| Most Potent Hit | Compound 12 (IC₅₀ = 240 nM) [7]. |
Experimental Workflow and Outcome:
- Model Construction: Three restrictive pharmacophore models were built, each based on the common chemical features of two training compounds [7].
- Model Validation: The models were validated against a test set containing 15 active and 30 inactive compounds. The combined models correctly identified 13 of the 15 active compounds (sensitivity of 0.87) without retrieving any false positives (no inactive compounds) [7].
- Virtual Screening: The models screened a large commercial database. The hit lists were filtered using a modified Lipinski rule to ensure druglikeness, yielding 1,381 unique candidates [7].
- Hit Identification: From the virtual hits, 29 compounds were biologically evaluated. This led to the identification of 7 new inhibitors with low micromolar potency, demonstrating the effectiveness of the LigandScout-generated pharmacophores [7].
Table 3: Essential Materials and Software for Pharmacophore Modeling with LigandScout
| Item / Resource | Function / Role in the Workflow |
|---|---|
| LigandScout Software | Primary platform for creating, visualizing, and optimizing SB/LB pharmacophore models, and performing virtual screens [20] [28]. |
| Protein Data Bank (PDB) | Source of 3D structural data for proteins and protein-ligand complexes, essential for structure-based pharmacophore modeling [29]. |
| Compound Databases | Commercial or in-house libraries of small molecules for virtual screening (e.g., SPECS database used in the case study) [7]. |
| i-cluster Tool | Integrated tool within LigandScout for clustering active training compounds to generate representative LB-pharmacophores [29]. |
| ICON Algorithm | The conformational analysis engine within LigandScout used to generate bioactive conformations of ligands for LB modeling [29]. |
| LigandScout Remote | Interface module for transparently accessing HPC or cloud resources to accelerate computationally intensive virtual screens [25] [26]. |
| Active/Inactive Compound Sets | Curated sets of known molecules with defined activity against the target; crucial for both model training and validation [7] [29]. |
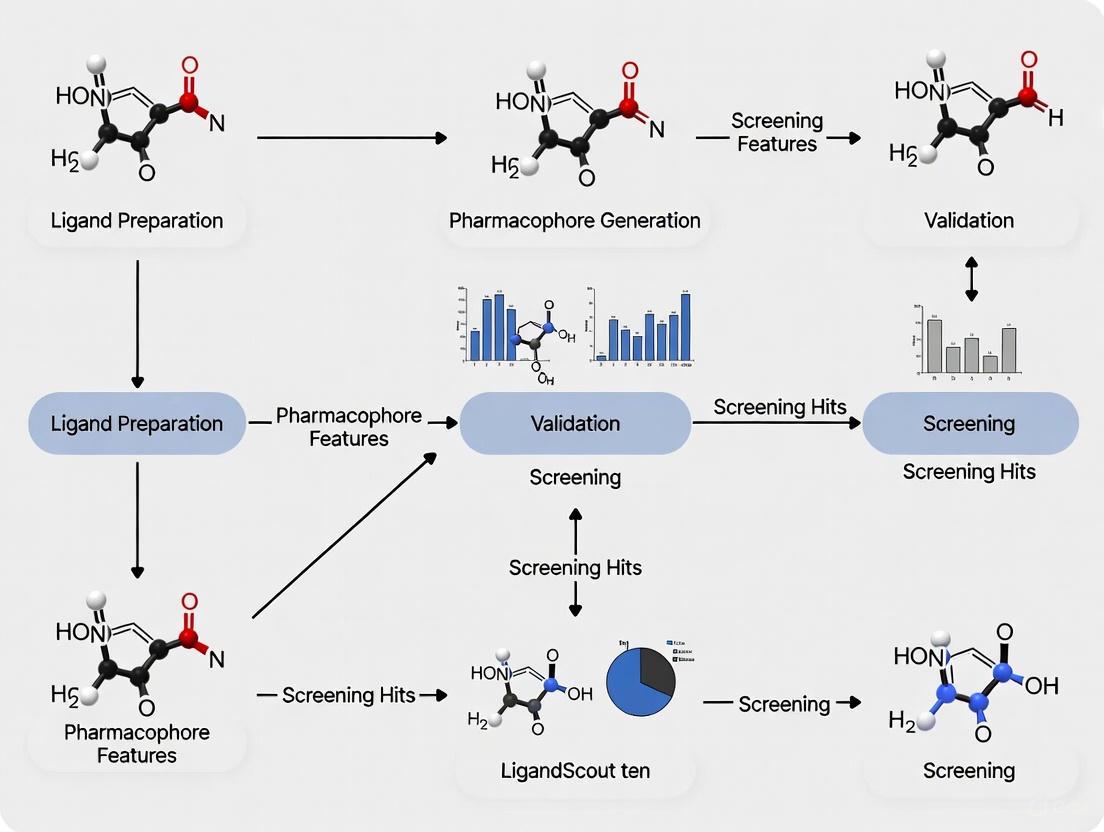
A Step-by-Step LigandScout Workflow: From Model Generation to Virtual Screening
The initial phase of constructing a robust ligand-based pharmacophore model is the meticulous preparation of a training set and the subsequent conformational analysis of its constituent molecules. This foundational step determines the model's ability to accurately capture the essential three-dimensional chemical features required for biological activity. The training set comprises known active compounds against the target of interest, and the quality of their selection directly influences the pharmacophore hypothesis generated. Following selection, conformational analysis explores the flexible space of each molecule to ensure that bioactive conformations are represented, enabling the identification of common features across structurally diverse ligands. This protocol details the best practices for executing these critical first steps within the context of a comprehensive ligand-based pharmacophore modeling workflow, leveraging the capabilities of the LigandScout software platform.
Training Set Preparation
Criteria for Training Set Selection
The selection of an appropriate training set is paramount for developing a predictive pharmacophore model. The compounds should be chosen based on several key criteria to ensure the model captures a wide yet relevant chemical space.
- Structural Diversity: The training set should encompass a broad range of core scaffolds or chemotypes. This diversity ensures the resulting model identifies fundamental interaction features critical for binding, rather than features specific to a single chemical class. For instance, a study on TGR5 agonists explicitly selected nine representative agonists with diverse scaffolds to form the training set for common feature pharmacophore generation [30].
- Potency: Compounds should ideally exhibit a range of high to moderate activity (e.g., IC50 or Ki values) to aid in the development of quantitative models or to prioritize features from highly active compounds. In practice, many studies curate training sets from compounds with proven, potent activity. For example, a model for carbonic anhydrase IX inhibitors was built using seven chemically active compounds with IC50 values of less than 50 nM [31].
- Consistent Bioassay Data: All selected compounds should have been evaluated in the same or highly comparable biological assays to ensure consistency in the activity data [30].
The size of the training set can vary but typically ranges from a handful to several dozen compounds. A model for topoisomerase I inhibitors used 29 CPT derivatives as a training set [32], whereas a model for 17β-HSD2 inhibitors was built using common features from only two training compounds that were selected for their structural diversity and potency [7].
Data Curation and Preparation
Before model generation, the 2D structures of the training set compounds must be curated and prepared.
- Structure Representation: Collect and draw the 2D structures of all selected compounds in a molecular editing environment.
- Standardization: Standardize the structures by adjusting protonation states to a relevant physiological pH (e.g., 7.4), removing counterions, and adding explicit hydrogens.
- Energy Minimization: Perform a preliminary energy minimization on the 2D structures using a suitable force field (e.g., MMFF94) to correct any unrealistic bond lengths or angles. This step produces clean, consistent 3D structures as a starting point for subsequent conformational analysis.
Table 1.1: Summary of Training Set Selection from Various Studies
| Target Protein | Training Set Size | Key Selection Criteria | Reference |
|---|---|---|---|
| Topoisomerase I | 29 compounds | Diverse derivatives of Camptothecin | [32] |
| hCA IX | 7 compounds | Potent inhibitors with IC50 < 50 nM | [31] |
| TGR5 | 9 compounds | Diverse scaffolds and high potency | [30] |
| 17β-HSD2 | 2 compounds | Structural diversity and high potency | [7] |
| FAK1 | 20 antagonists | Known active compounds from ChEMBL | [33] |
Conformational Analysis
The goal of conformational analysis is to generate a representative ensemble of low-energy 3D conformations for each molecule in the training set. This is critical because the pharmacophore model is derived from the 3D orientation of chemical features, and the bioactive conformation of a flexible ligand is often unknown.
Protocol for Conformational Generation
The following protocol can be applied within LigandScout or other molecular modeling suites to perform a comprehensive conformational analysis.
- Input Prepared Structures: Import the curated and energy-minimized 3D structures of the training set compounds into the software.
- Set Conformational Generation Parameters:
- Method: Use the "best conformer generation" method or a similar stochastic search algorithm [30].
- Energy Threshold: Set an energy threshold above the global minimum, typically 10 kcal/mol, to include relevant low-energy conformations while excluding high-energy, unrealistic ones [30] [34].
- Maximum Conformations: Define an upper limit for the number of conformations generated per molecule to manage computational cost. A common setting is 200 conformations per compound [30]. For more complex, flexible molecules, this number may be increased.
- Execute Conformational Analysis: Run the conformational generation algorithm. The software will systematically explore rotatable bonds and generate a set of conformers that fall within the specified energy window.
- Output: The result is a multi-conformer database for the entire training set, where each compound is represented by an ensemble of 3D structures.
This ensemble is the direct input for the common feature pharmacophore generation algorithm in the next step of the workflow. The algorithm will analyze these multiple conformations of multiple active compounds to find the best spatial arrangement of common chemical features.
Table 1.2: Key Parameters for Conformational Analysis
| Parameter | Recommended Setting | Function | Reference |
|---|---|---|---|
| Generation Method | Best/Stochastic Search | Explores rotatable bonds to sample conformational space. | [30] |
| Energy Threshold | 10 kcal/mol | Filters out high-energy, unrealistic conformers. | [30] [34] |
| Maximum Conformations | 200 | Balances computational cost with conformational coverage. | [30] |
| Force Field | MMFF94 | Used for energy calculation and minimization during generation. | Implied in data preparation |
The Scientist's Toolkit: Research Reagent Solutions
Table 1.3: Essential Materials and Reagents for Training Set Preparation and Analysis
| Item | Function/Description | Example Use in Protocol | |
|---|---|---|---|
| Chemical Databases (e.g., ChEMBL, PubChem) | Source of known active compounds and associated bioactivity data (IC50, Ki). | Curating a training set of potent, diverse inhibitors for a new target. | [33] |
| Molecular Editing Software (e.g., ChemDraw) | Creation, visualization, and 2D representation of chemical structures. | Drawing and initially cleaning the structures of selected training set compounds. | - |
| LigandScout Software | Integrated platform for structure and ligand-based drug design. | Performing conformational analysis and subsequent pharmacophore model generation. | [6] [33] |
| High-Performance Computing (HPC) Cluster | Provides computational power for demanding conformational searches on large training sets. | Generating 200 conformers for each of 50 compounds in the training set. | - |
Workflow Diagram
The following diagram visualizes the sequential protocol for training set preparation and conformational analysis.
Within a comprehensive ligand-based pharmacophore modeling workflow, the generation of the pharmacophore model and the creation of a robust hypothesis represent a critical inflection point. This step transforms structural data of known active compounds into an abstract, three-dimensional query that encapsulates the essential steric and electronic features required for biological activity. Using LigandScout software, this process leverages advanced algorithms to detect common chemical features from a set of pre-aligned ligands, creating a model that can discriminate between active and inactive compounds for virtual screening campaigns [29] [35]. The precision of this phase directly influences the success of subsequent virtual screening and lead optimization efforts.
Theoretical Foundation
A pharmacophore is formally defined as "the ensemble of steric and electronic features that is necessary to ensure the optimal supramolecular interactions with a specific biological target structure and to trigger (or to block) its biological response" [35]. In practical terms, it represents the key molecular interactions a ligand must form with its target, divorced from the underlying chemical scaffold.
Ligand-based pharmacophore modeling operates on the principle that compounds sharing similar biological activities will interact with the target through a common set of molecular features. The modeling process in LigandScout identifies these conserved features—including hydrogen bond acceptors (HBA), hydrogen bond donors (HBD), hydrophobic regions (H), and aromatic rings (AR)—and their precise three-dimensional arrangement [36] [35]. This approach is particularly valuable when the 3D structure of the target protein is unavailable, as it relies solely on the structural and chemical properties of known active ligands.
Experimental Protocol
Preparation of Training and Test Sets
The initial phase requires careful curation of compound data to ensure model reliability:
- Data Collection and Curation: Gather structures of known active compounds, ideally with associated IC₅₀ or Ki values. Inactive compounds should also be collected to assess model selectivity [34]. For the 17β-HSD2 inhibitor study, researchers categorized compounds as active or inactive based on specific IC₅₀ thresholds [7].
- Training/Test Set Division: Split the data so that 75% of active compounds and 75% of inactive compounds form the training set. The remaining 25% of each category is reserved as an independent test set for model validation [29].
- Conformational Sampling: Generate multiple 3D conformers for each compound using LigandScout's ICON algorithm to explore conformational space and represent potential bioactive conformations [29]. The maximum number of conformations can be adjusted based on ligand flexibility.
Ligand Clustering and Alignment
- Cluster Analysis: Use LigandScout's i-cluster tool with default parameters (cluster distance = 0.4 with average method) to group training set actives based on structural similarity [29]. This ensures diverse chemical scaffolds are represented in model generation.
- Molecular Alignment: LigandScout employs flexible alignment algorithms to superimpose compounds from the same cluster, identifying the optimal spatial overlap of key functional groups [36].
Pharmacophore Hypothesis Generation
- Feature Identification: For each cluster, LigandScout automatically identifies and maps common pharmacophoric features across the aligned conformations [29] [35]. The algorithm ranks molecular alignments using multiple scoring functions and creates intermediate pharmacophores for each compound.
- Model Building: The software processes molecules iteratively, aligning common features to all conformations of subsequent molecules until all compounds in the cluster are processed, resulting in a final pharmacophore hypothesis [29].
Model Optimization and Validation
- Iterative Refinement: Screen the generated pharmacophore against the training set with "Max. number of omitted features" set to 0. If the positive predictive value (PPV) is high but recall is low, perform additional screenings with the parameter set to 1 to identify non-essential features that can be set as optional [29].
- Feature Adjustment: Manually review and adjust feature tolerances, exclusion volumes, and optional features based on screening performance. The goal is to retain only features critical for biological activity while maximizing the retrieval of active compounds [7] [29].
- Validation: Assess model performance using the independent test set. Calculate statistical metrics including sensitivity, specificity, precision, and F1 score to quantify predictive power [36]. For the 17β-HSD2 inhibitors, researchers achieved high sensitivity (0.87) while retrieving no inactive compounds from the test set [7].
The following diagram illustrates the complete workflow for pharmacophore generation and hypothesis creation in LigandScout:
Data Presentation and Analysis
Table 1: Common Pharmacophore Features in LigandScout and Their Chemical Significance
| Feature Type | Chemical Group | Role in Molecular Recognition | Geometric Tolerance (Å) |
|---|---|---|---|
| Hydrogen Bond Acceptor (HBA) | Carbonyl oxygen, Nitro groups, Sulfoxide | Forms hydrogen bonds with donor groups on protein | 1.0 - 1.5 |
| Hydrogen Bond Donor (HBD) | Amine groups, Hydroxyl groups, Amides | Forms hydrogen bonds with acceptor groups on protein | 1.0 - 1.5 |
| Hydrophobic (H) | Alkyl chains, Aromatic rings, Steroid skeletons | Participates in van der Waals interactions with hydrophobic protein pockets | 1.2 - 1.8 |
| Aromatic Ring (AR) | Phenyl, Pyridine, Other heterocyclic rings | Enables π-π stacking and cation-π interactions | 1.5 - 2.0 |
| Negative Ionizable (NI) | Carboxylic acids, Tetrazoles, Phosphates | Forms salt bridges with positively charged residues | 1.5 - 2.0 |
| Positive Ionizable (PI) | Primary amines, Guanidines, Amidines | Forms salt bridges with negatively charged residues | 1.5 - 2.0 |
Table 2: Performance Metrics from Validated Pharmacophore Models in Published Studies
| Study Target | Sensitivity | Specificity | Enrichment Factor | Reference |
|---|---|---|---|---|
| 17β-HSD2 Inhibitors [7] | 0.87 | 1.00 | >20 | PMC4111740 |
| EGFR Inhibitors [6] | 0.75 | 0.82 | 15.3 | IJMS21207779 |
| A2a Antagonists [34] | 0.81 | 0.79 | 12.7 | MOLECULES23123094 |
| CYP450 3A4 Inhibitors [34] | 0.76 | 0.85 | 14.2 | MOLECULES23123094 |
The Scientist's Toolkit
Table 3: Essential Research Reagents and Computational Tools for Pharmacophore Modeling
| Tool/Resource | Function in Workflow | Implementation in LigandScout |
|---|---|---|
| Active Compound Set | Provides structural basis for feature identification | Curated from databases (ChEMBL, PubChem) with activity data [34] |
| Inactive Compound Set | Enables specificity assessment and model validation | Collected from same sources as actives but with no measurable activity [29] |
| ICON Algorithm | Generates representative 3D conformations | Default conformer generator in LigandScout [29] |
| i-cluster Tool | Groups compounds by structural similarity | Implements hierarchical clustering with adjustable distance metrics [29] |
| Pharmacophore Feature Definitions | Standardizes chemical feature recognition | Based on SMARTS patterns and molecular interaction capabilities [34] |
| Exclusion Volumes | Represents steric constraints of binding site | Automatically generated from protein structure or manually added [7] |
Troubleshooting and Technical Considerations
Addressing Common Challenges
Handling Conformational Flexibility: When dealing with flexible ligands, increase the maximum number of conformations generated during the conformational analysis stage. This ensures adequate sampling of the conformational space and increases the probability of identifying the bioactive conformation [29] [36].
Balancing Specificity and Sensitivity: If the model retrieves too many false positives (low specificity), increase feature constraints and reduce optional features. Conversely, if the model misses known actives (low sensitivity), consider setting less critical features as optional or increasing distance tolerances [7] [36].
Managing Structural Diversity: When working with structurally diverse ligands that may bind through different interaction patterns, generate multiple pharmacophore hypotheses—one for each distinct cluster of compounds [29]. This multi-model approach can capture complementary aspects of ligand-target interactions.
Advanced Optimization Techniques
Feature Weighting: Assign higher weights to features that consistently appear across active compounds but are absent in inactives. This enhances model discrimination power during virtual screening [7].
Exclusion Volume Placement: Strategically place exclusion volume spheres to represent protein atoms that would cause steric clashes, improving the model's ability to reject false positives [7]. In the 17β-HSD2 study, models incorporated 54-56 exclusion volumes to define binding site boundaries [7].
Multi-Conformer Models: For highly flexible binding sites, consider developing multiple pharmacophore models representing different receptor conformations to account for protein flexibility and induced-fit effects [36].
Core Components of a Pharmacophore Model
A pharmacophore model is an abstract representation of the steric and electronic features essential for a molecule to interact with a biological target and trigger or block its biological response [37]. In ligand-based modeling, this 3D arrangement is derived from the common chemical features shared by a set of known active molecules [7] [37]. Interpreting these models correctly is crucial for their successful application in virtual screening and drug design. The primary components can be categorized into three main groups: chemical features, spatial constraints, and exclusion volumes.
Table 1: Core Pharmacophore Features and Their Functional Significance
| Feature Type | Chemical Groups Represented | Role in Molecular Recognition |
|---|---|---|
| Hydrogen Bond Acceptor (HBA) | Carbonyl oxygen, nitrogen in aromatics, ether oxygen [37] | Forms hydrogen bonds with donor groups on the protein target (e.g., backbone NH) [8] [37] |
| Hydrogen Bond Donor (HBD) | Amine group, hydroxyl group, amide NH [37] | Forms hydrogen bonds with acceptor groups on the protein target (e.g., backbone C=O) [8] [37] |
| Hydrophobic (H) | Alkyl chains, aliphatic or aromatic rings [37] | Engages in van der Waals interactions with hydrophobic pockets on the protein surface [7] [37] |
| Aromatic Ring (AR) | Phenyl, pyridine, other aromatic systems [8] | Facilitates π-π stacking or cation-π interactions with protein residues [7] |
| Negative Ionizable (NI) | Carboxylic acid, tetrazole, sulfonamide [16] | Participates in ionic or charged interactions with positively charged residues (e.g., Lys, Arg) [16] |
| Positive Ionizable (PI) | Primary amine, guanidine, pyridine [38] | Participates in ionic or charged interactions with negatively charged residues (e.g., Asp, Glu) [38] |
Spatial constraints are defined by the location and tolerances (radii) of the pharmacophore features in three-dimensional space [7]. A compound is considered a "hit" only if it can adopt a conformation that positions its corresponding chemical functionalities within the allowed tolerance radii of all essential model features [38].
Exclusion volumes (XVols) are steric constraints that represent regions in space occupied by the protein's binding pocket wallscitation:6]. Any molecule that maps the chemical features but has atoms that sterically clash with these defined volumes is predicted to be inactive, as it would experience unfavorable van der Waals repulsionscitation:1] [37].
Experimental Protocol for Model Interpretation and Validation
This protocol details the steps for interpreting a generated ligand-based pharmacophore model, assessing its quality, and preparing it for virtual screening using LigandScout and related tools.
Visual Inspection and Feature Analysis
Objective: To qualitatively verify the chemical logic and spatial arrangement of the pharmacophore model. Procedure:
- Load the Model: Open the generated pharmacophore model (e.g., a shared features pharmacophore, SFP) in LigandScout [16].
- Align with Training Set: Superimpose the model with the aligned conformers of the training set compounds used to generate it [37]. Visually confirm that the model's features correspond to the common functional groups present in the training molecules.
- Analyze Feature-Function Relationship: For each feature, identify its potential role in target binding. For instance, in a model for fluoroquinolone antibiotics, the presence of HBAs and HBDs is critical for interacting with the DNA gyrase enzyme [8].
- Review Exclusion Volumes: Examine the placement of exclusion volumes. These should logically represent the boundaries of the binding pocket as inferred from the training ligands [37].
Theoretical Validation using a Test Set
Objective: To quantitatively assess the model's ability to distinguish known active compounds from inactive ones [37]. Procedure:
- Curate a Test Set: Compile a dataset containing:
- Actives: A set of known active compounds not used in the training set. These should be experimentally confirmed (e.g., via enzyme activity assays) and structurally diverse [37].
- Inactives/Decoys: A larger set of confirmed inactive compounds or computer-generated decoys with similar 1D properties (e.g., molecular weight, logP) but different 2D topologies [37]. Tools like the Directory of Useful Decoys, Enhanced (DUD-E) can be used for this purpose [37]. A recommended active-to-decoy ratio is 1:50 [37].
- Perform Virtual Screening: Screen the test set against the pharmacophore model in LigandScout.
- Calculate Quality Metrics: Analyze the hit list to compute standard validation metrics [37]:
- Sensitivity: The proportion of known active compounds correctly retrieved by the model.
- Specificity: The proportion of inactive compounds correctly excluded by the model.
- Enrichment Factor (EF): The enrichment of active molecules in the hit list compared to a random selection.
- Goodness of Hit (GH) Score: A composite metric that balances the recall of actives and the rejection of inactives. A GH score of 0.7-1.0 is generally considered excellent [16].
- Area Under the Curve of the Receiver Operating Characteristic (ROC-AUC): A measure of the overall classification performance.
Table 2: Key Quality Metrics for Pharmacophore Model Validation
| Metric | Formula/Description | Interpretation |
|---|---|---|
| Sensitivity | True Positives / (True Positives + False Negatives) | Ability to identify active molecules. Closer to 1 (or 100%) is better [7]. |
| Specificity | True Negatives / (True Negatives + False Positives) | Ability to exclude inactive molecules. Closer to 1 (or 100%) is better [7]. |
| Enrichment Factor (EF) | (Hitssactive / Ntotal) / (Nactive / Ntotal) | Measures how much the model enriches actives in the hit list versus random screening. Higher is better [37]. |
| Goodness of Hit (GH) | Combines recall of actives and the false positive rate into a single score (0 to 1). | A score above 0.7 indicates a high-quality model with strong predictive power [16]. |
Model Refinement and Optimization
Objective: To improve model performance based on validation results. Procedure:
- Analyze False Positives/Negatives: Examine compounds that were incorrectly classified. If false positives (inactives that are hits) share certain features, consider adding an exclusion volume in that region or making an overrepresented feature optional [7].
- Adjust Feature Definitions: Modify the tolerance radii of features or redefine the specific chemical groups they represent to better reflect the structure-activity relationships (SAR) of the training set [37].
- Set Features as Optional: If a feature is not present in all highly active training compounds, it can be set as "optional." The model will then match compounds that map either all mandatory features or all mandatories plus a user-defined number of the optional ones [7].
The Scientist's Toolkit: Research Reagent Solutions
Table 3: Essential Software and Databases for Pharmacophore Modeling
| Tool / Resource | Type | Primary Function in Model Interpretation/Validation |
|---|---|---|
| LigandScout [37] [16] | Software | Primary tool for advanced pharmacophore model generation, visualization, and screening. Used for creating shared-feature models and performing virtual screening [16]. |
| Pharmit / ZINCPharmer [19] [16] | Online Server | Facilitates rapid pharmacophore-based screening of ultra-large chemical libraries like ZINC, which contains millions of commercially available compounds [16]. |
| ChEMBL [37] | Database | Public repository of bioactive molecules with curated bioactivity data. Essential for sourcing known active and inactive compounds to build test sets for validation [37]. |
| DUD-E [37] | Web Server | Directory of Useful Decoys, Enhanced. Generates property-matched decoy molecules for a given list of active compounds, which is critical for rigorous theoretical validation [37]. |
| Protein Data Bank (PDB) [37] | Database | Repository of experimentally determined 3D structures of proteins and protein-ligand complexes. Can provide context for model interpretation when structural data is available [37]. |
| ConPhar [19] | Open-Source Tool | Useful for generating consensus pharmacophore models from multiple ligand-bound complexes, helping to reduce model bias [19]. |
Virtual screening of compound databases using a validated pharmacophore model is a critical step in ligand-based drug discovery. This process involves scanning large collections of 3D compound structures to identify molecules that match the spatial and chemical constraints defined in your pharmacophore query. In the context of a LigandScout-driven workflow, this step efficiently prioritizes candidate compounds for experimental testing by identifying those that possess the essential features required for biological activity [39] [40]. This protocol details the configuration and execution of virtual screening within LigandScout, ensuring optimal retrieval of potential hits.
The virtual screening process maps directly onto the broader ligand-based pharmacophore modeling workflow, as illustrated below.
Materials and Reagents
Research Reagent Solutions
Table 1: Essential computational tools and resources for virtual screening.
| Item | Function/Description | Example Sources/Software |
|---|---|---|
| Pharmacophore Model | The validated 3D query containing essential steric and electronic features (e.g., HBD, HBA, hydrophobic areas) [40]. | Generated in LigandScout from a set of active ligands. |
| Screening Database | A library of 3D small molecule structures in a suitable format for screening. | ZINC database, ChEMBL, Enamine REAL, in-house corporate collections [39] [8] [41]. |
| Conformer Generation Tool | Software that generates multiple 3D shapes (conformers) for each 2D molecular structure to account for flexibility during screening. | CONFORGE algorithm [39], tools within BIOVIA Discovery Studio [42]. |
| Virtual Screening Software | The core platform used to perform the screening, matching database compounds against the pharmacophore query. | LigandScout XT software [39]. |
| Computing Infrastructure | Adequate hardware (CPU cores, RAM) and storage to handle large-scale database screening efficiently. | High-performance computing (HPC) cluster or powerful workstation. |
Experimental Protocol
Database Selection and Preparation
- Database Selection: Obtain a compound database for screening. Publicly available options like the ZINC database or commercial libraries like the Enamine REAL database are common starting points [39] [8]. The database file (e.g., in SDF or MOL2 format) should contain 3D structural information.
- Database Import and Conformer Generation:
- Import the database into LigandScout.
- If the database is provided in 2D structure format, you must generate multiple 3D conformers for each molecule to account for ligand flexibility. This ensures that the screening process can find a potential bioactive conformation that matches the pharmacophore.
- Use the integrated CONFORGE conformer generator or other algorithms available within your software to create a multi-conformer database. This step is crucial for the success of the virtual screening [39].
Configuring Screening Parameters in LigandScout
- Load Pharmacophore Query: Open your validated pharmacophore model within LigandScout.
- Set Up Screening Job:
- Select the virtual screening function and load the prepared multi-conformer database.
- Critical Parameter - Feature Matching: The software's algorithm (e.g., the Greedy 3-Point Search in LigandScout XT) will align database molecules to the pharmacophore query by matching chemical features [39]. Ensure that the screening parameters are set to require a molecule to match a user-defined minimum number of features in the query (e.g., 4 out of 5 features). This is especially important for large models derived from multiple fragments [39].
- Flexible Fitting: LigandScout employs algorithms that perform torsionally flexible alignment of the database molecules to the pharmacophore model, which is more accurate than rigid matching [39].
Executing the Virtual Screening
- Run Screening: Initiate the virtual screening process. This is computationally intensive, and performance is optimized in tools like LigandScout XT for ultra-large libraries, where file space and speed are considerations [39].
- Monitor Progress: The software will process the database and output a list of "hits" – compounds that fit the pharmacophore model within the defined constraints.
Analysis and Prioritization of Hits
- Review Hit List: Examine the resulting hit compounds. The software typically provides a "fit score" for each hit, indicating how well it matches the pharmacophore model [8].
- Visual Inspection: Manually inspect the top-ranking hits to verify the alignment with the pharmacophore features and ensure the proposed binding mode is chemically sensible.
- Apply Secondary Filters: Subject the hit list to further filtration to prioritize the most promising candidates:
- Drug-likeness: Apply filters like Lipinski's Rule of Five to remove compounds with poor predicted oral bioavailability [7] [43] [8].
- Structural Diversity: Select a diverse subset of hits to avoid chemical redundancy.
- Downstream Analysis: The final prioritized hits are typically carried forward for molecular docking studies and further experimental validation in cellular or biophysical assays [39] [41].
Configuration Parameters and Data Analysis
Key Virtual Screening Parameters
Table 2: Key parameters for configuring virtual screening in LigandScout.
| Parameter | Description | Recommended Setting / Note |
|---|---|---|
| Minimum Features Matched | The least number of pharmacophoric features a molecule must fit to be considered a hit. | Model-dependent; must be a meaningful subset of the total features to ensure selectivity [39]. |
| Search Algorithm | The method used for aligning database molecules to the pharmacophore. | Greedy 3-Point Search (LigandScout XT) is recommended for speed and accuracy with large databases [39]. |
| Conformational Sampling | The number of conformers generated per molecule in the database. | A sufficient number (e.g., 100-500) is critical to represent the molecule's flexible space adequately. |
| Exclusion Volumes | Spheres that represent forbidden space, mimicking steric clashes with the protein. | Include if the model is structure-based; may be omitted in pure ligand-based models [39] [7]. |
| Fit Score Threshold | A minimum score value used to filter results. | Compound fit scores are calculated based on the quality of the alignment to the pharmacophore [8]. |
Troubleshooting
- Low Number of Hits: This can result from an overly restrictive pharmacophore model, a database with insufficient chemical diversity, or inadequate conformational sampling. Consider relaxing the minimum feature match requirement (while maintaining a scientifically meaningful threshold) and review the model's validation metrics.
- Excessively High Number of Hits: This is often due to a pharmacophore model that is too permissive. Increase the minimum number of features that must be matched or add exclusion volumes to define the binding site's steric boundaries more precisely.
- Long Computation Time: For very large databases (millions of compounds), ensure you are using optimized software like LigandScout XT and adequate computing resources. Consider using a preliminary fast filter, such as a molecular shape-based search, to reduce the initial dataset size.
In the ligand-based pharmacophore modeling workflow using LigandScout, the virtual screening of compound databases generates a hit list of molecules predicted to be active. Analyzing this hit list is a critical step that bridges in silico predictions and experimental validation. The primary goal of this analysis is to prioritize compounds for subsequent in vitro testing by interpreting computational results, thus ensuring the most promising candidates are selected efficiently. The core of this prioritization process relies on interpreting the pharmacophore fit score, a quantitative measure of how well a compound's 3D conformation matches the spatial and chemical features of the pharmacophore model [44].
This fit score is calculated based on how well the chemical features of a compound align with the corresponding features in the pharmacophore model, taking into account the root-mean-square deviation (RMSD) between the pharmacophoric points of the model and the conformer of the query compound [44]. A higher fit score indicates a better match and, theoretically, a higher probability of biological activity. However, the fit score alone is not sufficient for robust compound selection. This protocol details a comprehensive methodology for analyzing hit lists, integrating fit value assessment with additional chemical and strategic filters to identify high-quality leads for experimental evaluation.
Key Concepts and Quantitative Metrics
The Pharmacophore Fit Score
The pharmacophore fit score is a numerical value representing the quality of the overlay between a compound from the database and the pharmacophore model. In LigandScout, this score is computed by considering both the number of features successfully matched and the RMSD between the model's points and the ligand's corresponding pharmacophoric points [44]. The scoring function is based on a pairwise comparison of inter-feature distances, providing a robust measure of geometric and chemical complementarity.
Performance Metrics for Model and Hit List Evaluation
When assessing the overall success of a virtual screening campaign and the quality of the resulting hit list, several key metrics are employed. These metrics not only evaluate the pharmacophore model itself but also help in refining the selection criteria for compounds.
Table 1: Key Performance Metrics for Virtual Screening Hit List Analysis
| Metric | Definition | Interpretation and Ideal Value |
|---|---|---|
| Sensitivity | The proportion of known active compounds correctly retrieved by the model from a test set [7]. | A value closer to 1.0 indicates a superior ability to identify true actives. |
| Specificity | The proportion of known inactive compounds correctly ignored by the model [7]. | A value closer to 1.0 indicates a superior ability to reject true inactives. |
| Enrichment Factor (EF) | The concentration of active compounds at a specific top fraction of the hit list compared to a random distribution [45] [46]. | A higher EF signifies better performance. It measures how much the model "enriches" the top of the list with true hits. |
| Hit Rate | The percentage of tested virtual hits that confirm activity in a biological assay [45]. | This is a prospective, experimental measure of the model's real-world predictive power. |
Experimental Protocol: A Stepwise Workflow for Hit List Analysis
The following protocol provides a detailed procedure for analyzing a hit list generated from a virtual screening campaign in LigandScout, focusing on prioritization for 17β-HSD2 inhibition studies as a case example [7].
Preliminary Hit List Processing
- Combine and Deduplicate Hits: If multiple pharmacophore models were used for screening (e.g., a parallel screening approach with several restrictive models [7]), begin by combining the individual hit lists. Remove duplicate compounds to create a unified, non-redundant list for further analysis.
- Apply Druglikeness Filters: Filter the combined hit list using a "rule-of-five" inspired filter (e.g., molecular weight ≤ 500, logP ≤ 5, hydrogen bond donors ≤ 5, hydrogen bond acceptors ≤ 10) to remove compounds with unfavorable physicochemical properties [7]. This step ensures that the resulting compounds have a higher likelihood of becoming developable drugs.
Prioritization Based on Fit Score and Chemical Properties
- Rank by Fit Score: Sort the druglike hit list in descending order based on the pharmacophore fit score. Compounds with the highest scores represent the best geometric and chemical matches to the model and should be given primary consideration.
- Cluster by Chemical Scaffold: To ensure chemical diversity in the selected candidates and to avoid over-representation of a single chemical series, perform a clustering analysis on the top-ranked compounds (e.g., the top 200-500). This groups compounds based on structural similarity.
- Select Representative Compounds: From each major cluster, select the one or two compounds with the highest pharmacophore fit scores. This strategy maximizes the chance of discovering multiple novel scaffolds with activity and provides a basis for future Structure-Activity Relationship (SAR) studies [7].
Visual Inspection and Final Selection
- Examine Feature Mapping: For the shortlisted compounds, visually inspect the alignment between each compound's conformation and the pharmacophore model within LigandScout. Confirm that key interactions (e.g., hydrogen bond donors, acceptors, hydrophobic features) are mapped in a chemically sensible manner.
- Assess Strain and Conformation: Evaluate the conformational energy of the aligned compound if possible. While LigandScout uses pre-generated conformers, a very high-energy conformation that perfectly fits the model might be less likely to occur in a biological setting.
- Final Candidate List: Based on the combined evidence from fit score, chemical diversity, druglikeness, and visual inspection, create a final list of candidates for in vitro testing. The number selected will depend on the available experimental capacity.
Figure 1: Workflow for analyzing and prioritizing virtual screening hits based on fit values and chemical properties. Green nodes represent filtering and ranking steps, yellow is the start, red is a critical manual check, and blue is the final output.
Case Study: Analysis of a 17β-HSD2 Inhibitor Hit List
A study aiming to discover novel 17β-HSD2 inhibitors for osteoporosis treatment provides a concrete example of this protocol in action [7].
- Virtual Screening: Three ligand-based pharmacophore models were used to screen the SPECS database (202,906 compounds). The parallel use of multiple models aimed to achieve a high overall sensitivity (87% of known actives retrieved) while maintaining high specificity (no inactive compounds retrieved) [7].
- Hit List Generation: The models returned 573, 825, and 318 hits, respectively. After combining and removing duplicates, a total of 1,531 unique hits were obtained (0.75% of the database). This list was subsequently filtered for druglike compounds, resulting in 1,381 substances [7].
- Selection for Testing: From this refined hit list, 29 compounds were selected for in vitro biological evaluation. The selection was based on a combination of high pharmacophore fit score and the application of a druglikeness filter [7].
- Experimental Outcome: Seven of the 29 tested compounds (24% hit rate) showed low micromolar IC₅₀ values against 17β-HSD2. The three most potent hits had IC₅₀ values of 240 nM, 1 μM, and 1.5 μM, validating the effectiveness of the pharmacophore-based screening and the hit list analysis strategy [7].
Table 2: Summary of Virtual Screening and Experimental Results from a 17β-HSD2 Inhibitor Study [7]
| Analysis Step | Parameter | Result |
|---|---|---|
| Virtual Screening | Database Size | 202,906 compounds |
| Initial Hits (Pre-Filter) | 1,531 compounds | |
| Database Coverage | 0.75% | |
| Hit List Filtering | Applied Filter | Druglikeness (Lipinski) |
| Post-Filter Hits | 1,381 compounds | |
| Compound Selection & Assay | Compounds Selected for Testing | 29 compounds |
| Experimentally Confirmed Actives | 7 compounds | |
| Prospective Hit Rate | ~24% | |
| Potency of Best Hit (IC₅₀) | 240 nM |
The Scientist's Toolkit: Essential Reagents and Software
Table 3: Key Research Reagent Solutions for Pharmacophore-Based Virtual Screening
| Item / Software | Function / Application | Context in the Workflow |
|---|---|---|
| LigandScout | Primary software for creating, validating, and running pharmacophore-based virtual screens; calculates pharmacophore fit scores [44]. | Used throughout the process: model generation, database screening, and visual analysis of hit compound mappings. |
| Compound Database | A commercial or in-house library of small molecules for virtual screening (e.g., SPECS, ZINC, CMNPD) [7] [47]. | The source of potential hits that are screened against the pharmacophore model. |
| Conformational Sampling Tool | Software that generates a representative set of 3D conformations for each compound in the database to account for flexibility [44]. | Essential pre-processing step to ensure that the bioactive conformation of a compound is available for screening. |
| DEKOIS / DUD-E Library | Benchmarking sets containing known active and decoy molecules for validating pharmacophore model performance [44] [46]. | Used to calculate initial enrichment factors, sensitivity, and specificity before screening the full database. |
| In Vitro Assay Kits | Biological reagents for testing the selected hit compounds (e.g., enzyme activity assay for 17β-HSD2) [7]. | The final, crucial step for the experimental confirmation of the virtual screening predictions. |
Dual inhibitors targeting the Epidermal Growth Factor Receptor (EGFR) and Vascular Endothelial Growth Factor Receptor 2 (VEGFR2) represent an innovative strategy in anticancer drug development. This approach simultaneously disrupts tumor cell proliferation and angiogenesis, addressing two critical pathways in cancer progression [48]. The ligand-based pharmacophore modeling workflow provides an efficient method for identifying novel chemical entities with dual inhibitory activity, especially when structural information of the targets is limited or when targeting multiple receptors simultaneously. This case study demonstrates the application of this computational strategy within a broader thesis research framework, utilizing LigandScout software to develop predictive models that can accelerate the discovery of dual-targeting anticancer agents.
The therapeutic rationale for dual EGFR/VEGFR2 inhibition stems from the recognized cross-talk between these signaling pathways in numerous cancers. Preclinical studies have established that upregulated EGFR signaling increases VEGF expression through hypoxia-independent mechanisms, while elevated VEGF levels contribute to resistance against EGFR tyrosine kinase inhibitors [48]. Clinical validation comes from trials where combining anti-VEGF therapy with EGFR inhibitors significantly improved outcomes in EGFR-mutant NSCLC patients [48]. This synergistic relationship makes concurrent inhibition a promising therapeutic strategy worthy of exploration through computational methods.
Therapeutic Rationale and Target Biology
EGFR and VEGFR2 Signaling Pathways
EGFR (Epidermal Growth Factor Receptor) is a receptor tyrosine kinase that regulates critical cellular processes including motility, adhesion, cell cycle progression, angiogenesis, apoptosis, and metastasis [49]. It represents one of the most frequently altered oncogenes in solid tumors, including breast, colorectal, and non-small cell lung cancers [49]. Upon activation by ligand binding, EGFR undergoes dimerization and autophosphorylation, initiating downstream signaling through multiple pathways including RAS/RAF/MEK/ERK and PI3K/AKT, ultimately driving tumor cell proliferation and survival.
VEGFR2 (Vascular Endothelial Growth Factor Receptor 2) serves as the principal mediator of angiogenesis—the formation of new blood vessels that supply tumors with oxygen and nutrients [50] [51]. VEGF binding induces VEGFR2 dimerization and autophosphorylation at specific tyrosine residues (Tyr801, Tyr951, Tyr1175, and Tyr1214), activating downstream signaling cascades including PLCγ-PKC, TSAd-Src-PI3K-Akt, and SHB-FAK-paxillin pathways [52]. These signals promote endothelial cell proliferation, migration, survival, and the formation of new vessel networks essential for tumor growth and metastasis.
Table 1: Key Characteristics of EGFR and VEGFR2
| Parameter | EGFR | VEGFR2 |
|---|---|---|
| Primary Function | Regulation of cell proliferation, differentiation, survival | Angiogenesis, endothelial cell functions |
| Key Ligands | EGF, TGF-α, amphiregulin | VEGF-A, VEGF-C, VEGF-D |
| Cellular Expression | Epithelial cells, various cancer cells | Vascular endothelial cells, lymphatic endothelial cells |
| Downstream Pathways | RAS/RAF/MEK/ERK, PI3K/AKT, JAK/STAT | PLCγ-PKC, PI3K-Akt, FAK-paxillin |
| Cancer Association | NSCLC, breast, colorectal, head and neck cancers | Breast cancer, renal cancer, hepatocellular carcinoma |
Rationale for Dual Inhibition Strategy
The molecular pathways governing cancer cell proliferation and tumor angiogenesis exhibit significant interconnection and complexity. Many cancers, including breast and liver cancers, demonstrate simultaneous upregulation of multiple protein kinases that collectively contribute to carcinogenesis [49]. Dual-target inhibitors offer distinct advantages over combination therapies, including reduced risk of drug-drug interactions, more predictable pharmacokinetic profiles, simplified treatment regimens, and potentially lower risk of resistance development [51]. The benzothiazole-based derivatives reported in recent studies exemplify this approach, where compounds demonstrated promising dual VEGFR-2/EGFR inhibitory activity alongside cytotoxic effects against MCF-7 and HepG-2 cancer cell lines [49].
Ligand-Based Pharmacophore Modeling Workflow
Theoretical Foundations
The term "pharmacophore" was formally defined by IUPAC as "the ensemble of steric and electronic features that is necessary to ensure the optimal supramolecular interactions with a specific biological target structure and to trigger (or to block) its biological response" [35]. Ligand-based pharmacophore modeling deduces these critical features from the structural commonalities among known active ligands, making it particularly valuable when 3D structural information of the target protein is unavailable [40].
This approach identifies key chemical features including hydrogen bond acceptors (HBA), hydrogen bond donors (HBD), hydrophobic groups (H), aromatic rings (AR), and positively or negatively ionizable groups that are essential for molecular recognition and binding [40]. The spatial arrangement of these features constitutes the pharmacophore model that can be utilized for virtual screening of compound databases.
Experimental Protocol
Step 1: Compound Selection and Preparation
The first step involves curating a set of known dual EGFR/VEGFR2 inhibitors with documented biological activities. For instance, pyrazoline derivatives reported by Alkamaly et al.. 2021 showed significant dual inhibitory activity with IC~50~ values of 0.21-0.23 μM against both EGFR and VEGFR2 [53]. Similarly, benzothiazole-based compounds demonstrated potent activity with IC~50~ values of 0.15-0.19 μM against VEGFR2 and 0.11-0.16 μM against EGFR [49].
Protocol Details:
- Select 20-30 compounds with measured IC~50~ values against both targets
- Ensure structural diversity covering multiple chemotypes (e.g., pyrazolines, benzothiazoles)
- Divide compounds into training set (70-80%) and test set (20-30%)
- Generate 3D structures using chemical sketching tools (ChemDraw)
- Optimize geometries using molecular mechanics force fields (CHARMM or MMFF)
- Generate multiple conformers for each compound to account for flexibility
Step 2: Pharmacophore Feature Extraction
Using LigandScout software, identify common pharmacophoric features from aligned active compounds:
Protocol Details:
- Load pre-aligned ligand structures into LigandScout
- Automatically detect pharmacophore features including HBA, HBD, hydrophobic areas, and aromatic rings
- Manually refine features based on biochemical knowledge of ATP-binding pockets
- Define exclusion volumes to represent steric constraints of the binding site
- Generate multiple hypothesis models with varying feature combinations
Step 3: Model Validation and Selection
Validate pharmacophore models using test set compounds and decoy molecules:
Protocol Details:
- Screen test set of known actives and inactives against each model
- Calculate statistical parameters: sensitivity, specificity, enrichment factors
- Select models with best balance between sensitivity (ability to find actives) and specificity (ability to exclude inactives)
- Apply Guner-Henry scoring method to evaluate model quality
- Cross-validate using leave-one-out or group-based approaches
Step 4: Virtual Screening
Utilize validated pharmacophore models for database screening:
Protocol Details:
- Prepare screening database (e.g., ZINC, SPECS) with drug-like compounds
- Apply Lipinski's Rule of Five and other ADMET filters
- Perform pharmacophore-based screening using LigandScout or similar platforms
- Retrieve top matching compounds for further analysis
- Apply SMART filtration to remove compounds with undesirable functional groups
Step 5: Molecular Docking and Binding Mode Analysis
Protocol Details:
- Perform molecular docking of hit compounds into EGFR and VEGFR2 binding sites
- Analyze binding interactions and compare with known inhibitors
- Prioritize compounds with favorable binding energies and interaction patterns
- Assess selectivity by docking against related kinases (PDGFR, FGFR, HER2)
Step 6: Experimental Validation
Protocol Details:
- Synthesize or procure top-ranking virtual hit compounds
- Evaluate enzymatic activity against EGFR and VEGFR2 using kinase assays
- Determine IC~50~ values for potent inhibitors
- Assess cellular activity in cancer cell lines (e.g., MCF-7, HepG-2, PC-3)
- Evaluate cytotoxicity against normal cell lines (e.g., WI-38) to determine selectivity
- Investigate apoptosis induction through biomarkers (Bax, p53, caspase-3, Bcl-2)
Diagram 1: Ligand-based pharmacophore modeling workflow for dual EGFR/VEGFR2 inhibitors
Case Study Analysis: Successful Dual Inhibitors
Pyrazoline-Based Dual Inhibitors
In a seminal study, Alkamaly et al. (2021) designed and synthesized novel pyrazoline derivatives that demonstrated potent dual inhibitory activity against EGFR and VEGFR2 [53]. The most promising compounds (designated 4a, 4b, 5b, and 7c) exhibited broad-spectrum anticancer activities against prostate (PC-3), hepatocellular (HepG2), and breast (MDA-MB-231) carcinoma cells with IC~50~ values ranging from 1.30-7.18 μM, comparable or superior to doxorubicin (IC~50~ = 5.12-7.33 μM) [53].
Notably, compounds 5b and 7c emerged as particularly potent dual inhibitors with IC~50~ values of 0.21 and 0.23 μM against EGFR, and 0.22 and 0.21 μM against VEGFR2, respectively [53]. These compounds also induced apoptosis through upregulation of Bax, p53, and caspase-3, coupled with downregulation of Bcl-2 levels. Molecular docking analyses confirmed their binding interactions within the ATP-binding sites of both EGFR and VEGFR2, providing structural rationale for their dual inhibitory activity.
Benzothiazole-Based Dual Inhibitors
Another successful approach utilized the benzothiazole scaffold linked to various amino acids and their ethyl ester analogues [49]. The carboxylic acid derivatives (10-12) and their ester analogues (21-23) displayed exceptional anticancer activity with IC~50~ values of 0.73-0.89 μM against MCF-7 and 2.54-2.80 μM against HepG-2 cell lines, outperforming doxorubicin [49].
The ethyl ester derivatives (21-23) showed superior activity against resistant MDA-MB-231 cells (IC~50~ = 5.45-7.28 μM) compared to their carboxylic acid analogues, and demonstrated potent VEGFR2 inhibitory activity (IC~50~ = 0.15-0.19 μM) comparable to sorafenib [49]. Against EGFR, these compounds exhibited exceptional inhibitory activity (IC~50~ = 0.11-0.16 μM) surpassing the reference standard erlotinib (IC~50~ = 0.18 μM) [49].
Table 2: Experimentally Validated Dual EGFR/VEGFR2 Inhibitors
| Compound Class | Specific Compounds | EGFR IC~50~ (μM) | VEGFR2 IC~50~ (μM) | Cancer Cell Lines | Cellular IC~50~ Range (μM) |
|---|---|---|---|---|---|
| Pyrazoline derivatives | 5b, 7c | 0.21-0.23 | 0.21-0.22 | PC-3, HepG2, MDA-MB-231 | 1.30-7.18 |
| Benzothiazole-amino acid hybrids | 10-12, 21-23 | 0.11-0.16 | 0.15-0.19 | MCF-7, HepG-2, MDA-MB-231 | 0.73-11.02 |
| Reference standards | Erlotinib, Sorafenib | 0.18 (Erlotinib) | 0.12 (Sorafenib) | Various | Variable |
Structural Features for Dual Inhibition
Analysis of successful dual inhibitors reveals common pharmacophoric elements essential for simultaneous targeting of EGFR and VEGFR2:
- Flat heteroaromatic ring system that interacts with the hinge region of both kinases, typically forming hydrogen bonds with key cysteine residues in the ATP-binding pocket [51]
- Hydrogen bond acceptor/donor linker that forms critical interactions with gatekeeper residues (Glu885 and Asp1046 in VEGFR2) [49] [51]
- Hydrophobic moieties that occupy allosteric pockets adjacent to the ATP-binding site [49]
- Flexible regions that accommodate subtle differences between the ATP-binding sites of EGFR and VEGFR2
These structural insights directly inform the development of ligand-based pharmacophore models for identifying novel dual inhibitors.
Computational Protocols and Methodologies
Pharmacophore Model Development Protocol
Software Requirements:
- LigandScout (for pharmacophore modeling and visualization)
- Molecular Operating Environment (MOE) (alternative platform)
- RDKit (open-source cheminformatics toolkit)
- Database screening tools (Pharmer, Pharmit)
Detailed Stepwise Protocol:
Data Curation
- Collect known dual EGFR/VEGFR2 inhibitors from literature
- Record experimental IC~50~ values against both targets
- Ensure consistent biological assay conditions where possible
- Apply Lipinski's Rule of Five to ensure drug-like properties
Conformational Analysis
- Generate multiple conformers for each training compound
- Use energy window of 10-20 kcal/mol above global minimum
- Employ distance geometry or systematic search methods
- Retain diverse conformations representing potential binding states
Pharmacophore Generation
- Import aligned active compounds into LigandScout
- Automatically identify common chemical features
- Adjust feature tolerances based on molecular flexibility
- Define exclusion volumes based on receptor binding site geometry
Model Validation
- Screen database of known actives and inactives
- Calculate enrichment factors and hit rates
- Use receiver operating characteristic (ROC) curves
- Apply statistical measures: sensitivity, specificity, precision
Molecular Docking Protocol
Software Requirements:
- AutoDock Vina or similar docking software
- PyMOL or Chimera for visualization
- Protein Data Bank structures: 1M17 (EGFR), 3V2A (VEGFR2)
Detailed Stepwise Protocol:
Protein Preparation
- Obtain crystal structures of EGFR and VEGFR2 from PDB
- Remove water molecules and co-crystallized ligands
- Add hydrogen atoms and optimize protonation states
- Assign partial charges using appropriate force fields
Ligand Preparation
- Generate 3D structures of potential dual inhibitors
- Assign correct bond orders and formal charges
- Energy minimize using molecular mechanics force fields
Docking Simulations
- Define binding site around ATP-binding pocket
- Set appropriate grid dimensions and spacing
- Use Lamarckian genetic algorithm for conformational search
- Perform multiple docking runs for each compound
- Cluster results based on binding poses and interactions
Binding Analysis
- Analyze hydrogen bonding patterns with key residues
- Evaluate hydrophobic interactions with allosteric pockets
- Calculate binding energies and inhibition constants
- Compare with reference compounds (erlotinib, sorafenib)
Diagram 2: EGFR and VEGFR2 signaling pathways and dual inhibition strategy
Research Reagent Solutions
Table 3: Essential Research Reagents and Computational Tools
| Reagent/Tool | Function/Purpose | Specifications/Alternatives |
|---|---|---|
| LigandScout Software | Pharmacophore modeling, virtual screening, binding site analysis | Commercial package; Alternative: MOE, Phase (Schrödinger) |
| ZINC Database | Source of commercially available compounds for virtual screening | >230 million compounds; Filtered subsets available |
| Protein Data Bank Structures | Source of 3D protein structures for binding site analysis | EGFR: 1M17; VEGFR2: 3V2A, 4ASD |
| RDKit Cheminformatics Toolkit | Open-source platform for compound handling, descriptor calculation | Python-based; Includes pharmacophore features |
| Kinase Assay Kits | Experimental validation of EGFR and VEGFR2 inhibitory activity | Commercial kits from Cayman Chemical, MilliporeSigma |
| Cancer Cell Lines | Cellular validation of anticancer activity | MCF-7 (breast), HepG-2 (liver), PC-3 (prostate) |
| Normal Cell Lines | Assessment of selectivity and toxicity | WI-38 (lung fibroblast), other primary cells |
The application of ligand-based pharmacophore modeling represents a powerful strategy for identifying novel dual EGFR/VEGFR2 inhibitors, as demonstrated by the successful discovery of pyrazoline and benzothiazole-based compounds with potent dual inhibitory activity. This approach efficiently leverages existing structure-activity relationship data to guide the design and optimization of multi-targeted therapeutics.
Future directions in this field include the integration of machine learning algorithms with pharmacophore-based screening to enhance prediction accuracy, the exploration of covalent inhibition strategies for sustained target engagement, and the development of structural hybrid approaches that combine pharmacophore modeling with molecular dynamics simulations to account for protein flexibility. As the understanding of EGFR and VEGFR2 signaling networks evolves, particularly their role in therapeutic resistance, dual inhibitors identified through these computational approaches hold significant promise for advancing cancer therapy.
The continued refinement of ligand-based pharmacophore models, coupled with experimental validation, will undoubtedly yield increasingly sophisticated dual inhibitors with optimized efficacy, selectivity, and pharmacological properties. This case study demonstrates the practical application and considerable potential of this methodology within a comprehensive drug discovery pipeline.
Optimizing Pharmacophore Models: Overcoming Common Challenges and Pitfalls
Balancing Specificity and Sensitivity in Model Design
In ligand-based pharmacophore modeling, the dual objectives of sensitivity (the ability to correctly identify active compounds) and specificity (the ability to reject inactive compounds) present a fundamental challenge. Achieving an optimal balance between these parameters is critical for designing virtual screening campaigns that successfully identify novel bioactive compounds without generating unmanageably large numbers of false positives. This application note details a proven methodology for constructing and validating high-performance pharmacophore models using parallel restrictive models, with specific protocols developed for implementation in LigandScout software. The presented workflow enables researchers to systematically optimize model performance for effective virtual screening in drug discovery projects.
Theoretical Foundation and Key Concepts
Defining Sensitivity and Specificity in Pharmacophore Modeling
In the context of ligand-based pharmacophore modeling, performance parameters are defined as follows:
- Sensitivity: The proportion of known active compounds correctly identified by the pharmacophore model during screening.
- Specificity: The proportion of known inactive compounds correctly rejected by the pharmacophore model during screening.
- Exclusion Volumes (XVOLs): Steric constraints placed in the pharmacophore model that represent areas occupied by the target protein, preventing ligand atoms from occupying these spaces and improving model specificity.
The inverse relationship between sensitivity and specificity creates a critical design challenge. Increasing model restrictiveness to improve specificity (reduce false positives) typically decreases sensitivity (increases false negatives), while highly sensitive models that retrieve most active compounds often retrieve numerous inactive compounds as well [7].
The Parallel Restrictive Model Approach
The parallel restrictive model strategy addresses the sensitivity-specificity balance by employing multiple complementary pharmacophore models, each with high specificity. While individual models may identify only subsets of active compounds, their combined application enables comprehensive coverage of the chemical space occupied by active ligands while maintaining high specificity overall. This approach leverages the observation that different structural classes of active compounds may map to different feature arrangements within the same binding site [7].
Experimental Protocols
Protocol 1: Training Set Selection and Preparation
Objective: Curate a diverse set of known active and inactive compounds for pharmacophore model development and validation.
Materials and Reagents:
- Known active compounds against the target (minimum 15-20 structures recommended)
- Confirmed inactive compounds or property-matched decoys (2-3 times the number of actives)
- LigandScout software (or equivalent pharmacophore modeling platform)
- Molecular database management system
Procedure:
- Collect Active Compounds: Gather 3D structures of known active compounds from literature, patent databases, or experimental data. Prioritize structures with:
- Diverse chemical scaffolds
- Variation in substituent patterns
- Potency ranges covering at least two orders of magnitude
- Experimental confirmation of activity
Prepare Decoy Set: Compile confirmed inactive compounds or generate property-matched decoys using tools such as the Directory of Useful Decoys (DUD-E) to create a challenging validation set [54].
Divide Training/Test Sets: Split the active compounds into training (approximately 2/3) and test (approximately 1/3) sets, ensuring both sets contain structural diversity.
Generate Molecular Conformations: For each compound, generate multiple low-energy conformations using LigandScout's conformation generation module to account for ligand flexibility.
Protocol 2: Pharmacophore Model Generation in LigandScout
Objective: Develop multiple pharmacophore hypotheses from training set compounds.
Procedure:
- Load Training Compounds: Import the active training compounds into LigandScout.
Identify Common Features:
- Use the "Common Features Pharmacophore Generation" function in LigandScout
- Select pairs of structurally diverse, highly active training compounds as the basis for individual models [7]
Define Pharmacophore Features:
- Identify conserved chemical features: Hydrogen Bond Acceptors (HBA), Hydrogen Bond Donors (HBD), Hydrophobic areas (H), Aromatic Rings (AR), Positive/Negative Ionizable groups (PI/NI)
- Set appropriate tolerance radii for each feature (default: 1.0-1.5 Å)
Add Exclusion Volumes:
- Incorporate Exclusion Volumes (XVOLs) to represent protein steric constraints
- Position XVOLs based on molecular dynamics simulations or comparative modeling if protein structure is unavailable [7]
Generate Multiple Models: Create several pharmacophore hypotheses based on different training compound pairs to ensure complementary coverage of chemical space.
Protocol 3: Model Refinement and Optimization
Objective: Optimize individual pharmacophore models for maximum specificity while maintaining reasonable sensitivity.
Procedure:
- Initial Validation: Screen each preliminary model against the complete training set (actives and inactives).
Feature Adjustment:
- Remove non-essential features that prevent known active compounds from mapping
- Convert critical features to "optional" if some highly active compounds lack them
- Adjust tolerance radii to optimize matching
Exclusion Volume Optimization:
- Refine XVOL size and position to eliminate inactive compounds while retaining active compounds
- Typically requires 50-60 XVOLs for effective specificity [7]
Performance Assessment: Calculate sensitivity and specificity for each refined model:
- Sensitivity = (True Positives) / (True Positives + False Negatives)
- Specificity = (True Negatives) / (True Negatives + False Positives)
Model Selection: Retain models that achieve high specificity (>0.90) with complementary sensitivity profiles.
Protocol 4: Virtual Screening with Parallel Models
Objective: Implement a parallel screening strategy to identify novel active compounds.
Procedure:
- Database Preparation: Prepare the screening database (e.g., SPECS, ZINC, or corporate collection) by generating multiple conformations for each compound.
Parallel Screening: Screen the database against each optimized pharmacophore model independently.
Hit Selection:
- Compile compounds that match any of the pharmacophore models
- Apply additional drug-likeness filters (e.g., Lipinski's Rule of Five) [7]
- Prioritize compounds matching multiple models
Experimental Validation: Select top-ranked compounds for experimental testing to confirm activity.
Workflow Visualization
Figure 1: Workflow for Balanced Pharmacophore Model Design. This diagram illustrates the comprehensive process for developing parallel restrictive pharmacophore models that balance sensitivity and specificity, from initial compound preparation through virtual screening and experimental validation.
Performance Metrics and Data Analysis
Quantitative Performance Assessment
Table 1: Representative Performance Metrics from Parallel Restrictive Model Implementation [7]
| Model | Training Compounds | Features (Required/Optional) | Exclusion Volumes | Sensitivity | Specificity | Active Compounds Retrieved |
|---|---|---|---|---|---|---|
| Model 1 | 5, 6 | 5/1 (2H, 1HBD, 1AR, 2HBA) | 54 | 0.53 | 1.00 | 8/15 |
| Model 2 | 5, 7 | 5/1 (2H, 1HBD, 1AR, 2HBA) | - | 0.53 | 1.00 | 8/15 |
| Model 3 | 7, 8 | 6/1 (3H, 2AR, 2HBA) | 56 | 0.40 | 1.00 | 6/15 |
| Combined | All | Complementary Features | Varied | 0.87 | 1.00 | 13/15 |
Table 2: Virtual Screening Results Using Parallel Restrictive Models [7]
| Screening Parameter | Result | Notes |
|---|---|---|
| Database size screened | 202,906 compounds | SPECS database |
| Initial hits (3 models) | 1,716 compounds | 0.85% of database |
| Unique druglike hits | 1,381 compounds | After Lipinski filtering |
| Hits selected for testing | 29 compounds | Representative diversity |
| Confirmed active compounds | 7 compounds | 24% success rate |
| Most potent compound IC₅₀ | 240 nM | Compound 12 |
Advanced Validation Metrics
For comprehensive model validation, additional metrics should be calculated:
Enrichment Factor (EF):
Where Hitssampled is the number of active compounds in the selected subset, Nsampled is the size of the selected subset, Hitstotal is the total number of active compounds in the database, and Ntotal is the total number of compounds in the database [54].
Pharmacophore Fit Score: Quantifies how well a compound's features match the pharmacophore model, considering both feature matching and root-mean-square deviation (RMSD) between pharmacophoric points [44].
Research Reagent Solutions
Table 3: Essential Research Reagents and Computational Tools
| Reagent/Tool | Function | Application Notes |
|---|---|---|
| LigandScout | Pharmacophore model generation and screening | Primary software for implementing described protocols; enables common feature identification, exclusion volume placement, and virtual screening [7] [55] |
| Directory of Useful Decoys (DUD-E) | Source of property-matched decoy compounds | Provides challenging negative controls for model validation; decoys are matched to actives by molecular weight, logP, and other properties [54] |
| SPECS/ ZINC Compound Databases | Small molecule libraries for virtual screening | Commercial (SPECS) and free (ZINC) databases for screening; ZINCPharmer enables web-based pharmacophore screening [7] [8] |
| ELIXIR-A | Pharmacophore refinement and alignment | Python-based tool for comparing and refining multiple pharmacophore models; implements point cloud alignment algorithms [54] |
| Pharmit | Online pharmacophore screening | Web-based platform for interactive pharmacophore screening with support for multiple compound databases [54] |
Troubleshooting and Optimization Guidelines
Common Challenges and Solutions
Challenge: Models are too restrictive (low sensitivity) Solution: Convert critical features to "optional" and reduce exclusion volume sizes. Ensure training set represents diverse structural classes.
Challenge: Models retrieve too many false positives (low specificity) Solution: Increase exclusion volumes, add essential features, and reduce tolerance radii. Implement more restrictive drug-likeness filters.
Challenge: Inadequate coverage of known active chemotypes Solution: Implement additional pharmacophore models based on different training pairs that represent the missing structural classes.
Advanced Optimization Techniques
- Conformational Sampling: Increase the number of conformations generated per compound (100+ recommended for challenging targets) to improve screening accuracy [44].
- Feature Weighting: Assign higher weights to critical features that distinguish active from inactive compounds.
- Cascade Screening: Implement sequential screening with increasing restrictiveness to improve efficiency with large databases.
The parallel restrictive model approach provides a systematic methodology for balancing sensitivity and specificity in ligand-based pharmacophore modeling. By implementing multiple complementary models with high individual specificity, researchers can achieve comprehensive coverage of active chemical space while maintaining the high specificity necessary for efficient virtual screening. The protocols detailed in this application note, implemented through LigandScout and validated using rigorous performance metrics, enable the development of optimized pharmacophore screening workflows that successfully identify novel bioactive compounds with reduced false positive rates. This approach has demonstrated experimental validation, identifying potent inhibitors (IC₅₀ = 240 nM) with a high success rate (24% of tested compounds) in actual drug discovery applications [7].
Addressing Ligand Flexibility and Conformational Coverage
In ligand-based pharmacophore modeling, the accurate representation of a molecule's three-dimensional structure is paramount. A core challenge is that ligands are not static; they exist as ensembles of conformations in solution. The bioactive conformation—the specific 3D shape in which a ligand binds to its target—may not be its global energy minimum and is often unknown. Therefore, conformational coverage, or the ability of a computational protocol to generate a set of candidate conformations that includes this bioactive state, is a critical determinant of success in pharmacophore modeling and virtual screening [56]. Inadequate coverage can lead to models that fail to identify true active compounds, while excessive, unfocused sampling can introduce noise and reduce model precision. This application note, framed within a LigandScout-centric research workflow, details protocols and quantitative assessments for addressing ligand flexibility to achieve optimal conformational coverage, thereby enhancing the reliability of downstream pharmacophore modeling and virtual screening campaigns.
Quantitative Analysis of Conformational Sampling
The effectiveness of any conformational sampling protocol can be measured by its ability to reproduce known bioactive conformations from experimental structures. The following table summarizes key performance metrics and limitations identified from comparative studies.
Table 1: Performance Metrics and Limitations of Conformational Sampling
| Metric/Parameter | Reported Value/Outcome | Implication for Pharmacophore Modeling |
|---|---|---|
| Heavy Atom RMSD | Used to measure the deviation of generated conformers from the crystallographic bioactive conformation [56]. | A lower RMSD for the closest conformer indicates better sampling quality and a higher probability of capturing the true binding mode. |
| Sampling Breakdown Point | Performance of techniques begins to degrade for ligands with more than approximately eight rotatable bonds [56]. | For highly flexible leads, standard protocols may be insufficient, necessitating advanced sampling (see Section 4). |
| Impact of Minimization | Minimization of the X-ray structure does not always yield the closest match to the bioactive conformation [56]. | Highlights that energy criteria alone are not perfect proxies for identifying the bioactive conformation. |
| Conformer Energy Window | A wide energy window of 50 kcal/mol is recommended for conformer generation to ensure extended structures are sampled for highly flexible compounds [57]. | Prevents bias towards folded low-energy conformers that may not represent the bioactive state. |
| Number of Conformers | Generating up to 200 high-quality conformers per molecule is a practical default for creating screening libraries [58]. | Provides a balance between computational feasibility and achieving adequate coverage for most drug-like molecules. |
Standard Protocol for Conformational Analysis in LigandScout
This protocol describes the standard procedure for generating a multi-conformational compound library suitable for pharmacophore-based virtual screening using LigandScout's command-line tools.
The following diagram illustrates the standard workflow for conformational analysis and library preparation.
Step-by-Step Methodology
Ligand and Test Set Preparation
- Input: A dataset of active and inactive compounds.
- Procedure: Select a representative training set. One effective strategy is to cluster active and inactive compounds separately using a method like Butina clustering based on 2D pharmacophore fingerprints. The centroids of clusters containing at least five compounds are selected for the training set, ensuring representation of diverse chemotypes [57]. The remaining compounds form the test set for external validation.
Stereoisomer Enumeration
- Procedure: For molecules with undefined chiral centers or double bond stereochemistry, enumerate all possible stereoisomers. In the context of model development, all generated stereoisomers are treated as part of a single parent compound [57].
- Rationale: Ensures that the correct stereochemistry required for bioactivity is considered during conformer generation.
Conformer Generation
- Tool: Use the LigandScout command-line tool
idbgen. - Parameters:
- Use the
icon bestoption to generate a maximum of 200 high-quality conformers per molecule [58]. - Set a large energy threshold of 50 kcal/mol above the global minimum. This is crucial for highly flexible compounds, as it prevents the over-representation of folded, low-energy conformers and allows for the generation of extended structures that might be the bioactive conformation [57].
- Use the
- Output: A diverse set of 3D conformers for each molecule/stereoisomer.
- Tool: Use the LigandScout command-line tool
Energy Minimization
- Procedure: Perform energy minimization on all generated conformers using the MMFF94 force field [57].
- Rationale: Refines the geometries to eliminate steric clashes and ensures that the conformers are locally stable, providing more physically realistic structures for alignment and feature identification.
Advanced Sampling for Complex Flexibility
For ligands with pronounced flexibility or when multiple binding modes are suspected, standard conformer generation may be inadequate. The following table outlines advanced computational techniques.
Table 2: Advanced Methods for Sampling Complex Ligand Flexibility
| Method | Key Principle | Application Context |
|---|---|---|
| Molecular Dynamics (MD) / NCMC | A hybrid method combining MD with Non-Equilibrium Candidate Monte Carlo. Ligand interactions are alchemically turned off, a rotatable bond is rotated, and interactions are slowly restored, enhancing acceptance of major conformational changes [59]. | Sampling multiple distinct binding modes of a flexible ligand in a binding pocket. Correctly reproduces population distributions for ligands with rotatable bonds in kinase targets [59]. |
| MD Simulations & Clustering | Running extensive (microsecond-scale) MD simulations of protein-ligand complexes, then clustering the resulting trajectories to identify representative conformational states [60]. | Elucidating complex-based pharmacophore models that account for full protein and ligand flexibility. Useful for categorizing covalent vs. non-covalent inhibitors [60]. |
| Common Hits Approach (CHA) | Generating a representative set of protein conformations from an MD simulation, creating a pharmacophore model for each, and pooling models with identical features into Representative Pharmacophore Models (RPMs) for screening [58]. | Incorporating full protein flexibility into screening. The final hit list is scored based on the number of matching RPMs, identifying compounds that fit multiple protein conformations [58]. |
The Scientist's Toolkit: Research Reagent Solutions
Table 3: Essential Software and Computational Tools
| Tool Name | Type | Primary Function in Workflow |
|---|---|---|
| LigandScout | Commercial Software | Primary environment for structure- and ligand-based pharmacophore modeling, virtual screening, and library generation using idbgen [58]. |
| RDKit | Open-Cheminformatics | Used for calculating 2D pharmacophore fingerprints, Butina clustering, and stereoisomer enumeration in automated workflows [57]. |
| Amber / GROMACS | MD Simulation Engine | Performing all-atom molecular dynamics simulations for advanced sampling of protein-ligand complexes and conformational dynamics [58] [60]. |
| BLUES | Open-Sampling Package | Implements the hybrid MD/NCMC method for enhanced sampling of ligand rotational states and binding modes [59]. |
| CATALYST (Discovery Studio) | Commercial Software | Alternative platform for comprehensive pharmacophore modeling, conformational analysis, and 3D-QSAR studies [61]. |
Effectively addressing ligand flexibility is a non-negotiable component of a robust ligand-based pharmacophore modeling workflow. The standard protocol for multi-conformational library generation in LigandScout, utilizing a wide energy window and generating hundreds of conformers per molecule, provides a solid foundation for most drug discovery projects. However, researchers must be vigilant for the signs of complex flexibility—such as ligands with many rotatable bonds or evidence of multiple binding modes—which necessitate the deployment of advanced sampling techniques like MD/NCMC or the Common Hits Approach. By quantitatively assessing conformational coverage and strategically applying these protocols, researchers can significantly increase the predictive power of their pharmacophore models, leading to more successful virtual screening campaigns and more efficient lead optimization.
Improving Model Selectivity Over Related Biological Targets
In modern drug discovery, a paramount challenge is the development of therapeutic agents that are highly selective for their intended biological target, thereby minimizing off-target effects and potential toxicity. This is particularly crucial when targeting members of protein families that share structural similarities, such as the short-chain dehydrogenases/reductases (SDRs) or inhibitor of apoptosis proteins (IAPs), where cross-reactivity can lead to adverse effects [7] [41]. Pharmacophore modeling serves as a powerful computational technique to abstract the essential steric and electronic features necessary for optimal supramolecular interactions with a specific biological target [15] [62]. However, creating models that can precisely discriminate between closely related targets requires specialized strategies and rigorous validation protocols. This application note details a refined ligand-based pharmacophore modeling workflow using LigandScout software, specifically designed to enhance model selectivity. We provide a comprehensive protocol, supported by case study data, to guide researchers in constructing selective models capable of identifying novel, target-specific lead compounds.
Theoretical Background and Key Concepts
The Selectivity Challenge in Related Targets
Many therapeutically relevant targets belong to large protein families characterized by conserved structural folds and active site architectures. For instance, the short-chain dehydrogenases (SDRs) often share sequence identities below 20% but possess a conserved Rossman-fold and a Tyr-X-X-X-Lys motif in the active site [7]. Similarly, the IAP family members share common structural domains, yet overexpressing a specific member like XIAP can decrease apoptosis and promote cancer [41]. This high degree of structural conservation poses a significant challenge: inhibitors designed for one member may inadvertently bind to others, leading to potential side effects. The goal of a selective pharmacophore model is to define the unique set of chemical features and their spatial arrangement that confers binding preference for the target of interest over its related counterparts.
Ligand-Based Pharmacophore Modeling
Ligand-based pharmacophore modeling is employed when the 3D structure of the target protein is unknown or to specifically focus on the features shared by active ligands. This approach involves analyzing a set of known active molecules to identify their common chemical features, which are then integrated into a 3D model [15] [62]. These features include [7] [15]:
- Hydrogen Bond Acceptors (HBA) and Donors (HBD)
- Hydrophobic areas (H)
- Aromatic Rings (AR)
- Positively/Negatively Ionizable Groups (PI/NI)
- Exclusion Volumes (XVOL), which represent forbidden areas in the binding pocket and are critical for defining shape and steric constraints.
The core hypothesis is that molecules sharing these spatially arranged features are likely to exhibit similar biological activity [15].
Experimental Protocol for Selective Model Generation
The following protocol, optimized for LigandScout, outlines the key steps for developing and validating selective pharmacophore models.
Data Curation and Preparation
Define and Collect Compound Sets: Assemble four distinct sets of compounds.
- Active Set for Target of Interest: A collection of known potent inhibitors for your primary target (e.g., 17β-HSD2 inhibitors).
- Active Set for Related Off-Target(s): A collection of known active compounds for the related protein(s) from which you wish to discriminate (e.g., 17β-HSD1 inhibitors).
- Inactive/Decoy Set: A large set of chemically similar but presumably inactive molecules, often obtained from databases like the Database of Useful Decoys (DUDe) [33] [41].
- Known Inactive Compounds: A small set of compounds experimentally verified to be inactive against your target.
Split into Training and Test Sets: Divide both the active and inactive sets for your target into a training set (e.g., 75%) for model generation and a test set (e.g., 25%) for validation. This separation is critical to avoid overfitting and to objectively assess model performance [29].
Model Generation and Optimization in LigandScout
Clustering and Initial Model Generation: Cluster the active training set compounds using LigandScout's i-cluster tool (default parameters:
cluster_dis = 0.4with average method) [29]. For each cluster with a sufficient number of members (e.g., >5), generate a ligand-based pharmacophore model using the "merged feature pharmacophore" approach with default settings [63].Feature Selection and Optimization: The initial, feature-rich models require refinement to enhance selectivity.
- Begin screening the training set with the
Max. number of omitted featuresset to0[29]. - If the model retrieves many active compounds but also some inactives, iteratively adjust the model. This involves setting non-essential features as
optionalor removing them entirely. A feature is considered non-essential if its omission increases the model's ability to retrieve active compounds while rejecting inactive ones [7] [29]. - Continue this optimization process until you have a minimal set of 3-4 features that are critical for activity and selectivity, or until no further improvement is possible [29].
- Begin screening the training set with the
Incorporation of Exclusion Volumes (XVOL): Enable the
creation of exclusion volume spheresduring model generation [63]. These volumes model steric hindrances in the binding pocket that are not tolerated. They are particularly important for discriminating against compounds that would fit a related target with a slightly different pocket shape [7].
Model Validation and Selectivity Assessment
Performance Screening: Screen the test set and the decoy set with your optimized model. Calculate key performance metrics.
- Sensitivity/Recall: The proportion of actual active compounds correctly identified by the model.
- Specificity: The proportion of actual inactive compounds correctly rejected.
- Enrichment Factor (EF): Measures how much more likely you are to find active compounds relative to a random selection.
- Area Under the Curve (AUC) of the Receiver Operating Characteristic (ROC) curve: A value of 1.0 indicates perfect discrimination, while 0.5 is no better than random [33] [41]. An excellent model, as demonstrated in an XIAP study, can achieve an AUC of 0.98 and an EF1% of 10.0 [41].
Cross-Target Screening (Selectivity Check): This is the critical step for assessing selectivity. Screen the set of active compounds for the related off-target (e.g., 17β-HSD1 actives screened with a 17β-HSD2 model). A highly selective model should retrieve few to no actives for the related off-target [7].
Redundancy Removal: If multiple pharmacophore models are generated, rank them according to the number of hits they retrieve. Sequentially remove models that do not contribute unique hits (i.e., whose hits are all retrieved by other models) without decreasing the overall recall [29].
Virtual Screening
Apply the final, validated, and selective pharmacophore model(s) as a 3D query to screen large commercial or in-house compound databases (e.g., ZINC, SPECS) [7] [8]. The resulting "hit list" will be enriched with compounds predicted to be both active and selective for your target.
Table 1: Key Performance Metrics from Selectivity-Focused Case Studies
| Target System | Model Performance | Selectivity Demonstration | Citation |
|---|---|---|---|
| 17β-HSD2 vs 17β-HSD1 | Three models combined: Sensitivity=0.87 (13/15 actives retrieved). Specificity=1.0 (0/30 inactives retrieved). | Models successfully distinguished 17β-HSD2 inhibitors from inactive compounds and, crucially, from 17β-HSD1 inhibitors, demonstrating high selectivity. | [7] |
| XIAP Antagonists | AUC = 0.98; EF1% = 10.0 | The model effectively discriminated true XIAP antagonists from 5199 decoy compounds. | [41] |
| Fluoroquinolone Antibiotics | Identified 25 hits with fit scores 97.85-116. | Top hit (ZINC26740199) shared key pharmacophore features (Ar, H, HBA) with Ciprofloxacin, confirming target-specific feature mapping. | [8] |
The Scientist's Toolkit: Research Reagent Solutions
Table 2: Essential Software and Data Resources for Selective Pharmacophore Modeling
| Tool/Resource | Type | Primary Function in Workflow |
|---|---|---|
| LigandScout | Software | Primary platform for ligand-based and structure-based pharmacophore model generation, optimization, and virtual screening. [63] [29] |
| ZINC Database | Compound Database | A curated collection of over 230 million commercially available compounds in ready-to-dock 3D format, used for virtual screening. [8] [41] |
| Database of Useful Decoys (DUDe) | Decoy Database | Provides sets of decoy molecules with similar physical properties but dissimilar chemical topology to active compounds, essential for model validation. [33] [41] |
| ChEMBL Database | Bioactivity Database | A manually curated database of bioactive molecules with drug-like properties, used to gather known active and inactive compounds for training and test sets. [33] |
| Protein Data Bank (PDB) | Structure Database | Repository of 3D structural data of proteins and nucleic acids, used for structure-based modeling and understanding binding sites. [15] |
Workflow Visualization
The following diagram illustrates the integrated workflow for generating and validating selective pharmacophore models, from data preparation to virtual screening.
Achieving high selectivity in pharmacophore models is a meticulous process that balances the retrieval of true actives against the rejection of inactives and, most importantly, compounds active on related off-targets. The iterative process of feature optimization—removing or setting features as optional based on performance against a well-curated test set—is the cornerstone of this effort [29]. The incorporation of exclusion volumes provides a powerful means to encode target-specific steric constraints that are not present in related proteins [7].
The case studies presented demonstrate the efficacy of this approach. The work on 17β-HSD2 highlights how multiple, restrictive models can be used in concert to achieve high sensitivity (87%) and perfect specificity (100%) against a test set containing inactives [7]. Furthermore, the validation protocol using ROC curves and early enrichment factors, as shown in the XIAP study, provides a quantitative and robust measure of a model's predictive power and its ability to discriminate true actives from decoys [33] [41].
In conclusion, the ligand-based pharmacophore modeling workflow in LigandScout, when augmented with the rigorous selectivity-focused strategies outlined in this application note, provides a powerful and reliable method for identifying novel, target-specific chemical starting points for drug discovery programs. This protocol empowers researchers to move beyond simple activity models and develop sophisticated computational tools that directly address the critical issue of selectivity in the early stages of drug design.
The Impact of Training Set Diversity and Quality on Model Performance
In ligand-based pharmacophore modeling, the training set serves as the foundational element upon which model accuracy, predictive power, and generalizability are built. The principle is straightforward yet profound: the chemical information and biological activity data encoded within the training set directly determine the pharmacophore features the model will identify as essential for biological activity. Consequently, the composition of the training set—specifically the diversity of its chemical structures and the quality of its associated activity data—is not merely a preliminary consideration but a critical determinant of success in virtual screening and drug discovery campaigns. This application note, framed within the context of a broader thesis on the LigandScout workflow, provides detailed protocols and analyses for optimizing training set selection to enhance pharmacophore model performance.
Principles of Training Set Composition
The efficacy of a pharmacophore model hinges on its ability to abstract the correct three-dimensional arrangement of chemical features responsible for binding to a biological target and eliciting a pharmacological response. The training set instructs the model in this process through two primary channels:
- Structural Diversity: A training set encompassing a broad spectrum of chemical scaffolds and substitution patterns enables the model to distinguish essential pharmacophoric features from incidental structural elements. This improves the model's ability to identify novel chemotypes during virtual screening. As demonstrated in a study on Topoisomerase I inhibitors, distributing compounds across most active, active, moderately active, and inactive categories based on IC₅₀ values ensures the model learns features correlated with high potency [43].
- Data Quality and Consistency: Biological activity data (e.g., IC₅₀, Ki) for all training compounds should ideally be generated from homogeneous experimental assays under consistent conditions. This minimizes noise and ensures the model learns true structure-activity relationships rather than artifacts of experimental variability. The reliability of a model is severely compromised if the activity data of its training set are not determined under the same bioassay conditions [43].
Case Studies and Quantitative Evidence
The impact of training set design is not merely theoretical but is substantiated by concrete outcomes from published research. The following case studies illustrate how deliberate training set construction leads to pharmacophore models with superior predictive power.
Table 1: Impact of Training Set Design on Model Performance in Published Studies
| Target Protein | Training Set Characteristics | Key Model Performance Metrics | Virtual Screening Outcome | Source |
|---|---|---|---|---|
| DNA Topoisomerase I | 29 diverse CPT derivatives; activities from a single cancer cell line (A549); wide IC₅₀ range (0.003 - 11.4 µM) | Correlation for training set (R²) = 0.918; for test set = 0.875 | Identified 3 potential inhibitory 'hit molecules' after multi-step screening of >1 million compounds [43] | [43] |
| MMP-9 | 67 molecules with 4 different scaffolds; 46 in training set; activity threshold defined (pIC₅₀ > 8.3 = active) | R² = 0.908, Q² = 0.817, F value = 83.5 | Model used for high-throughput virtual screening of 2.3 million compounds [64] | [64] |
| Cephalosporins | 3 compounds from 1st & 3rd generation antibiotics (cephalothin, ceftriaxone, cefotaxime) | Goodness-of-Hit (GH) Score = 0.739 | Identified 7 initial candidates, leading to the design of 30 novel synthetic models [16] | [16] |
| 17β-HSD2 | 3 separate models, each built from a pair of structurally diverse and potent training compounds | Combined sensitivity = 0.87 (retrieved 13 of 15 active test compounds); Zero false positives | From 202,906 screened compounds, 29 tested in vitro; 7 showed low micromolar IC₅₀ values [7] | [7] |
Protocol: Designing a High-Quality Training Set for LigandScout
The following step-by-step protocol is adapted from best practices exemplified in the case studies and is tailored for implementation within the LigandScout environment.
Step 1: Data Curation and Preparation
- Gather Ligands: Collect a large set of known ligands for your target from public databases (e.g., ChEMBL, PubChem Bioassay, BindingDB) or proprietary sources [65].
- Standardize Activity Data: Ensure all inhibitory concentrations (e.g., IC₅₀, Ki) are reported in the same unit (e.g., nM, µM). Convert to pIC₅₀ (-logIC₅₀) for a more normal distribution suitable for modeling [64].
- Filter and Prepare Structures: Use LigandScout or related tools to generate accurate 3D conformations for each ligand. Apply energy minimization using an appropriate force field (e.g., MMFF94) [43].
Step 2: Activity-Based Categorization
- Classify Compounds: Categorize ligands based on their activity data. A recommended scheme is:
- Most Active: IC₅₀ < 0.1 µM
- Active: IC₅₀ = 0.1 - 1.0 µM
- Moderately Active: IC₅₀ = 1.0 - 10.0 µM
- Inactive: IC₅₀ > 10.0 µM [43]
- Rationale: This ensures the model is built primarily on the features present in highly active compounds while being informed by the features absent in inactive ones.
Step 3: Strategic Selection of Training and Test Sets
- Select Training Compounds: From your categorized list, select 15-30 compounds for the training set. Prioritize all or most of the "Most Active" and "Active" compounds, and include a few "Moderately Active" and "Inactive" molecules to define the activity cliff. Maximize structural diversity by ensuring the selection covers different chemical scaffolds and core rings present in the full dataset [43] [64].
- Select Test Compounds: The remaining compounds form the test set. This set should also contain a spread of activities and structures to robustly validate the model's predictive accuracy [43].
Step 4: Model Generation and Validation in LigandScout
- Input Training Set: Import the prepared 3D structures of your training set into LigandScout.
- Generate Pharmacophore Hypothesis: Use the "Create Ligand-based Pharmacophore" function. LigandScout will identify common chemical features (HBA, HBD, Hydrophobic, Aromatic, etc.) and generate multiple hypothesis models [16].
- Validate with Test Set: Screen the test set against the generated pharmacophore models. A high-quality model will correctly predict the activity of test set compounds, showing a strong correlation between experimental and estimated activity [43] [64].
Performance Metrics and Model Validation
A rigorously developed model must be validated using multiple stringent criteria before being deployed for virtual screening. The following metrics, presented in a structured table, are essential for evaluating model performance.
Table 2: Key Statistical Metrics for Pharmacophore Model Validation
| Metric | Description | Interpretation & Ideal Value |
|---|---|---|
| R² (Regression Coefficient) | Measures how well the model explains the variance in the training set activity data. | Closer to 1.0 indicates a better fit. Value > 0.8 is generally good [64]. |
| Q² (Cross-Validation Coefficient) | Measures the internal predictive power of the model (e.g., via leave-one-out). | Value > 0.5 is considered acceptable; > 0.7 is excellent [64]. |
| Root Mean Square Error (RMSE) | Average magnitude of the difference between predicted and experimental values. | Closer to 0 indicates higher prediction accuracy. |
| Fisher Value (F Value) | Ratio of model variance to error variance; indicates statistical significance. | A higher value signifies a more statistically robust model [64]. |
| Goodness-of-Hit (GH) Score | Evaluates the model's ability to enrich active compounds in a virtual screening. | Ranges 0-1; > 0.7 indicates excellent enrichment power [16]. |
Advanced Validation Techniques:
- Y-Scrambling: The activity data of the training set is randomly scrambled, and new models are generated. A valid original model will have significantly better statistics than the scrambled models, confirming that its performance is not due to chance correlation [64].
- Enrichment Analysis: The model is used to screen a decoy database containing known active and inactive molecules. The GH score and the early enrichment factor measure its utility in a real-world virtual screening context [16] [64].
The Scientist's Toolkit: Essential Research Reagents and Materials
Table 3: Key Research Reagent Solutions for Ligand-Based Pharmacophore Modeling
| Item / Resource | Function / Application | Example Tools / Databases |
|---|---|---|
| Pharmacophore Modeling Software | Core platform for generating, visualizing, and screening pharmacophore models. | LigandScout [16], Catalyst [24], PHASE [24] |
| Chemical Databases | Source of known active ligands for training set construction and decoys for validation. | ChEMBL [65], PubChem [16] [65], BindingDB [65], ZINC [43] [16] |
| Virtual Compound Libraries | Large collections of commercially available or drug-like molecules for virtual screening. | ZINC database [43] [24], SPECS database [7] |
| Conformation Generation Algorithm | Produces representative 3D conformations of ligands for model building. | ConfGen [64], included in LigandScout and other suites |
| Force Field | Used for energy minimization and geometry optimization of ligand structures. | CHARMM [43], OPLS3e [64], MMFF94 |
Workflow and Signaling Diagrams
Ligand-Based Pharmacophore Modeling Workflow
The following diagram outlines the complete workflow for developing and validating a ligand-based pharmacophore model, emphasizing the critical role of the training set.
Training Set Diversity and Quality Assessment
This diagram illustrates the logical process for evaluating and ensuring the diversity and quality of a training set prior to model generation.
In ligand-based pharmacophore modeling with LigandScout, the creation of a model is only the first step. Its predictive power and selectivity are critically dependent on the post-generation refinement of two key parameters: feature tolerances and feature weights. A pharmacophore model abstracts key ligand-receptor interactions into chemical features such as Hydrogen Bond Acceptors (HBA), Hydrogen Bond Donors (HBD), Hydrophobic areas (H), and Aromatic Rings (AR) [7] [66]. The spatial arrangement of these features is defined with a tolerance radius, representing the allowable deviation for a matching ligand feature. Simultaneously, features can be assigned different weights, signifying their relative importance for biological activity. Properly adjusting these parameters fine-tunes the balance between the model's sensitivity (finding active compounds) and specificity (rejecting inactive compounds), which is essential for successful virtual screening campaigns that aim to discover novel scaffolds [66] [6].
Theoretical Foundation: The Impact of Tolerances and Weights
The Role of Feature Tolerances
Feature tolerances are spherical regions around a pharmacophore point that define the permissible space for a match. While often set to default values initially, systematic adjustment is required for optimization.
- Reducing Tolerances: Creates a more restrictive model. This is useful when a high number of false positives are retrieved during initial screening, or when structural information suggests that a particular interaction is geometrically precise. Overly restrictive tolerances, however, may miss true active compounds with slight conformational variations.
- Increasing Tolerances: Creates a more permissive model. This can be beneficial in the early stages of lead discovery to maximize the chance of finding novel chemotypes. The risk is a potential increase in false positives, retrieving compounds that match the pharmacophore geometrically but lack the required potency [66].
The strategic omission of features, effectively setting their weight to zero, is another powerful aspect of refinement. A protocol involving iterative screening with the "Max. number of omitted features" parameter set to 0, then 1, and back to 0 helps identify non-essential features. If allowing one feature to be omitted increases the positive predictive value (PPV), that feature can be considered for removal or set to optional [29].
The Role of Feature Weights
Feature weights assign a hierarchical value to the different chemical features in a model.
- High-Weight Features: These are considered critical for binding. A match to a high-weight feature might be mandatory for a compound to be considered a hit.
- Low-Weight or Optional Features: These represent favorable but non-essential interactions. Making a feature optional is a strategic decision that can help in retrieving active compounds that possess the core binding motif but lack some peripheral interactions [7].
Setting a feature as "optional" is a direct application of weight adjustment. For instance, in a study on 17β-HSD2 inhibitors, one of the validated models contained two Hydrogen Bond Acceptors, one of which was intentionally set to optional to correctly recognize active compounds from a test set without retrieving inactive ones [7].
Quantitative Guidelines for Parameter Adjustment
The following tables summarize recommended values and strategic considerations for adjusting tolerances and weights, synthesized from published protocols.
Table 1: Strategic Adjustment of Pharmacophore Parameters
| Parameter | Default/Starting Value | Adjustment Direction | Effect on Model | Typical Use Case |
|---|---|---|---|---|
| Max Omitted Features | 0 | Increase to 1 | Identifies non-essential features; increases sensitivity. | Initial model optimization; finding a balance between recall and precision [29]. |
| Feature Tolerances | Software Default | Decrease | Increases model restrictiveness and specificity. | Reducing false positives; when a specific interaction is geometrically precise [66]. |
| Feature Tolerances | Software Default | Increase | Increases model permissiveness and sensitivity. | Early-stage screening to maximize scaffold diversity [66]. |
| Feature Weight | Mandatory | Set to Optional | Reduces model stringency, allows missing one interaction. | When a feature is beneficial but not critical for activity [7]. |
Table 2: Model Performance Metrics for Optimization Validation
| Performance Metric | Formula/Description | Target Value | Role in Refinement |
|---|---|---|---|
| Sensitivity (Recall) | True Positives / (True Positives + False Negatives) | Maximize | Ensures the model does not miss known active compounds. |
| Specificity | True Negatives / (True Negatives + False Positives) | >0.9 (90%) | Ensures the model rejects known inactive compounds [7]. |
| Positive Predictive Value (PPV) | True Positives / (True Positives + False Positives) | Maximize | Key metric for optimization; a higher PPV means fewer false positives among hits [29]. |
Experimental Protocol: An Iterative Refinement Workflow
This detailed protocol provides a step-by-step guide for the iterative refinement of pharmacophore models using tolerances and weights.
Step 1: Initial Model Generation and Validation
- Generate your initial ligand-based pharmacophore model using a training set of known active compounds. In LigandScout, this can be done via the "Create Common Feature Pharmacophore" tool [29] [6].
- Validate the initial model against a test set containing both active and inactive compounds. Calculate initial performance metrics like sensitivity and specificity [7].
Step 2: First Screening and PPV Assessment
- Use the initial model (with default tolerances and no omitted features) to screen your training set.
- Calculate the Positive Predictive Value (PPV). If the PPV is already high, proceed to Step 3A. If the PPV is low, proceed to Step 3B [29].
Step 3A: Investigating Non-Essential Features
- Perform a second screening of the training set, this time setting the "Max. number of omitted features" to 1.
- Analyze the results. If the PPV increases, it indicates that the omitted feature is not essential. Consider removing this feature or permanently setting it to "optional."
- Conduct a third screening with "Max. number of omitted features" set back to 0. If the PPV remains high, the model is validated. If it decreases, further investigation of features is needed [29].
Step 3B: Adjusting Tolerances for Specificity
- If the initial PPV is low, manually review the features with the largest tolerance spheres.
- Systematically reduce the tolerance of features that are likely to be less critical or are causing promiscuous matching.
- Re-screen the training set after each adjustment and re-calculate the PPV. Iterate until the PPV is maximized without unduly compromising sensitivity.
Step 4: Redundancy Check and Final Validation
- Once a collection of optimal models is obtained, remove redundant pharmacophores. A pharmacophore is redundant if its removal does not decrease the overall recall of the active compounds.
- Rank all generated pharmacophores by their number of hits. Remove the one with the fewest hits and check the impact on recall. If unaffected, dismiss it; if recall decreases, conserve it [29].
The Scientist's Toolkit: Essential Research Reagents
Table 3: Key Software and Resources for Pharmacophore Modeling
| Tool/Resource | Function in Workflow | Application in this Context |
|---|---|---|
| LigandScout | Primary software for pharmacophore modeling, visualization, and virtual screening. | Used to build initial models, adjust feature tolerances/weights, set omitted features, and perform screening steps [29] [6]. |
| ICON Algorithm | Conformational analysis and generation within LigandScout. | Generates multiple low-energy conformations for each ligand in the training set, providing a foundation for a robust, flexibility-aware pharmacophore model [29]. |
| i-cluster Tool | Clustering tool within LigandScout. | Groups active compounds in the training set based on 3D similarity (e.g., cluster_dis = 0.4), allowing for the generation of cluster-specific pharmacophores [29]. |
| idbgen / ldb2 Format | Database preparation tool in LigandScout. | Converts compound libraries into a searchable, multi-conformational database format (ldb) for efficient virtual screening [29] [39]. |
| Test & Training Sets | Curated compound collections for model validation. | A test set with known actives and inactives is mandatory for objectively quantifying model performance (sensitivity, specificity) during refinement [7]. |
Concluding Remarks
Mastering the adjustment of tolerances and feature weights transforms a static pharmacophore model into a dynamic and powerful filter for virtual screening. The iterative process of screening, evaluating metrics like PPV, and refining parameters enables researchers to systematically enhance model performance. This approach is fundamental to successfully identifying novel, potent, and selective lead compounds in drug discovery, making efficient use of the advanced capabilities embedded within LigandScout.
Ensuring Model Reliability: Validation Strategies and Comparative Analysis
In the ligand-based pharmacophore modeling workflow, a model is a hypothesis about the essential steric and electronic features a molecule must possess to be biologically active. Internal validation is the critical process of evaluating this hypothesis's predictive capability before its application in virtual screening. It determines whether the model can reliably discriminate between active and inactive compounds and accurately forecast the activity of novel molecules. Two cornerstone methodologies for this assessment are the use of a test set and a decoy set. The test set provides an initial, direct estimate of predictive power for activity, while the decoy set challenges the model's ability to identify true actives from a background of non-binders in a more realistic screening scenario. This document outlines the detailed protocols and application notes for performing these essential validation steps within a research context utilizing LigandScout.
Theoretical Background and Key Concepts
A pharmacophore model is an abstract representation of molecular interactions, defined as the "ensemble of steric and electronic features that is necessary to ensure the optimal supramolecular interactions with a specific biological target" [67]. In the absence of a protein structure, ligand-based models are derived from the common features and conformational space of known active ligands.
Internal validation distinguishes itself from external validation, which uses a completely independent set of compounds discovered after model creation. Internal validation techniques, like test and decoy sets, use data available at the time of model building to provide a robust, pre-deployment assessment of the model's quality and to prevent the advancement of models with poor generalizability.
Protocol 1: Validation with a Test Set
Principle and Objective
The test set validation protocol assesses a model's ability to predict the quantitative activity of a set of compounds that were not used in the model's construction (the training set). The objective is to estimate the model's predictive power and reliability by comparing its predictions against experimentally determined activity values.
Experimental Design and Workflow
The following workflow outlines the key steps for performing test set validation, from initial data preparation to final model assessment.
Detailed Methodology
- Data Set Curation and Division: Begin with a full dataset of compounds with known biological activities (e.g., IC₅₀, Ki). The dataset must be divided into a training set for model generation and a test set for validation. A typical split is 70-80% for training and 20-30% for testing. The test set should span a broad range of activity and be structurally diverse but representative of the training set.
- Pharmacophore Model Generation: Using LigandScout, generate the pharmacophore model exclusively from the compounds in the training set. This model will be used to predict the activity of the withheld test set.
- Activity Prediction and Statistical Analysis: Map the test set compounds onto the generated pharmacophore model. LigandScout will calculate a "fit value" for each test compound, which should correlate with its experimental activity. The correlation between the experimental activity (e.g., pIC₅₀) and the predicted fit value is then quantified using statistical metrics.
Table 1: Key Statistical Metrics for Test Set Validation
| Metric | Formula/Description | Interpretation | Reported Values in Literature |
|---|---|---|---|
| Correlation Coefficient (R²) | R² = 1 - (SSₜₕᵢᵣₜ/SSₜₒₜₐₗ) | Measures the proportion of variance in the experimental activity explained by the model. Closer to 1 is better. | 0.9076 for a validated MMP-9 inhibitor model [68] |
| Root Mean Square Error (RMSE) | RMSE = √(Σ(Pᵢ - Oᵢ)²/N) | Measures the average magnitude of prediction errors. Closer to 0 is better. | 0.56-0.70 in QPhAR models [69] |
| Pearson-R | Pearson's correlation coefficient | Measures the linear correlation between predicted and experimental values. | 0.8340 reported in a MMP-9 inhibitor study [68] |
Protocol 2: Validation with a Decoy Set
Principle and Objective
The decoy set validation, or enrichment study, evaluates a model's ability to discriminate between known active compounds and a large set of presumed inactive molecules (decoys) in a simulated virtual screening experiment. The objective is to measure the model's discriminatory power and its potential to reduce the experimental screening burden by enriching hit lists with true actives.
Experimental Design and Workflow
This protocol tests the model's performance in a more realistic screening environment against a background of non-active compounds.
Detailed Methodology
- Decoy Set Generation: A decoy set should include known active compounds (A) and many presumed inactive molecules (decoys). Decoys should be physically similar to actives (e.g., in molecular weight, logP) but chemically distinct to avoid true activity. Databases like the Directory of Useful Decoys (DUD) or compounds from the ZINC database can be used. A common ratio is 30-50 actives to 500-1000 decoys [30] [70].
- Virtual Screening and Hit List Analysis: Screen the combined database of actives and decoys using the pharmacophore model as a query in LigandScout. The screening results in a hit list (Ht), which contains both true active hits (Ha) and false positives.
- Enrichment Metric Calculation: The performance of the model is quantified by calculating standard enrichment metrics based on the hit list analysis.
Table 2: Key Metrics for Decoy Set Validation and Enrichment Analysis
| Metric | Formula | Interpretation | Reported Values in Literature |
|---|---|---|---|
| Enrichment Factor (EF) | EF = (Ha / Ht) / (A / D) | Measures how much more likely you are to find an active than by random selection. Higher is better. | Used as a key performance indicator in multiple studies [30] [71] |
| % Yield of Actives (%A) | %A = (Ha / Ht) * 100 | The percentage of the hit list that consists of true actives. | Critical for assessing hit list quality [30] |
| Goodness of Hit Score (GH) | GH = [ (Ha / A) * ( (3A + Ht) / (4Ht) ) ] * (1 - (Ht - Ha)/(D - A)) | A composite score balancing recall and precision. A score of 0.7-0.8 indicates a very good model. | A GH score of 0.81 was reported for a validated tubulin inhibitor model [71] |
The formulas use these variables: D = total number of compounds in database, A = number of active compounds in database, Ht = number of hits retrieved, Ha = number of active compounds in hit list.
The Scientist's Toolkit: Essential Reagents and Materials
Table 3: Key Research Reagent Solutions for Internal Validation
| Item | Function/Description | Example Sources/Tools |
|---|---|---|
| Compound Databases | Source of known active ligands for training/test sets and structures for decoys. | IUPHAR/BPS Guide to Pharmacology, ChEMBL, ZINC database, SPECS, FDA-approved databases [30] [71] [6] |
| Decoy Sets | Collections of presumed inactive molecules used to challenge the model's specificity and calculate enrichment. | Directory of Useful Decoys (DUD), generated subsets from ZINC database [30] [70] |
| LigandScout Software | Primary software for ligand-based pharmacophore model generation, virtual screening, and fit value prediction. | Used across numerous cited studies for model building and screening [6] [67] |
| Statistical Analysis Tools | For calculating validation metrics (R², RMSE, EF, GH score). | Built-in analysis in LigandScout, external tools like R or Python with pandas/sci-kit learn. |
| Validation Protocols | Defined methodologies for rigorous assessment, including Y-scrambling and Fischer randomization. | Y-scrambling was used to validate a MMP-9 inhibitor model [68]; Fischer randomization validated a tubulin inhibitor model [71] |
External validation through prospective virtual screening and subsequent experimental confirmation represents the critical, definitive stage in a ligand-based pharmacophore modeling workflow. It moves beyond theoretical models and retrospective analyses to demonstrate a model's real-world utility in identifying novel bioactive compounds. This process rigorously tests the pharmacophore hypothesis's predictive power against entirely new chemical libraries, with the ultimate validation provided by in vitro or in vivo experimental assays confirming the predicted biological activity. [33] [72] Successful external validation transforms a computational model into a valuable tool for accelerating drug discovery, particularly for targets where 3D protein structures are unavailable. [15] [73] This application note details the protocols and best practices for this crucial phase, contextualized within a broader LigandScout-centric research workflow.
Foundational Concepts and Validation Metrics
Before embarking on prospective screening, it is essential to validate the pharmacophore model internally and retrospectively to gauge its potential for success. Key quantitative metrics used to evaluate model performance include the Enrichment Factor (EF) and the Goodness of Hit Score (GH). [74]
The Enrichment Factor measures how much more effective the model is at identifying active compounds compared to a random selection. It is calculated as: ( EF = \frac{(Ht / Ht)}{(A / D)} ) where ( H_t ) is the number of active compounds found in the screening hit list, ( A ) is the total number of active compounds in the database, and ( D ) is the total number of compounds in the database. [74]
The Goodness of Hit Score, which ranges from 0 (null model) to 1 (ideal model), provides a single comprehensive metric. A GH score greater than 0.7 is typically indicative of a very good model. It is calculated using the formula: ( GH = \left[ \frac{Ha(3A + Ht)}{4HtA} \right] \times \left( 1 - \frac{Ht - Ha}{D - A} \right) ) where ( Ha ) represents the number of active compounds in the hit list. [74]
Table 1: Key Performance Metrics for Pharmacophore Model Validation
| Metric | Formula | Interpretation | Threshold for a Good Model |
|---|---|---|---|
| Enrichment Factor (EF) | ( \frac{(Ht / Ht)}{(A / D)} ) | Measures enrichment of actives in the hit list versus random selection. | Higher values indicate better performance; context-dependent. |
| Goodness of Hit Score (GH) | ( \left[ \frac{Ha(3A + Ht)}{4HtA} \right] \times \left( 1 - \frac{Ht - H_a}{D - A} \right) ) | A single score balancing recall and precision. | > 0.7 [74] |
Case Study: Prospective Screening for FAK1 Inhibitors
A 2023 study on Focal Adhesion Kinase 1 (FAK1) inhibitors for pancreatic cancer provides a robust example of a successful ligand-based pharmacophore workflow culminating in external validation. [33]
Pharmacophore Generation and Validation
Researchers developed a ligand-based pharmacophore model using LigandScout 4.3 and a set of twenty known FAK1 antagonists. The top-performing hypothesis (Model 1, score: 0.9180) incorporated two hydrophobic features, three aromatic ring features, five hydrogen bond acceptors, and two hydrogen bond donors, representing the essential chemical features for FAK1 inhibition. [33]
Before prospective screening, the model was rigorously validated using a decoy set from the Database of Useful Decoys: Enhanced (DUD-E). The model successfully retrieved known active compounds from a mixed pool of actives and decoys, demonstrating its ability to discriminate between active and inactive molecules, a strong predictor for its performance in prospective screening. [33]
Virtual Screening and Hit Identification
The validated pharmacophore model was used as a 3D query to screen large chemical databases. The resulting virtual hits were subsequently filtered based on drug-likeness (e.g., Lipinski's Rule of Five) and predicted ADMET (Absorption, Distribution, Metabolism, Excretion, Toxicity) properties to prioritize compounds with a higher probability of becoming successful drugs. [33]
This process identified several promising candidates, including PubChem compounds CID24601203, CID1893370, and CID16355541. Molecular docking studies predicted strong binding affinities for these hits towards the FAK1 protein, with binding scores of -10.4, -10.1, and -9.7 kcal/mol, respectively. [33]
Experimental Confirmation
The ultimate validation came from in vitro experimental assays, which confirmed the biological activity of the identified hits against FAK1, thereby verifying the predictive power of the original ligand-based pharmacophore model. [33]
Detailed Experimental Protocols
Protocol: External Validation with a Decoy Set
This protocol outlines the steps for validating a pharmacophore model's discriminative power prior to prospective screening. [74] [33]
- Decoy Set Preparation: Obtain or generate a set of decoy molecules. A standard resource is the DUD-E (Database of Useful Decoys: Enhanced), which provides decoys that are physically similar but chemically distinct from known actives. A typical validation set may contain 20 known active compounds and 1980 decoys (total D = 2000). [74] [33]
- Database Creation: Merge the known active compounds with the decoy compounds to create a unified validation database.
- Pharmacophore Screening: Use the pharmacophore model as a query to screen this validation database. In LigandScout, this is performed via the "Screening" tab, loading the pharmacophore model and the database of compounds, then executing the "Perform Screening" command. [75]
- Result Analysis: From the screening results, identify the number of retrieved actives (( Ht )) and the number of active compounds in the hit list (( Ha )).
- Metric Calculation: Calculate the Enrichment Factor (EF) and Goodness of Hit Score (GH) using the formulas provided in Section 2. A GH score > 0.7 indicates a model robust enough for prospective screening. [74]
Protocol: Prospective Virtual Screening Workflow
This protocol describes the end-to-end process for using a validated pharmacophore model to identify novel lead compounds. [33] [75]
- Compound Library Preparation:
- Source a large, diverse chemical library (e.g., ZINC, SPECS, Maybridge) [75] [72].
- Prepare the library by generating multiple low-energy conformers for each compound (e.g., up to 100 conformers within a 50 kcal/mol energy window) to ensure comprehensive coverage of potential bioactive shapes. [57] In LigandScout, this can be done by creating an
.ldbdatabase file containing the conformers. [75]
- Pharmacophore-Based Screening:
- Load the validated pharmacophore model into the screening module.
- Set screening parameters, such as the maximum number of omitted features and whether to check exclusion volumes. For a strict screen, set the max omitted features to zero. [75]
- Screen the prepared compound library against the model.
- Post-Screening Filtration:
- Drug-Likeness: Apply filters like Lipinski's Rule of Five to prioritize compounds with acceptable oral bioavailability.
- ADMET Prediction: Use computational tools to predict absorption, distribution, metabolism, excretion, and toxicity properties, filtering out compounds with undesirable profiles. [33] [76]
- Structural Diversity: Select a diverse set of hits from the filtered list to avoid chemical redundancy.
- Secondary In Silico Validation (Optional but Recommended):
Diagram 1: Prospective virtual screening workflow for identifying novel hits from large compound libraries.
Protocol: Experimental Confirmation of Virtual Hits
The final, crucial step is the experimental verification of the computational predictions. [33]
- Compound Acquisition: The final shortlisted hits are acquired from commercial vendors or synthesized.
- In Vitro Biological Assay: The purchased/synthesized compounds are tested in a target-specific biochemical or cell-based assay to determine their inhibitory activity (e.g., IC₅₀ or Kᵢ values). For the FAK1 case study, this involved testing the compounds against the FAK1 enzyme. [33]
- Data Analysis: The experimental results are analyzed to confirm whether the compounds show the predicted biological activity. The success of the entire workflow is measured by the "hit rate"—the percentage of tested virtual hits that confirm activity in the experimental assay.
- Iterative Refinement (Optional): The experimental results for the new hits can be used to further refine and improve the original pharmacophore model, creating a feedback loop for future screening campaigns.
The Scientist's Toolkit
Table 2: Essential Research Reagents and Software Solutions for External Validation
| Tool Name / Resource | Type | Primary Function in Workflow |
|---|---|---|
| LigandScout [33] [75] | Software | Primary software for creating structure-based and ligand-based pharmacophore models and performing advanced pharmacophore screening. |
| DUD-E (Database of Useful Decoys: Enhanced) [33] | Database | Provides a robust set of decoy molecules for validating a model's ability to discriminate actives from inactives. |
| ZINC Database [72] | Database | A publicly accessible repository of commercially available compounds for prospective virtual screening. |
| ChEMBL Database [73] [72] | Database | A manually curated database of bioactive molecules with drug-like properties, used for sourcing known active ligands and their activity data. |
| RDKit [57] [35] | Open-Source Cheminformatics | Used for fundamental cheminformatics tasks like molecular standardization, descriptor calculation, and conformer generation. |
| GOLD / AutoDock [74] [75] | Docking Software | Used for secondary in silico validation to study binding modes and predict affinity of virtual hits. |
| Schrödinger Phase [77] | Software Suite | An integrated tool for developing pharmacophore hypotheses, creating screened databases, and running virtual screens. |
External validation through prospective screening and experimental confirmation is the cornerstone of a credible ligand-based pharmacophore modeling workflow. By adhering to the detailed protocols for decoy set validation, multi-conformer database screening, and rigorous post-screening filtration, researchers can significantly increase the probability of identifying novel, experimentally verifiable lead compounds. The integration of these computational strategies with wet-lab experimentation creates a powerful, iterative pipeline for accelerating drug discovery against increasingly challenging biological targets.
In the context of ligand-based pharmacophore modeling with LigandScout, evaluating the predictive performance of generated models is crucial for successful virtual screening. The Receiver Operating Characteristic (ROC) curve and the Area Under the Curve (AUC) are fundamental metrics for this quantitative assessment [78]. The ROC curve visually represents the performance of a binary classifier—in this case, a pharmacophore model distinguishing active from inactive compounds—across all possible classification thresholds [79]. The AUC summarizes this performance as a single numerical value, representing the probability that the model will rank a randomly chosen active compound higher than a randomly chosen inactive one [79]. This evaluation is particularly valuable in pharmacophore modeling, where researchers must balance the identification of true active compounds (sensitivity) against the rejection of inactive compounds (specificity) before proceeding with costly experimental validation.
Theoretical Foundation of ROC and AUC
The ROC Curve
The ROC curve is a two-dimensional plot of the True Positive Rate (TPR) against the False Positive Rate (FPR) at various classification thresholds [78].
- True Positive Rate (TPR/Recall/Sensitivity): The proportion of actual active compounds correctly identified by the model. It is calculated as TPR = TP / (TP + FN), where TP is True Positives and FN is False Negatives [78] [57].
- False Positive Rate (FPR): The proportion of actual inactive compounds incorrectly classified as active by the model. It is calculated as FPR = FP / (FP + TN), where FP is False Positives and TN is True Negatives [78].
A perfect model would achieve a TPR of 1 and an FPR of 0, positioning its curve at the top-left corner of the graph. A random classifier, which has no discriminative power, would produce a diagonal line from (0,0) to (1,1), where TPR equals FPR at every threshold [78] [79].
The AUC Score
The Area Under the ROC Curve (AUC) provides a single number that summarizes the model's overall ability to discriminate between active and inactive compounds [78]. The AUC value ranges from 0 to 1, where:
- AUC = 1.0: Represents a perfect classifier.
- AUC = 0.5: Indicates performance equivalent to random guessing.
- AUC < 0.5: Suggests the model performs worse than random chance [79] [80].
The AUC is particularly useful for comparing multiple pharmacophore models, as a higher AUC value generally indicates better predictive performance across all possible classification thresholds [79].
ROC and AUC Analysis in LigandScout
Integration within the Pharmacophore Modeling Workflow
LigandScout provides integrated functionality for accurate virtual screening based on 3D chemical feature pharmacophore models and includes tools for performance assessment, including the automated generation of ROC curves [81]. This capability allows researchers to quantitatively evaluate their pharmacophore models directly within the same environment used for model creation and screening. The evaluation process typically occurs after pharmacophore model generation but before large-scale virtual screening, ensuring that only models with sufficient predictive power are deployed.
Performance Interpretation Guidelines
The following table provides standard interpretations of AUC values in the context of pharmacophore model quality:
Table 1: Interpretation of AUC Values for Pharmacophore Models
| AUC Value Range | Model Performance Interpretation | Utility for Virtual Screening |
|---|---|---|
| 0.9 - 1.0 | Excellent | Highly reliable for hit identification |
| 0.8 - 0.9 | Good | Very useful for virtual screening |
| 0.7 - 0.8 | Fair | Moderately useful with caution |
| 0.6 - 0.7 | Poor | Limited utility |
| 0.5 - 0.6 | Fail | No better than random guessing |
As a rule of thumb, a pharmacophore model with an AUC score above 0.8 is considered good, while a score above 0.9 is considered excellent for practical virtual screening applications [78].
Experimental Protocol for ROC Analysis in LigandScout
Protocol: ROC Curve Generation and Model Validation
This protocol describes the complete workflow for generating and validating a ligand-based pharmacophore model using ROC analysis in LigandScout.
Table 2: Protocol for ROC Curve Generation and Model Validation
| Step | Procedure | Purpose | Key Parameters |
|---|---|---|---|
| 1. Data Preparation | Prepare a curated set of known active and inactive compounds. | Provides ground truth data for model training and validation. | - Actives: pIC₅₀ ≥ 7.0 [77]- Inactives: pIC₅₀ ≤ 5.0 [77] |
| 2. Model Generation | Create pharmacophore hypotheses using LigandScout's ligand-based approach. | Generates candidate models for evaluation. | - Feature range: 4-6 features [77]- Actives matching: ≥70% [77] |
| 3. Virtual Screening | Screen the validation set against the generated pharmacophore model. | Tests model's ability to distinguish actives from inactives. | - Use prepared Phase database [77]- Conformer generation: 100 conformers/compound [73] |
| 4. ROC Curve Generation | Use LigandScout's automated ROC curve generation tool. | Visualizes model performance across all thresholds. | - TPR vs. FPR calculation [78]- Threshold sampling: 50+ points |
| 5. AUC Calculation | Compute the area under the ROC curve. | Provides single metric for model comparison. | - Trapezoidal rule [78]- Statistical significance testing |
| 6. Threshold Selection | Identify optimal operating point on ROC curve. | Determines practical classification threshold for screening. | - Balance TPR and FPR based on project goals [79] |
Diagram 1: ROC Analysis Workflow in LigandScout
Protocol: Cross-Validation of Multiple Pharmacophore Models
This protocol describes the comparative evaluation of multiple pharmacophore hypotheses using ROC AUC analysis.
Table 3: Protocol for Comparative Model Evaluation
| Step | Procedure | Purpose | Key Parameters |
|---|---|---|---|
| 1. Multiple Hypothesis Generation | Create several pharmacophore models with different feature combinations. | Generates candidate models for comparative evaluation. | - Vary feature types and spatial arrangements [7]- Different training set compositions [57] |
| 2. Consistent Validation Set | Apply all models to the same validation set of actives and inactives. | Ensures fair comparison between models. | - Same compound set for all models- Consistent screening parameters |
| 3. ROC Curve Generation | Generate ROC curves for each model using LigandScout. | Enables visual comparison of model performance. | - Overlay curves for direct comparison- Consistent axis scaling |
| 4. AUC Calculation | Compute AUC for each model. | Provides quantitative ranking of models. | - Statistical comparison of AUC values- Confidence interval estimation |
| 5. Model Selection | Select the best-performing model based on AUC and curve shape. | Identifies optimal model for virtual screening. | - Highest AUC value- Curve position in top-left region |
The Scientist's Toolkit: Essential Research Reagents and Materials
Table 4: Essential Research Reagents and Computational Tools
| Tool/Reagent | Function in ROC Analysis | Application Notes |
|---|---|---|
| LigandScout Software | Integrated pharmacophore modeling and ROC curve generation | Primary tool for model creation, screening, and performance evaluation [81] |
| Curated Compound Database | Provides active/inactive compounds for model training and validation | Use public databases (ChEMBL) or proprietary collections; categorize by activity (e.g., pIC₅₀ ≥7.0 for actives) [73] [77] |
| Phase Database (Schrödinger) | Optimized compound storage for rapid screening | Screening compounds from a prepared Phase database is ~2-3 times faster than screening from files [77] |
| ROC Curve Analysis Module | Automated calculation of TPR, FPR, and AUC within LigandScout | Generates performance visualization and quantitative metrics for model validation [81] |
| Excluded Volume Shells | Defines steric constraints based on molecular shapes of actives/inactives | Improves model selectivity; created from both active and inactive compounds to define forbidden regions [77] |
Critical Factors Influencing ROC Analysis
Dataset Composition and Quality
The quality of ROC analysis is highly dependent on the composition of the validation dataset. Several factors must be considered:
- Activity Thresholds: Clear and biologically relevant thresholds must be established to categorize compounds as "active" or "inactive." For example, in 17β-HSD2 inhibitor studies, compounds with IC₅₀ ≤ 50 nM (pIC₅₀ ≥ 7.3) are typically classified as active, while those with IC₅₀ ≥ 10 μM (pIC₅₀ ≤ 5.0) are classified as inactive [77].
- Structural Diversity: The validation set should include structurally diverse compounds to avoid bias and ensure the model generalizes well to novel chemotypes [7].
- Decoy Compounds: Using purpose-built decoy sets like DUD-E (Database of Useful Decoys: Enhanced) can provide more realistic performance estimates by including decoys with similar physicochemical properties but different 2D topology compared to actives [77].
Threshold Selection and Practical Considerations
While AUC provides an overall measure of model quality, the practical implementation requires selecting an appropriate classification threshold:
- Conservative Threshold (High Specificity): Selecting a threshold that gives a lower FPR (e.g., point A on the ROC curve) minimizes false alarms but may reduce the number of true positives identified. This is preferable when false positives are highly costly [79].
- Balanced Threshold: A middle-ground approach (e.g., point B) balances TPR and FPR when the costs of false positives and false negatives are roughly equivalent [79].
- Sensitive Threshold (High Sensitivity): A threshold that maximizes TPR (e.g., point C) identifies more true positives at the cost of more false positives. This is appropriate when false negatives are highly costly [79].
Advanced Applications and Interpretation
Addressing Dataset Imbalance
In real-world drug discovery, the number of known active compounds is often much smaller than the number of inactive compounds, creating imbalanced datasets. While ROC AUC is generally reliable for balanced datasets [78], highly imbalanced situations may require complementary metrics:
- Precision-Recall Curves: For imbalanced datasets, precision-recall curves may offer better comparative visualization of model performance than ROC curves [79].
- F-Score: The F-score, particularly F₂ (which emphasizes recall) or F₀.₅ (which emphasizes precision), can provide additional insights tailored to specific screening goals [57].
Model Refinement Based on ROC Analysis
ROC analysis not only evaluates model performance but also guides model refinement:
- Feature Optimization: Models with suboptimal AUC scores can be improved by adjusting feature definitions, spatial tolerances, or excluded volumes [7] [77].
- Multi-Model Screening: Using several restrictive models complementing each other in their hit lists can achieve better overall enrichment than relying on a single model [7].
- Iterative Improvement: The modeling process should be iterative, with ROC analysis guiding successive rounds of model refinement until satisfactory performance is achieved.
By systematically applying ROC curve and AUC analysis within LigandScout, researchers can quantitatively validate pharmacophore models, select optimal screening parameters, and maximize the likelihood of successful virtual screening campaigns in drug discovery.
Comparing Ligand-Based vs. Structure-Based Pharmacophore Models
Pharmacophore modeling is a foundational technique in computer-aided drug discovery that abstracts the essential steric and electronic features necessary for a molecule to interact with a biological target and trigger a pharmacological response [15]. The International Union of Pure and Applied Chemistry (IUPAC) defines a pharmacophore as "the ensemble of steric and electronic features that is necessary to ensure the optimal supra-molecular interactions with a specific biological target structure and to trigger (or to block) its biological response" [15]. These models represent chemical functionalities as geometric entities such as spheres, planes, and vectors rather than focusing on specific atoms or scaffolds, making them excellent tools for recognizing similarities between structurally diverse molecules [15].
The two primary computational approaches for pharmacophore modeling—ligand-based and structure-based—differ fundamentally in their input data requirements and methodological foundations [40]. Ligand-based methods derive pharmacophore features from the structural alignment and common chemical characteristics of known active compounds, while structure-based approaches extract interaction information directly from three-dimensional protein-ligand complexes [40] [15]. The selection between these approaches depends on data availability, quality, computational resources, and the intended application of the generated models [15]. This application note provides a comprehensive comparison of these methodologies, with particular emphasis on their implementation within ligand-based pharmacophore modeling workflows using LigandScout.
Fundamental Conceptual Comparison
Definition and Data Requirements
Ligand-Based Pharmacophore Modeling involves developing a hypothesis by identifying the common chemical features shared by a set of known active ligands that interact with the same biological target [40] [22]. This approach requires only the three-dimensional structures of active compounds and their biological activity data, making it particularly valuable when the macromolecular target structure is unknown or difficult to obtain [82]. The fundamental premise is that compounds sharing common spatial arrangements of chemical features likely exhibit similar biological activities against the same target [15].
Structure-Based Pharmacophore Modeling relies on the three-dimensional structural information of the target protein, typically obtained through X-ray crystallography, nuclear magnetic resonance (NMR) spectroscopy, or cryo-electron microscopy (cryo-EM) [15] [82]. This method analyzes the interactions between a ligand and its target binding site to derive pharmacophore features directly from the complementary structural and electronic environment [40]. The availability of a protein-ligand complex structure allows for the most accurate pharmacophore generation by capturing the bioactive conformation of the ligand and its specific interactions with key residues in the binding pocket [15].
Table 1: Fundamental Comparison of Ligand-Based and Structure-Based Pharmacophore Modeling Approaches
| Aspect | Ligand-Based Approach | Structure-Based Approach |
|---|---|---|
| Primary Data Source | Known active ligands [40] | 3D structure of target protein or protein-ligand complex [15] |
| Target Structure Requirement | Not required [82] | Essential (experimental or homology model) [15] |
| Key Assumption | Active compounds share common chemical features [15] | Ligands must complement the binding site [40] |
| Experimental Structure Methods | Not applicable | X-ray crystallography, NMR, Cryo-EM [82] |
| Information Derived From | Molecular alignment of ligands [40] | Protein-ligand interaction analysis [15] |
Feature Representation and Pharmacophore Elements
Both ligand-based and structure-based pharmacophore models represent chemical functionalities as abstract features rather than specific atomic structures. The most common pharmacophore feature types include [15]:
- Hydrogen Bond Acceptors (HBA)
- Hydrogen Bond Donors (HBD)
- Hydrophobic areas (H)
- Positively/Negatively Ionizable groups (PI/NI)
- Aromatic rings (AR)
- Metal coordinating areas
Additionally, exclusion volumes (XVOL) can be incorporated to represent steric restrictions and forbidden areas within the binding pocket, providing crucial shape constraints that enhance model selectivity [15]. These features are typically represented as spheres with defined radii and tolerances to accommodate geometric variations among different ligands [40].
Ligand-Based Pharmacophore Modeling: Detailed Workflow and Protocols
The ligand-based pharmacophore modeling workflow comprises sequential stages from data preparation through model validation and application. The following diagram illustrates this comprehensive process:
Protocol for Ligand-Based Model Development
Step 1: Training Set Selection and Preparation
- Objective: Curate a structurally diverse set of compounds with confirmed biological activity against the target [40].
- Protocol:
- Select 10-30 active compounds spanning multiple chemical scaffolds and potency ranges [7].
- Include confirmed inactive compounds (decoys) for model validation [40].
- Prepare 3D structures of all compounds using energy minimization and geometry optimization.
- For the case study on 17β-HSD2 inhibitors, models were built using training sets of 2-3 structurally diverse active compounds with demonstrated potency [7].
Step 2: Conformational Analysis
- Objective: Generate representative conformational ensembles for each compound to account for flexibility [22].
- Protocol:
- Employ either "pre-enumerating" or "on-the-fly" methods to handle ligand flexibility [22].
- Use algorithms such as Monte Carlo Multiple Minimum or systematic torsional sampling.
- Set energy thresholds (typically 10-20 kcal/mol above global minimum) to define relevant conformational space.
- Ensure adequate coverage of potential bioactive conformations.
Step 3: Molecular Alignment
- Objective: Superimpose training compounds to identify spatially conserved chemical features [22].
- Protocol:
- Implement point-based algorithms (atom/fragment superposition) or property-based approaches (molecular field descriptors) [22].
- Use flexible alignment methods that allow torsional adjustments.
- Prioritize alignments that maximize volume overlap and feature correspondence.
- In the 17β-HSD2 study, common chemical features of training compounds were identified through alignment to generate initial pharmacophore hypotheses [7].
Step 4: Pharmacophore Feature Identification
- Objective: Define essential chemical features and their spatial relationships responsible for biological activity [40].
- Protocol:
- Analyze aligned conformations to identify conserved hydrogen bond donors/acceptors, hydrophobic regions, charged groups, and aromatic rings.
- Assign geometric tolerances to each feature based on observed variances in the alignment.
- Establish required features versus optional features based on conservation across the training set.
- For 17β-HSD2 models, features included hydrogen bond acceptors, donors, hydrophobic areas, and aromatic rings with some features marked as optional to balance sensitivity and specificity [7].
Step 5: Model Generation and Optimization
- Objective: Construct validated pharmacophore hypotheses capable discriminating active from inactive compounds [7].
- Protocol:
- Generate multiple pharmacophore hypotheses using different algorithmic approaches.
- Optimize feature combinations and tolerances to maximize retrieval of active compounds while excluding inactives.
- Apply exclusion volumes to represent steric constraints from the binding pocket when structural information is available.
- In successful 17β-HSD2 models, exclusion volumes (54-56 XVOLs) were critical for recognizing active compounds without retrieving inactive ones [7].
Model Validation Protocols
Objective: Quantitatively evaluate model quality and predictive power before application to virtual screening [7].
Protocol:
- Test Set Construction: Compile a validation set containing 15-30 known active compounds and 2-3 times as many confirmed inactive compounds (decoys) [40] [7].
- Enrichment Assessment: Screen the test set and calculate:
- Sensitivity: Ability to identify active compounds (true positive rate)
- Specificity: Ability to exclude inactive compounds (true negative rate)
- Enrichment Factor: Improvement over random selection
- Statistical Validation: Use receiver operating characteristic (ROC) curves and area under curve (AUC) metrics.
- Case Study Benchmark: In the 17β-HSD2 inhibitor study, three optimized models collectively achieved 87% sensitivity (retrieving 13 of 15 active compounds) with perfect specificity (excluding all 30 inactive compounds) [7].
Structure-Based Pharmacophore Modeling: Detailed Workflow and Protocols
Structure-based pharmacophore modeling derives features directly from protein-ligand complexes or binding site analysis. The workflow involves precise structure preparation and interaction analysis:
Protocol for Structure-Based Model Development
Step 1: Protein Structure Preparation
- Objective: Ensure high-quality, biologically relevant protein structure for accurate pharmacophore generation [15].
- Protocol:
- Source Selection: Obtain experimental structures from PDB (preferably ≤2.0Å resolution) or generate high-quality homology models [15].
- Structure Refinement: Add hydrogen atoms, optimize protonation states, correct missing residues/atoms, and assign appropriate charges.
- Quality Assessment: Evaluate stereochemical quality (Ramachandran plots), energy parameters, and overall biological plausibility.
- Multiple Structures: When available, use multiple protein-ligand complexes to account for binding site flexibility and different interaction patterns [83].
Step 2: Binding Site Analysis and Characterization
- Objective: Identify and characterize the ligand binding pocket and key interaction residues [15].
- Protocol:
- Site Identification: Use computational tools like GRID (molecular interaction fields) or LUDI (interaction site points) to define binding regions [15].
- Residue Analysis: Identify key residues involved in ligand recognition, especially those conserved across related targets or supported by mutational studies.
- Pocket Properties: Characterize shape, volume, hydrophobicity, and electrostatic properties of the binding site.
Step 3: Protein-Ligand Interaction Analysis
- Objective: Extract critical interaction patterns from complex structures to define pharmacophore features [15].
- Protocol:
- Analyze hydrogen bonding patterns (donors and acceptors) between ligand and protein residues.
- Identify hydrophobic contact areas and aromatic stacking interactions.
- Map charged interactions and metal coordination sites.
- In LXRβ case studies, analysis of multiple ligand-receptor complexes revealed conserved interaction patterns despite differences in binding poses [83].
Step 4: Pharmacophore Feature Generation
- Objective: Translate protein-ligand interactions into defined pharmacophore features with spatial constraints [15].
- Protocol:
- Convert identified interactions to corresponding pharmacophore features (HBA, HBD, H, etc.).
- Position features based on complementary protein atoms or interaction vectors.
- Define feature tolerances based on observed interaction geometries and protein flexibility.
- Select only essential features contributing significantly to binding energy to avoid over-constrained models [15].
Step 5: Exclusion Volume Assignment
- Objective: Incorporate steric constraints from the binding pocket to enhance model selectivity [15].
- Protocol:
- Place exclusion volumes (XVOL) on protein atoms lining the binding pocket.
- Adjust exclusion sphere radii based on van der Waals radii and observed packing densities.
- For flexible regions, consider using softer constraints or smaller exclusion volumes.
Comparative Analysis: Applications, Advantages, and Limitations
Strategic Considerations for Method Selection
Table 2: Comparative Analysis of Ligand-Based vs. Structure-Based Pharmacophore Approaches
| Parameter | Ligand-Based Pharmacophore | Structure-Based Pharmacophore |
|---|---|---|
| Data Requirements | Set of known active compounds [82] | 3D protein structure or protein-ligand complex [82] |
| Computational Cost | Moderate | Moderate to High |
| Key Advantages | No target structure needed; Scaffold hopping capability; Directly reflects ligand SAR [82] | Direct structural insights; Bioactive conformation; Exclusion volumes from binding site [15] |
| Major Limitations | Dependent on training set quality; No direct binding site information; May miss key features [84] | Requires high-quality structure; Binding site flexibility challenge; Possible over-representation of features [15] |
| Optimal Use Cases | Target structure unknown; Numerous active ligands available; Scaffold hopping [82] | High-resolution structure available; Structure-activity data limited; Rational design [15] |
| Virtual Screening Performance | Bias toward training set chemotypes; High scaffold diversity possible [40] | Enhanced selectivity; Potential novelty; Shape constraints improve specificity [15] |
| Handling Flexibility | Accounts for ligand flexibility through conformational sampling [22] | Protein flexibility challenging; Often requires multiple structures [84] |
Practical Implementation Challenges and Solutions
Ligand-Based Modeling Challenges:
- Training Set Diversity: Limited structural diversity in training compounds can result in overly specific models that miss valid chemotypes [40].
- Solution: Incorporate structurally diverse active compounds and apply multi-conformer analysis.
- Model Overfitting: Excessive features or tight tolerances may reduce model generality and scaffold-hopping potential [40].
- Solution: Use test sets with known actives and inactives for validation; implement feature weighting or optional features [7].
- Conformational Sampling: Inadequate sampling of bioactive conformations may lead to incorrect alignments and feature identification [22].
- Solution: Employ robust conformational search algorithms with appropriate energy windows.
Structure-Based Modeling Challenges:
- Protein Flexibility: Rigid protein structures may not represent the dynamic nature of binding sites, leading to incomplete models [84].
- Solution: Use multiple receptor conformations from different crystal structures or molecular dynamics simulations [83].
- Water-Mediated Interactions: Bridging water molecules can complicate feature definition and impact model accuracy [84].
- Solution: Carefully evaluate conserved water molecules and consider including as specific features when critical for binding.
- Feature Selection: Over-representation of features from abundant protein functional groups can create overly restrictive models [15].
- Solution: Prioritize features based on energetic contributions and evolutionary conservation.
Integrated Approaches and Advanced Applications
Hybrid Strategies Combining LB and SB Methods
Integrating ligand-based and structure-based approaches can overcome the limitations of individual methods and enhance virtual screening performance [84]. Three primary hybrid strategies have emerged:
Sequential Approaches:
- Workflow: Perform initial filtering using computationally efficient LB methods followed by more demanding SB techniques on the pre-filtered compound set [84].
- Advantage: Optimizes computational resource allocation while leveraging complementary strengths of both approaches.
- Application Example: In TGR5 agonist discovery, ligand-based pharmacophore screening was combined with molecular docking to identify novel agonists with EC₅₀ values as low as 7.7 μM [85].
Parallel Approaches:
- Workflow: Execute LB and SB virtual screening independently, then combine results through consensus scoring or rank aggregation [84].
- Advantage: Enhances robustness and reduces method-specific biases.
- Implementation: Use distinct LB and SB tools (e.g., LigandScout for both approaches) and merge hit lists based on complementary rankings.
Integrated Hybrid Approaches:
- Workflow: Incorporate both ligand and structure information simultaneously into a unified pharmacophore modeling framework [84].
- Advantage: Leverages all available information concurrently for optimal feature selection.
- Case Study: For LXRβ targets, combining multiple ligand alignments with protein binding site information yielded superior pharmacophore models that captured essential binding features despite high pocket flexibility [83].
Emerging Technologies and Future Directions
Pharmacophore-Informed Generative Models:
- TransPharmer Implementation: Novel generative framework that integrates ligand-based pharmacophore fingerprints with GPT-based molecular generation for de novo drug design [86].
- Scaffold Hopping Enhancement: Demonstrated capability to generate structurally novel bioactive compounds while maintaining key pharmacophoric features, as validated with DRD2 and PLK1 targets [86].
- Experimental Validation: Generated PLK1 inhibitors showed submicromolar to nanomolar activities (best compound IIP0943: 5.1 nM) with high selectivity, confirming model effectiveness [86].
Machine Learning Enhancements:
- Feature Optimization: ML algorithms can optimize feature selection and tolerances based on large-scale activity data.
- Flexibility Handling: Deep learning approaches can better account for protein and ligand flexibility in pharmacophore generation.
Table 3: Key Software Tools and Resources for Pharmacophore Modeling
| Tool/Resource | Type | Key Features | Application Context |
|---|---|---|---|
| LigandScout | Commercial Software | Both LB & SB modeling; User-friendly interface; Advanced Machine Learning [40] | Comprehensive pharmacophore modeling and virtual screening |
| MOE (Molecular Operating Environment) | Commercial Software | LB & SB capabilities; Integrated molecular modeling suite [40] | End-to-end drug design workflows |
| Pharmer | Open Source | LB pharmacophore modeling; Efficient database screening [40] | Ligand-based virtual screening |
| Align-it | Open Source | LB molecular alignment; Pharmacophore feature detection [40] | Ligand-based model generation |
| Pharmit | Web Server | SB virtual screening; Public database access [40] | Structure-based screening without local installation |
| PharmMapper | Web Server | SB pharmacophore matching; Target identification [40] | Reverse pharmacophore screening and target prediction |
| TransPharmer | Advanced Tool | Pharmacophore-informed generative AI; Scaffold hopping [86] | De novo molecular design with pharmacophore constraints |
Implementation Protocol for LigandScout in Ligand-Based Modeling
Software Overview: LigandScout provides comprehensive pharmacophore modeling capabilities supporting both ligand-based and structure-based approaches with advanced machine learning integrations [40].
Protocol for Ligand-Based Modeling with LigandScout:
- Training Set Preparation
- Import and prepare 3D structures of known active compounds
- Generate representative conformations using built-in algorithms
- Curate activity data and compound annotations
Model Generation
- Select diverse compound subset for hypothesis generation
- Perform automated structural alignment and common feature identification
- Adjust feature tolerances and definitions based on chemical knowledge
Model Validation
- Screen validation set containing active and decoy compounds
- Calculate enrichment factors and statistical performance metrics
- Optimize model parameters to balance sensitivity and specificity
Virtual Screening Application
- Prepare screening database (e.g., natural product libraries, commercial compounds)
- Execute high-throughput pharmacophore screening
- Analyze and prioritize hit compounds for further investigation
Ligand-based and structure-based pharmacophore modeling represent complementary approaches in modern drug discovery, each with distinct advantages and optimal application domains. Ligand-based methods excel when structural target information is limited but sufficient active ligands are available, offering exceptional scaffold-hopping potential and direct reflection of structure-activity relationships. Structure-based approaches provide invaluable insights when high-quality target structures exist, enabling rational design informed by precise binding site complementarity.
The integration of both methodologies through hybrid strategies increasingly demonstrates enhanced performance over individual approaches, leveraging their complementary strengths while mitigating inherent limitations. Emerging technologies, particularly pharmacophore-informed generative models like TransPharmer, represent promising directions for advancing the field through AI-driven de novo molecular design constrained by pharmacophoric principles.
For researchers implementing ligand-based pharmacophore modeling workflows in LigandScout, success depends critically on thoughtful training set selection, robust conformational sampling, rigorous model validation, and appropriate application to virtual screening campaigns. When applied systematically within integrated drug discovery pipelines, pharmacophore modeling continues to provide powerful tools for identifying novel bioactive compounds across diverse therapeutic targets.
Integrating Pharmacophore Screening with Molecular Docking and QSAR
The rapid identification of novel bioactive molecules is a constant pursuit in drug discovery. Computer-Aided Drug Design (CADD) employs computational power to accelerate this process by selecting the most promising lead candidates for biological testing before synthesis [15]. Within the CADD toolkit, pharmacophore modeling, molecular docking, and Quantitative Structure-Activity Relationship (QSAR) modeling are foundational techniques. While each method is powerful individually, their strategic integration into a cohesive workflow creates a synergistic effect that mitigates the limitations of any single approach and significantly enhances the efficiency and success rate of virtual screening campaigns [84]. This protocol details the application of such an integrated framework, utilizing LigandScout for pharmacophore modeling, within a comprehensive ligand-based drug design strategy.
The core principle of this integration leverages the complementary strengths of each method. Pharmacophore models provide an abstract yet powerful representation of the steric and electronic features essential for a ligand's biological activity, enabling rapid screening of large chemical libraries [15]. QSAR models add a quantitative predictive layer, forecasting the potency of hits identified by the pharmacophore [87]. Finally, molecular docking offers an atomic-level insight into the binding mode and affinity of these potential hits within the target's binding site, validating the hypotheses generated by the previous steps [87] [47]. This multi-tiered filtering ensures that only the most promising candidates are recommended for costly experimental validation.
The integration of pharmacophore screening, QSAR, and molecular docking typically follows a sequential filtering approach [84]. This strategy progressively narrows down a vast virtual library to a manageable number of high-confidence hits through consecutive computational stages. The general workflow, illustrated in Figure 1, begins with pharmacophore-based screening of a compound database. Hits from this initial stage are then subjected to a QSAR model to predict their biological activity (e.g., pIC50). Compounds predicted to be potent are subsequently processed through molecular docking to evaluate their binding pose and affinity. The final output is a prioritized list of lead compounds for experimental assay.
Diagram: Sequential Virtual Screening Workflow
Figure 1: A sequential virtual screening workflow. The virtual compound library is progressively filtered through pharmacophore matching, QSAR-based activity prediction, and molecular docking to identify high-priority lead candidates for experimental validation.
Theoretical Background
Pharmacophore Modeling with LigandScout
A pharmacophore is defined by the International Union of Pure and Applied Chemistry (IUPAC) as "the ensemble of steric and electronic features that is necessary to ensure the optimal supra-molecular interactions with a specific biological target structure and to trigger (or to block) its biological response" [15]. In practice, a pharmacophore model represents key molecular interactions as three-dimensional geometric entities such as points, spheres, and vectors.
Ligand-based pharmacophore modeling, as implemented in LigandScout, derives these features from a set of known active ligands. The software identifies common chemical functionalities and their spatial arrangements across multiple ligands, creating a hypothesis for the essential features responsible for biological activity [87] [15]. The primary pharmacophore features used in LigandScout are summarized in Table 1.
Table 1: Key pharmacophore features in LigandScout and their representations [88] [15].
| Feature Name | Abbreviation | Description | Common Functional Groups |
|---|---|---|---|
| Hydrogen Bond Acceptor | HBA | Atom that can accept a hydrogen bond. | Carbonyl oxygen, nitro groups, ether oxygens. |
| Hydrogen Bond Donor | HBD | Atom that can donate a hydrogen bond. | Amine groups, hydroxyl groups. |
| Hydrophobic Area | H | Region of the ligand with hydrophobic character. | Alkyl chains, aromatic rings. |
| Aromatic Ring | AR | Planar, conjugated ring system. | Phenyl, pyridine rings. |
| Positive Ionizable | PI | Group that can carry a positive charge. | Protonated amines. |
| Negative Ionizable | NI | Group that can carry a negative charge. | Carboxylic acids, tetrazoles. |
Quantitative Structure-Activity Relationship (QSAR)
QSAR is a computational modeling method that relates a molecule's quantitative properties (descriptors) to its biological activity [87]. The core assumption is that structurally similar compounds exhibit similar biological activities. A QSAR model is built using a training set of compounds with known activities, and the resulting mathematical model can predict the activity of new, untested compounds. Multiple Linear Regression (MLR) is a commonly used method for building QSAR models, producing statistically significant models for activity prediction, as demonstrated in the development of COX-2 inhibitors with high predictive power for both training and test sets [87].
Molecular Docking
Molecular docking predicts the preferred orientation (pose) of a small molecule (ligand) when bound to a macromolecular target (receptor) [84]. The goal is to predict the binding affinity, which correlates with the ligand's biological potency. Docking is a structure-based method that evaluates the complementarity between the ligand and the protein's binding site in terms of shape and intermolecular interactions (e.g., hydrogen bonds, hydrophobic contacts, electrostatic interactions) [47].
Application Notes: A Case Study on COX-2 Inhibitors
To illustrate the practical application and effectiveness of the integrated workflow, we summarize a case study on identifying novel Cyclooxygenase-2 (COX-2) inhibitors [87].
Objectives and Workflow
The study aimed to discover novel, selective COX-2 inhibitors from a library of 43 authenticated botanical compounds and the ZINC database. The researchers employed a sequential workflow:
- A 3D pharmacophore model was developed from a series of potent cyclic imide derivatives using LigandScout.
- The model was used for the initial virtual screening of the compound libraries.
- Retrieved hits were filtered based on predicted pIC50 from a previously developed and validated QSAR model.
- The resulting compounds were subjected to molecular docking to investigate their binding mode and affinity within the COX-2 active site.
- The top hits from docking were further evaluated using molecular dynamics simulations.
Key Results and Validation
The integrated approach successfully identified several promising hits. The pharmacophore model demonstrated a strong ability to distinguish active compounds, validated by high scores for the Area Under the ROC Curve (AUC) and other metrics [87]. The QSAR model showed high predictive power with strong correlation coefficients for both training and test sets [87]. Docking results prioritized nine molecules as promising leads, with most having no previously reported COX-2 inhibitory activity. This highlights the workflow's capability for novel lead discovery.
Table 2: Key validation metrics for the pharmacophore and QSAR models from the COX-2 inhibitor case study [87].
| Model Type | Validation Metric | Reported Value | Interpretation |
|---|---|---|---|
| Pharmacophore Model | Area Under the Curve (AUC) | High (value not specified) | Excellent classifier, high ability to differentiate actives from inactives. |
| Sensitivity / Specificity | High (values not specified) | Model correctly classifies active compounds and excludes inactives. | |
| QSAR Model (MLR) | R²training | 0.763 | Good fit for the training set data. |
| R²test | 0.96 | Excellent predictive power for the external test set. | |
| Q²training | 0.66 | Model has good internal predictive ability. | |
| Q²test | 0.84 | Model has strong predictive ability for the external test set. |
Experimental Protocols
Protocol 1: Ligand-Based Pharmacophore Modeling with LigandScout
This protocol describes the steps for generating a ligand-based pharmacophore model using a set of known active compounds.
5.1.1. Software and Reagents
- Software: LigandScout Advanced (v4.4.1 or higher).
- Input: 2D or 3D structures of 3-5 known potent active compounds (e.g., in SDF or MOL format). Their experimental biological activities (e.g., IC50) should be known.
5.1.2. Step-by-Step Procedure
- Ligand Preparation:
- Construct the 3D structures of all training set compounds if starting from 2D.
- Perform energy minimization to ensure reasonable geometries.
- Conformational Generation and Clustering:
- Import the prepared ligands into LigandScout.
- Use the software's built-in algorithm to generate a diverse conformational ensemble for each ligand. The number of conformations should be sufficient to represent flexibility but kept low for computational efficiency [87].
- LigandScout's clustering method will automatically divide the ligands into test and training sets based on 3D pharmacophore similarity [87].
- Pharmacophore Hypothesis Generation:
- Using the training set molecules, project pharmacophore features onto all generated conformations.
- The software will align all conformations of the top-ranked (least flexible) molecules using its molecular alignment algorithm [87].
- Identify and build the pharmacophore model based on common features shared across the aligned active ligands.
- Model Validation (Critical Step):
- Assess the model's quality by screening a decoy set containing known active and inactive compounds (e.g., from DUD-E database) [87].
- Calculate key validation metrics:
- Sensitivity (True Positive Rate): The proportion of actual active compounds correctly identified.
Sensitivity = True Positives / (True Positives + False Negatives)[87]. - Specificity (True Negative Rate): The proportion of actual inactive compounds correctly excluded.
Specificity = True Negatives / (True Negatives + False Positives)[87]. - Enrichment Factor (EF) and Goodness of Hit Score (GH).
- Area Under the ROC Curve (AUC): A value of 1 indicates a perfect classifier, while 0.5 indicates a random classifier [87].
- Sensitivity (True Positive Rate): The proportion of actual active compounds correctly identified.
- Only proceed with a model that shows satisfactory predictive ability, specificity, and sensitivity.
Protocol 2: Sequential Virtual Screening Workflow
This protocol outlines the integrated process of using a validated pharmacophore model, QSAR, and docking for virtual screening.
5.2.1. Software and Reagents
- Software: LigandScout, QSAR modeling software (e.g., using MLR in a statistical package), Molecular docking software (e.g., AutoDock, AutoDock Vina, PLANTS).
- Input: Validated pharmacophore model, validated QSAR model, target protein structure (e.g., PDB ID), virtual compound library (e.g., ZINC15, In-house database).
5.2.2. Step-by-Step Procedure
- Pharmacophore-based Virtual Screening (First Filter):
- Load the validated pharmacophore model as a query in LigandScout.
- Screen the entire virtual compound library (e.g., ZINC15).
- Retrieve hits based on a predefined pharmacophore-fit score threshold. This step rapidly reduces the library size by several orders of magnitude.
- QSAR-based Activity Prediction (Second Filter):
- For the pharmacophore-fit filtered hits, calculate the relevant molecular descriptors required by the pre-validated QSAR model.
- Input the descriptors into the QSAR model to predict the biological activity (e.g., pIC50) for each hit.
- Apply a potency filter (e.g., predicted pIC50 > a certain cutoff) to retain only compounds predicted to be highly active.
- Molecular Docking (Third Filter):
- Prepare the protein structure: add hydrogen atoms, assign partial charges, and define the binding site grid.
- Dock the QSAR-predicted active hits into the target's binding site using a docking program like AutoDock Vina [47].
- For increased reliability, use comparative molecular docking with more than one docking engine (e.g., both AutoDock and AutoDock Vina) and apply consensus scoring to prioritize hits that rank highly across different programs [47].
- Analyze the docking poses of the top-ranked compounds. Prioritize hits that form key interactions with the protein's active site residues, similar to a native ligand or known active compound.
- Final Hit Selection and Analysis:
- Apply additional filters, such as Lipinski's Rule of Five, to assess the drug-likeness of the final hits [87].
- The output is a prioritized list of candidate molecules recommended for experimental testing.
The Scientist's Toolkit: Essential Research Reagents & Software
Table 3: Key software tools and their functions in the integrated pharmacophore-docking-QSAR workflow.
| Tool Name | Type / Category | Primary Function in the Workflow | Availability / Reference |
|---|---|---|---|
| LigandScout | Software | Ligand-based and structure-based pharmacophore model creation, visualization, and virtual screening. | Commercial [87] |
| ZINC15 | Database | Publicly accessible library of commercially available compounds for virtual screening. | Free [87] [88] |
| DUD-E | Database | Database of Useful Decoys: Enhanced; provides decoy molecules for pharmacophore model validation. | Free [87] |
| AutoDock Vina | Software | Molecular docking program for predicting ligand binding poses and affinities. | Free [47] |
| PyMOL | Software | Molecular visualization system for analyzing protein-ligand complexes and docking results. | Commercial / Free |
| ChEMBL | Database | Database of bioactive molecules with drug-like properties and their reported activities. | Free [89] |
| RCSB PDB | Database | Protein Data Bank; primary repository for 3D structural data of proteins and nucleic acids. | Free [15] |
Conclusion
Ligand-based pharmacophore modeling with LigandScout represents a powerful and efficient strategy for hit identification in drug discovery, especially when structural data for the target protein is limited. The workflow's strength lies in its ability to distill the essential 3D chemical features responsible for biological activity from a set of known ligands. A successfully built and validated model can significantly enrich virtual screening campaigns, as demonstrated in case studies targeting enzymes and kinases. Future directions point towards greater integration with other computational methods, such as molecular dynamics simulations to account for protein flexibility, and the application of machine learning to enhance feature selection and model accuracy. As these tools evolve, they hold the promise of accelerating the discovery of novel therapeutics for complex diseases, ultimately bridging the gap between computational prediction and clinical application.
References
- 1. IUPAC - pharmacophore (11485) [https://goldbook.iupac.org/terms/view/11485]
- 2. Pharmacophore - an overview [https://www.sciencedirect.com/topics/medicine-and-dentistry/pharmacophore]
- 3. Pharmacophore modeling and applications in drug discovery [https://www.sciencedirect.com/science/article/abs/pii/S135964461000111X]
- 4. Setting the record straight: the origin of the pharmacophore ... [https://pubmed.ncbi.nlm.nih.gov/24745881/]
- 5. Pharmacophore [https://en.wikipedia.org/wiki/Pharmacophore]
- 6. Ligand-Based Pharmacophore Modeling, Molecular ... [https://www.mdpi.com/1422-0067/21/20/7779]
- 7. Ligand-Based Pharmacophore Modeling and Virtual ... [https://pmc.ncbi.nlm.nih.gov/articles/PMC4111740/]
- 8. Ligand-based pharmacophore modeling targeting the ... [https://www.sciencedirect.com/science/article/pii/S2950363924000218]
- 9. Recent advances in molecular representation methods and ... [https://www.nature.com/articles/s44386-025-00017-2]
- 10. Leveraging ligand-based and structure-based approaches ... [https://www.iptonline.com/articles/leveraging-ligand-based-and-structure-based-approaches-for-advan]
- 11. 3.3. Ligand-Based Pharmacophore Modeling and Virtual ... [https://bio-protocol.org/exchange/minidetail?id=3612397&type=30]
- 12. Merging Ligand-Based and Structure-Based Methods in ... [https://www.mdpi.com/1420-3049/25/20/4723]
- 13. Ligand-based virtual screening and QSAR modelling for ... [https://www.sciencedirect.com/science/article/pii/S3050787125000435]
- 14. Computational approaches streamlining drug discovery [https://www.nature.com/articles/s41586-023-05905-z]
- 15. Drug Design by Pharmacophore and Virtual Screening ... [https://pmc.ncbi.nlm.nih.gov/articles/PMC9145410/]
- 16. In-Silico discovery of novel cephalosporin antibiotic ... [https://pmc.ncbi.nlm.nih.gov/articles/PMC12167095/]
- 17. Pharmacophore modeling. [https://bio-protocol.org/exchange/minidetail?id=1846694&type=30]
- 18. Pharmacophore model-aided virtual screening combined with ... [https://arabjchem.org/pharmacophore-model-aided-virtual-screening-combined-with-comparative-molecular-docking-and-molecular-dynamics-for-identification-of-marine-natural-products-as-sars-cov-2-papain-like-protease-inhibito/]
- 19. Pharmacophore Modeling for Targets with Extensive ... [https://www.jove.com/t/68933/pharmacophore-modeling-for-targets-with-extensive-ligand-libraries]
- 20. LigandScout - Wikipedia [https://en.wikipedia.org/wiki/LigandScout]
- 21. A Review of LigandScout – Macs in Chemistry [https://macinchem.org/2023/03/13/a-review-of-ligandscout/]
- 22. Ligand-based Pharmacophore Modeling [https://www.creative-biolabs.com/ligand-based-pharmacophore-modeling.html]
- 23. dyphAI dynamic pharmacophore modeling with AI: a tool ... [https://www.frontiersin.org/journals/chemistry/articles/10.3389/fchem.2025.1479763/full]
- 24. Knowledge-guided diffusion model for 3D ligand ... [https://www.nature.com/articles/s41467-025-57485-3]
- 25. LigandScout Remote : Overview - Inte:Ligand Docs [https://docs.inteligand.com/ls-remote/]
- 26. A New User-Friendly Interface for HPC and Cloud Resources [https://pubmed.ncbi.nlm.nih.gov/30540457/]
- 27. A new User-Friendly Interface for HPC and Cloud Resources [https://ucrisportal.univie.ac.at/en/publications/ligandscout-remote-a-new-user-friendly-interface-for-hpc-and-clou]
- 28. LigandScout Download - LigandScout creates 3D ... [https://ligandscout.software.informer.com/]
- 29. 4.4. Pharmacophore Modeling Protocol [https://bio-protocol.org/exchange/minidetail?id=9247349&type=30]
- 30. Ligand-based pharmacophore modeling, virtual screening ... [https://pmc.ncbi.nlm.nih.gov/articles/PMC8695346/]
- 31. Ligand based pharmacophore modelling and integrated ... [https://pubs.rsc.org/en/content/articlehtml/2024/ra/d3ra08618f]
- 32. Ligand-based Pharmacophore Modeling, Virtual Screening ... [https://www.sciencedirect.com/science/article/pii/S2001037018302617]
- 33. Integrative Ligand-Based Pharmacophore Modeling, Virtual ... [https://pmc.ncbi.nlm.nih.gov/articles/PMC9912262/]
- 34. Ligand-Based Pharmacophore Modeling Using Novel 3D ... [https://www.mdpi.com/1420-3049/23/12/3094]
- 35. T009 · Ligand-based pharmacophores [https://projects.volkamerlab.org/teachopencadd/talktorials/T009_compound_ensemble_pharmacophores.html]
- 36. Pharmacophore modeling | Medicinal Chemistry Class Notes [https://fiveable.me/medicinal-chemistry/unit-11/pharmacophore-modeling/study-guide/uZjEWlQXMHLmcu3u]
- 37. Concepts and Applications Exemplified on Hydroxysteroid ... [https://www.mdpi.com/1420-3049/20/12/19880]
- 38. PharmacoForge: pharmacophore generation with diffusion ... [https://www.frontiersin.org/journals/bioinformatics/articles/10.3389/fbinf.2025.1628800/full]
- 39. A New Fragment‐Based Pharmacophore Virtual Screening ... [https://pmc.ncbi.nlm.nih.gov/articles/PMC12412281/]
- 40. Ligand-Based and Structure-Based Pharmacophore ... [https://bio-protocol.org/exchange/minidetail?id=9587520&type=30]
- 41. Structure based pharmacophore modeling, virtual ... [https://www.nature.com/articles/s41598-021-83626-x]
- 42. Ligand and Pharmacophore based Design | BIOVIA [https://www.3ds.com/products/biovia/discovery-studio/ligand-and-pharmacophore-based-design]
- 43. Ligand-based Pharmacophore Modeling, Virtual Screening ... [https://pmc.ncbi.nlm.nih.gov/articles/PMC6396084/]
- 44. Non-Extensive Fragmentation of Natural Products and ... [https://pmc.ncbi.nlm.nih.gov/articles/PMC8377161/]
- 45. Prospective performance evaluation of selected common ... [https://www.sciencedirect.com/science/article/pii/S0223523415002664]
- 46. Pharmacophore-based virtual screening versus docking ... [https://www.nature.com/articles/aps2009159]
- 47. Pharmacophore model-aided virtual screening combined ... [https://www.sciencedirect.com/science/article/pii/S1878535222006505]
- 48. Dual EGFR-VEGF Pathway Inhibition: A Promising Strategy ... [https://www.sciencedirect.com/science/article/pii/S1556086420308145]
- 49. Novel benzothiazole-based dual VEGFR-2/EGFR ... [https://www.sciencedirect.com/science/article/abs/pii/S0960894X22000051]
- 50. VEGF-A/VEGFR2 signaling network in endothelial cells ... [https://pmc.ncbi.nlm.nih.gov/articles/PMC5143324/]
- 51. Recent progress on vascular endothelial growth factor ... [https://jhoonline.biomedcentral.com/articles/10.1186/s13045-022-01310-7]
- 52. Molecular Bases of VEGFR-2-Mediated Physiological ... [https://www.frontiersin.org/journals/cell-and-developmental-biology/articles/10.3389/fcell.2020.599281/full]
- 53. Dual EGFR/VEGFR2 inhibitors and apoptosis inducers [https://pubmed.ncbi.nlm.nih.gov/33252142/]
- 54. ELIXIR-A: An Interactive Visualization Tool for Multi-Target ... [https://pmc.ncbi.nlm.nih.gov/articles/PMC9025992/]
- 55. Pharmacophore modeling and QSAR analysis of anti-HBV ... [https://journals.plos.org/plosone/article?id=10.1371/journal.pone.0316765]
- 56. exploration of ligand conformational sampling techniques [https://www.sciencedirect.com/science/article/abs/pii/S1093326303001232]
- 57. 2.3. 3D Ligand-Based Pharmacophore Modeling [https://bio-protocol.org/exchange/minidetail?id=3714194&type=30]
- 58. A Computational Approach to Identify Potential Novel ... [https://pmc.ncbi.nlm.nih.gov/articles/PMC7583376/]
- 59. Sampling conformational changes of bound ligands using ... [https://pmc.ncbi.nlm.nih.gov/articles/PMC7325746/]
- 60. Novel covalent and non-covalent complex-based ... [https://www.nature.com/articles/s41598-022-17204-0]
- 61. Ligand-based assessment of factor Xa binding site ... [https://www.sciencedirect.com/science/article/abs/pii/S0223523404002569]
- 62. What is pharmacophore modeling and its applications? [https://synapse.patsnap.com/article/what-is-pharmacophore-modeling-and-its-applications]
- 63. 3.6. Ligand-Based Pharmacophore Modeling [https://bio-protocol.org/exchange/minidetail?id=10564992&type=30]
- 64. Ligand-based pharmacophore modeling and molecular ... [https://pubs.rsc.org/en/content/articlehtml/2021/ra/d1ra03891e]
- 65. 2.3. Target—ligand-based approaches [https://bio-protocol.org/exchange/minidetail?id=4399996&type=30]
- 66. Strategies for 3D pharmacophore-based virtual screening [https://www.sciencedirect.com/science/article/abs/pii/S1740674910000375]
- 67. Drug Design by Pharmacophore and Virtual Screening ... [https://www.mdpi.com/1424-8247/15/5/646]
- 68. Ligand-based pharmacophore modeling and molecular ... [https://pmc.ncbi.nlm.nih.gov/articles/PMC9037691/]
- 69. Applications of the Novel Quantitative Pharmacophore Activity ... [https://pmc.ncbi.nlm.nih.gov/articles/PMC9504690/]
- 70. Assessing the role of ligand function in model development [https://www.sciencedirect.com/science/article/abs/pii/S1093326321002783]
- 71. Tubulin inhibitors: pharmacophore modeling, virtual ... [https://www.nature.com/articles/aps201434]
- 72. Machine learning accelerates pharmacophore-based ... [https://www.nature.com/articles/s41598-024-58122-7]
- 73. Ligand-Based Pharmacophore Modeling Using Novel 3D ... [https://pmc.ncbi.nlm.nih.gov/articles/PMC6321403/]
- 74. Pharmacophore Modeling, Virtual Screening, and ... [https://pmc.ncbi.nlm.nih.gov/articles/PMC3558715/]
- 75. Docking, pharmacophore modeling, virtual screening, and ... [https://www.bio-protocol.org/exchange/preprintdetail?type=3&id=268]
- 76. Pharmacophore-based approach for the identification of ... [https://www.sciencedirect.com/science/article/pii/S266702242500012X]
- 77. Schrödinger Notes—Ligand-based Pharmacophore Modeling [https://blog.jiangshen.org/2024/schrodinger-notes-ligand-based-pharmacophore-modeling/]
- 78. How to explain the ROC AUC score and ROC curve? [https://www.evidentlyai.com/classification-metrics/explain-roc-curve]
- 79. Classification: ROC and AUC | Machine Learning | Google for Developers [https://developers.google.com/machine-learning/crash-course/classification/roc-and-auc]
- 80. AUC ROC Curve in Machine Learning - GeeksforGeeks [https://www.geeksforgeeks.org/machine-learning/auc-roc-curve/]
- 81. LigandScout 3.12 – Pharmacophore 3D Modeling – My Biosoftware – Bioinformatics Softwares Blog [https://mybiosoftware.com/ligandscout-3-02-pharmacophore-3d-modeling.html]
- 82. Structure-Based vs Ligand-Based Drug Design [https://www.iaanalysis.com/structure-based-vs-ligand-based-drug-design.html]
- 83. Pharmacophore modeling for biological targets with high ... [https://www.sciencedirect.com/science/article/pii/S2590098622000161]
- 84. Merging Ligand-Based and Structure-Based Methods in ... [https://pmc.ncbi.nlm.nih.gov/articles/PMC7587536/]
- 85. Ligand-based pharmacophore modeling, virtual screening ... [https://pubs.rsc.org/en/content/articlelanding/2021/ra/d0ra10168k]
- 86. Accelerating discovery of bioactive ligands with ... [https://www.nature.com/articles/s41467-025-56349-0]
- 87. Pharmacophore model, docking, QSAR, and molecular ... [https://pmc.ncbi.nlm.nih.gov/articles/PMC8047494/]
- 88. pharmacophore models for identifying metal-free dyes ... [https://www.nature.com/articles/s41524-022-00823-6]
- 89. Pharmacophore-Model-Based Virtual-Screening ... [https://www.mdpi.com/1467-3045/44/10/329]