Field-Based 3D-QSAR Modeling of Maslinic Acid Analogs for Anticancer Drug Discovery
This article provides a comprehensive guide for researchers and drug development professionals on developing and applying field-based 3D-QSAR models for maslinic acid analogs with anticancer activity.
Field-Based 3D-QSAR Modeling of Maslinic Acid Analogs for Anticancer Drug Discovery
Abstract
This article provides a comprehensive guide for researchers and drug development professionals on developing and applying field-based 3D-QSAR models for maslinic acid analogs with anticancer activity. Covering the foundational principles, methodological workflow, troubleshooting of common challenges, and validation protocols, it synthesizes current best practices from recent scientific literature. The content explores how these computational models, when combined with machine learning and molecular docking, can identify critical pharmacophore features, optimize lead compounds, and predict activity against specific targets like the MCF-7 breast cancer cell line, ultimately accelerating early-stage anticancer drug discovery.
Understanding Maslinic Acid and 3D-QSAR Fundamentals in Cancer Research
The Global Burden of Breast Cancer and Need for Novel Therapeutics
Breast cancer remains a formidable global health challenge, standing as the most commonly diagnosed cancer among women worldwide [1]. In 2022 alone, an estimated 2.3 million women were diagnosed with breast cancer, and it caused approximately 670,000 deaths globally [1]. Projections for 2050 indicate a concerning rise, with global breast cancer cases expected to exceed 6 million annually [2]. This escalating burden, particularly in transitioning economies where disparities in survival remain stark, underscores the urgent need for accelerated therapeutic development [2].
Natural products have historically served as valuable starting points in anticancer drug discovery. Maslinic acid, a pentacyclic triterpenoid derived from olive pomace oil, has emerged as a promising candidate with demonstrated anticancer activity against breast cancer cell lines such as MCF-7 [3] [4]. However, its mechanism of action and structure-activity relationship (SAR) have not been fully elucidated. This application note details the development and implementation of a field-based three-dimensional quantitative structure-activity relationship (3D-QSAR) model to guide the optimization of maslinic acid analogs, providing a robust protocol for researchers in computational chemistry and drug design.
The Global Burden and Therapeutic Landscape
Epidemiological Scope and Projections
The burden of breast cancer is not uniformly distributed, with significant disparities observed across regions and levels of human development [1] [2]. Table 1 summarizes the key epidemiological metrics and projections, highlighting regions facing the greatest challenges.
Table 1: Global Breast Cancer Burden: 2022 Estimates and 2050 Projections [1] [2]
| Region / Metric | 2022 Incidence (Cases) | 2022 Age-Standardized Incidence Rate (per 100,000) | 2022 Mortality (Deaths) | 2050 Projected Incidence (Cases) | Mortality-to-Incidence Ratio (MIR, 2022) |
|---|---|---|---|---|---|
| Global | 2,296,840 | 48.0 | 666,103 | >6,000,000 | 0.29 (Average) |
| Asia | 985,817 | 34.34 | Not Specified | ~2,000,000 | 0.25 (Projected for 2050) |
| Europe | 557,532 | 75.61 | Not Specified | Not Specified | 0.20 (Projected for 2050) |
| Northern America | 306,307 | 95.12 | Not Specified | Not Specified | 0.13 (Projected for 2050) |
| Africa | 198,553 | 40.5 | Not Specified | ~1,118,000 | 0.51 |
These disparities are quantified by the Mortality-to-Incidence Ratio (MIR), a key indicator of survival. In 2022, Africa's MIR was 0.51, meaning more than half of diagnosed women died from the disease, compared to just 13% in Northern America [2]. This gap underscores the critical need for accessible and effective therapeutics across all healthcare settings.
Advances in Treatment and Unmet Needs
The breast cancer treatment landscape is rapidly evolving with the advent of precision medicine. Recent breakthroughs in the first half of 2025 include the FDA approval of novel antibody-drug conjugates (ADCs) like Datroway (datopotamab deruxtecan) for HR+/HER2- breast cancer and the expanded use of Enhertu (trastuzumab deruxtecan) for HER2-low and ultra-low disease [5]. Furthermore, agents such as vepdegestrant, a first-in-class PROTAC estrogen receptor degrader, represent new mechanistic approaches on the horizon [5] [6].
Despite these advances, significant obstacles persist, including drug resistance, treatment-related toxicity, and the lack of effective options for certain aggressive subtypes like triple-negative breast cancer (TNBC) [5]. Natural product-based drug discovery, supported by computational methods, offers a viable path to address these unmet needs by identifying novel chemical scaffolds with favorable efficacy and safety profiles.
Application Note: Field-Based 3D-QSAR on Maslinic Acid Analogs
This protocol describes the development of a field-based 3D-QSAR model to understand the structural determinants of maslinic acid's anticancer activity against the MCF-7 cell line. The workflow integrates pharmacophore generation, molecular alignment, PLS regression modeling, and virtual screening to identify and optimize lead compounds [3] [4].
Experimental Workflow
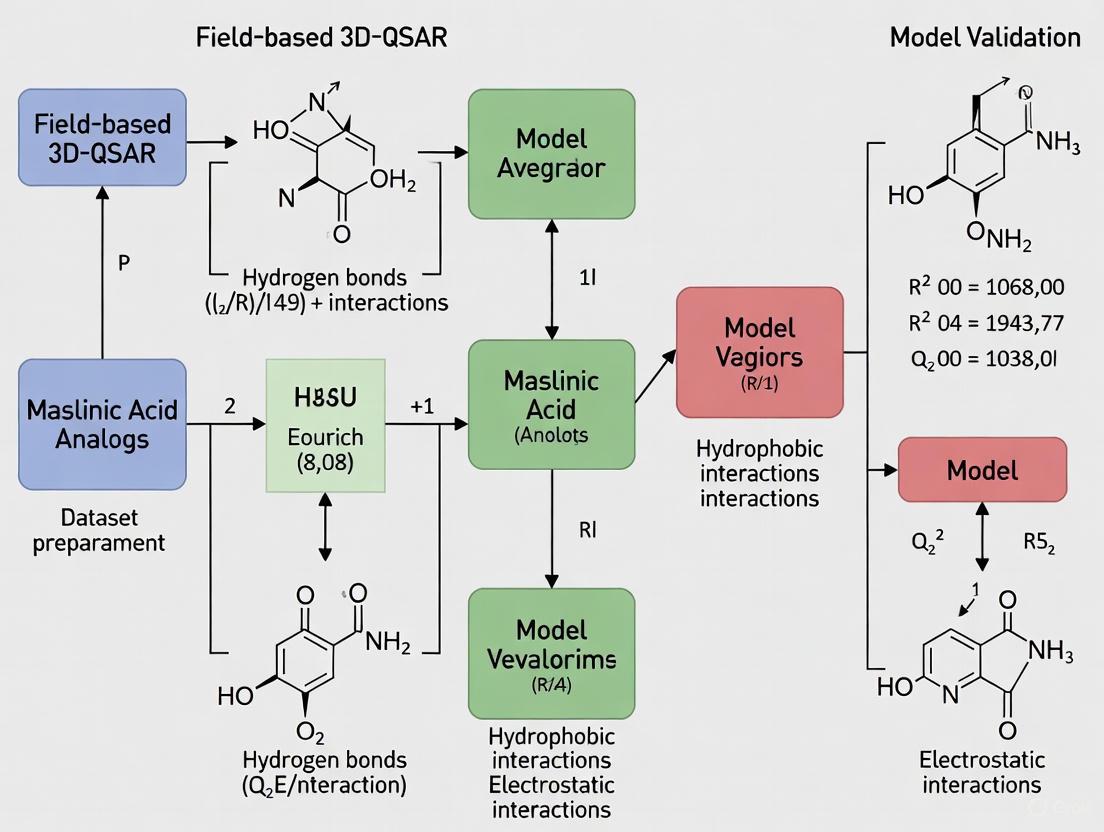
The diagram below outlines the key stages of the 3D-QSAR modeling and screening process.
Materials and Methods
Research Reagent Solutions
Table 2: Essential Research Reagents and Software Tools
| Item Name | Supplier / Developer | Function / Application in Protocol |
|---|---|---|
| Forge (v10) | Cresset Inc., UK | Core software for FieldTemplater pharmacophore generation, molecular alignment, and field-based 3D-QSAR model development. |
| ChemBio3D Ultra | PerkinElmer/CambridgeSoft, UK | Used for converting 2D chemical structures of maslinic acid analogs into optimized 3D molecular structures. |
| XED Force Field | Cresset Inc., UK | The extended electron distribution force field used for molecular mechanics calculations, conformational analysis, and generating molecular field points. |
| ZINC Database | University of California, San Francisco | Public database of commercially available compounds used for virtual screening of potential new analogs based on similarity. |
Detailed Stepwise Protocol
Step 1: Data Collection and Structure Preparation
- Procedure: A training set of 74 maslinic acid analogs with known in vitro IC₅₀ values against the MCF-7 cell line was curated from scientific literature [4]. The reported IC₅₀ values were converted to pIC₅₀ using the formula: pIC₅₀ = -log₁₀(IC₅₀) for use as the dependent variable in modeling.
- The two-dimensional (2D) structures of all compounds were converted into three-dimensional (3D) structures using ChemBio3D Ultra. All generated 3D conformers were subsequently energy-minimized using the XED force field with a gradient cut-off of 0.1 kcal/mol [4].
Step 2: Conformational Hunt and Pharmacophore Generation
- Procedure: The FieldTemplater module in Forge was used to determine the bioactive conformation and generate a common pharmacophore hypothesis [4]. A subset of highly active compounds (e.g., M-159, M-254, M-286, M-543, M-659) was selected for this step.
- The software calculates and compares four key molecular fields: positive electrostatics, negative electrostatics, shape (van der Waals), and hydrophobicity. The resulting hypothesis is a 3D pattern of field points that represents the essential features for biological activity [4].
Step 3: Compound Alignment
- Procedure: The pharmacophore template derived in Step 2 was imported into Forge's main interface. All 74 compounds in the training set were then aligned onto this template. The software selects the best-matching, low-energy conformation for each compound based on a combination of 50% field similarity and 50% volume similarity (Dice coefficient) [4].
Step 4: 3D-QSAR Model Development
- Procedure: Following alignment, a 3D-QSAR model was built using field point-based descriptors calculated for the aligned molecules. The model was generated using the Partial Least Squares (PLS) regression method, specifically the SIMPLS algorithm [4].
- The initial set of 74 compounds was partitioned into a training set (47 compounds) for model building and a test set (27 compounds) for external validation using an activity-stratified method to ensure representative distribution [4].
Step 5: Model Validation
- Procedure: The model's predictive power and robustness were rigorously assessed. Leave-One-Out Cross-Validation (LOOCV) was performed on the training set, yielding a cross-validated correlation coefficient (q²) of 0.75 [3] [4].
- The model was further validated by predicting the activity of the external test set, resulting in a conventional regression coefficient (r²) of 0.92 [3] [4]. These metrics indicate a highly predictive and reliable model.
Step 6: Activity-Atlas Visualization and Virtual Screening
- Procedure: Forge's Activity-Atlas module was used to generate 3D maps visualizing the SAR. These maps display regions where specific molecular features (e.g., positive electrostatics, hydrophobicity) are favorable or unfavorable for activity [4].
- A field point-based virtual screening of the ZINC database was conducted, retrieving 593 compounds with high structural similarity (Tanimoto score ≥ 80%) to maslinic acid. These compounds were screened through the validated QSAR model to predict their bioactivity [4].
Step 7: Hit Filtering and Identification
- Procedure: The top predicted hits were filtered through multiple stages:
- Lipinski's Rule of Five: To prioritize compounds with likely good oral bioavailability [4].
- ADMET Risk Assessment: To filter out compounds with potential absorption, distribution, metabolism, excretion, or toxicity issues [4].
- Docking Screening: The final shortlist of 39 compounds was docked into potential protein targets (AKR1B10, NR3C1, PTGS2, HER2) to study binding interactions and suggest a mechanism of action [3] [4].
- Final Output: Compound P-902 was identified as the best hit based on its predicted activity, drug-like properties, and docking score [3] [4].
The global burden of breast cancer is projected to grow substantially in the coming decades, necessitating a continuous pipeline of novel therapeutic agents. The integration of computational approaches like field-based 3D-QSAR early in the drug discovery process provides a powerful strategy to accelerate and rationalize the development of new drugs. The detailed protocol outlined herein for maslinic acid analogs demonstrates a validated path from a natural product lead to a prioritized, optimized hit candidate, offering researchers a robust framework to advance new treatments for this pervasive disease.
Maslinic Acid as a Promising Natural Product Lead Compound
Application Note: Field-Based 3D-QSAR Model for Anticancer Analog Design
Background and Rationale
Maslinic acid (2α,3β-dihydroxyolean-12-en-28-oic acid) is a naturally occurring pentacyclic triterpenoid found in olive pomace oil and various medicinal plants [3] [7]. Growing recognition of its chemopreventive properties against multiple cancer types has positioned it as an excellent pharmacologically active product for drug development programs [7]. The global prevalence of breast cancer and its rising frequency make it a key area of research, particularly as drug resistance to existing anticancer medications continues to develop [3] [8].
This application note details the development and implementation of a field-based three-dimensional quantitative structure-activity relationship (3D-QSAR) model for maslinic acid analogs with demonstrated anticancer activity against the human breast cancer cell line MCF-7 [3]. The model defines molecular-level understanding and identifies critical regions for structure-activity relationship (SAR) optimization of this promising natural product lead compound.
Key Quantitative Findings from the 3D-QSAR Study
Table 1: Key Statistical Parameters of the Validated 3D-QSAR Model
| Parameter | Value | Interpretation |
|---|---|---|
| Regression coefficient (r²) | 0.92 | Indicates excellent model fit |
| Cross-validation coefficient (q²) | 0.75 | Shows strong predictive ability |
| Validation method | Leave-one-out (LOO) | Robust validation with small datasets |
| Number of training compounds | 47 | Sufficient for model development |
| Number of test set compounds | 27 | Appropriate for external validation |
Table 2: Virtual Screening Funnel and Hit Identification
| Screening Stage | Compounds Remaining | Filter Criteria |
|---|---|---|
| Initial similarity search | 593 | Tanimoto score ≥80% similarity to maslinic acid |
| Lipinski's Rule of Five | Not specified | Oral bioavailability assessment |
| ADMET risk filter | Not specified | Drug-like features evaluation |
| Synthetic accessibility | 39 | Chemical synthesis feasibility |
| Final top hits | 1 (Compound P-902) | Docking scores against multiple targets |
The derived QSAR model revealed several critical structural requirements for enhanced anticancer activity. Key features included average shape, hydrophobic regions, and electrostatic patterns of active compounds [3]. The activity-atlas models further identified specific favorable and unfavorable regions for steric and electrostatic interactions [9].
Identified Molecular Targets and Binding Affinity
Docking screening of the top hits was performed against identified potential protein targets:
- AKR1B10 (Aldo-keto reductase family 1 member B10)
- NR3C1 (Nuclear receptor subfamily 3 group C member 1, glucocorticoid receptor)
- PTGS2 (Prostaglandin-endoperoxide synthase 2, COX-2)
- HER2 (Receptor tyrosine-protein kinase erbB-2) [3]
Compound P-902 emerged as the best hit, demonstrating superior binding affinity and selectivity against these targets, particularly NR3C1, which has been reported to promote cancer cell survival and induce chemoresistance in breast cancer patients [9].
Protocol: Field-Based 3D-QSAR Model Development for Maslinic Acid Analogs
Data Collection and Structure Preparation
Purpose: To compile and prepare a structurally diverse set of maslinic acid analogs with known biological activities for 3D-QSAR modeling.
Materials:
- Chemical structures of maslinic acid analogs with reported IC₅₀ values against MCF-7 breast cancer cell line
- ChemBio3D Ultra software (PerkinElmer/CambridgeSoft, UK) or equivalent molecular modeling package
Procedure:
- Data Collection: Gather training dataset compounds from prior literature reports. Ensure biological activity data (IC₅₀) represents consistent experimental conditions.
- Structure Conversion: Transform two-dimensional (2D) chemical structures into three-dimensional (3D) structures using the converter module of ChemBio3D Ultra.
- Activity Conversion: Convert experimental IC₅₀ values to pIC₅₀ using the formula: pIC₅₀ = -log(IC₅₀) for QSAR analysis [8].
- Dataset Division: Partition the total compound set (e.g., 74 compounds) into training set (∼47 compounds) and test set (∼27 compounds) using activity stratification to ensure representative distribution [8].
Conformational Analysis and Pharmacophore Generation
Purpose: To identify the bioactive conformation and generate a pharmacophore template for molecular alignment.
Materials:
- Forge v10 software (Cresset Inc., UK) with FieldTemplater module
- XED (eXtended Electron Distribution) force field
Procedure:
- Template Selection: Select representative active compounds (e.g., M-159, M-254, M-286, M-543, M-659) for template generation.
- Field Point Calculation: Use FieldTemplater to calculate four different molecular fields:
- Positive electrostatic potential
- Negative electrostatic potential
- Shape (van der Waals)
- Hydrophobic field (density function correlated with steric bulk and hydrophobicity)
- Hypothesis Generation: Allow the software to determine the hypothesis for the 3D conformation using field and shape information.
- Template Annotation: Annotate the FieldTemplater-derived hypothesis with its calculated field points, resulting in a 3D field point pattern that provides a condensed representation of shape, electrostatics, and hydrophobicity [8].
Compound Alignment and 3D-QSAR Model Development
Purpose: To align compounds to the pharmacophore template and develop the predictive 3D-QSAR model.
Materials:
- Forge v10 software (Cresset Inc., UK)
- Aligned compound structures with activity data
Procedure:
- Template Transfer: Transfer the pharmacophore template obtained from the FieldTemplater module into Forge v10.
- Compound Alignment: Align all training set compounds with the identified template using the field-based similarity method.
- Descriptor Calculation: Use field point-based descriptors for building the 3D-QSAR model after alignment of compounds with known IC₅₀ values.
- Parameter Settings: Configure the modeling parameters:
- Maximum number of components: 20
- Sample point maximum distance: 1.0 Å
- Y scrambles: 50
- Include both electrostatic and volume fields
- Model Building: Apply the partial least squares (PLS) regression method using Forge's field QSAR module with the SIMPLS algorithm [8].
- Conformer Consideration: Use overlays with the best matching low energy conformations to the template for building the final 3D-QSAR model.
Model Validation and Activity-Atlas Visualization
Purpose: To validate model predictive ability and visualize structure-activity relationships.
Materials:
- Validated 3D-QSAR model
- Test set compounds not used in model training
Procedure:
- Internal Validation: Perform leave-one-out (LOO) cross-validation to optimize the activity-prediction model.
- External Validation: Validate the derived QSAR model using the test set compounds to assess predictive performance on unknown structures.
- Statistical Assessment: Evaluate model quality using regression coefficient (r²), cross-regression coefficient (q²), and similarity score (Sim) of conformers for each ligand with respect to the pivot [8].
- Activity-Atlas Generation: Use the Bayesian approach to study the global view of training data qualitatively:
- Generate "average of actives" model to identify common features in active compounds
- Create "activity cliff summary" to visualize positive/negative electrostatics sites, favorable/unfavorable hydrophobicity, and favorable shape
- Perform "regions explored analysis" to identify fully explored regions of the aligned compounds [8]
Virtual Screening and Hit Identification
Purpose: To identify potential novel maslinic acid analogs with predicted enhanced activity.
Materials:
- ZINC database or other chemical structure databases
- Validated 3D-QSAR model
- Molecular docking software
Procedure:
- Similarity Search: Conduct field point-based virtual screening through the ZINC database using Tanimoto score similarity ≥80% with maslinic acid structure.
- Bioactivity Prediction: Screen retrieved compounds through the derived 3D-QSAR model for bioactivity prediction and SAR field point compliance.
- Property Filtering: Apply sequential filters to identify promising leads:
- Lipinski's Rule of Five: Assess oral bioavailability potential
- ADMET Risk Assessment: Evaluate drug-like features and toxicity profiles
- Synthetic Accessibility: Filter based on feasibility of chemical synthesis [3]
- Docking Studies: Perform molecular docking simulations with identified potential targets (AKR1B10, NR3C1, PTGS2, HER2) to validate binding interactions and affinity.
- Hit Selection: Identify final candidate compounds (e.g., P-902) based on combined QSAR predictions, drug-like properties, and docking scores.
Visualizations
3D-QSAR Model Development Workflow
Maslinic Acid Anticancer Signaling Pathways
The Scientist's Toolkit: Research Reagent Solutions
Table 3: Essential Research Tools for Maslinic Acid 3D-QSAR Studies
| Tool/Reagent | Function/Application | Example/Supplier |
|---|---|---|
| ChemBio3D Ultra | 2D to 3D structure conversion and molecular modeling | PerkinElmer/CambridgeSoft |
| Forge v10 with FieldTemplater | Field-based pharmacophore generation and 3D-QSAR modeling | Cresset Inc., UK |
| XED Force Field | Extended electron distribution force field for conformational analysis | Cresset Inc., UK |
| ZINC Database | Publicly accessible database of commercially available compounds for virtual screening | University of California, San Francisco |
| Lipinski's Rule of Five | Filter for predicting oral bioavailability of drug candidates | Pfizer rule-based screening |
| ADMET Risk Filter | Assessment of absorption, distribution, metabolism, excretion, and toxicity properties | In silico prediction tools |
| NR3C1 Crystal Structure | Glucocorticoid receptor for molecular docking studies | Protein Data Bank |
| MCF-7 Cell Line | Human breast adenocarcinoma cell line for in vitro anticancer activity testing | ATCC |
The implementation of this comprehensive protocol enables researchers to leverage the potential of maslinic acid as a promising natural product lead compound. The field-based 3D-QSAR approach provides valuable insights for lead identification and optimization in early drug discovery, particularly for developing novel anticancer agents against breast cancer [3]. Compound P-902, identified through this methodology, demonstrates the practical application of these techniques for advancing natural product-based drug discovery programs.
Core Principles of Field-Based 3D-QSAR Analysis
Three-dimensional Quantitative Structure-Activity Relationship (3D-QSAR) represents a significant advancement over classical QSAR by exploiting the three-dimensional properties of ligands to predict biological activity using robust statistical analyses. Field-based 3D-QSAR extends this approach further by using probe-based sampling within a molecular lattice to determine three-dimensional properties of molecules and correlate these 3D descriptors with biological activity [10]. Unlike traditional methods that focus primarily on physicochemical parameters, field-based approaches incorporate molecular interaction fields derived from steric, electrostatic, and hydrophobic properties, providing a more comprehensive representation of ligand-receptor interactions [3] [11].
The fundamental principle underlying field-based 3D-QSAR is that differences in biological activity correlate directly with changes in the shapes and strengths of non-covalent interaction fields surrounding molecules [10]. This methodology has become an indispensable tool in modern drug design, particularly in scenarios where the three-dimensional structure of the target protein remains unknown, allowing researchers to establish quantitative relationships between molecular field properties and biological responses [9].
Core Theoretical Principles
Molecular Field Theory and Descriptors
Field-based 3D-QSAR utilizes molecular field points as fundamental descriptors, which provide a condensed representation of a compound's shape, electrostatics, and hydrophobicity [3] [11]. These field points are generated using force fields such as XED (eXtended Electron Distribution) and typically encompass four distinct molecular fields [11]:
- Positive electrostatic fields: Represent areas of electron deficiency
- Negative electrostatic fields: Represent areas of electron richness
- Shape/van der Waals fields: Represent steric and volume characteristics
- Hydrophobic fields: Density functions correlating with steric bulk and hydrophobicity
The underlying mathematical framework involves calculating interaction energies between each molecule and defined probes positioned at regular grid intersections surrounding the aligned molecules. The resulting field values serve as independent variables in partial least squares (PLS) regression analysis to build predictive models correlating field characteristics with biological activity [10].
Molecular Alignment and Conformational Analysis
A critical prerequisite for successful field-based 3D-QSAR is the proper alignment of molecules based on their postulated bioactive conformations. The accuracy of molecular alignment directly influences model quality and predictive capability [12]. Two primary approaches exist for molecular alignment:
- Pharmacophore-based alignment: Uses a common pharmacophore template derived from active compounds when no structural target information is available [3] [11]
- Common scaffold alignment: Automatically detects the maximum common scaffold between molecules to ensure identical coordinates of the common core, minimizing noise introduced by analogous parts [12]
Conformational sampling protocols significantly impact model quality. Studies indicate that while virtual screening results remain relatively insensitive to conformational search protocols, more thorough conformational sampling tends to produce better QSAR predictions [12].
Experimental Protocol for Field-Based 3D-QSAR
The following diagram illustrates the comprehensive workflow for field-based 3D-QSAR model development:
Detailed Methodological Steps
Step 1: Data Collection and Structure Preparation
The initial phase involves compiling a dataset of compounds with reliable biological activity data (typically IC50 values). Two-dimensional chemical structures are transformed into three-dimensional structures using molecular modeling software [11] [13]. Activity values are converted to a logarithmic scale (pIC50 = -logIC50) to establish a linear relationship with free energy changes [11] [13].
Key Considerations:
- Biological data should be obtained from comparable experimental assays
- Dataset should encompass sufficient structural diversity and activity range
- Compounds are typically divided into training (~70-80%) and test sets (~20-30%) using activity-stratified or random selection methods [11]
Step 2: Conformation Hunt and Pharmacophore Generation
When structural information for the target is unavailable, a pharmacophore hypothesis is developed using field and shape information from highly active compounds [11]:
- The FieldTemplater module (or equivalent software) determines the bioactive conformation hypothesis
- Field points are generated using XED force field or similar approaches
- The resulting 3D field point pattern provides a template for molecular alignment
Protocol Parameters:
- Energy window: 3 kcal/mol [11]
- Maximum conformations: 250-500 per molecule [11] [14]
- RMSD cutoff: 0.5 Å for duplicate conformers [14]
- Gradient cutoff for minimization: 0.1 kcal/mol [11]
Step 3: Compound Alignment and Field Calculation
All training set compounds are aligned to the pharmacophore template using molecular field-based similarity methods [11]. The aligned molecules are placed within a 3D grid with typical spacing of 1.0-2.0 Å [11] [10]. Molecular interaction fields are calculated at each grid point using appropriate probes:
- Steric fields: Typically using an sp³ carbon atom with +1 charge [10]
- Electrostatic fields: Derived from atomic partial charges
- Hydrophobic fields: Representing lipophilicity distribution
Step 4: 3D-QSAR Model Development Using PLS
The relationship between field descriptors and biological activity is established using Partial Least Squares (PLS) regression [11]:
- Field descriptors serve as independent variables (X)
- pIC50 values serve as dependent variables (Y)
- The SIMPLS algorithm is typically employed during QSAR modeling [11]
- The maximum number of components is generally set to 15-20 [11]
Table 1: Key Statistical Parameters for 3D-QSAR Model Validation
| Parameter | Symbol | Acceptable Range | Optimal Value | Interpretation |
|---|---|---|---|---|
| Regression Coefficient | r² | >0.6 | >0.8 | Descriptive ability of the model |
| Cross-validated Coefficient | q² | >0.5 | >0.6 | Predictive ability of the model |
| Root Mean Square Error | RMSE | Lower is better | Model dependent | Standard deviation of residuals |
| Component Number | n | 3-6 | Optimized by LOO | Latent variables in PLS analysis |
Step 5: Model Validation
Rigorous validation is essential to ensure model reliability:
- Internal validation: Leave-One-Out (LOO) or Leave-Multiple-Out cross-validation assesses predictive capability within the training set [11]
- External validation: Uses test set compounds not included in model development [13]
- Y-scrambling: Tests for chance correlations by randomly shuffling activity values [11]
The model is considered predictive when q² > 0.5 and r² > 0.6, with small differences between these values indicating robustness [11].
Step 6: Visualization and Interpretation
Results are visualized as 3D coefficient contour maps showing regions where specific molecular fields correlate with increased or decreased activity:
- Favorable steric fields: Green contours indicate regions where bulky groups enhance activity
- Unfavorable steric fields: Yellow contours indicate regions where bulky groups decrease activity
- Favorable electrostatic fields: Blue contours indicate regions where positive charges enhance activity
- Unfavorable electrostatic fields: Red contours indicate regions where negative charges enhance activity [10] [9]
Activity Atlas models provide a comprehensive view of structure-activity relationships by combining average molecular fields of active compounds with activity cliff summaries and region exploration analyses [11].
Application to Maslinic Acid Analogs
Case Study: Anticancer Activity Against MCF-7 Breast Cancer Cells
A practical application of field-based 3D-QSAR was demonstrated in studies on maslinic acid analogs and their anticancer activity against breast cancer cell line MCF-7 [3] [11]. The research addressed the global prevalence of breast cancer and the need for novel therapeutic agents.
Methodology Specifics:
- Training set: 47 maslinic acid derivatives with known IC50 values [11]
- Test set: 27 compounds for external validation [11]
- Field points: Positive/negative electrostatic, shape, and hydrophobic fields [11]
- Alignment: Based on pharmacophore template from compounds M-159, M-254, M-286, M-543, and M-659 [11]
Results and Model Performance:
- The derived LOO-validated PLS regression model showed excellent statistical parameters: r² = 0.92 and q² = 0.75 [3] [11]
- The model identified key structural features controlling anticancer activity and toxicity
- Virtual screening of 593 compounds from ZINC database identified 39 top hits after applying drug-likeness filters [11]
- Compound P-902 emerged as the best candidate with predicted activity against multiple targets (AKR1B10, NR3C1, PTGS2, and HER2) [3]
Table 2: Summary of 3D-QSAR Results for Maslinic Acid Analogs
| Parameter | Value | Interpretation |
|---|---|---|
| Training Set Compounds | 47 | Used for model development |
| Test Set Compounds | 27 | Used for external validation |
| Regression Coefficient (r²) | 0.92 | Excellent descriptive ability |
| Cross-validation Coefficient (q²) | 0.75 | Good predictive ability |
| Initial Virtual Screening Hits | 593 | From ZINC database similarity search |
| Final Top Hits After Filtering | 39 | After drug-likeness and ADMET screening |
| Primary Molecular Targets Identified | AKR1B10, NR3C1, PTGS2, HER2 | Through docking studies |
Structural Insights and Analog Design
The 3D-QSAR model revealed crucial structure-activity relationship information for maslinic acid analogs:
- Specific electrostatic field points in red regions strongly influenced higher activity [9]
- Regions with high electrostatic and steric variance represented areas sensitive to structural modifications [9]
- Particular structural modifications were identified that could enhance predicted activity while maintaining drug-like properties
These insights guided the design of optimized analogs with improved predicted activity profiles, demonstrating the practical utility of field-based 3D-QSAR in lead optimization [11].
The Scientist's Toolkit: Essential Research Reagents
Table 3: Key Software Tools for Field-Based 3D-QSAR Analysis
| Software/Tool | Primary Function | Application in 3D-QSAR |
|---|---|---|
| Forge (Cresset) | Field-based molecular alignment and QSAR | Pharmacophore generation, field calculation, and 3D-QSAR model development [11] |
| ChemBioOffice | Structure drawing and conversion | 2D to 3D structure conversion and preliminary optimization [11] |
| Spartan | Molecular modeling and optimization | Geometry optimization using DFT methods [13] |
| PyQSAR | Descriptor calculation and model building | Open-source tool for QSAR model development [15] |
| OCHEM Platform | Molecular descriptor calculation | Calculates 1D, 2D, and 3D molecular descriptors [15] |
| AutoDock Vina | Molecular docking | Validation of potential binding modes and affinities [13] |
Advanced Applications and Recent Developments
Field-based 3D-QSAR continues to evolve with methodological advancements and expanding applications:
Integration with Other Computational Approaches
Modern implementations often combine field-based 3D-QSAR with complementary techniques:
- Molecular docking: Validates potential binding modes and refines alignment strategies [11] [14]
- ADMET prediction: Screens for drug-like properties early in the design process [11] [13]
- Scaffold hopping: Identifies novel chemotypes with similar field properties
Recent Methodological Improvements
Recent developments in the field include:
- Shift from "leave-one-out" to random cross-validation for larger training sets [16]
- Incorporation of additional field types and improved probe parameters
- Enhanced algorithms for molecular alignment and conformation sampling [12]
- Integration of machine learning approaches for pattern recognition in field data
Field-based 3D-QSAR represents a powerful approach for establishing quantitative relationships between molecular structure and biological activity when detailed structural information about the target is limited. The methodology's strength lies in its ability to distill complex 3D molecular interactions into interpretable models that guide lead optimization in drug discovery.
The successful application to maslinic acid analogs demonstrates how field-based 3D-QSAR can identify key structural determinants of anticancer activity, prioritize compounds for synthesis, and generate testable hypotheses about mechanism of action. As computational resources advance and methodologies refine, field-based 3D-QSAR continues to offer valuable insights for drug discovery, particularly in the early stages of lead identification and optimization.
The core principles of molecular field analysis, proper conformational sampling, rigorous statistical validation, and intuitive visualization remain fundamental to extracting meaningful structure-activity relationships from field-based 3D-QSAR models.
In modern drug discovery, field-based Three-Dimensional Quantitative Structure-Activity Relationship (3D-QSAR) modeling has emerged as a powerful computational approach for understanding and predicting the biological activity of chemical compounds. Unlike traditional 2D-QSAR methods that use molecular descriptors invariant to three-dimensional orientation, 3D-QSAR considers molecules as spatial entities with distinct shape and interaction characteristics [17]. The fundamental principle underpinning this approach is that biological receptors perceive ligands not as collections of atoms and bonds, but as molecular shapes accompanied by complex force fields [18]. These interaction fields predominantly determine the binding affinity and specificity of drug candidates toward their biological targets.
The core molecular descriptors in 3D-QSAR analyses include steric, electrostatic, and hydrophobic fields, which collectively describe the key intermolecular forces governing ligand-receptor interactions [17] [18]. Electrostatic interactions occur between polar or charged groups and operate over relatively long distances, while steric forces become critically important at shorter ranges where molecular bulk may either accommodate or clash with the binding site [18]. Hydrophobic fields, representing regions of favorable hydrophobic interactions, further complement these descriptors to provide a more comprehensive picture of binding thermodynamics. This application note details the theoretical foundation, calculation methods, and practical application of these key molecular descriptors within the context of developing field-based 3D-QSAR models for maslinic acid analogs with anticancer activity against breast cancer cell lines [4] [19].
Theoretical Foundation of Molecular Descriptors
Steric Fields
Steric fields represent regions where the molecular bulk may experience favorable or unfavorable interactions with the binding site [17]. These fields are quantified using van der Waals forces, which include both attractive (dispersion) and repulsive (electronic cloud overlap) components [18]. The steric potential is typically calculated using a Lennard-Jones 6-12 potential function, which describes the dependence of van der Waals energy on the distance between non-bonded atoms [18]. In practical 3D-QSAR implementations, steric fields are probed using an sp3 carbon atom placed at regularly spaced grid points surrounding the molecule [18]. The resulting energy values provide a spatial map of molecular bulk, highlighting regions where structural modifications may enhance or diminish biological activity through steric effects.
Electrostatic Fields
Electrostatic fields map regions of positive or negative electrostatic potential around a molecule [17]. These fields are crucial for understanding long-range molecular recognition processes, as electrostatic interactions can significantly influence ligand approach and orientation before binding [18]. The electrostatic potential is typically calculated using Coulomb's law, which sums the interactions between point charges distributed across the molecular structure [18]. Similar to steric field calculations, electrostatic fields are measured using a probe atom (typically an sp3 carbon with a +1 charge) at each grid point [18]. The resulting electrostatic contour maps identify regions where introducing electron-withdrawing or electron-donating groups might enhance binding affinity through improved electrostatic complementarity with the target.
Hydrophobic Fields
Hydrophobic fields represent regions where lipophilic character contributes favorably or unfavorably to biological activity [4]. Unlike steric and electrostatic fields that derive from physical force calculations, hydrophobic fields are often computed using empirical methods correlated with steric bulk and hydrophobicity [4]. In the CoMSIA (Comparative Molecular Similarity Indices Analysis) approach, hydrophobic fields are included alongside steric, electrostatic, and hydrogen-bonding descriptors to provide a more comprehensive representation of interaction possibilities [17]. These fields help identify regions where increasing or decreasing lipophilicity might improve membrane permeability, binding affinity, or other pharmacologically relevant properties.
Table 1: Key Molecular Descriptors in 3D-QSAR Modeling
| Descriptor Type | Physical Basis | Probe Atom/Group | Calculation Method | Role in Binding |
|---|---|---|---|---|
| Steric | van der Waals forces | sp3 carbon | Lennard-Jones potential | Shape complementarity, avoiding clashes |
| Electrostatic | Charge distribution | +1 charged carbon | Coulomb's law | Long-range recognition, specific interactions |
| Hydrophobic | Lipophilicity | Hydrophobic group | Empirical methods | Membrane permeability, hydrophobic interactions |
Computational Protocols for Descriptor Calculation
Molecular Modeling and Alignment
The initial step in 3D-QSAR model development involves generating accurate three-dimensional structures from 2D representations using molecular modeling software such as ChemBio3D or RDKit [4]. These structures subsequently undergo geometry optimization using molecular mechanics force fields (e.g., UFF) or quantum mechanical methods to ensure they represent realistic, low-energy conformations [17]. The critical next step is molecular alignment, where all compounds are superimposed within a shared 3D reference frame that reflects their putative bioactive conformations [17]. This alignment can be achieved through various methods, including:
- Pharmacophore-based alignment: Using common chemical features identified through programs like FieldTemplater or DISCOtech [4] [20]
- Maximum Common Substructure (MCS) alignment: Superimposing molecules based on their largest shared structural framework [17]
- Rigid body alignment: Employing algorithms like Distill to align molecules to a template compound [20]
Precise molecular alignment is paramount, as misalignment can introduce significant noise and undermine model quality, particularly for alignment-sensitive methods like CoMFA [17].
Field Calculation and Grid Generation
Following molecular alignment, a three-dimensional lattice defining regularly spaced grid points is superimposed around the molecules [18]. The dimensions of this grid should sufficiently encompass all aligned molecules with adequate margin. At each grid point, interaction energies between the molecule and specific probes are calculated to generate the molecular field descriptors:
- Steric field calculation: A probe atom (typically carbon sp3) calculates van der Waals interaction energy using a Lennard-Jones potential at each grid point [18]
- Electrostatic field calculation: A charged probe atom (typically +1 carbon) calculates electrostatic interaction energy using Coulomb's law [18]
- Hydrophobic field calculation: Specialized probes estimate hydrophobic interaction potential using empirical methods [4]
The resulting data matrix, with compounds as rows and field values at thousands of grid points as columns, serves as the independent variable set for QSAR model development [17].
3D-QSAR Model Development and Validation
With the field descriptors calculated, statistical methods are employed to establish quantitative relationships between the molecular fields and biological activity. Partial Least Squares (PLS) regression is the most commonly used technique, as it effectively handles the high dimensionality and multicollinearity inherent in 3D-QSAR descriptor sets [17] [4]. Model quality is assessed through cross-validation techniques such as Leave-One-Out (LOO) cross-validation, which provides the cross-validated correlation coefficient (q²) [17]. Additionally, external validation using a test set of compounds not included in model development is essential to verify predictive ability [17] [21]. The final model is interpreted through contour maps that visualize regions where specific molecular properties contribute positively or negatively to biological activity [17].
Table 2: Statistical Parameters from Representative 3D-QSAR Studies
| Study Context | Method | r² | q² | Field Types | Reference |
|---|---|---|---|---|---|
| Maslinic acid analogs (MCF-7) | Field-based | 0.92 | 0.75 | Steric, Electrostatic, Hydrophobic | [4] |
| Oxadiazole derivatives (GSK-3β) | CoMFA | - | 0.692 | Steric, Electrostatic | [21] |
| Oxadiazole derivatives (GSK-3β) | CoMSIA | - | 0.696 | Steric, Electrostatic, Hydrophobic | [21] |
| Isoalloxazine derivatives (AChE) | MLR | 0.9405 | 0.6683 | Steric, Electrostatic | [22] |
Case Study: Application to Maslinic Acid Analogs
Research Context and Objectives
Maslinic acid, a natural triterpenoid derived from olive pomace, has demonstrated significant anticancer activity against breast cancer cell lines [4] [19]. To optimize its potency and understand the structural determinants of its activity, a field-based 3D-QSAR study was conducted on a series of maslinic acid analogs tested against MCF-7 breast cancer cells [4]. The primary objectives were to identify key steric, electrostatic, and hydrophobic requirements for anticancer activity and guide the rational design of more potent analogs [4].
Methodology Implementation
The study utilized a dataset of 74 compounds with known IC₅₀ values against MCF-7 cells [4]. Molecular structures were converted from 2D to 3D using ChemBio3D and energy-minimized [4]. Since no structural information was available for maslinic acid in its target-bound state, a pharmacophore template was generated using the FieldTemplater module in Forge software, based on five representative active compounds [4]. All compounds were aligned to this template, and field point-based descriptors were calculated using the XED force field, incorporating positive/negative electrostatic, shape (van der Waals), and hydrophobic fields [4]. The 3D-QSAR model was developed using the PLS regression method with activity stratification and validated through leave-one-out cross-validation [4].
Key Findings and Structural Insights
The resulting 3D-QSAR model exhibited excellent statistical quality, with a regression coefficient (r²) of 0.92 and cross-validated correlation coefficient (q²) of 0.75 [4]. Contour map analysis revealed specific structural regions critical for activity enhancement:
- Electrostatic field contributions: Red-colored regions indicated where negative electrostatic potential decreased predicted activity, while blue squares highlighted areas where electropositive features enhanced activity [9]
- Steric field contributions: Purple triangles identified regions where increased molecular bulk positively influenced anticancer activity [9]
- Hydrophobic requirements: Activity-atlas models highlighted favorable hydrophobic regions that contributed to enhanced activity [4]
These insights guided the virtual screening of 593 prediction set compounds from the ZINC database, ultimately identifying 39 top hits with predicted improved activity [4] [19]. Subsequent docking studies against potential targets (AKR1B10, NR3C1, PTGS2, and HER2) and ADMET profiling identified compound P-902 as the most promising candidate [4] [19].
Table 3: Essential Computational Tools for 3D-QSAR Studies
| Tool Category | Specific Software | Primary Function | Application in Maslinic Acid Study |
|---|---|---|---|
| Molecular Modeling | ChemBio3D, RDKit | 2D to 3D structure conversion, geometry optimization | Generation of accurate 3D structures of maslinic acid analogs [4] |
| Pharmacophore Generation | FieldTemplater (Forge) | Identification of common 3D chemical features | Creation of alignment template for maslinic acid analogs [4] |
| Molecular Alignment | Forge, SYBYL Distill | Superposition of molecules in 3D space | Alignment of compounds to pharmacophore template [4] [20] |
| Field Calculation | Forge, CoMFA, CoMSIA | Calculation of steric, electrostatic, hydrophobic fields | Generation of molecular field descriptors [4] |
| Statistical Analysis | PLS regression tools | Development of QSAR models | Correlation of field descriptors with MCF-7 activity [4] |
| Visualization | SYBYL, Forge | Visualization of contour maps | Interpretation of field contributions to activity [4] |
Steric, electrostatic, and hydrophobic field descriptors form the cornerstone of modern 3D-QSAR approaches in drug design. These descriptors provide spatially resolved information that directly relates to molecular recognition processes in biological systems. The case study on maslinic acid analogs demonstrates how these molecular fields can be leveraged to develop predictive models that guide rational drug optimization. The resulting 3D-QSAR model successfully identified critical structural regions influencing anticancer activity, enabling the virtual screening and identification of compound P-902 as a promising candidate for further development [4] [19]. As computational methods continue to advance, the integration of these fundamental molecular descriptors with other structural information promises to further accelerate the discovery and optimization of therapeutic agents for cancer and other diseases.
Exploring the Pharmacophore of Bioactive Triterpenoid Compounds
Field-based 3D-QSAR modeling represents a powerful computational approach in modern drug discovery, enabling researchers to correlate the three-dimensional molecular structures of compounds with their biological activity. Within the context of natural product research, this methodology is particularly valuable for optimizing the pharmacological potential of bioactive scaffolds. Maslinic acid (MA), a pentacyclic triterpenoid primarily derived from the olive tree (Olea europaea L.), has emerged as a promising candidate for such studies due to its diverse biological activities, including significant anticancer, anti-inflammatory, and antiviral properties [23]. The compound's chemical structure, characterized by multiple functional groups, offers ample opportunities for chemical modification to enhance potency and selectivity [24].
This application note details the integration of field-based 3D-QSAR modeling within a comprehensive research framework aimed at exploring the pharmacophore of maslinic acid and its analogs. By employing a combination of computational approaches and experimental validation, we outline a structured protocol for identifying key structural features responsible for biological activity, virtual screening of potential analogs, and experimental verification of predicted candidates. The workflow is designed to accelerate the development of novel triterpenoid-based therapeutics, with a specific focus on anticancer applications against breast cancer cell lines, particularly MCF-7 [4].
Computational Framework and Experimental Design
Research Reagent Solutions and Essential Materials
The following table catalogues key reagents, software tools, and materials essential for implementing the described pharmacophore exploration and 3D-QSAR workflow:
Table 1: Essential Research Reagents and Computational Tools for 3D-QSAR and Pharmacophore Modeling
| Item Name | Type/Category | Primary Function | Specific Application Example |
|---|---|---|---|
| Forge | Software | Molecular modeling & 3D-QSAR | Field-based QSAR model development using field point descriptors [4]. |
| ChemBio3D | Software | Chemical structure modeling | Conversion of 2D chemical structures into 3D models for analysis [4]. |
| FieldTemplater | Software Module | Pharmacophore generation | Creation of a 3D field point pattern hypothesis for bioactive conformation [4]. |
| ZINC Database | Database | Virtual compound library | Source of commercially available compounds for virtual screening [4]. |
| XED Force Field | Computational Method | Molecular mechanics | Calculation of molecular fields and conformational minimization [4]. |
| Maslinic Acid & Analogs | Chemical Compounds | Study Subjects | Training and test sets for model building and biological validation [4] [23]. |
| MCF-7 Cell Line | Biological Reagent | In vitro validation | Human breast cancer cell line for evaluating anticancer activity [4] [23]. |
| Lipinski's Rule of Five | Filtering Rule | ADMET screening | Preliminary assessment of oral bioavailability potential [4]. |
Integrated Workflow for Pharmacophore Exploration and Validation
The following diagram illustrates the comprehensive, multi-stage workflow for exploring the maslinic acid pharmacophore, from initial data preparation to final lead identification.
Core Experimental Protocols
Protocol 1: Development of a Field-Based 3D-QSAR Model
Objective: To construct a predictive 3D-QSAR model that elucidates the relationship between the molecular field properties of maslinic acid analogs and their anticancer activity against the MCF-7 cell line.
Materials and Software:
- Software: ChemBio3D, Forge (Cresset) with FieldTemplater module.
- Data: A curated set of 74 maslinic acid analogs with experimentally determined IC₅₀ values against MCF-7 cells [4].
- Computational Parameters: XED force field, maximum number of PLS components: 20, sample point maximum distance: 1.0 Å.
Procedure:
- Data Preparation and Conformation Hunt:
- Convert 2D structures of all compounds to 3D models using ChemBio3D.
- Utilize the FieldTemplater module to determine the bioactive conformation. Input a selection of highly active analogs (e.g., M-159, M-254, M-286) to generate a common pharmacophore hypothesis based on field and shape similarity [4].
- The software will calculate four molecular fields: positive electrostatic, negative electrostatic, van der Waals shape, and hydrophobicity.
Compound Alignment and Model Building:
- Align all 74 training set compounds onto the generated pharmacophore template within Forge.
- Use field point-based descriptors to build the 3D-QSAR model. Set the dependent variable (biological activity) as pIC₅₀ = -log(IC₅₀).
- Employ the Partial Least Squares (PLS) regression method, specifically the SIMPLS algorithm, to derive the model [4].
Model Validation:
- Partition the dataset into a training set (47 compounds) and a test set (27 compounds) using an activity-stratified method.
- Validate the model internally using the Leave-One-Out Cross-Validation (LOOCV) method to determine the cross-validated correlation coefficient (q²).
- Calculate the non-cross-validated regression coefficient (r²) for the training set.
- Externally validate the model's predictive power using the test set compounds that were excluded from the model building process [4].
Expected Outcome: A validated 3D-QSAR model with statistically significant r² and q² values (e.g., r² = 0.92 and q² = 0.75, as reported) [4]. The model will visually highlight 3D regions around the molecular scaffold where specific chemical fields (steric, electrostatic) enhance or diminish biological activity.
Protocol 2: Virtual Screening and Lead Identification
Objective: To utilize the developed 3D-QSAR model for screening large compound libraries to identify novel maslinic acid-like analogs with predicted high anticancer activity.
Materials and Software:
- Database: ZINC database of commercially available compounds.
- Software: Forge, Molecular docking software (e.g., AutoDock, GOLD).
- Filters: Lipinski's Rule of Five, ADMET risk assessment parameters.
Procedure:
- Similarity-Based Screening:
- Perform a similarity search in the ZINC database using the structure of maslinic acid as a query. Retrieve compounds with a Tanimoto similarity score ≥ 80% [4].
Activity Prediction and SAR Compliance:
- Screen the retrieved compounds (e.g., 593 hits) through the validated 3D-QSAR model to predict their pIC₅₀ values.
- Analyze the field pattern contribution of each predicted active compound and remove those with mismatched SAR field points.
Drug-Likeness and Synthetic Accessibility Filtering:
- Apply Lipinski's Rule of Five as a primary filter for oral bioavailability. Discard compounds that violate more than one rule.
- Subject the remaining compounds to ADMET risk assessment, evaluating parameters such as hepatotoxicity, mutagenicity, and CYP450 interactions. Prioritize compounds with a low overall risk score [4].
- Assess the synthetic accessibility of the predicted analogs to prioritize readily synthesizable candidates.
Molecular Docking:
- Perform molecular docking studies of the top-ranked compounds against identified protein targets relevant to breast cancer, such as the glucocorticoid receptor (NR3C1), HER2, AKR1B10, or PTGS2 [4] [9].
- Analyze binding poses, key interactions (hydrogen bonds, hydrophobic contacts), and docking scores relative to a known co-crystallized inhibitor.
Expected Outcome: A shortlist of top-hit compounds (e.g., 39 from an initial 593) that demonstrate favorable predicted activity, drug-like properties, and strong binding affinity to relevant targets. Compound P-902 has been previously identified as a best hit through this protocol [4] [9].
Protocol 3: In Vitro Validation of Anticancer Activity
Objective: To experimentally validate the cytotoxic activity of the computationally identified lead compounds against relevant cancer cell lines.
Materials:
- Cell Lines: MCF-7 (human breast cancer) [4], and other lines of interest (e.g., HT-29 colon cancer, B16F10 melanoma) [23].
- Reagents: Maslinic acid analogs, cell culture media, MTT reagent, apoptosis detection kits (Annexin V/PI), reagents for Western blotting.
Procedure:
- Cell Viability Assay (MTT):
- Seed cancer cells in 96-well plates and allow to adhere overnight.
- Treat cells with a concentration gradient of the test compounds (maslinic acid analogs) and a positive control (e.g., topotecan) for 24-72 hours.
- Add MTT solution to each well and incubate to allow formazan crystal formation.
- Dissolve crystals with DMSO and measure the absorbance at 570 nm.
- Calculate the percentage of cell viability and determine the IC₅₀ values for each compound [23].
Apoptosis Assay:
- Treat cells with the IC₅₀ concentration of the active analogs for 24-48 hours.
- Harvest cells and stain with Annexin V-FITC and Propidium Iodide (PI).
- Analyze stained cells using flow cytometry to distinguish between live (Annexin V⁻/PI⁻), early apoptotic (Annexin V⁺/PI⁻), late apoptotic (Annexin V⁺/PI⁺), and necrotic (Annexin V⁻/PI⁺) cell populations.
Mechanistic Studies via Western Blotting:
- Lyse treated cells and quantify protein content.
- Separate proteins by SDS-PAGE and transfer to a PVDF membrane.
- Probe the membrane with primary antibodies against proteins involved in apoptosis (e.g., cleaved caspase-3, caspase-9, Bax, Bcl-2) and relevant signaling pathways (e.g., p-AMPK, p-mTOR) [23].
- Use appropriate secondary antibodies and a chemiluminescence detection system to visualize protein expression levels.
Expected Outcome: Quantitative IC₅₀ data confirming the cytotoxicity of the predicted active compounds. Mechanism-based validation showing that active analogs, such as the previously studied P-902, induce apoptosis and modulate key cancer-related signaling pathways.
Key Research Findings and Data Analysis
Quantitative Structure-Activity Relationship Insights
The application of the described 3D-QSAR protocol yielded a highly predictive model. The model's statistical quality and the key molecular descriptors responsible for maslinic acid's anticancer activity are summarized below.
Table 2: 3D-QSAR Model Validation Metrics and Key Activity Descriptors
| Model Parameter | Value/Result | Interpretation |
|---|---|---|
| Regression Coefficient (r²) | 0.92 | Indicates a high degree of correlation between actual and model-predicted activity. |
| Cross-validated Coefficient (q²) | 0.75 | Demonstrates a robust and highly predictive model. |
| Number of Components | Not specified in detail | Optimized during PLS regression to avoid overfitting. |
| Key Electrostatic Descriptor | Positive & Negative electrostatic field points | Specific 3D regions where electron-withdrawing or donating groups modulate activity. |
| Key Steric/Hydrophobic Descriptor | Shape (vdW) & Hydrophobic field points | Specific 3D regions where bulky or hydrophobic groups significantly influence activity. |
The activity-atlas models generated from the training set provide a qualitative 3D visualization of the SAR. Key findings include:
- Activity Cliffs: Regions where small structural changes lead to significant activity drops, crucial for understanding molecular specificity.
- Favorable Hydrophobicity: Identification of specific areas on the maslinic scaffold where increased hydrophobicity enhances activity, likely improving target binding.
- Electrostatic Requirements: Mapping of regions that require a specific electrostatic potential (positive or negative) for optimal interaction with the biological target [4].
Experimental Validation and Anticancer Potency
Experimental validation of maslinic acid and its analogs across various cancer cell lines confirms the predictive power of the computational models. The following table compiles key in vitro efficacy data.
Table 3: Experimentally Determined IC₅₀ Values of Maslinic Acid in Various Cancer Cell Lines
| Cancer Type | Cell Line | IC₅₀ Value | Exposure Time | Key Mechanistic Findings |
|---|---|---|---|---|
| Colorectal Cancer | HCT116 | 18.48 μM | 12 h | ↑ cleaved caspases-3/-9, ↓ Bcl-2; ↑ p-AMPK, ↓ p-mTOR [23] |
| Colorectal Cancer | SW480 | 19.04 μM | 12 h | ↑ cleaved caspases-3/-9, ↓ Bcl-2; ↑ p-AMPK, ↓ p-mTOR [23] |
| Colorectal Cancer | Caco-2 | ~40 μg/mL (~85 μM) | 72 h | ↑ caspases-8/-3/-9, ↑ t-Bid, ↑ cytochrome C release [23] |
| Gastric Cancer | MKN28 | Low IC₅₀ (value not specified) | Not specified | Compared to other lines, showed higher sensitivity [23] |
| Melanoma | 518A2 | Low IC₅₀ (value not specified) | Not specified | Compared to other lines, showed higher sensitivity [23] |
The lead compound identified through virtual screening, P-902, demonstrated excellent compatibility with the pharmacophore model, favorable predicted binding energy with the NR3C1 target, and a promising in silico ADMET and toxicity profile, outperforming the control drug topotecan in several parameters [4] [9].
Visualizing the Mechanism of Action and SAR
The signaling pathways modulated by maslinic acid and its analogs, derived from experimental studies, can be summarized in the following diagram. This illustrates how these compounds exert their anticancer effects, providing a mechanistic context for the SAR findings.
The integrated protocol combining field-based 3D-QSAR, virtual screening, and experimental validation provides a robust and efficient framework for exploring the pharmacophore of bioactive triterpenoids like maslinic acid. The methodology successfully bridges computational predictions with experimental results, offering a powerful strategy for the rational design and optimization of novel triterpenoid-based anticancer agents. The identification of compound P-902 as a promising lead candidate against breast cancer MCF-7 cells underscores the practical utility of this approach. Future work should focus on the synthesis and more extensive biological profiling of the shortlisted analogs, including in vivo efficacy and toxicity studies, to further advance these candidates along the drug development pipeline.
A Step-by-Step Workflow for Building and Applying 3D-QSAR Models
Data Set Curation and 3D Structure Preparation of Analogs
The development of robust, predictive three-dimensional quantitative structure-activity relationship (3D-QSAR) models relies fundamentally on the quality and precision of the initial data curation and molecular structure preparation stages. Within the specific context of researching maslinic acid analogs, a natural pentacyclic triterpenoid with demonstrated anticancer and antiviral potential, this process becomes particularly critical [4] [24] [25]. Maslinic acid and its derivatives, belonging to the oleanane class of triterpenes, exhibit a broad spectrum of biological activities, attracting significant interest in drug discovery programs, especially against targets like breast cancer and highly pathogenic coronaviruses [4] [24]. This application note details a standardized protocol for the curation of chemical datasets and the generation of reliable 3D molecular structures for maslinic acid analogs, providing a validated foundation for subsequent field-based 3D-QSAR model development.
Data Collection and Curation
The initial phase involves the systematic assembly and curation of a high-quality dataset of maslinic acid analogs with associated biological activity data.
Data Sourcing and Selection Criteria
- Source Identification: Data for the training set of compounds should be collected from prior peer-reviewed literature and patents, ensuring biological activity data (e.g., IC₅₀, EC₅₀) is generated from consistent and reliable experimental assays, such as the human breast cancer cell line MCF-7 in vitro anticancer activity [4].
- Activity Data Standardization: Experimental activity values (IC₅₀) must be converted to their positive logarithmic scale (pIC₅₀) using the formula: pIC₅₀ = -log(IC₅₀), which is defined as the dependent variable for the QSAR model [4].
- Dataset Partitioning: The full dataset should be partitioned into a training set (for model building) and a test set (for model validation) using an activity-stratified method to ensure both sets represent a similar range of biological activity. A representative study used 47 compounds for training and 27 for testing [4].
Table 1: Key Data Curation Parameters from a Representative 3D-QSAR Study on Maslinic Acid Analogs
| Curation Parameter | Description | Application Example |
|---|---|---|
| Biological Endpoint | In vitro anticancer activity against MCF-7 cell line | IC₅₀ values collected for 74 maslinic acid analogs [4] |
| Activity Metric | pIC₅₀ (negative logarithm of IC₅₀) | Used as the dependent variable in QSAR model development [4] |
| Dataset Division | Activity-stratified partitioning | 47 compounds in training set, 27 in test set [4] |
| Structural Requirement | Defined core structure (maslinic acid) with modifications | Analogs based on the triterpene maslinic acid skeleton [4] |
Molecular Structure Preparation
Accurate 3D structure preparation is essential for the subsequent conformational analysis and molecular alignment steps in 3D-QSAR.
Protocol: 2D to 3D Structure Conversion and Optimization
This protocol outlines the process of generating energetically minimized 3D structures from 2D chemical representations. Objective: To convert two-dimensional (2D) chemical structures of maslinic acid analogs into their accurate, low-energy three-dimensional (3D) conformations. Materials:
- Software: ChemBio3D Ultra (PerkinElmer/CambridgeSoft, UK) or comparable molecular modeling software [4].
- Force Field: XED (eXtended Electron Distribution) force field or other suitable force fields (e.g., MMFF94, CHARMM) [4].
Methodology:
- Input Structure Creation: Draw or import the 2D chemical structure of each maslinic acid analog into the software's molecular editor.
- 3D Conversion: Use the software's conversion module to generate an initial 3D coordinate set from the 2D structure.
- Energy Minimization: Subject the initial 3D structure to geometry optimization using the selected force field. The minimization should be run until a gradient cut-off value of 0.1 kcal/mol is achieved to ensure a stable, low-energy conformation [4].
- Structure Validation: Check the minimized structures for valency, unusual bond lengths/angles, and overall stereochemical integrity.
Conformational Analysis and Pharmacophore Generation
With no structural information available for maslinic acid in its target-bound state, a common pharmacophore hypothesis is developed to represent the putative bioactive conformation.
Protocol: Bioactive Conformation Hunt and Pharmacophore Modeling
Objective: To determine a representative pharmacophore template and the likely bioactive conformation for maslinic acid analogs using field and shape similarity methods. Materials:
- Software: FieldTemplater module in Forge v10 (Cresset, UK) or similar software (e.g., MOE, Schrödinger Phase) [4].
- Input Structures: A set of known active compounds (e.g., M-159, M-254, M-286, M-543, M-659 from the training set) [4].
Methodology:
- Template Generation: In the FieldTemplater module, use the selected active compounds to generate a common hypothesis based on their field and shape information.
- Field Point Calculation: The software calculates four different molecular fields for each compound: positive electrostatic, negative electrostatic, shape (van der Waals), and hydrophobic [4]. These field points provide a condensed representation of the molecule's key interaction potential.
- Annotation: The derived hypothesis is annotated with its calculated field points, resulting in a 3D field point pattern that serves as the pharmacophore template for subsequent alignment.
Diagram 1: Pharmacophore Generation Workflow
3D-QSAR Model Input Preparation
The final preparatory stage involves aligning all compounds to the generated pharmacophore to create the input matrix for the 3D-QSAR analysis.
Protocol: Compound Alignment and Descriptor Calculation
Objective: To align all training and test set compounds onto the pharmacophore template and calculate field point-based descriptors for 3D-QSAR. Materials:
- Software: Forge v10 (Cresset, UK) or comparable 3D-QSAR software [4].
- Input: Pharmacophore template from Section 4.1 and energy-minimized 3D structures of all dataset compounds from Section 3.1.
Methodology:
- Template Transfer: Transfer the pharmacophore template obtained from the FieldTemplater module into the 3D-QSAR software (e.g., Forge).
- Molecular Alignment: Align each compound in the dataset (both training and test sets) onto the identified pharmacophore template. The overlays with the best-matching low-energy conformations should be used [4].
- Descriptor Calculation: After alignment, use field point-based descriptors to build the 3D-QSAR model. Set the sample point maximum distance to 1.0 Å to define the grid for descriptor calculation [4].
- Model Building Setup: Use the Partial Least Squares (PLS) regression method, specifically the SIMPLS algorithm, to build the model. The maximum number of components can be set to 20 for initial analysis [4].
Table 2: Essential Research Reagent Solutions for 3D-QSAR of Maslinic Acid Analogs
| Research Reagent / Tool | Function / Application | Specific Use Case / Note |
|---|---|---|
| ChemBio3D Ultra | 2D to 3D structure conversion and initial geometry optimization | Preparation of initial 3D molecular structures for conformational analysis [4] |
| Forge Software (Cresset) | Field-based alignment, pharmacophore generation, and 3D-QSAR model development | Core platform for field-point calculation and PLS-based model building [4] |
| XED Force Field | Calculation of molecular force fields and energy minimization | Used for conformational hunt and generating field points (electrostatics, hydrophobic, shape) [4] |
| FieldTemplater Module | Identification of common pharmacophore from a set of active molecules | Determines bioactive conformation hypothesis when target-bound structure is unknown [4] |
| ZINC Database | Public database of commercially available compounds for virtual screening | Source for retrieving potential maslinic acid-like hits based on Tanimoto similarity [4] |
Diagram 2: 3D-QSAR Input Preparation Workflow
Molecular Alignment and Conformational Analysis Strategies
Within the broader context of developing field-based 3D-QSAR models for maslinic acid analogs with anticancer activity, molecular alignment and conformational analysis represent the most critical steps for generating predictive and interpretable models [26]. The fundamental premise of 3D-QSAR techniques, including Comparative Molecular Field Analysis (CoMFA) and Comparative Molecular Similarity Indices Analysis (CoMSIA), relies on the accurate spatial orientation of molecules within a common coordinate system [17]. Incorrect alignment introduces noise that fundamentally compromises model validity, while proper alignment captures the essential signal that correlates three-dimensional molecular features with biological activity [26]. This protocol details systematic strategies for molecular alignment and conformational analysis, specifically contextualized within our research on maslinic acid derivatives targeting the MCF-7 breast cancer cell line [3] [19].
The strategic importance of alignment is underscored by findings that the majority of signal in 3D-QSAR models derives from molecular alignment rather than electrostatic contributions alone [26]. For our studies on maslinic acid analogs, which exhibit structural diversity while maintaining a common triterpene core, we have implemented and validated multiple alignment strategies to establish robust structure-activity relationships for anticancer activity [3] [9].
Key Alignment Methodologies
Pharmacophore-Guided Alignment
For the maslinic acid analog series, pharmacophore-guided alignment proved essential for establishing a biologically relevant orientation. This approach identifies common molecular features that correlate with binding to the biological target [3].
Experimental Protocol:
- Identify a Reference Molecule: Select a compound with high anticancer activity against MCF-7 cells and well-defined structural features. For maslinic acid analogs, we used the compound with the highest experimentally determined IC50 value as the initial reference [3].
- Pharmacophore Feature Generation: Using structure-activity data, identify critical pharmacophore elements including hydrogen bond donors/acceptors, hydrophobic regions, and electrostatic characteristics. In our maslinic acid study, field points representing steric and electrostatic properties were mapped to define the pharmacophore space [9].
- Molecular Superimposition: Align all analogs to the reference pharmacophore using field and shape similarity metrics. Software tools such as Forge or Sybyl-X implement algorithms that maximize spatial overlap of pharmacophore features [26].
- Validation: Assess alignment quality by visual inspection and statistical metrics. The resulting alignment should place common structural elements (e.g., the triterpene core in maslinic analogs) in consistent spatial positions [27].
Table 1: Statistical Performance of 3D-QSAR Models Using Different Alignment Strategies for Maslinic Acid Analogs
| Alignment Method | r² | q² | SEE | F Value | Application Context |
|---|---|---|---|---|---|
| Pharmacophore-Guided | 0.92 | 0.75 | 0.109 | 52.714 | Maslinic acid analogs against MCF-7 [3] |
| Common Scaffold | 0.915 | 0.569 | 0.109 | 52.714 | 6-hydroxybenzothiazole-2-carboxamides [27] |
| Template-Based | 0.61 | - | - | - | Androgen receptor binders [28] |
| 2D→3D Conversion | 0.61 | - | - | - | Androgen receptor binders (alignment-free) [28] |
Common Scaffold Alignment
This technique aligns molecules based on their maximum common substructure (MCS), particularly effective for congeneric series like maslinic acid derivatives that share a triterpene core [17].
Experimental Protocol:
- Scaffold Identification: Determine the maximum common substructure across all compounds in the dataset. Computational tools such as RDKit or Schrödinger's Canvas MCS can automate this process [17].
- Conformation Generation: Generate biologically relevant 3D conformations for each analog. For the maslinic acid study, we used ChemBio 3D for initial structure generation followed by geometry optimization with molecular mechanics or semi-empirical quantum methods [9].
- Structural Alignment: Superimpose compounds by fitting atoms of the common scaffold to corresponding atoms in the reference molecule. In Sybyl-X, this is achieved through the "Align Database" command using atom-to-atom matching [27].
- Refinement: Manually inspect and adjust alignments where automated methods produce suboptimal results, particularly for flexible side chains or ring systems [26].
Alignment-Independent Techniques
For structurally diverse datasets where common alignment rules are difficult to establish, alignment-independent 3D-QSAR approaches offer a valuable alternative. The 3D-QSDAR (Quantitative Spectral Data-Activity Relationship) technique employs NMR chemical shifts and interatomic distances to create alignment-independent descriptors [28] [29].
Experimental Protocol:
- Conformation Generation: Convert 2D structures to 3D coordinates without extensive energy minimization. Studies on androgen receptor binders demonstrated that simple 2D→3D conversion (importing directly from ChemSpider) could produce predictive models in only 3-7% of the time required for energy-minimized conformations [28].
- Descriptor Calculation: Calculate alignment-independent descriptors based on intrinsic molecular properties. In 3D-QSDAR, this involves creating fingerprints from 13C NMR chemical shifts (δ) of carbon atom pairs and their interatomic distances [28].
- Model Building: Use partial least squares (PLS) regression to correlate descriptors with biological activity. For the androgen receptor dataset, this approach produced models with R²Test = 0.61, comparable to alignment-dependent methods [28] [29].
Integrated Workflow for Molecular Alignment
Based on our experience with maslinic acid analogs and literature best practices, we have developed a comprehensive workflow that integrates multiple alignment strategies to ensure robust 3D-QSAR model development.
Figure 1: Comprehensive workflow for molecular alignment strategies in 3D-QSAR model development
Critical Considerations for Alignment Quality
Bioactive Conformation Selection
The assumption that global energy minima represent bioactive conformations represents a significant limitation in 3D-QSAR. Molecules frequently adopt higher-energy conformations when binding to biological targets [17]. For the maslinic acid analogs, we addressed this through:
- Multiple Conformation Analysis: Generating multiple low-energy conformers and testing alignment with each
- Template-Based Alignment: Using known active compounds or crystallographic data as templates when available
- Consensus Approaches: Building models from different conformations and averaging predictions, which achieved a consensus R²Test = 0.65 for androgen receptor binders [28]
Managing Molecular Flexibility
Molecular flexibility significantly impacts alignment quality and model performance. The Kier Index of Molecular Flexibility provides a quantitative measure to assess this factor [28]. In studies of androgen receptor binders, approximately 48% of compounds exhibited moderate flexibility (Kier Index 3.0-5.0), while 19% were highly flexible (Kier Index >5.0) [28].
Protocol for Flexible Molecules:
- Conformational Sampling: Use systematic or stochastic methods to generate representative conformer ensembles
- Alignment Refinement: Employ field-based similarity scoring to optimize alignment of flexible regions
- Multiple References: Establish 3-4 reference molecules that collectively represent the conformational space of the dataset [26]
Validation of Alignment Quality
Critical Protocol Step: Alignment must be finalized before any QSAR modeling begins. Adjusting alignments based on model performance metrics constitutes a fundamental methodological error that invalidates model statistics [26].
Table 2: Research Reagent Solutions for Molecular Alignment and 3D-QSAR
| Tool/Category | Specific Software/Resource | Function in Alignment/3D-QSAR |
|---|---|---|
| Molecular Modeling | Sybyl-X [27], ChemBio 3D [9], RDKit [17] | 3D structure generation, geometry optimization, conformation analysis |
| Alignment Algorithms | FieldTemplater [26], Maximum Common Substructure (MCS) [17], Bemis-Murcko Scaffold [17] | Molecular superposition based on fields, shape, or common scaffolds |
| 3D-QSAR Methods | CoMFA, CoMSIA [17] [27], 3D-QSDAR [28] | Calculate steric/electrostatic fields and build predictive models |
| Validation Tools | Leave-One-Out (LOO) cross-validation [3] [27], External test set prediction | Assess model robustness and predictive capability |
Molecular alignment remains both a challenge and opportunity in 3D-QSAR modeling. For our research on maslinic acid analogs, pharmacophore-guided alignment combined with rigorous validation produced models with excellent predictive statistics (r² = 0.92, q² = 0.75) [3]. The strategic selection of alignment methodology must be guided by dataset characteristics, with common scaffold alignment suitable for congeneric series, pharmacophore alignment for diverse structures with common features, and alignment-independent approaches for large, highly diverse datasets [28] [17] [26]. By adhering to the detailed protocols outlined in this application note, researchers can implement alignment strategies that maximize the signal capture essential for developing predictive 3D-QSAR models in drug discovery programs.
Developing the PLS Regression Model and Validation Metrics (r², q²)
Within the context of field-based 3D-QSAR model development for maslinic acid analogs, Partial Least Squares (PLS) regression serves as the critical statistical engine that transforms molecular field data into a predictive model for anticancer activity. PLS regression is particularly suited for this task as it handles the high-dimensional, multicollinear descriptor data generated by field-based analysis—where descriptors represent steric, electrostatic, and hydrophobic properties around the molecular surface. The model's performance and predictive capability are quantitatively assessed through two fundamental metrics: R² (goodness-of-fit) and Q² (goodness-of-prediction). These metrics provide researchers with validated tools for optimizing maslinic acid derivatives against breast cancer cell lines, specifically the MCF-7 cell line used in our referenced study [4].
Theoretical Foundations of R² and Q²
Mathematical Definitions and Calculations
The performance of a PLS regression model is evaluated using two primary metrics that assess different aspects of model quality [30]:
R² (R-squared): Calculated as 1 - RSS/TSS, where:
- RSS (Residual Sum of Squares) = $\sum(y-\hat{\mathbf{y}})^2$
- TSS (Total Sum of Squares) = $\sum(y - \bar{\mathbf{y}})^2$
- R² measures how well the model fits the training data and explains the variance in the dependent variable (e.g., pIC₅₀ values).
Q² (Q-squared): Calculated as 1 - PRESS/TSS, where:
- PRESS (Predictive Residual Sum of Squares) = $\sum(y-\hat{\mathbf{y}})^2$ from held-out data
- Q² evaluates the model's predictive capability on test data not used in model training.
Interpretation in Model Validation
In practice, these metrics are interpreted as [30] [31]:
- R² represents the goodness-of-fit or explained variation
- Q² represents the goodness-of-prediction or predicted variation
Table 1: Interpretation Guidelines for R² and Q² Values in PLS Regression
| Metric | Excellent | Good | Acceptable | Poor |
|---|---|---|---|---|
| R² | >0.90 | 0.75-0.90 | 0.60-0.75 | <0.60 |
| Q² | >0.70 | 0.50-0.70 | 0.30-0.50 | <0.30 |
For model validity, Q² should be greater than 0.5, and the difference between R² and Q² should not exceed 0.3 to indicate robustness without overfitting [4] [31]. In the maslinic acid analog study, the derived QSAR model demonstrated R² = 0.92 and Q² = 0.75, indicating an excellent model with high explanatory power and strong predictive capability [4].
Experimental Protocol: PLS-Based 3D-QSAR Model Development
Data Collection and Structure Preparation
Objective: Compile and prepare a training set of compounds with known biological activities for 3D-QSAR model development.
Materials and Reagents:
- Maslinic acid analogs with reported IC₅₀ values against MCF-7 breast cancer cell line
- ChemBio3D Ultra (PerkinElmer/CambridgeSoft) or equivalent molecular modeling software
Procedure:
- Collect 2D chemical structures of maslinic acid analogs from scientific literature and databases
- Convert 2D structures to 3D conformations using energy minimization in molecular modeling software
- Convert experimental IC₅₀ values to pIC₅₀ using the formula: pIC₅₀ = -log(IC₅₀)
- Divide the dataset (e.g., 74 compounds) into training set (e.g., 47 compounds) and test set (e.g., 27 compounds) using activity-stratified sampling to ensure representative distribution [4]
Pharmacophore Generation and Molecular Alignment
Objective: Identify common 3D structural features and align compounds for field analysis.
Materials and Reagents:
- Forge v10 (Cresset Inc., UK) or equivalent field-based QSAR software
- FieldTemplater module for pharmacophore generation
Procedure:
- Select representative highly active compounds (e.g., M-159, M-254, M-286, M-543, M-659) for template generation
- Generate a common pharmacophore hypothesis using field points and shape information
- Calculate four molecular field types: positive electrostatic, negative electrostatic, shape (van der Waals), and hydrophobic
- Align all training set compounds to the generated pharmacophore template [4]
PLS Regression Analysis
Objective: Develop the quantitative relationship between molecular fields and biological activity.
Materials and Reagents:
- Forge v10 QSAR module or equivalent statistical software with PLS capability
- SIMPLS algorithm for PLS regression
Procedure:
- Set PLS parameters: maximum components to 20, sample point maximum distance to 1.0 Å
- Use both electrostatic and volume fields as descriptors
- Implement leave-one-out (LOO) cross-validation by setting Y-scrambles to 50
- Run PLS regression to generate the initial model [4]
- Determine the optimal number of components that maximizes Q² without overfitting
Diagram 1: PLS-QSAR Model Development Workflow
Validation Protocols for R² and Q²
Internal Validation: Leave-One-Out Cross-Validation
Objective: Assess model robustness and predictive capability using training data.
Procedure:
- Remove one compound from the training set
- Rebuild the PLS model with the remaining N-1 compounds
- Predict the activity of the omitted compound
- Repeat for all compounds in the training set
- Calculate Q² using the PRESS and TSS from all predictions [4]
External Validation: Test Set Prediction
Objective: Evaluate model performance on completely independent data.
Procedure:
- Use the final PLS model developed with the full training set
- Predict activities for the test set compounds (not used in model building)
- Calculate R²ₜₑₛₜ and Q²ₜₑₛₜ for the test set
- Compare with training set metrics to confirm model generalizability [4]
Advanced Validation: R² and Q² Intercepts
Objective: Detect potential overfitting and validate model significance.
Procedure:
- Perform permutation testing by scrambling response variables (Y-scrambling)
- Build multiple models with randomized activities
- Plot R² and Q² values of randomized models against correlation coefficients
- Check intercept values: R² intercept should be near 0, and Q² intercept should be <0.05 [31]
Table 2: Validation Metrics and Acceptance Criteria for PLS Models
| Validation Type | Metric | Calculation | Acceptance Criteria |
|---|---|---|---|
| Goodness-of-Fit | R² | 1 - RSS/TSS | >0.7 for reliable models |
| Internal Validation | Q² (LOO-CV) | 1 - PRESS/TSS | >0.5 for predictive models |
| Model Significance | R² Intercept | From Y-scrambling | Close to 0 |
| Predictive Robustness | Q² Intercept | From Y-scrambling | <0.05 |
Case Study: Maslinic Acid Analogs 3D-QSAR
Application to Breast Cancer Research
In the referenced study on maslinic acid analogs for anticancer activity against breast cancer cell line MCF-7, the implemented PLS regression model demonstrated exceptional performance with R² = 0.92 and Q² = 0.75 [4]. This indicates that 92% of the variance in anticancer activity could be explained by the molecular field descriptors, with a robust predictive ability of 75%.
Model Implementation Details
Dataset:
- 74 compounds of maslinic acid analogs with known IC₅₀ values
- Training set: 47 compounds
- Test set: 27 compounds
Molecular Descriptors:
- Field point-based descriptors including electrostatic, shape, and hydrophobic fields
- Descriptors calculated at grid points around aligned molecules
Statistical Parameters:
- PLS algorithm: SIMPLS
- Maximum components: 20
- Validation method: Leave-one-out (LOO) cross-validation [4]
Results and Research Impact
The validated model successfully identified key structural features controlling anticancer activity:
- Positive electrostatic field points in specific regions increased activity
- Steric bulk in certain areas enhanced potency
- Hydrophobic interactions at defined positions improved binding
This model enabled virtual screening of 593 compounds from the ZINC database, ultimately identifying 39 top hits with predicted high activity against MCF-7 breast cancer cells [4].
The Scientist's Toolkit: Essential Research Reagents and Software
Table 3: Essential Research Tools for PLS-Based 3D-QSAR Modeling
| Tool/Reagent | Function | Application in Protocol |
|---|---|---|
| ChemBio3D Ultra | 3D structure generation | Convert 2D chemical structures to optimized 3D conformations |
| Forge v10 with FieldTemplater | Pharmacophore generation and field calculation | Identify common 3D features and calculate molecular field descriptors |
| SIMPLS Algorithm | PLS regression implementation | Build quantitative structure-activity relationship models |
| Leave-One-Out Cross-Validation | Model validation | Assess predictive capability without external test set |
| ZINC Database | Compound library | Source of potential new compounds for virtual screening |
| Lipinski's Rule of Five | Drug-likeness filter | Evaluate oral bioavailability of predicted active compounds [4] |
Diagram 2: Relationship Between PLS Model and Validation Metrics
The development and validation of PLS regression models using R² and Q² metrics provides a robust framework for 3D-QSAR studies in maslinic acid analog research. Through proper implementation of the protocols outlined—including careful data preparation, molecular alignment, PLS regression, and comprehensive validation—researchers can build predictive models that significantly accelerate the discovery of novel anticancer agents. The case study on maslinic acid analogs demonstrates how these methodologies successfully identified promising compounds with potential therapeutic value against breast cancer, showcasing the power of integrated computational and experimental approaches in modern drug discovery.
Interpreting Contour Maps to Guide Molecular Design
Within the framework of developing field-based three-dimensional quantitative structure-activity relationship (3D-QSAR) models for maslinic acid analog research, contour maps serve as indispensable visual tools for rational molecular design. These maps translate complex computational results into actionable insights by graphically representing the regions around a molecule where specific chemical features enhance or diminish biological activity. For maslinic acid analogs tested against the Breast cancer cell line MCF-7, 3D-QSAR models define the molecular-level understanding and pinpoint critical regions of the structure-activity relationship [4] [19]. The model for this series, built using field point-based descriptors aligned to a common pharmacophore, demonstrated high predictive accuracy with an r² of 0.92 and a cross-validated q² of 0.75 [4]. Interpreting the contour maps generated from such models allows medicinal chemists to visualize favorable and unfavorable chemical regions, guiding the strategic optimization of lead compounds like maslinic acid to improve anticancer potency.
Key Field Types and Their Interpretation
In field-based 3D-QSAR, the molecular interactions are typically described by several key field types. Each field type generates its own contour map, highlighting regions in 3D space where increased or decreased presence of a specific molecular property is correlated with biological activity.
Table 1: Interpretation of 3D-QSAR Contour Map Features
| Field Type | Favorable Region (High Activity) | Unfavorable Region (Low Activity) | Structural Implication for Maslinic Acid Analogs |
|---|---|---|---|
| Electrostatic | Positive (Blue) contours near electronegative groups on the molecule; Negative (Red) contours near electropositive groups. | Positive contours near electropositive groups; Negative contours near electronegative groups. | Indicates areas where introducing electron-withdrawing or -donating groups can enhance activity through dipole interactions or hydrogen bonding [4]. |
| Steric (Shape) | Green contours indicate regions where bulky substituents increase activity. | Yellow (or Red) contours indicate regions where bulky substituents decrease activity due to clashing with the receptor. | Guides the addition or removal of alkyl chains, aromatic rings, or other bulky groups to optimize fit within a binding pocket [4] [32]. |
| Hydrophobic | Orange contours suggest regions where hydrophobic groups enhance activity. | White contours suggest regions where hydrophobic groups are detrimental, favoring hydrophilic moieties. | Directs the placement of non-polar groups (e.g., alkyl chains) to engage in favorable van der Waals interactions or desolvation effects [4]. |
The interpretation process involves analyzing these colored contours in the context of the aligned molecular skeleton. For example, in the maslinic acid study, the activity-atlas models revealed the positive and negative electrostatics sites, favorable and unfavorable hydrophobicity, and the favorable shape of the active compounds [4]. A contour map showing a green steric region adjacent to a specific ring on the maslinic acid core would suggest that adding a methyl or ethyl group at that position could improve activity, whereas a yellow steric region very close to another part of the structure would warn against adding bulk there.
Experimental Protocol for Generating and Validating Contour Maps
The following detailed protocol outlines the steps for developing a validated 3D-QSAR model and its corresponding contour maps, based on the methodology applied to maslinic acid analogs [4].
Data Collection and Structure Preparation
- Source a Training Set: Collect a series of compounds (e.g., 74 maslinic acid analogs) with known experimental biological activity (e.g., IC₅₀ against MCF-7 cells) from literature or in-house assays.
- Convert and Optimize Structures: Draw 2D chemical structures and transform them into 3D models using molecular modeling software (e.g., ChemBio3D). Conduct a conformational hunt to identify low-energy conformations using the XED (eXtended Electron Distribution) force field.
- Generate a Pharmacophore Hypothesis: Use a tool like FieldTemplater (in Forge software) on a subset of highly active and diverse compounds. The software uses field and shape information to derive a hypothesis for the bioactive conformation, resulting in a 3D field point pattern that serves as a common alignment template.
Model Development, Alignment, and Contour Map Generation
- Align Compounds: Align all training set compounds onto the generated pharmacophore template. This ensures all molecules are superimposed in a manner that reflects their putative bioactive orientation.
- Build the 3D-QSAR Model: Using the aligned compounds, calculate field point-based descriptors (electrostatic, steric, hydrophobic) and use the Partial Least Squares (PLS) regression method to build a quantitative model linking molecular fields to biological activity (pIC₅₀ = -log IC₅₀).
- Generate Contour Maps: The modeling software (e.g., Forge) will generate the contour maps based on the derived PLS model coefficients. These maps visually represent the model's findings, showing the specific regions described in Table 1.
Model Validation
- Internal Validation: Perform Leave-One-Out (LOO) cross-validation to obtain the cross-validated correlation coefficient (q²). A value of q² > 0.5 is generally considered acceptable, with the maslinic acid model achieving a q² of 0.75 [4].
- External Validation: Predict the activity of a test set of compounds (e.g., 27 compounds for the maslinic acid study) that were not included in the model training. A strong correlation between predicted and actual activities confirms the model's predictive power and the reliability of its contour maps.
The following workflow diagram illustrates the key stages of this process.
The Scientist's Toolkit: Essential Research Reagents and Software
Successfully executing a 3D-QSAR study requires a suite of specialized computational tools and reagents.
Table 2: Essential Research Tools for 3D-QSAR and Contour Map Analysis
| Tool / Reagent | Function / Description | Example Software/Provider |
|---|---|---|
| Molecular Modeling Suite | Provides an integrated environment for structure building, conformational analysis, pharmacophore generation, and 3D-QSAR model development. | Forge (Cresset); Sybyl-X; BIOVIA Discovery Studio [4] [33] [32]. |
| Chemical Database | A source of known active compounds for training set creation and a repository for virtual screening of new analogs. | ZINC Database; in-house corporate libraries [4]. |
| Pharmacophore Generation Tool | Identifies the essential 3D arrangement of chemical features responsible for a compound's biological activity, used for molecular alignment. | FieldTemplater module in Forge [4]. |
| QSAR Validation Scripts | Custom or built-in scripts for performing statistical validation methods like Leave-One-Out (LOO) to ensure model robustness. | Typically integrated within major molecular modeling suites (e.g., Forge, Sybyl-X) [4] [32]. |
| Visualization Software | Allows researchers to visually inspect aligned molecules, interpret contour maps, and analyze molecular docking poses. | BIOVIA Discovery Studio Visualizer; PyMOL [33]. |
Application in Maslinic Acid Analog Optimization
The practical application of contour map interpretation is exemplified in the maslinic acid study. The 3D-QSAR and activity-atlas models revealed the average shape, hydrophobic regions and electrostatic patterns of active compounds [4]. This information was "mined and mapped to virtually screen potential analogs" from databases. By applying the insights from the contour maps—such as where to introduce bulky groups or modify electrostatic potential—researchers virtually screened 593 compounds. These were filtered down using Lipinski's Rule of Five and ADMET risk assessments, leading to 39 top hits [4]. Subsequent docking studies against targets like HER2 and NR3C1 identified a best-hit compound, P-902, demonstrating how contour map interpretation directly facilitates the transition from computational analysis to identified lead candidates [4] [19]. This entire workflow, from model building to lead identification, provides a powerful protocol for accelerating the early drug discovery process for natural product derivatives like maslinic acid analogs.
Integrating Virtual Screening and Lipinski's Rule of Five
The process of modern drug discovery necessitates the efficient identification of candidate molecules with favorable pharmacological profiles. Within this context, virtual screening has emerged as a powerful computational method for filtering large chemical libraries to select compounds with a high probability of biological activity [34]. When integrated with established principles of drug-likeness, such as Lipinski's Rule of Five (RO5), virtual screening becomes a potent strategy for prioritizing lead compounds with a greater likelihood of oral bioavailability [35] [4]. This Application Note details protocols for the synergistic combination of these approaches, framed within a research program focused on developing field-based 3D-QSAR models for maslinic acid analogs with anticancer activity [3] [4].
The Rule of Five states that, in general, an orally active drug should exhibit no more than one violation of the following criteria [35]:
- Molecular weight (MW) less than 500 Da
- Octanol-water partition coefficient (log P) less than 5
- No more than 5 hydrogen bond donors (HBD)
- No more than 10 hydrogen bond acceptors (HBA)
Applying this rule as a primary filter during virtual screening helps to eliminate compounds with poor absorption or permeation characteristics early in the discovery pipeline, thereby conserving resources for the synthesis and biological evaluation of more promising candidates [36] [34].
Key Concepts and Definitions
Lipinski's Rule of Five and Its Role in Lead Optimization
Lipinski's Rule of Five describes molecular properties that influence a compound's pharmacokinetics in the human body, particularly its absorption, distribution, metabolism, and excretion (ADME) [35]. It is a rule of thumb critical for maintaining drug-likeness during the hit-to-lead optimization phase, as attrition rates in clinical trials are lower for RO5-compliant compounds [35]. The rule has been extended into a "Rule of Three" (RO3) for defining lead-like compounds in screening libraries, which proposes more stringent criteria (e.g., MW < 300, log P ≤ 3, HBD ≤ 3, HBA ≤ 3) to provide medicinal chemists greater flexibility for optimization while retaining final drug-likeness [35].
Field-Based 3D-QSAR in a Maslinic Acid Research Context
Field-based 3D-QSAR is a computational technique that develops a model correlating the biological activity of a set of compounds with their three-dimensional molecular field properties, such as electrostatics, hydrophobicity, and shape [3] [37]. In a documented study on maslinic acid analogs for anticancer activity against the MCF-7 breast cancer cell line, a field-based 3D-QSAR model was developed with a high regression coefficient (r² = 0.92) and a good cross-validated correlation coefficient (q² = 0.75) [3] [4]. This model helped identify key structural features responsible for activity. Subsequently, a virtual screen of the ZINC database yielded 593 hits, which were then filtered using Lipinski's Rule of Five for oral bioavailability, dramatically narrowing the list to 39 top candidates for further investigation [4] [19]. This workflow exemplifies the practical integration of these methodologies.
Application Notes & Protocols
Workflow for Integrated Virtual Screening
The following diagram illustrates the logical workflow for integrating Lipinski's Rule of Five with virtual screening and subsequent validation in a drug discovery project, such as for maslinic acid analogs.
Protocol 1: Virtual Screening and RO5 Filtering
This protocol describes the steps for performing a virtual screen and applying the Rule of Five filter.
- Objective: To identify potential drug-like leads from a large chemical database using a structure-based or ligand-based virtual screen, followed by filtration for oral bioavailability.
- Background: Virtual screening rapidly assesses massive compound libraries. Pre-filtering based on RO5 ensures that computational and experimental resources are focused on molecules with a higher probability of becoming orally administered drugs [34].
Materials & Reagents:
- Chemical Database: ZINC database (http://zinc.docking.org/) or similar [34].
- Software for RO5 Calculation: Software with calculator plugins (e.g., ChemAxon's Marvin, Schrödinger's QikProp) [35] [36].
- Structure Preparation & Visualization Tool: Avogadro, Chimera, or Maestro [34].
- Hardware: Standard computer workstation.
Procedure:
- Database Sourcing: Download compound structures from a database such as ZINC. An initial subset can be created based on similarity to a known active compound (e.g., maslinic acid) [4].
- Structure Preparation:
- Convert 2D structures into 3D formats.
- Optimize the geometry of all compounds using a molecular mechanics force field (e.g., MMFF94 in Avogadro) [34].
- Pharmacophore-Based Virtual Screening:
- Generate a pharmacophore hypothesis using active compounds. In the maslinic acid study, the FieldTemplater module in Forge software was used to define a template based on shape, electrostatics, and hydrophobicity [4].
- Align all database compounds to this pharmacophore template.
- Score and rank the compounds based on their fit to the hypothesis.
- Apply Lipinski's Rule of Five Filter:
- For all high-ranking compounds from Step 3, calculate the four key physicochemical properties [35] [34]:
- Molecular Weight (MW)
- Calculated log P (e.g., ClogP)
- Number of Hydrogen Bond Donors (HBD)
- Number of Hydrogen Bond Acceptors (HBA)
- Filter the list to retain only those compounds that violate no more than one of the RO5 criteria.
- For all high-ranking compounds from Step 3, calculate the four key physicochemical properties [35] [34]:
- Output: A refined list of virtual hit compounds that are both predicted to be active and possess drug-like properties.
Protocol 2: Post-Screening Validation and Optimization
This protocol covers the subsequent steps for validating the filtered hits and optimizing leads.
- Objective: To further evaluate RO5-compliant virtual hits through advanced computational analyses and propose optimized lead compounds.
- Background: Passing the RO5 filter is a preliminary step. Compounds must also be evaluated for target binding, synthetic feasibility, and other ADMET properties to de-risk the project before experimental work begins [4].
Materials & Reagents:
- Molecular Docking Software: AutoDock Vina, GOLD, or Glide [34].
- Molecular Dynamics Software: GROMACS, AMBER, or NAMD.
- ADMET Prediction Software: QikProp, admetSAR, or Discovery Studio [36].
Procedure:
- Secondary Multi-Parameter Screening:
- Subject the RO5-filtered hits to additional filters, which may include:
- Molecular Docking:
- Prepare the protein structure (e.g., from the Protein Data Bank) by removing water molecules and adding hydrogens [34].
- Define a docking grid around the active site of the target protein.
- Dock the top hits from Step 1 into the binding site.
- Analyze the binding pose and docking score (binding affinity). Select compounds that form key interactions with the target and have favorable binding energies [37] [34].
- Molecular Dynamics (MD) Simulation:
- Solvate the protein-ligand complex from docking in a water box and add ions to neutralize the system.
- Run an MD simulation (e.g., for 50-100 ns) to evaluate the stability of the ligand in the binding pocket. A stable RMSD plot indicates a stable complex [37].
- Lead Optimization with 3D-QSAR:
- Use the field-based 3D-QSAR model (pre-built from known actives) to predict the activity of the proposed hits and their analogs.
- Analyze the 3D-QSAR contour maps (e.g., activity-atlas models) to identify regions where structural modifications would increase potency or optimize other properties [3] [4].
- Propose and design new analogs based on these insights.
Data Presentation and Analysis
The following tables summarize the critical data and parameters involved in the integrated screening protocol.
Table 1: Lipinski's Rule of Five Criteria and Typical Ranges for Lead-like Compounds [35]
| Property | Lipinski's Rule of Five (RO5) Threshold | Lead-like Rule of Three (RO3) Threshold |
|---|---|---|
| Molecular Weight (MW) | < 500 Da | < 300 Da |
| log P | < 5 | ≤ 3 |
| H-Bond Donors (HBD) | ≤ 5 | ≤ 3 |
| H-Bond Acceptors (HBA) | ≤ 10 | ≤ 3 |
| Rotatable Bonds | - | ≤ 3 |
Table 2: Exemplary Virtual Screening Funnel for Maslinic Acid Analogs (Adapted from [4])
| Screening Stage | Number of Compounds | Key Criteria Applied |
|---|---|---|
| Initial Virtual Screen | 593 | Tanimoto similarity ≥ 80% to maslinic acid |
| Post RO5 Filtering | 39 | No more than one violation of RO5 |
| Post-ADMET & Synthetic Accessibility Filter | Top hits for docking | Favorable ADMET risk and synthetic access |
| Final Selected Hit | 1 (Compound P-902) | Docking score, MD stability, and QSAR prediction |
The Scientist's Toolkit: Essential Research Reagents and Software
Table 3: Key Research Reagent Solutions and Computational Tools
| Item | Function in Protocol | Example Software / Database |
|---|---|---|
| Chemical Database | Source of compounds for virtual screening | ZINC Database [34] |
| Structure Preparation Tool | 2D to 3D conversion and geometry optimization | Avogadro [34], ChemBio3D [4] |
| Pharmacophore Modeling | Identifies essential 3D features for biological activity | Forge FieldTemplater [4] |
| Molecular Descriptor Calculator | Calculates RO5 parameters (MW, logP, HBD, HBA) | ChemAxon Marvin, Schrödinger QikProp [35] [36] |
| Molecular Docking Suite | Predicts binding orientation and affinity of ligands | AutoDock Vina [34] |
| Molecular Dynamics Engine | Simulates dynamic behavior and stability of complexes | GROMACS, AMBER [37] |
| ADMET Predictor | Estimates pharmacokinetic and toxicity profiles | Discovery Studio, QikProp [4] [36] |
Concluding Remarks
The integration of virtual screening with Lipinski's Rule of Five provides a robust and efficient strategy for navigating the vast chemical space in search of viable drug candidates. As demonstrated in the research on maslinic acid analogs, this combination effectively narrows thousands of initial database hits down to a manageable number of high-priority compounds worthy of further computational and experimental investigation [4]. This protocol emphasizes a hierarchical workflow where rapid, broad filters are applied first, followed by progressively more detailed and resource-intensive analyses. Adhering to this structured approach significantly enhances the probability of identifying novel, potent, and drug-like leads, thereby accelerating the early stages of drug discovery.
Overcoming Common Challenges and Enhancing Model Performance
Addressing Conformational Flexibility and Alignment Ambiguities
Within the framework of developing robust field-based 3D-QSAR models for maslinic acid analogs with anticancer activity, addressing conformational flexibility and alignment ambiguities is a foundational step. The predictive power and interpretability of a 3D-QSAR model are critically dependent on the accurate representation of the bioactive conformation and its correct spatial alignment with other compounds in the dataset [26] [17]. Molecular flexibility necessitates the selection of a relevant low-energy conformation, while alignment ambiguity requires a strategic superposition of molecules in a shared 3D space that reflects their binding mode at the target protein [38]. This protocol details a comprehensive procedure to overcome these challenges, leveraging findings from successful 3D-QSAR studies on maslinic acid analogs against the MCF-7 breast cancer cell line [3] [19].
Core Challenges in 3D-QSAR Setup
Conformational Flexibility: A molecule can adopt numerous low-energy conformations, but only one (or a few) is likely the bioactive conformation responsible for its interaction with the biological target. Selecting an incorrect conformation introduces significant noise into the descriptor calculation, leading to a poor model [28] [17].
Alignment Ambiguity: For 3D-QSAR methods like CoMFA, the calculated molecular fields (steric and electrostatic) are only meaningful if the molecules are aligned in a manner consistent with their binding orientation in the protein's active site. An arbitrary or incorrect alignment will misrepresent the structure-activity relationship [26] [39].
The following workflow diagram outlines the core steps for addressing these challenges, from initial structure preparation to final model validation.
Experimental Protocols
Protocol 1: Conformational Analysis and Bioactive Conformation Selection
This protocol aims to generate a set of realistic low-energy conformations and select the one most likely to represent the binding mode.
1. Initial 3D Structure Generation:
- Input: 2D structures of maslinic acid analogs in SDF or SMILES format.
- Procedure: Convert 2D structures to 3D using software like RDKit, Open Babel, or the converter module in Forge [17] [40]. This step provides a starting 3D geometry.
2. Geometry Optimization:
- Procedure: Optimize the initial 3D structure using a molecular mechanics force field (e.g., UFF, MMFF94, OPLS_2005) or semi-empirical/quantum mechanical methods for higher accuracy [17]. This ensures the molecule is at a local energy minimum. The gradient cutoff for conformer minimization can be set to 0.1 kcal/mol [40].
3. Comprehensive Conformer Search:
- Procedure: Perform a systematic or stochastic conformational search for each molecule. In tools like Forge, set the maximum number of conformations generated per molecule to 500, with an energy window of 3 kcal/mol to exclude high-energy, unrealistic conformers. Use an RMSD cutoff (e.g., 0.5 Å) to filter out duplicate conformers [40].
4. Bioactive Conformation Selection:
- Template-Based Method: If a co-crystallized structure of a ligand with the target protein (e.g., HER2, AKR1B10 for maslinic acid analogs) is available, use this as a template [3] [40]. The conformer that best matches the template's field pattern or substructure is selected.
- Pharmacophore-Based Method: Generate a field-based or feature-based pharmacophore from a known active compound. The lowest energy conformer that best fits the pharmacophore model is selected for alignment [40].
Protocol 2: Robust Molecular Alignment Strategy
This protocol describes a multi-reference alignment strategy to achieve a consistent and biologically relevant superposition of molecules.
1. Reference Molecule Selection:
- Procedure: Identify one or more reference molecules that are representative of the dataset and preferably have high activity or known structural data (e.g., a crystal structure ligand) [26]. For maslinic acid analogs, the parent compound or a potent derivative can serve as the initial reference.
2. Alignment Execution:
- Field-Based Alignment: Use the field points (electrostatic, steric, hydrophobic) of the reference molecule to align other molecules by maximizing field similarity [38] [40]. Software such as Cresset's Forge is specialized for this.
- Maximum Common Substructure (MCS) Alignment: Automatically identify the largest common substructure shared across the dataset and use it as a scaffold for atom-by-atom least-squares fitting [17] [40]. This is particularly effective for closely related analogs.
- Multi-Reference Refinement: If some molecules are poorly aligned by a single reference, manually tweak a poorly aligned molecule to a more plausible orientation and promote it to an additional reference. Re-align the entire dataset against the set of references until a satisfactory global alignment is achieved [26]. Crucially, this refinement must be done blind to the biological activity data to avoid bias [26].
3. Validation of Alignment:
- Visual Inspection: Systematically inspect the alignment of all molecules, paying attention to the orientation of key functional groups and the overall shape [26] [40].
- Statistical Pre-screening: Before building the full QSAR model, a preliminary check using simple shape-based descriptors can be performed. A model with significant signal should be achievable based on shape alone [26].
Table 1: Key Statistical Metrics for 3D-QSAR Model Validation from Literature Examples
| Study Focus | Model Type | r² (Fit) | q² (LOO Cross-Validation) | External Prediction R² | Reference |
|---|---|---|---|---|---|
| Maslinic Acid Analogs (MCF-7) | Field-based 3D-QSAR | 0.92 | 0.75 | Not Reported | [3] |
| Flavone Analogs (Tankyrase) | Field-based 3D-QSAR | 0.89 | 0.67 | Not Reported | [40] |
| JAK-2 Inhibitors | Field-based 3D-QSAR | 0.884 | 0.67 | 0.562 | [37] |
The Scientist's Toolkit: Essential Research Reagents and Software
Table 2: Key Software Tools for Addressing Flexibility and Alignment
| Tool Category | Example Software | Primary Function in this Context |
|---|---|---|
| Cheminformatics & Modeling | Forge (Cresset) | Field-based alignment, conformation generation, and 3D-QSAR model building [26] [40]. |
| Schrodinger Suite | Field-based QSAR analysis using the OPLS_2005 force field [39]. | |
| SYBYL/Tripos | Classic CoMFA and CoMSIA analyses with various alignment tools [38]. | |
| Molecular Visualization | PyMOL, Maestro | Visual inspection and validation of molecular alignments and conformations. |
| Conformer Generation | RDKit, OMEGA | Efficient generation of diverse, low-energy molecular conformers [17]. |
| Scripting & Automation | Python (RDKit) | Customizing and automating conformational search and alignment protocols. |
A methodical approach to managing conformational flexibility and alignment ambiguities is non-negotiable for developing a predictive and interpretable field-based 3D-QSAR model. By rigorously applying the protocols of conformational analysis, multi-reference alignment, and bias-free validation, researchers can establish a solid three-dimensional foundation for their QSAR studies. This disciplined approach was instrumental in the successful development of a 3D-QSAR model for maslinic acid analogs, which exhibited excellent predictive statistics (r² = 0.92, q² = 0.75) and led to the identification of novel, potent anticancer candidates [3]. Mastery of these foundational steps is what transforms a computational model from a statistical exercise into a powerful tool for rational drug design.
Optimizing Model Predictivity and Avoiding Overfitting
In the context of developing field-based 3D-QSAR models for maslinic acid analogs with anticancer activity, ensuring high predictive power and robustness is paramount [4]. Overfitting occurs when a model learns not only the underlying relationship in the training data but also the noise, resulting in poor performance on new, unseen compounds [41]. This application note provides detailed protocols and strategies to optimize model predictivity and rigorously avoid overfitting, framed within our ongoing research on triterpene-based anticancer agents [4] [42]. We anchor our methodologies to a published study on maslinic acid analogs active against the MCF-7 breast cancer cell line, which achieved a leave-one-out (LOO) validated PLS model with r² = 0.92 and q² = 0.75 [4].
Critical Validation Strategies for Model Predictivity
Relying on a single metric, particularly the coefficient of determination (r²) for the training set, is insufficient to demonstrate the validity and predictive power of a QSAR model [43]. A comprehensive validation strategy, incorporating both internal and external techniques, is essential.
Table 1: Key Validation Metrics and Their Thresholds for a Robust 3D-QSAR Model
| Validation Type | Metric | Description | Target Threshold |
|---|---|---|---|
| Internal Validation | LOO q² | Cross-validated correlation coefficient | > 0.5 [41] |
| LMO q² | Leave-Many-Out cross-validation | > 0.5 | |
| External Validation | r²test | Coefficient of determination for test set | > 0.6 [43] |
| CCC | Concordance Correlation Coefficient | > 0.8 [43] | |
| r²m | Roy's metric for external predictivity | > 0.5 | |
| Overall Fit | r² | Non-cross-validated correlation coefficient | Should not be excessively high (e.g., >0.95) compared to q² [44] |
Application to Maslinic Acid Analogs
In the referenced 3D-QSAR study on maslinic acid, the model was built using the partial least squares (PLS) regression method on field point-based descriptors after aligning compounds to a common pharmacophore [4]. The dataset of 74 compounds was divided into a training set (47 compounds) and a test set (27 compounds) using an activity-stratified method to ensure representative chemical space coverage [4]. The model was first validated internally using the Leave-One-Out (LOO) technique, yielding a q² of 0.75, which indicates a highly predictive model [4]. Subsequently, the model's predictive power was confirmed on the external test set, which was not used in model building [4].
Advanced Protocols to Mitigate Overfitting
Overfitting is a primary challenge in QSAR modeling, especially with high-dimensional descriptor data. The following protocols provide a multi-faceted defense.
Protocol 1: Robust Data Curation and Preprocessing
Objective: To prepare a high-quality, reliable dataset that minimizes noise and bias before model building. Materials: Chemical structures (e.g., SMILES, SDF files), associated biological activity data (e.g., IC₅₀ against MCF-7), and software like RDKit or PaDEL-Descriptor [44]. Procedure:
- Data Collection: Assemble a dataset of compounds with biological activities determined under uniform experimental conditions [17]. For maslinic acid analogs, this included 74 compounds with known IC₅₀ values [4].
- Structure Standardization: Convert 2D structures to 3D, remove salts, normalize tautomers, and handle stereochemistry consistently [44] [17].
- Conformation Generation & Alignment: Generate low-energy 3D conformations. For the maslinic acid study, a FieldTemplater module was used to determine a bioactive conformation hypothesis, and all compounds were aligned to this template—a critical step for 3D-QSAR [4].
- Activity Conversion: Convert activity values (e.g., IC₅₀) to a logarithmic scale (pIC₅₀) to linearize the relationship for modeling [4].
- Data Splitting: Partition the dataset into training and test sets. Use a method like Kennard-Stone or activity-stratified selection to ensure the test set is representative of the chemical space and activity range of the training set [4] [44].
Protocol 2: Managing Descriptor Intercorrelation and Selection
Objective: To reduce descriptor redundancy and select the most relevant features, thereby lowering model complexity and overfitting risk. Materials: Dataset of aligned molecules, descriptor calculation software (e.g., Forge, RDKit, Dragon) [41] [44]. Procedure:
- Descriptor Calculation: Calculate 3D field descriptors (e.g., steric, electrostatic, hydrophobic) using a software package like Forge, which employs an XED force field [4] [41].
- Initial Descriptor Filtering: Automatically remove descriptors with constant values or a high number of missing values [41].
- Address Multicollinearity:
- Simple Method: Calculate a correlation matrix and remove one descriptor from any pair with a Pearson correlation coefficient > 0.8 - 0.9 [41].
- Advanced Method (Recommended): Use Recursive Feature Elimination (RFE) or embedded methods like LASSO regression, which integrate feature selection into the model training process and are less likely to discard meaningfully correlated descriptors [41] [45].
Protocol 3: Employing Robust Machine Learning Algorithms
Objective: To utilize modeling algorithms that are inherently resistant to overfitting. Materials: Curated training set, selected molecular descriptors. Procedure:
- Algorithm Selection: Choose algorithms known for their robustness.
- Gradient Boosting Machines (GBM): These are tree-based models that inherently prioritize informative descriptor splits and down-weight redundant ones, making them robust to multicollinearity without pre-filtering [41].
- Partial Least Squares (PLS): The standard for 3D-QSAR methods like CoMFA, PLS projects descriptors into latent variables that maximize covariance with the activity, effectively handling correlated descriptors [4] [17].
- Regularized Linear Models (Ridge/Lasso): These penalize the magnitude of coefficients, preventing any single descriptor from having an overly large influence [45].
- Hyperparameter Tuning: Optimize model-specific parameters (e.g., number of components in PLS, learning rate in GBM) using cross-validation on the training set only [45]. Avoid tuning based on test set performance.
Diagram 1: A multi-pronged workflow for developing robust 3D-QSAR models, integrating data curation, descriptor management, algorithm choice, and validation.
The Scientist's Toolkit: Research Reagent Solutions
Table 2: Essential Software and Computational Tools for 3D-QSAR
| Tool / Resource | Type | Primary Function in 3D-QSAR |
|---|---|---|
| Forge (Cresset) | Software Suite | Field-based alignment (FieldTemplater), 3D-QSAR model development, and visualization using XED force field descriptors [4] [41]. |
| Open3DQSAR | Open-Source Tool | Platform for 3D-QSAR analyses, including calculation of molecular interaction fields (MIFs) and PLS regression [46]. |
| RDKit | Cheminformatics Library | 2D/3D structure manipulation, descriptor calculation, maximum common substructure (MCS) alignment, and data preprocessing [41] [17]. |
| Flare (Cresset) | Software Suite | Builds both 3D and 2D QSAR models, includes Gradient Boosting ML models robust to descriptor collinearity [41]. |
| PyMOL | Visualization Tool | Visualization of 3D-QSAR contour maps and interpretation of results in a structural context [46]. |
The development of predictive and non-overfit 3D-QSAR models, as demonstrated in maslinic acid research, requires a disciplined, multi-step approach. Key to success are rigorous data curation, careful management of molecular descriptors, the use of robust algorithms like PLS or Gradient Boosting, and most critically, a comprehensive validation strategy that goes beyond a single r² value. By adhering to the protocols and utilizing the tools outlined in this application note, researchers can build reliable models that truly accelerate the design and optimization of novel therapeutics.
Integrating Machine Learning Algorithms with Traditional QSAR
This application note provides a detailed protocol for integrating modern machine learning (ML) algorithms with traditional 3D Quantitative Structure-Activity Relationship (QSAR) methodologies. Framed within the context of developing field-based 3D-QSAR models for maslinic acid analogs with anticancer activity against the MCF-7 breast cancer cell line, this document is designed for researchers and drug development professionals aiming to enhance the predictive accuracy and efficiency of their workflows [4] [19]. The integration of computational power, Big Data, and ML significantly improves the processing of unstructured data and unleashes the great potential of QSAR in virtual drug screening [47].
Data Presentation and Model Performance
The following tables summarize key quantitative data from a foundational study on maslinic acid analogs, providing benchmarks for model development and validation [4].
Table 1: Key Performance Metrics of the 3D-QSAR Model for Maslinic Acid Analogs
| Model Parameter | Value | Description |
|---|---|---|
| Regression Coefficient (r²) | 0.92 | Indicates the proportion of variance in the activity explained by the model. |
| Cross-Validation Coefficient (q²) | 0.75 | Validates the model's predictive ability using the Leave-One-Out (LOO) method. |
| Training Set Compounds | 47 | Number of compounds used to build the QSAR model. |
| Test Set Compounds | 27 | Number of compounds used to independently validate the model. |
Table 2: Virtual Screening Funnel for Lead Identification
| Screening Stage | Number of Hits | Criteria and Purpose |
|---|---|---|
| Initial Query Set | 593 | Retrieved from ZINC database based on >80% structural similarity to maslinic acid. |
| Post-Lipinski's Rule of 5 | Not Explicitly Stated | Filter for oral bioavailability. |
| Post-ADMET & Synthetic Accessibility | 39 | Filter for drug-like features and ease of chemical synthesis. |
| Final Best Hit | 1 (Compound P-902) | Identified after docking screening against targets like HER2 and NR3C1. |
Experimental Protocols
Protocol 1: Development of a Field-Based 3D-QSAR Model
Objective: To construct and validate a predictive 3D-QSAR model using field point-based descriptors aligned to a pharmacophore template.
Materials:
- Dataset: A curated set of compounds with known experimental activity (e.g., IC50 against MCF-7) [4].
- Software: Forge software (or equivalent) with FieldTemplater and field QSAR modules [4].
- Force Field: XED (eXtended Electron Distribution) force field for conformational analysis and minimization [4].
Methodology:
- Data Collection and Preparation:
- Collect 2D structures of training and test set compounds from literature or databases.
- Convert 2D structures into 3D models using a molecular converter (e.g., ChemBio3D) [4].
- Convert experimental activity values (e.g., IC50) to pIC50 using the formula: pIC50 = -log(IC50) for use as the dependent variable in modeling [4].
Pharmacophore Generation and Conformational Analysis:
- Use the FieldTemplater module on a subset of highly active compounds to determine a hypothesis for the bioactive conformation.
- The template is derived from molecular field and shape information, generating field points for positive/negative electrostatics, van der Waals shape, and hydrophobicity [4].
- Employ a molecular field-based similarity method for the conformational hunt of all compounds.
Compound Alignment and Descriptor Calculation:
- Align all compounds in the dataset onto the generated pharmacophore template.
- Field point-based descriptors are calculated across the volume of the aligned training set compounds [4].
Model Building and Validation:
- Use the Partial Least Squares (PLS) regression method, specifically the SIMPLS algorithm, to build the QSAR model [4].
- Validate the model internally using the Leave-One-Out (LOO) cross-validation technique to obtain the q² value [4].
- Assess the model's performance on an external test set of compounds that were not used in training.
Protocol 2: Integrating Machine Learning with QSAR Workflow
Objective: To leverage ML for enhanced generalization and prediction in QSAR, moving beyond traditional methods.
Materials:
- Computing Environment: High-performance computing resources for data-intensive ML tasks [47].
- Software Libraries: Python with ML libraries (e.g., Scikit-learn, PyTorch, TensorFlow).
- Data: Large, high-quality datasets of molecular structures and associated biological activities [47] [48].
Methodology:
- Data Curation and Featurization:
- Assemble a large and diverse dataset of molecular structures.
- Represent molecules using descriptors that capture structural and functional attributes meaningful for molecular recognition. The key is to move towards representations that, like the local filters in Convolutional Neural Networks (CNNs) for images, can capture local, contiguous features in molecular structures [48].
Algorithm Selection and Training:
- Select ML algorithms whose architecture can capture the fundamental structure of the ligand-protein binding problem. Current QSAR models often use algorithms like Multi-Layer Perceptrons (MLPs) that do not inherently enforce structural constraints, leading to poor generalization [48].
- Explore and develop architectures that apply a consistent set of local filters to molecular representations, making the learned function robust to small perturbations [48].
- Train the selected model on the curated dataset, using part of the data for validation to tune hyperparameters.
Model Evaluation and Interpretation:
- Evaluate the model on a held-out test set, assessing its ability to predict the activity of novel compounds that are structurally distant from the training set [48].
- Use interpretation tools to understand which molecular features the model deems important for activity, aligning these insights with the field points from 3D-QSAR models.
Iterative Integration with Wet Lab and Simulation:
- Use ML predictions to prioritize compounds for in vitro or in vivo testing (wet experiments) [47].
- Integrate with Molecular Dynamics (MD) simulations to provide mechanistic interpretation at the atomic level for ML predictions, creating a cycle of computational prediction and experimental verification [47].
Workflow and Pathway Visualizations
QSAR-ML Integration Workflow
The Scientist's Toolkit: Research Reagent Solutions
Table 3: Essential Computational Tools and Resources for Integrated QSAR/ML Research
| Tool/Resource | Function/Application | Relevance to Protocol |
|---|---|---|
| Forge (Cresset) | Software for field-based 3D-QSAR, pharmacophore generation, and molecular alignment. | Core platform for executing Protocol 1, generating field points and building the initial model [4]. |
| XED Force Field | An extended electron distribution force field for molecular mechanics calculations. | Used for conformational hunting, energy minimization, and generating molecular field points in Protocol 1 [4]. |
| ZINC Database | A free database of commercially-available compounds for virtual screening. | Source for the initial query set of 593 maslinic acid-like compounds in the case study [4]. |
| PLSR (SIMPLS) | Partial Least Squares Regression, a statistical method for modeling relationships between variables. | The algorithm used to build the QSAR model in Protocol 1, relating field descriptors to biological activity [4]. |
| Python ML Stack (e.g., Scikit-learn, PyTorch) | A collection of open-source libraries for implementing machine learning algorithms. | The primary environment for developing and training the ML models described in Protocol 2 [48]. |
Refining ADMET Predictions for Better Drug-Likeness
The high attrition rate of drug candidates in late-stage development, often due to unfavorable pharmacokinetics or toxicity, makes the accurate prediction of Absorption, Distribution, Metabolism, Excretion, and Toxicity (ADMET) properties a critical objective in modern drug discovery [49]. This challenge is particularly acute in targeted therapeutic programs, such as the development of maslinic acid analogs for breast cancer treatment [3]. Field-based 3D-QSAR models have emerged as powerful tools for establishing the molecular basis of biological activity and optimizing lead compounds. However, their full potential is only realized when integrated with robust ADMET prediction frameworks that guide the selection of candidates with desirable drug-likeness profiles [50]. This Application Note details a comprehensive protocol for refining ADMET predictions within the context of 3D-QSAR model development for maslinic acid analogs, providing researchers with a structured methodology to enhance the selection of viable drug candidates.
Key Challenges in Traditional ADMET Assessment
Traditional experimental ADMET assessment methods, including cell-based permeability studies and in vivo animal models, are resource-intensive, low-throughput, and difficult to scale for modern ultra-large compound libraries [49]. Early computational approaches, particularly Quantitative Structure-Activity Relationship (QSAR) models using predefined molecular descriptors, brought automation but often lack scalability and demonstrate reduced performance on novel chemical scaffolds [49]. These models face several specific limitations:
- Data Quality and Standardization: Inconsistent data quality and lack of standardization across heterogeneous ADMET datasets undermine model reproducibility and generalization [49]. A recent analysis revealed almost no correlation between IC₅₀ values for the same compounds tested in "identical" assays by different research groups, highlighting significant reproducibility challenges [51].
- Limited Chemical Space Coverage: Models trained on limited datasets capture only small sections of the relevant chemical and assay space, causing performance degradation when predicting properties for novel scaffolds or compounds outside the training distribution [52].
- Interpretability and Regulatory Acceptance: Many advanced AI-based ADMET models function as "black boxes," generating predictions without clear attribution to specific input features, which hinders scientific validation and regulatory acceptance [49].
Integrated Workflow for 3D-QSAR and ADMET Optimization
The following workflow integrates field-based 3D-QSAR modeling with advanced ADMET prediction to create a robust framework for optimizing maslinic acid analogs with improved drug-likeness. This methodology enables researchers to simultaneously enhance anticancer activity while ensuring favorable pharmacokinetic and safety profiles.
Workflow Description
The integrated computational-experimental workflow begins with 3D-QSAR model development based on known active compounds, proceeds through sequential filtering stages, and culminates in experimental validation of the most promising candidates [3]. Key stages include:
- 3D-QSAR Model Development: Construction of field-based models that define molecular shape, hydrophobic regions, and electrostatic patterns critical for anticancer activity [3].
- Virtual Screening & Pharmacophore Mapping: Application of the model to screen compound libraries and identify analogs matching the essential pharmacophoric features [3].
- ADMET In Silico Profiling: Comprehensive prediction of absorption, distribution, metabolism, excretion, and toxicity properties using multi-parameter assessment [53].
- Multi-Filter Screening: Application of successive filters including Lipinski's Rule of Five for oral bioavailability, ADMET risk filters for drug-like features, and synthetic accessibility evaluation [3].
- Molecular Docking & Binding Analysis: Investigation of compound interactions with key biological targets to validate mechanism of action and binding affinity [3].
- Experimental Validation: Confirmation of predicted activity and ADMET properties through in vitro assays and biological functional assays [54].
Experimental Protocols and Methodologies
Field-Based 3D-QSAR Model Development
Objective: To develop a quantitative model correlating the three-dimensional molecular field properties of maslinic acid analogs with their anticancer activity against breast cancer cell lines.
Materials and Reagents:
- A curated set of maslinic acid analogs with experimentally determined IC₅₀ values against MCF-7 or MDA-MB-231 breast cancer cell lines [3] [50]
- Computational chemistry software with 3D-QSAR capabilities (e.g., Discovery Studio, Open3DQSAR)
- Molecular modeling workstation with adequate processing power and graphics capabilities
Procedure:
- Compound Preparation:
- Obtain or sketch 2D structures of all maslinic acid analogs in the dataset.
- Convert 2D structures to 3D representations using energy minimization and conformational analysis.
- Ensure proper protonation states at physiological pH (7.4).
Molecular Alignment:
- Identify a common scaffold or pharmacophore for structural alignment.
- Align all molecules to a reference conformation using atom-based or field-based fitting methods.
- Verify alignment quality through visual inspection and statistical measures.
Field Calculation:
- Calculate steric (Lennard-Jones) and electrostatic (Coulombic) fields around each aligned molecule.
- Set grid spacing to 1.0-2.0 Å to ensure sufficient resolution without excessive computation.
- Use appropriate probe atoms (e.g., CH₃ for steric, H⁺ for electrostatic).
Statistical Analysis:
- Perform Partial Least Squares (PLS) regression to correlate field values with biological activity.
- Apply Leave-One-Out (LOO) cross-validation to assess model robustness.
- Validate the model with an external test set not used in training.
- Acceptable models should demonstrate r² > 0.8 and q² > 0.5 [3].
Model Interpretation:
- Visualize contour maps to identify regions where specific molecular fields enhance or diminish activity.
- Use these insights to guide structural modifications of maslinic acid analogs.
Comprehensive ADMET Profiling Protocol
Objective: To predict the absorption, distribution, metabolism, excretion, and toxicity properties of maslinic acid analogs using in silico methods.
Materials and Reagents:
- 3D structures of maslinic acid analogs in suitable file formats (SDF, MOL2)
- ADMET prediction software (e.g., Discovery Studio, ADMETlab, pkCSM)
- Computational resources for descriptor calculation and model application
Procedure:
- Data Preparation:
- Standardize molecular structures, ensuring correct stereochemistry and tautomeric states.
- Generate optimized 3D geometries using molecular mechanics or semi-empirical methods.
Descriptor Calculation:
ADMET Endpoint Prediction:
- Apply validated models to predict critical ADMET parameters:
- Blood-Brain Barrier (BBB) Penetration: Categorize as BBB+ or BBB- [53]
- Cytochrome P450 Inhibition: Screen for interactions with CYP2D6, CYP3A4, and other major isoforms [53]
- Hepatotoxicity: Assess potential liver toxicity using structural alerts and QSAR models [53]
- Plasma Protein Binding: Estimate fraction bound to plasma proteins [55]
- Human Intestinal Absorption: Predict percentage absorption through the gastrointestinal tract
- hERG Inhibition: Screen for potential cardiotoxicity [49]
- Apply validated models to predict critical ADMET parameters:
Drug-Likeness Evaluation:
Data Integration and Decision Making:
- Compile results into a comprehensive ADMET profile for each compound.
- Rank compounds based on combined efficacy (from 3D-QSAR) and ADMET properties.
- Select top candidates for further experimental validation.
Experimental Validation of ADMET Properties
Objective: To experimentally verify critical ADMET properties for prioritized maslinic acid analogs.
Materials and Reagents:
- Test compounds (top-ranked maslinic acid analogs)
- Cell culture materials (Caco-2, HepG2, or primary hepatocytes)
- Microsomal preparations (human or rat liver microsomes)
- Analytical instruments (LC-MS/MS for quantification)
- Assay kits for cytotoxicity and enzyme inhibition
Procedure:
- Metabolic Stability Assay:
- Incubate test compounds with liver microsomes or hepatocytes.
- Sample at multiple time points (0, 5, 15, 30, 60 minutes).
- Quantify parent compound disappearance using LC-MS/MS.
- Calculate half-life and intrinsic clearance.
Caco-2 Permeability Assay:
- Culture Caco-2 cells on transwell inserts until differentiated (21 days).
- Apply test compounds to apical compartment.
- Sample from basolateral compartment at timed intervals.
- Calculate apparent permeability coefficients (Papp).
CYP450 Inhibition Assay:
- Use fluorescent or LC-MS/MS based methods.
- Incubate test compounds with specific CYP450 isoforms and marker substrates.
- Measure metabolite formation with and without test compounds.
- Calculate IC₅₀ values for inhibition potential.
Cytotoxicity Screening:
- Expose hepatocytes (HepG2) or other relevant cell lines to test compounds.
- Assess cell viability using MTT, Alamar Blue, or similar assays.
- Determine TC₅₀ values for cytotoxicity potential.
Data Analysis and Correlation:
- Compare experimental results with computational predictions.
- Refine computational models based on experimental findings.
- Iterate the design cycle for improved analogs.
Data Presentation and Analysis
Quantitative ADMET Profile of Maslinic Acid Analogs
Table 1: Computed ADMET properties and drug-likeness filters for maslinic acid analogs. Values based on published studies of similar triterpene analogs [3] [53] [50].
| Property | Optimal Range | Maslinic Acid | Analog P-902 | Acceptance Criteria |
|---|---|---|---|---|
| Molecular Weight | ≤500 | 472.7 | 455.6 | Lipinski Compliance |
| ALogP | ≤5 | 4.2 | 3.8 | Lipinski Compliance |
| H-Bond Donors | ≤5 | 4 | 3 | Lipinski Compliance |
| H-Bond Acceptors | ≤10 | 5 | 4 | Lipinski Compliance |
| Polar Surface Area (Ų) | <140 | 89.5 | 78.3 | Good Oral Bioavailability |
| Rotatable Bonds | <10 | 5 | 4 | Conformational Flexibility |
| Blood-Brain Barrier | Low Penetration | Low | Low | Reduced CNS Side Effects |
| CYP2D6 Inhibition | Non-inhibitor | Weak | Weak | Reduced Drug-Drug Interactions |
| Hepatotoxicity | Non-toxic | Low Risk | Low Risk | Safety Profile |
| hERG Inhibition | Non-inhibitor | Low | Low | Cardiotoxicity Safety |
| Intestinal Absorption | >80% | Moderate | High | Oral Availability |
| ADMET Risk Score | 0-3 (Low) | 2 | 1 | Overall Drug-likeness |
3D-QSAR Model Performance Metrics
Table 2: Statistical parameters of the field-based 3D-QSAR model for maslinic acid analogs against breast cancer cell lines [3].
| Statistical Parameter | Value | Acceptance Criteria | Interpretation |
|---|---|---|---|
| r² (Training Set) | 0.92 | >0.8 | Excellent model fit |
| q² (LOO Cross-Validation) | 0.75 | >0.5 | High predictive ability |
| Standard Error of Estimation | 0.32 | <0.5 | Good precision |
| F-value | 45.6 | >10 | Statistical significance |
| Optimal PLS Components | 5 | - | Model complexity |
| External Validation r² | 0.81 | >0.6 | Good external predictability |
The Scientist's Toolkit: Research Reagent Solutions
Table 3: Essential computational tools and experimental assays for integrated 3D-QSAR and ADMET optimization.
| Tool/Category | Specific Examples | Function/Application |
|---|---|---|
| Molecular Modeling Software | Discovery Studio, Schrödinger Suite, Open3DQSAR | 3D structure preparation, conformational analysis, and molecular field calculations |
| ADMET Prediction Platforms | ADMETlab 3.0, pkCSM, ADMET-AI, Receptor.AI | In silico prediction of absorption, distribution, metabolism, excretion, and toxicity endpoints |
| Federated Learning Frameworks | Apheris Platform, MELLODDY | Collaborative model training across distributed datasets without data sharing [52] |
| Physicochemical Descriptor Tools | Mordred, RDKit, Dragon | Comprehensive calculation of molecular descriptors for QSAR modeling |
| Docking and Binding Analysis | AutoDock, GOLD, Glide | Molecular docking to potential targets (AKR1B10, NR3C1, PTGS2, HER2) [3] |
| In Vitro ADME Assays | Caco-2 permeability, microsomal stability, plasma protein binding | Experimental validation of key ADMET parameters [55] |
| Cell-Based Assays | MCF-7, MDA-MB-231 cytotoxicity assays [3] [50] | Determination of antiproliferative activity and therapeutic potential |
| Toxicity Screening | hERG inhibition, hepatotoxicity (HepG2), Ames test | Safety profiling and risk assessment [49] |
Advanced Applications and Future Directions
Emerging Technologies in ADMET Prediction
Federated Learning for Expanded Chemical Space Coverage: Recent advances in federated learning enable pharmaceutical organizations to collaboratively train ADMET models without sharing proprietary data. This approach systematically extends a model's effective domain by learning from diverse chemical spaces across multiple organizations. Studies have demonstrated that federated models consistently outperform local baselines, with performance improvements scaling with the number and diversity of participants [52]. For maslinic acid research, participation in such initiatives could significantly enhance prediction accuracy for novel analogs.
Multi-Task Deep Learning Architectures: Advanced deep learning approaches that simultaneously predict multiple ADMET endpoints can capture complex relationships between different pharmacokinetic and toxicity parameters. The Receptor.AI ADMET prediction model, for example, combines Mol2Vec embeddings with curated molecular descriptors to predict 38 human-specific ADMET endpoints [49]. Such architectures demonstrate how endpoint-agnostic molecular featurization coupled with endpoint-specific processing can improve prediction consistency and reliability.
Structural Biology Integration: Initiatives like OpenADMET are combining high-throughput experimentation with structural biology (X-ray crystallography, cryoEM) to understand the structural basis of ADMET liabilities, particularly for "avoidome" targets like hERG and cytochrome P450 enzymes [51]. This integration of structural insights with predictive modeling helps medicinal chemists design compounds that avoid critical toxicity liabilities while maintaining therapeutic activity.
Regulatory Considerations and Validation
Regulatory agencies including the FDA and EMA are increasingly recognizing the value of computational ADMET predictions in drug development. The FDA's 2025 plan to phase out animal testing requirements in certain cases formally includes AI-based toxicity models under its New Approach Methodologies (NAMs) framework [49]. For maslinic acid analogs progressing toward clinical development, rigorous validation of ADMET predictions against standardized experimental assays will be essential for regulatory acceptance. This includes:
- Prospective Validation: Using blind challenges where models predict properties for compounds not previously seen, with subsequent experimental verification [51].
- Applicability Domain Assessment: Clearly defining the chemical space where models provide reliable predictions [51].
- Uncertainty Quantification: Implementing methods to estimate prediction confidence based on similarity to training data [51].
The integration of refined ADMET predictions with field-based 3D-QSAR modeling represents a powerful strategy for optimizing maslinic acid analogs with balanced efficacy and safety profiles. The protocols and methodologies detailed in this Application Note provide researchers with a structured approach to enhance drug-likeness during early discovery stages. By leveraging advanced computational techniques, including federated learning and multi-task deep learning, while maintaining rigorous experimental validation, drug discovery teams can significantly reduce late-stage attrition rates and accelerate the development of promising anticancer therapeutics. The continuous refinement of these approaches through community initiatives and open science collaborations will further strengthen their predictive power and regulatory acceptance in the coming years.
Balancing Synthetic Accessibility with Potency in Analog Design
The discovery and optimization of novel therapeutics from natural product scaffolds present a significant challenge in medicinal chemistry. This process requires a delicate balance between enhancing biological potency and ensuring synthetic feasibility for practical application. Maslinic acid (MA), a pentacyclic triterpene acid primarily derived from the olive tree (Olea europaea L.), has emerged as a promising candidate due to its broad-spectrum anticancer properties and favorable toxicity profile [23]. However, its development as a therapeutic agent faces limitations, including suboptimal potency against specific molecular targets and synthetic challenges for analog production. This Application Note outlines integrated computational and experimental protocols for designing maslinic acid analogs that optimally balance synthetic accessibility with biological potency through field-based 3D-QSAR model development.
Background and Significance
Maslinic Acid as a Lead Compound
Maslinic acid [(2α,3β)-2,3-dihydroxylolean-12-en-28-oic acid] is a pentacyclic triterpenoid with a molecular formula of C₃₀H₄₈O₄ and molecular weight of 472.7 g/mol [23]. It exhibits diverse pharmacological benefits including anticancer, anti-inflammatory, antimicrobial, hepatoprotective, and anti-diabetic effects. Its anticancer potential has been demonstrated against numerous cancer cell lines, as summarized in Table 1 [23].
Table 1: Anticancer Activity of Maslinic Acid Across Various Cell Lines
| Cancer Type | Cell Line | IC₅₀ Value | Experimental Conditions |
|---|---|---|---|
| Colorectal Cancer | HCT116 | 18.48 μM | 12-hour exposure |
| Colorectal Cancer | SW480 | 19.04 μM | 12-hour exposure |
| Colorectal Cancer | Caco-2 | 39.7-40.7 μg/mL | 72-hour exposure |
| Colorectal Cancer | HT29 | 28.8-30 μg/mL | 72-hour exposure |
| Melanoma | 518A2 | Notably low IC₅₀ | - |
The compound exerts its anticancer effects through multiple mechanisms, including induction of apoptosis via caspase-8/caspase-3 activation, modulation of Bcl-2 family proteins, generation of reactive oxygen species (ROS), and inhibition of key signaling pathways such as mTOR [23].
The Synthetic Accessibility Challenge
Despite its promising biological profile, the practical development of maslinic acid as a therapeutic agent faces two primary challenges: the need for enhanced potency against specific molecular targets and the synthetic complexity of creating analogs. Traditional natural product derivatization often yields compounds with improved potency but prohibitively complex synthesis routes, creating a critical bottleneck in lead optimization [42] [56]. This challenge necessitates an integrated approach that simultaneously evaluates potency enhancements and synthetic feasibility during the design phase.
Computational Protocols
Field-Based 3D-QSAR Model Development
The field-based 3D-QSAR approach establishes a correlation between the spatial arrangement of molecular properties and biological activity, providing a predictive model for analog design.
Table 2: Key Parameters for 3D-QSAR Model Development
| Parameter | Specification | Purpose |
|---|---|---|
| Software | Schrodinger Suite QSAR Tool / Forge v10 | Model development platform |
| Force Field | OPLS_2005 / XED | Molecular mechanics calculations |
| Field Types | Steric, Electrostatic, HBD, HBA | Molecular interaction characterization |
| Grid Spacing | 1.0 Å | Spatial resolution for field calculation |
| PLS Factors | Maximum of 5-20 components | Model dimensionality optimization |
| Validation Method | Leave-One-Out (LOO) | Internal model validation |
Experimental Protocol: 3D-QSAR Model Construction
Dataset Curation and Preparation
- Collect a minimum of 50-100 maslinic acid analogs with known biological activities (e.g., IC₅₀ values against target cancer cell lines) from literature and experimental data [4].
- Convert 2D chemical structures to 3D representations using ChemBio3D Ultra or similar software.
- Express biological activity as pIC₅₀ [-log(IC₅₀)] to linearize the relationship with binding energy.
Molecular Alignment and Conformational Analysis
- Utilize the FieldTemplater module in Forge v10 to identify bioactive conformations when target-bound structural data is unavailable [4].
- Generate a common pharmacophore hypothesis using field and shape information from highly active compounds (e.g., M-159, M-254, M-286, M-543, M-659).
- Align all training set compounds to the established pharmacophore template using FieldTemplater's field-based similarity method.
Field Calculation and Model Generation
- Calculate four molecular field types: positive electrostatic, negative electrostatic, steric (van der Waals), and hydrophobic using the XED force field.
- Generate interaction energy terms on a 3D grid enclosing all aligned training set molecules with 1.0 Å spacing.
- Apply Partial Least Squares (PLS) regression analysis using the SIMPLS algorithm to correlate field descriptors with biological activities.
- Remove variables (grid points) with standard deviation <0.05 to reduce noise.
Model Validation
- Perform Leave-One-Out Cross-Validation (LOOCV) to determine cross-validated correlation coefficient (q²).
- Validate the model externally using a test set of compounds (typically 20-30% of total dataset) not included in model training.
- Assess predictive correlation coefficient (R²test) and validate according to Golbraikh and Tropsha criteria [39] [4].
The following workflow illustrates the integrated computational and experimental approach for balanced analog design:
Synthetic Accessibility Assessment
Protocol: Predictive Synthetic Feasibility Analysis
Synthetic Accessibility (SA) Scoring
- Calculate synthetic accessibility scores (Φscore) using RDKit or similar tools, which estimate synthetic complexity based on molecular fragment contributions and complexity [57].
- Establish threshold values (e.g., Φscore <4 indicates readily synthesizable compounds) based on control molecules with known synthetic pathways.
AI-Based Retrosynthetic Analysis
- Submit proposed analogs to AI-driven retrosynthesis tools (e.g., IBM RXN, SciFinder ChemPlanner) to evaluate synthetic pathways [58] [57].
- Calculate Confidence Index (CI) for proposed routes, with CI >0.8 indicating high-probability successful synthesis.
- Integrate SA scores and CI values to determine overall synthetic feasibility (Γ): Γ = (Φscore < threshold) ∧ (CI > 0.8).
Reagent Compatibility Assessment
- Apply rule-based AI assessment of functional group tolerance and reagent compatibility for proposed synthetic routes [58].
- Evaluate commercial availability and cost of required reagents and building blocks.
- Prioritize routes utilizing readily available, cost-effective reagents with established reactivity profiles.
Integrated Design Strategy
Protocol: Balanced Potency-Synthesis Design Cycle
Initial Analog Generation
- Use field-based 3D-QSAR model to identify molecular regions where modifications enhance potency.
- Design analogs with targeted modifications at these critical regions while maintaining core triterpenoid structure.
Synthesis-Driven Filtering
- Apply synthetic feasibility assessment to eliminate designs with predicted synthetic challenges.
- Prioritize modifications that utilize established synthetic methodologies for pentacyclic triterpenoids [56].
Multi-Objective Optimization
- Rank analogs based on combined metrics: predicted potency (from 3D-QSAR), synthetic accessibility (Φscore), and synthetic confidence (CI).
- Select 5-10 top candidates for synthesis and experimental validation.
Experimental Validation Protocols
Compound Synthesis and Characterization
Protocol: Chromatography-Free Synthesis of Maslinic Acid Analogs
This protocol adapts published procedures for efficient maslinic acid analog production [56].
Starting Material Preparation
- Obtain oleanolic acid or ursolic acid as starting materials (commercially available in bulk quantities).
- Protect hydroxyl groups as acetates using acetic anhydride in pyridine at room temperature for 4-6 hours.
Key Transformation Steps
- Execute C-28 carboxyl group modifications via:
- Schotten-Baumann conditions for amide formation: react with oxalyl chloride followed by amine addition.
- Esterification via acid-catalyzed Fischer-Speier method.
- Perform selective oxidation/reduction at C-2 and C-3 positions using established protocols (e.g., Jones oxidation, NaBH₄ reduction).
- Deprotect acetate groups using potassium carbonate in methanol at room temperature for 2-4 hours.
- Execute C-28 carboxyl group modifications via:
Purification and Characterization
Biological Activity Assessment
Protocol: Cytotoxicity Evaluation Against Cancer Cell Lines
Cell Culture and Maintenance
- Maintain relevant cancer cell lines (e.g., MCF-7 for breast cancer, HCT116 for colon cancer) in appropriate media with 10% FBS at 37°C, 5% CO₂.
MTT Viability Assay
- Seed cells in 96-well plates at 5,000-10,000 cells/well and incubate for 24 hours.
- Treat with test compounds at concentrations ranging from 1-100 μM for 72 hours.
- Add MTT reagent (0.5 mg/mL) and incubate for 4 hours at 37°C.
- Dissolve formazan crystals with DMSO and measure absorbance at 570 nm.
- Calculate IC₅₀ values using nonlinear regression analysis of dose-response curves.
Mechanistic Studies
- Perform Western blot analysis for apoptosis markers (caspase-3, caspase-9, PARP cleavage) following 24-hour treatment with IC₅₀ concentrations.
- Assess cell cycle distribution via flow cytometry with propidium iodide staining.
- Evaluate mitochondrial membrane potential using JC-1 dye and flow cytometry.
Research Reagent Solutions
Table 3: Essential Research Reagents for Maslinic Acid Analog Development
| Reagent/Category | Specific Examples | Function/Application |
|---|---|---|
| Starting Materials | Oleanolic acid, Ursolic acid | Core triterpenoid scaffolds for analog synthesis |
| Protecting Groups | Acetic anhydride, Trimethylsilyl chloride | Hydroxyl group protection during synthesis |
| Coupling Reagents | Oxalyl chloride, DCC, EDC | Carboxyl group activation for amide/ester formation |
| Solvents | Pyridine, Dichloromethane, Methanol | Reaction media and purification |
| Catalysts | Palladium catalysts (e.g., Pd(PPh₃)₄) | Cross-coupling reactions for structural diversification |
| Cell Lines | MCF-7, HCT116, SW480, HT29 | In vitro anticancer activity assessment |
| Assay Kits | MTT reagent, Caspase assay kits, JC-1 dye | Biological activity and mechanism evaluation |
Case Study and Application
A recent study demonstrated the application of this integrated approach to maslinic acid analog development [4]. The researchers developed a 3D-QSAR model with excellent statistical parameters (r² = 0.92, q² = 0.75) based on MCF-7 breast cancer cell line cytotoxicity data. Virtual screening of 593 analogs identified 39 top hits after applying Lipinski's Rule of Five and ADMET risk filters. Further synthesis feasibility assessment prioritized compound P-902 as the lead candidate, which demonstrated enhanced predicted potency and synthetic accessibility.
The signaling pathways below illustrate maslinic acid's known mechanisms and potential targets for analog development:
The integrated protocol described in this Application Note provides a systematic framework for balancing synthetic accessibility with biological potency in maslinic acid analog design. By combining field-based 3D-QSAR modeling with advanced synthetic feasibility assessment, researchers can efficiently prioritize analog structures that offer optimal therapeutic potential with practical synthetic pathways. This approach accelerates the development of maslinic acid-based therapeutics while reducing the risk of synthetic bottlenecks in the drug discovery pipeline. The iterative nature of the protocol allows for continuous refinement of both computational models and synthetic strategies, ultimately enhancing the success rate of natural product-based drug development programs.
Validation Strategies and Comparative Analysis with Other QSAR Approaches
Internal and External Validation Protocols for Model Robustness
In the field of computational drug discovery, the development of a predictive and reliable quantitative structure-activity relationship (QSAR) model is paramount for the successful identification and optimization of lead compounds. This is particularly true for field-based 3D-QSAR models, which utilize molecular field points to describe the spatial and electronic features responsible for biological activity. The development of such models for maslinic acid analogs in breast cancer research necessitates rigorous validation to ensure their robustness and predictive power for guiding the design of novel anticancer agents. This document outlines detailed protocols for the internal and external validation of 3D-QSAR models, framed within the context of maslinic acid analog research [59].
Internal Validation Protocols
Internal validation techniques assess the robustness and predictability of a QSAR model using only the data present within the training set. These methods help ensure the model is not over-fitted and possesses genuine predictive capability for the chemical space it was built upon.
Leave-One-Out (LOO) Cross-Validation
Principle: This technique systematically removes one compound from the training set, builds a model with the remaining compounds, and predicts the activity of the omitted compound. This process is repeated until every compound in the training set has been left out once [59] [13].
Experimental Protocol:
- Begin with a training set of
Ncompounds (e.g., 47 maslinic acid analogs [59]). - Set the number of components (latent variables) for the Partial Least Squares (PLS) regression. The maximum is often set high (e.g., 20) and the optimal number is selected based on the highest cross-validated correlation coefficient (
q²) [59]. - For
i = 1toN:- Remove the
i-thcompound from the training set. - Use the remaining
N-1compounds to build a new 3D-QSAR model. - Use this model to predict the biological activity (e.g., pIC50) of the removed
i-thcompound.
- Remove the
- Calculate the cross-validated correlation coefficient
q²(orQ²cv) using the formula:Q²cv = 1 - [Σ(Y_actual - Y_predicted)² / Σ(Y_actual - Y_mean)²][13]- where
Y_actualandY_predictedare the actual and predicted activities of the training set compounds during the cross-validation cycle, andY_meanis the mean activity of the training set.
Interpretation: A q² value above 0.5 is generally considered acceptable, while a value above 0.7 indicates a robust model [59]. In the maslinic acid study, the derived model showed a q² of 0.75, confirming its internal robustness [59].
Leave-Multiple-Out and Y-Scrambling
- Leave-Multiple-Out (LMO): Similar to LOO, but multiple compounds (e.g., 10-20% of the dataset) are left out in each iteration. This provides a more stringent assessment of model stability.
- Y-Scrambling (Randomization Test): This test checks for the risk of chance correlation. The biological activity values (Y-block) are randomly shuffled, and new models are built using the scrambled activities. This process is repeated many times (e.g., 50 times [59]). A valid model should have significantly higher
r²andq²values than those obtained from the scrambled models.
External Validation Protocols
External validation is the most definitive method for evaluating a QSAR model's predictive power. It involves using a completely independent set of compounds that were not used in any phase of model building.
Test Set Selection and Prediction
Principle: The original dataset is divided into a training set (used to build the model) and a test set (used to validate it). The division should be strategic to ensure the test set is representative of the chemical space covered by the training set.
Experimental Protocol:
- Data Set Division: From a full set of compounds (e.g., 74 maslinic acid analogs), separate a portion (e.g., 27 compounds) to serve as the external test set. The division should be performed using an activity-stratified method or algorithms like Kennard-Stone to ensure representativeness [59] [13].
- Model Building: Develop the final 3D-QSAR model using only the training set data.
- Activity Prediction: Use the finalized model to predict the activities of the test set compounds.
- Calculation of Predictive Power: Calculate the external predictive
r²(r²_predorR²pred) to quantify the model's performance on new data. The criteria proposed by Golbraikh and Tropsha are often used, which include [13]:R²pred > 0.6- The slope
kof the regression line between actual and predicted values should be between 0.85 and 1.15.
In the study on parviflorons derivatives, the best model showed an external R²pred of 0.6214, confirming its acceptable predictive capability [13].
Table 1: Key Statistical Metrics for QSAR Model Validation
| Metric | Formula/Symbol | Acceptance Threshold | Purpose |
|---|---|---|---|
| Fitness Quality | r² (Regression Coeff.) |
> 0.8 | Goodness-of-fit of the model to the training data [59]. |
| Internal Robustness | q² (LOO Cross-Val. Coeff.) |
> 0.5 (Acceptable) > 0.7 (Good) | Estimate of model predictability and robustness [59]. |
| External Predictivity | r²_pred (Predictive r²) |
> 0.6 [13] | True predictive power on an external test set. |
| Statistical Significance | F (Fischer F-statistic) |
Higher is better | Confidence in the significance of the model. |
The Application to Maslinic Acid Analogs
The field-based 3D-QSAR model for maslinic acid analogs against the MCF-7 breast cancer cell line serves as an exemplary case of rigorous validation [59]. The model was built using the FieldTemplater and Forge software, aligning 74 compounds to a common pharmacophore derived from highly active analogs [59].
- Model Performance: The model demonstrated excellent internal robustness, with a high
r²of 0.92 and a LOO-validatedq²of 0.75 [59]. - External Utility: The validated model was successfully used as a virtual screening tool to prioritize 593 prediction set compounds from the ZINC database. This process, combined with drug-likeness and ADMET filters, identified 39 top hits, with compound P-902 emerging as the best candidate [59] [9]. This underscores the practical value of a rigorously validated QSAR model in accelerating drug discovery.
Figure 1: A workflow diagram for the development and validation of a robust 3D-QSAR model, as applied to maslinic acid analogs.
The Scientist's Toolkit: Research Reagent Solutions
Table 2: Essential Software and Tools for 3D-QSAR Model Development and Validation
| Tool / Reagent | Function / Application | Example Use Case |
|---|---|---|
| Forge / FieldTemplater | Field-based molecular alignment, pharmacophore generation, and 3D-QSAR model building. | Used to derive the bioactive conformation and build the 3D-QSAR model for maslinic acid analogs [59]. |
| ChemBio3D / VLifeMDS | 2D to 3D structure conversion and molecular mechanics geometry optimization. | Preparing and energy-minimizing the 3D structures of the training set compounds [59] [60]. |
| Genetic Function Approximation (GFA) | A variable selection algorithm for building optimal QSAR models. | Used in the development of the QSAR model for parviflorons derivatives [13]. |
| PLS Regression (SIMPLS) | The core statistical method for correlating 3D field descriptors with biological activity. | Algorithm used to develop the 3D-QSAR model in the Forge software [59]. |
| Data Pre-treatment Software | Removes irrelevant or redundant molecular descriptors before model building. | Pretreatment of descriptors calculated for parviflorons derivatives to improve model quality [13]. |
| Applicability Domain (William's Plot) | Defines the chemical space where the model's predictions are reliable. | Plot of standardized residuals vs. leverage values to identify outliers and structurally influential compounds [13]. |
Breast cancer remains a leading cause of morbidity and mortality worldwide, with the MCF-7 cell line serving as a crucial experimental model for estrogen receptor-positive (ER+) breast cancer research [4] [61]. The global prevalence and rising frequency of breast cancer have accelerated drug discovery efforts, particularly focusing on natural compounds with therapeutic potential [4]. Maslinic acid, a pentacyclic triterpenoid derived primarily from olive oil processing byproducts, has emerged as a promising anticancer agent [4] [62]. This case study details the development and validation of a field-based three-dimensional quantitative structure-activity relationship (3D-QSAR) model for maslinic acid analogs and their activity against the MCF-7 breast cancer cell line. The research was conducted within the broader context of a thesis focused on advanced QSAR model development for natural product drug discovery, emphasizing the integration of computational predictions with experimental validation to accelerate anticancer drug development [4].
Experimental Design and Workflow
The overall experimental strategy employed a comprehensive computational approach to develop and validate the 3D-QSAR model, followed by virtual screening to identify potential lead compounds.
Figure 1: Experimental workflow for the development and validation of the field-based 3D-QSAR model for maslinic acid analogs.
Data Collection and Preparation
The training dataset comprised 74 compounds with known half-maximal inhibitory concentration (IC~50~) values against the MCF-7 cell line, gathered from prior literature reports [4]. The two-dimensional chemical structures were converted to three-dimensional formats using the converter module of ChemBio3D Ultra (PerkinElmer/CambridgeSoft, UK) [4]. Experimental IC~50~ values were converted to pIC~50~ (pIC~50~ = -logIC~50~) and defined as the dependent variable for QSAR model development [4].
Conformational Analysis and Pharmacophore Generation
In the absence of structural information for maslinic acid in its target-bound state, the FieldTemplater module of Forge v10 (Cresset Inc., UK) was employed to determine the bioactive conformation hypothesis [4]. The template was generated using field and shape information from five reference compounds (M-159, M-254, M-286, M-543, and M-659) [4]. Field points were generated using the eXtended Electron Distribution (XED) force field, calculating four different molecular fields: positive electrostatics, negative electrostatics, shape (van der Waals), and hydrophobicity [4].
Compound Alignment and 3D-QSAR Model Development
Compounds were aligned with the identified pharmacophore template using Forge v10 software [4]. Field point-based descriptors were used for building the 3D-QSAR model after alignment of the 74 compounds with known IC~50~ values [4]. The partial least squares (PLS) regression method was employed using Forge's field QSAR module, specifically utilizing the SIMPLS algorithm [4]. The initial training set of 74 compounds was partitioned into a training set (47 compounds) and test set (27 compounds) using an activity-stratified method to evaluate model performance [4].
Model Validation
The derived QSAR model was validated using the leave-one-out (LOO) cross-validation technique, where training was performed with a dataset of N-1 compounds and tested on the remaining one, repeated N times until all data points underwent testing [4]. The model was further validated using the external test set compounds that were not included in the training process [4].
Results and Discussion
3D-QSAR Model Performance and Validation
The field-based 3D-QSAR model demonstrated excellent predictive capability for the anticancer activity of maslinic acid analogs against the MCF-7 cell line.
Table 1: Statistical parameters of the validated 3D-QSAR model
| Statistical Parameter | Value | Acceptance Criteria |
|---|---|---|
| Regression coefficient (r²) | 0.92 | >0.6 |
| Cross-validation coefficient (q²) | 0.75 | >0.5 |
| Leave-one-out validation | Accepted | Stable performance |
| Test set prediction | Accepted | R²~pred~ >0.6 |
The model exhibited a high regression coefficient (r² = 0.92) and acceptable cross-validation coefficient (q² = 0.75), indicating robust predictive ability [4]. The LOO cross-validation method confirmed the model's stability and reliability for activity prediction of new analogs [4].
Activity Atlas and SAR Visualization
The activity-atlas models provided three-dimensional visualization of structure-activity relationships, revealing key structural features influencing anticancer activity:
- Average of Actives: Showed common structural features among selected active compounds
- Activity Cliff Summary: Identified positive and negative electrostatic sites, favorable and unfavorable hydrophobic regions, and favorable shape characteristics of active compounds
- Regions Explored Analysis: Mapped the chemical space covered by the aligned compounds [4]
The 3D-QSAR model revealed specific electrostatic and steric field points that significantly influence anticancer activity, providing crucial guidance for analog design [4] [9].
Virtual Screening and Hit Identification
The validated model was employed for virtual screening of the ZINC database, identifying 593 potential analogs based on Tanimoto score similarity ≥80% with maslinic acid [4]. These compounds were progressively filtered using multiple drug-likeness criteria:
Table 2: Virtual screening funnel and hit identification
| Screening Step | Criteria | Compounds Remaining |
|---|---|---|
| Initial Similarity Screening | Tanimoto score ≥80% | 593 |
| Lipinski's Rule of Five | Oral bioavailability | 39 |
| ADMET Risk Assessment | Drug-like features | 39 |
| Synthetic Accessibility | Feasible synthesis | 39 |
| Docking Screening | Multiple targets | 1 (P-902) |
The multi-step screening process identified 39 top hits that satisfied all criteria for drug-likeness, oral bioavailability, and synthetic accessibility [4]. Subsequent molecular docking studies against potential protein targets (AKR1B10, NR3C1, PTGS2, and HER2) identified compound P-902 as the most promising candidate [4].
Target Identification and Molecular Docking
Docking studies revealed significant interactions between the identified hits and key molecular targets. The glucocorticoid receptor (NR3C1) emerged as a particularly relevant target, reported to promote cancer cell survival and induce chemoresistance in breast cancer patients [9]. Compound P-902 demonstrated favorable binding interactions with NR3C1, comparable to control co-crystallized inhibitors [4] [9].
Figure 2: Multi-target docking approach and potential mechanisms of action for maslinic acid analog P-902 against breast cancer targets.
ADMET and Pharmacokinetic Profiling
Comprehensive ADMET (Absorption, Distribution, Metabolism, Excretion, and Toxicity) evaluation of the lead compound P-902 revealed favorable pharmacokinetic properties:
Table 3: ADMET risk assessment of compound P-902 compared to standard drug
| ADMET Risk Parameters | Risk Range | P-902 | Topotecan (Standard) |
|---|---|---|---|
| Size, Charge, Solubility, Lipophilicity | 0-8 | 3.26 | 0.0 |
| P-450 Oxidation | 0-6 | 0.0 | 0.0 |
| Mutagenicity | 0-4 | 0.0 | 2.0 |
| Toxicity (Hepatotoxicity) | 0-7 | 0.96 | 2.0 |
| Total Risk Score | 0-24 | 4.22 | 2.0 |
Compound P-902 demonstrated slightly lipophilic characteristics, suggesting decreased renal clearance but potentially increased metabolic clearance [9]. Importantly, P-902 showed no mutagenic or estrogen receptor toxicity, unlike the reference drug topotecan [9].
Research Reagent Solutions
Table 4: Essential research reagents and computational tools for 3D-QSAR model development
| Reagent/Tool | Specification | Function in Protocol |
|---|---|---|
| ChemBio3D Ultra | PerkinElmer/CambridgeSoft | 2D to 3D structure conversion and molecular modeling |
| Forge v10 | Cresset Inc., UK | Field-based QSAR, pharmacophore generation, and molecular alignment |
| FieldTemplater Module | Integrated in Forge v10 | Bioactive conformation hypothesis generation |
| XED Force Field | Extended Electron Distribution | Field point calculation and conformational analysis |
| ZINC Database | Publicly accessible | Source of compounds for virtual screening |
| PLS Regression | SIMPLS Algorithm | QSAR model development and validation |
| DFT/B3LYP/6-311G | Spartan 14 | Quantum chemical calculations for geometry optimization (alternative method) |
This case study successfully demonstrates the development and validation of a field-based 3D-QSAR model for maslinic acid analogs with activity against the MCF-7 breast cancer cell line. The model exhibited excellent predictive capability with r² = 0.92 and q² = 0.75, successfully guiding the identification of compound P-902 as a promising lead candidate. The integrated computational approach, incorporating 3D-QSAR, virtual screening, molecular docking, and ADMET prediction, provides a robust framework for natural product-based drug discovery. The validated model offers significant utility for lead identification and optimization in early anticancer drug discovery, particularly for breast cancer therapeutics. The comprehensive validation strategy and structured protocol detailed in this study can be adapted for QSAR model development for other natural products and therapeutic targets.
Within the context of developing field-based 3D-QSAR models for maslinic acid analogs, the selection of an appropriate methodology is paramount for obtaining reliable and predictive insights. This application note provides a comparative analysis of two principal approaches: traditional Comparative Molecular Field Analysis (CoMFA) and the more automated topomer CoMFA. Field-based 3D-QSAR techniques correlate the biological activities of compounds with their steric and electrostatic molecular fields, providing visual contours that guide the optimization of chemical structures [3]. Maslinic acid, a pentacyclic triterpene with demonstrated anticancer potential, serves as an excellent scaffold for such studies, particularly in the development of novel therapeutics against targets like the breast cancer cell line MCF-7 [3] [23]. The objective of this document is to delineate the operational protocols, relative merits, and specific applications of these two methods, thereby furnishing researchers with a clear framework for their implementation in rational drug design projects focused on maslinic acid derivatives.
Theoretical Background and Key Differences
Traditional Field-Based CoMFA is a well-established 3D-QSAR method that models biological activity by analyzing the steric (Lenard-Jones) and electrostatic (Coulombic) fields of molecules. A critical and often subjective step in this process is molecular alignment, which requires the superposition of training set molecules based on a presumed biologically active conformation, typically guided by a crystallographic template or molecular mechanics minimization [63]. The quality of the resulting model is heavily dependent on the accuracy of this alignment.
In contrast, Topomer CoMFA represents a second-generation methodology that automates the alignment procedure. Instead of relying on a user-defined superposition, it generates molecular fragments (or "R-groups") with a single, canonical topomer pose—a conformation and position determined solely by the fragment's topology and a fixed Cartesian vector for the open valence [64]. This automation ensures that the model generation is highly objective and reproducible, depending only on the two-dimensional connectivity of the training set structures, the user-specified fragmentation, and the measured biological activities [65] [64]. This key difference fundamentally alters the workflow and applicability of each method.
Table 1: Core Conceptual Differences Between CoMFA and Topomer CoMFA
| Feature | Traditional Field-Based CoMFA | Topomer CoMFA |
|---|---|---|
| Alignment Basis | Superposition on a common scaffold or pharmacophore; often requires a template structure [63] | Automatic, canonical alignment of individual R-groups based on 2D connectivity [65] [64] |
| Conformation | Often the global energy minimum or a putative bioactive conformation [63] | A single, systematically generated "topomer" conformation [64] |
| User Dependency | High (subjective alignment choices) | Low (automated and objective process) |
| Primary Output | 3D contour maps indicating regions where steric/electrostatic changes boost/hinder activity [63] [3] | Separate 3D contour maps for each R-group region with similar interpretive value [63] [65] |
| Predictive Nature | Model-dependent | Often considered more structurally conservative and predictive for analogs of the training set [64] |
Comparative Workflow Protocols
The following standardized protocols outline the core experimental steps for implementing both traditional and topomer CoMFA analyses, with specific references to applications in maslinic acid research.
Protocol for Traditional Field-Based CoMFA
This protocol is adapted from studies on maslinic acid analogs for anticancer activity [3] [19].
Data Set Curation and Preparation
- Activity Data: Collect a series of compounds (e.g., 30-40 analogs) with experimentally determined biological activities (e.g., IC₅₀ against MCF-7 breast cancer cells). Convert activity values to a molar scale (e.g., pIC₅₀) for modeling [3].
- Structure Preparation: Draw or import the 2D structures of all analogs. Convert them to 3D models and subject them to geometry optimization using molecular mechanics (e.g., MMFF94) or semi-empirical quantum chemical methods (e.g., AM1). This step minimizes the structures to their global energy minimum [3].
Molecular Alignment
- Template Selection: Choose a template molecule, often the most active compound or one with a known crystallographic structure.
- Alignment Rule: Superimpose all molecules in the training set onto the common core structure of the template. In the case of maslinic acid analogs, this involves aligning the pentacyclic triterpene scaffold [3]. The choice between a mechanic-minimized structure or a crystallographic template (indirect alignment) can significantly impact predictive power [63].
Field Calculation and Model Generation
- Grid Setup: Place a 3D grid (e.g., 2.0 Å spacing) around the aligned molecules.
- Probe Interaction: Calculate steric (using an sp³ carbon probe) and electrostatic (using a +1 charge probe) field energies at each lattice point.
- Partial Least Squares (PLS) Analysis: Use the PLS algorithm to correlate the field descriptors with the biological activity. The model is typically validated using Leave-One-Out (LOO) cross-validation, yielding a cross-validated coefficient ( q^2 ). A ( q^2 > 0.5 ) is generally considered statistically significant [3].
Protocol for Topomer CoMFA
This protocol is based on applications in diverse fields, from HIV-1 protease inhibitors to azo dyes [63] [65].
Data Set and Fragmentation
- Activity Data: Prepare the data set as described in Step 3.1.1.
- Structure Fragmentation: For each molecule, define how it is to be fragmented into R-groups. This is a critical user-defined step. A common approach is to cleave a single bond connecting a central scaffold to a variable substituent.
Automatic Topomer Generation
- Pose Generation: The software automatically generates a single, canonical topomer pose for each R-group fragment. This pose is determined by the fragment's topology and is rooted onto a fixed Cartesian vector at the open valence. This process is fully automated and requires no user intervention [64].
Field Calculation and Model Generation
- Field Descriptor Calculation: Steric and electrostatic fields are calculated for each topomer fragment individually, placed within its own grid.
- Model Building: The PLS analysis is performed using the field descriptors from all R-groups. Similar to traditional CoMFA, the model is validated with LOO cross-validation.
The following workflow diagram illustrates the key procedural differences between these two methods:
The Scientist's Toolkit: Essential Research Reagents and Computational Solutions
The successful application of CoMFA methodologies requires a suite of specialized software tools and computational resources.
Table 2: Key Research Reagent Solutions for 3D-QSAR Studies
| Tool/Resource | Function/Description | Application in Protocol |
|---|---|---|
| Molecular Modeling Suites (e.g., SYBYL, MOE, Schrödinger Suite) | Integrated platforms providing tools for structure building, geometry optimization, conformational analysis, and molecular alignment. | Essential for Steps 3.1.1 and 3.1.2 (Traditional CoMFA): Structure preparation, energy minimization, and manual molecular alignment [3]. |
| Topomer CoMFA Module (e.g., within SYBYL) | A specialized software module that automates the generation of topomer poses and performs the subsequent field analysis. | Core component for Steps 3.2.2 and 3.2.3 (Topomer CoMFA): Automates R-group alignment and model generation [63] [65]. |
| PLSR Algorithm | Partial Least Squares Regression is the statistical engine that correlates the vast number of field descriptors with the biological activity data. | Used in Step 3.1.3 and 3.2.3 for model generation in both CoMFA and Topomer CoMFA. |
| Computational Chemistry Tools (e.g., for AM1, AM1/DFT calculations) | Software for semi-empirical or density functional theory calculations to derive partial atomic charges, a critical input for electrostatic field calculations. | Used in Step 3.1.1 for deriving partial charges prior to field calculation in traditional CoMFA [63]. |
| Validation Scripts/Modules | Tools for performing Leave-One-Out (LOO) and other cross-validation techniques to assess the robustness and predictive power of the QSAR model. | Used in Step 3.1.3 to calculate ( q^2 ) and other statistical metrics for model validation [3]. |
Application in Maslinic Acid Analog Research
The development of a field-based 3D-QSAR model for maslinic acid analogs against the MCF-7 breast cancer cell line serves as a pertinent case study. In this research, known active compounds were aligned onto a identified pharmacophore template to develop the model. The derived model demonstrated excellent statistical characteristics, with an ( r^2 ) of 0.92 and a LOO-validated ( q^2 ) of 0.75, confirming its high predictive capability [3] [19]. The resulting 3D contour maps provided actionable insights, indicating specific regions around the maslinic acid scaffold where steric bulk could increase or decrease activity, and where electrostatic properties were critical for binding. This information was successfully used for the virtual screening of potential analogs, leading to the identification of a best hit compound, P-902, which was subsequently validated through docking studies [3] [9].
While a direct application of topomer CoMFA to maslinic acid is not documented in the provided results, its utility is evident in related natural product research. For instance, in a study on HIV-1 protease inhibitors, topomer CoMFA generated contour maps that provided "comprehensive information about structural features affecting the inhibitory activities," leading to the suggestion of new inhibitor structures [63]. The remarkable reported accuracy of topomer CoMFA—with an average error of pIC₅₀ prediction of around 0.5 across multiple real-world prospective trials—highlights its potential for providing highly reliable guidance for the synthesis of new maslinic acid derivatives [64].
Both traditional field-based CoMFA and topomer CoMFA are powerful techniques for establishing quantitative structure-activity relationships in the context of maslinic acid analog research. The choice between them hinges on the specific research goals and constraints. Traditional CoMFA offers high interpretability through full-molecule contour maps but requires careful and often subjective manual alignment. Topomer CoMFA, with its automated, objective workflow, provides exceptional predictive accuracy for structural analogs and is highly efficient for screening large virtual libraries of R-group variations. For a research program focused on optimizing maslinic acid, a synergistic approach may be most effective: using traditional CoMFA to gain a broad, holistic understanding of the molecular interactions, followed by topomer CoMFA to rapidly and reliably guide the fine-tuning of specific substituents.
Cross-Verification with Molecular Docking against Targets like NR3C1 and HER2
In the development of field-based three-dimensional quantitative structure-activity relationship (3D-QSAR) models for maslinic acid analogs, cross-verification of the predicted activity against relevant biological targets is a critical step. This protocol details the application of molecular docking to validate the potential anticancer activity of computationally designed compounds against key targets identified in breast cancer research, specifically the glucocorticoid receptor (NR3C1) and human epidermal growth factor receptor 2 (HER2). Integrating docking validation with 3D-QSAR models creates a robust computational workflow that significantly enhances the confidence in predicted bioactive compounds before committing resources to synthetic chemistry and biological testing [4] [19].
Experimental Principles
Molecular docking predicts the preferred orientation and binding affinity of a small molecule (ligand) when bound to a macromolecular target (receptor). When applied to maslinic acid analogs, this method provides atomic-level insights into protein-ligand interactions that underlie the bioactivity predicted by 3D-QSAR models. The fundamental principle involves computational sampling of possible ligand conformations and orientations within the defined binding site of the target protein, followed by scoring of these poses to estimate binding strength [66] [67]. This approach is particularly valuable for prioritizing which analogs to synthesize when working with novel maslinic acid derivatives, as it evaluates complementarity to the target's active site, including steric fit, electrostatic interactions, and hydrogen bonding patterns.
Equipment and Software Requirements
Table 1: Essential Software Tools for Molecular Docking Validation
| Software Category | Specific Tools | Primary Function |
|---|---|---|
| Molecular Modeling Suite | Schrödinger Suite, Discovery Studio | Integrated platform for protein preparation, docking, and visualization |
| Docking Software | AutoDock Vina, Glide (Schrödinger), AutoDock Tools | Performing molecular docking simulations and binding pose prediction |
| Protein Database | RCSB Protein Data Bank (PDB) | Source for 3D crystal structures of target proteins |
| Ligand Preparation | BIOVIA Draw, Avogadro, Gaussian | Drawing, optimization, and energy minimization of ligand structures |
| Visualization & Analysis | Discovery Studio Visualizer, PyMOL, LigPlot+ | Analysis and visualization of docking results and interaction patterns |
Reagent Solutions and Research Materials
Table 2: Key Research Reagents and Computational Resources
| Research Reagent/Material | Specification/Function | Application Context |
|---|---|---|
| Target Protein Structures | PDB ID: 3PP0 (HER2), PDB ID: 1M17 (EGFR), Appropriate NR3C1 structure | High-resolution crystal structures for docking simulations [66] [68] |
| Chemical Library | Maslinic acid analogs, Reference inhibitors (Lapatinib, Neratinib) | Test compounds and positive controls for validation [67] |
| Force Field Parameters | OPLS3, OPLS4, CHARMM36 | Mathematical representations of molecular mechanics for energy calculations [67] |
| Computational Hardware | Multi-core processors, High-performance computing (HPC) nodes | Resources to handle computationally intensive docking and dynamics simulations |
Step-by-Step Procedure
Target Protein Preparation
- Retrieve 3D Structure: Download the high-resolution crystal structure of your target protein (e.g., HER2 using PDB ID: 3PP0 [66] [68] or an appropriate NR3C1 structure) from the RCSB Protein Data Bank (https://www.rcsb.org/).
- Preprocess Protein: Using the protein preparation wizard in Schrödinger Suite or similar tools:
- Remove all water molecules and any non-essential co-crystallized ligands.
- Add missing hydrogen atoms appropriate for physiological pH (7.0 ± 0.5).
- Fill in missing side chains or loops using homology modeling if necessary.
- Assign correct protonation states for residues like Asp, Glu, His, etc.
- Energy Minimization: Perform constrained optimization of the protein structure using an appropriate force field (e.g., OPLS3/4) to relieve steric clashes while maintaining the overall crystal structure conformation, typically with a root mean square deviation (RMSD) cutoff of 0.3 Å [67].
Ligand Preparation
- Structure Generation: Generate 2D structures of maslinic acid analogs and reference compounds using chemical drawing software (e.g., BIOVIA Draw [66]).
- 3D Conversion and Optimization: Convert 2D structures to 3D using tools like Avogadro [66] or the LigPrep module in Schrödinger.
- Energy Minimization: Perform geometry optimization using semi-empirical methods (e.g., PM3 in Gaussian [66]) or molecular mechanics force fields to obtain low-energy, stable 3D conformations.
- Generate Tautomers and Stereoisomers: Account for all possible ionization states, tautomers, and stereoisomers that may exist at physiological pH using tools like Epik in Schrödinger [67].
Binding Site Definition and Grid Generation
- Identify Binding Site: For targets like HER2, define the ATP-binding site using the centroid coordinates of the co-crystallized native ligand (e.g., TAK-285 in PDB: 3RCD [67] or 03Q in PDB: 3PP0 [68]).
- Generate Grid Box: Create a 3D grid box centered on the binding site with sufficient dimensions to accommodate the ligand. Typical settings use a 20 × 20 × 20 Å grid box with 0.375 Å spacing for precise scoring [67].
Molecular Docking Execution
- Select Docking Algorithm: Choose an appropriate docking algorithm. For initial screening, High-Throughput Virtual Screening (HTVS) in Glide can be used, followed by Standard Precision (SP) and Extra Precision (XP) modes for top hits [67]. AutoDock Vina is also widely used for its balance of speed and accuracy [68].
- Configure Parameters: Set up docking parameters, including the number of binding poses to generate per ligand (typically 10-20) and exhaustiveness of search (for Vina).
- Run Docking Simulations: Execute docking runs for all maslinic acid analogs and reference compounds against the prepared target protein.
Post-Docking Analysis
- Pose Clustering and Selection: Analyze generated binding poses, cluster similar conformations, and select representative poses based on docking scores and interaction patterns.
- Interaction Analysis: Identify specific protein-ligand interactions (hydrogen bonds, hydrophobic contacts, π-π stacking, salt bridges) using visualization tools like Discovery Studio Visualizer [66] [68].
- Binding Affinity Estimation: Compare docking scores (reported as kcal/mol) across the analog series to rank compounds and correlate with 3D-QSAR predictions.
Data Analysis and Interpretation
Table 3: Quantitative Docking Data for Maslinic Acid Analogs and Reference Compounds
| Compound ID | Target Protein | Docking Score (kcal/mol) | Key Interacting Residues | Predicted IC₅₀ (nM) |
|---|---|---|---|---|
| P-902 | NR3C1 | -11.16 | To be determined from docking | 58.8 [4] |
| Lapatinib | HER2 | - | - | Clinical reference [67] |
| Liquiritin | HER2 | - | - | Nanomolar range [67] |
| Maslinic Acid | HER2 | -9.5 | To be determined from docking | Varies by analog |
Success Criteria Validation
- Binding Affinity Correlation: Successful analogs should demonstrate docking scores comparable to or better than known active compounds (e.g., Lapatinib for HER2) and show correlation with 3D-QSAR predicted activities [67].
- Pose Rationality: The binding pose should form physiochemically sensible interactions with key residues in the active site and should be consistent with known structure-activity relationships [4].
- Selectivity Considerations: For dual-targeting strategies, evaluate relative binding affinities between related targets (e.g., HER2 vs. EGFR) to assess potential selectivity [66].
Visualization of Workflow and Signaling Pathways
Diagram 1: Molecular docking validation workflow for 3D-QSAR models.
Diagram 2: Key signaling pathways for NR3C1 and HER2 targets.
Troubleshooting and Optimization
- Poor Ligand Pose Reproduction: If the native co-crystallized ligand cannot be re-docked successfully, verify the protonation states of key binding site residues and adjust grid box dimensions to ensure complete coverage of the binding pocket.
- Inconsistent Scoring: When docking scores do not correlate with experimental activity data, consider using multiple scoring functions or rescoring top poses with more rigorous methods like MM-GBSA (Molecular Mechanics with Generalized Born and Surface Area Solvation).
- Handling Protein Flexibility: For targets exhibiting significant side-chain mobility, implement induced-fit docking protocols that allow for protein flexibility during the docking simulation [67].
This application note provides a standardized protocol for cross-verifying field-based 3D-QSAR models of maslinic acid analogs through molecular docking against clinically relevant targets like NR3C1 and HER2. The integration of these computational approaches creates a powerful framework for prioritizing the most promising candidates for synthetic pursuit and experimental validation, ultimately accelerating the discovery of novel anticancer therapeutics from natural product-inspired chemistry.
Benchmarking Performance Against Other Natural Product Derivatives
Benchmarking the performance of novel compounds against established derivatives is a critical step in natural product-based drug discovery. For maslinic acid analogs, a class of pentacyclic triterpenoids with demonstrated anticancer potential, this process involves a multi-faceted comparison of structural, computational, and biological data [4] [62]. Field-based Three-Dimensional Quantitative Structure-Activity Relationship (3D-QSAR) models provide a powerful framework for this benchmarking by mapping the molecular features responsible for biological activity, enabling rational optimization of lead compounds [4]. This document outlines detailed application notes and experimental protocols for conducting such comparative analyses within the specific context of maslinic acid research, providing methodologies relevant to researchers and drug development professionals.
Application Notes: Establishing the Benchmarking Framework
Data Collection and Curation
The foundation of robust benchmarking is a high-quality, curated dataset. For maslinic acid, this involves collecting a training set of compounds with known in vitro biological activities, typically expressed as IC₅₀ values against relevant cell lines, such as the breast cancer cell line MCF-7 [4].
- Activity Data Standardization: Convert all experimental IC₅₀ values to a uniform negative logarithmic scale (pIC₅₀ = -log₁₀(IC₅₀)) to linearize the relationship for QSAR modeling [4].
- Dataset Partitioning: Divide the total compound set into a training set (for model development) and a test set (for validation) using an activity-stratified method to ensure both sets represent a similar range of biological activity. A typical split is approximately 2:1 (e.g., 47 training and 27 test compounds) [4].
Defining Key Performance Indicators (KPIs)
Benchmarking requires quantitative metrics for comparison. The following table summarizes the core KPIs for evaluating maslinic acid analogs.
Table 1: Key Performance Indicators for Benchmarking Natural Product Derivatives
| KPI Category | Specific Metric | Application in Benchmarking |
|---|---|---|
| Computational Performance | 3D-QSAR Model Statistics (r², q²) [4] | Quantifies the predictive accuracy and internal robustness of the structure-activity model. |
| Predicted Binding Affinity (IC₅₀) [69] | In-silico estimate of a compound's potency against a specific molecular target. | |
| Physicochemical & Drug-Likeness | Lipinski's Rule of Five Compliance [4] [70] | Assesses oral bioavailability potential. |
| ADMET Risk Profile [4] [69] | Evaluates absorption, distribution, metabolism, excretion, and toxicity characteristics. | |
| Synthetic Accessibility Score (SCScore) [69] | Estimates the feasibility of chemical synthesis. | |
| Biological Activity | In vitro IC₅₀ (e.g., MCF-7, Leukemia cell lines) [4] [62] | Direct measure of experimental potency against cancer cell lines. |
| Selectivity Index (e.g., vs. normal cell lines) | Measures the therapeutic window and potential toxicity. |
Experimental Protocols
Protocol 1: Developing a Field-Based 3D-QSAR Model
Purpose: To construct a predictive 3D-QSAR model for maslinic acid analogs to understand the molecular fields governing anticancer activity.
Materials:
- Software: Forge v10 (or equivalent) with FieldTemplater and Field QSAR modules [4].
- Data: A curated set of maslinic acid analogs with associated pIC₅₀ values.
Methodology:
- Conformational Hunt and Pharmacophore Generation: Use the FieldTemplater module on a subset of highly active compounds to determine the bioactive conformation and generate a common 3D pharmacophore hypothesis. The software uses the XED force field to calculate positive/negative electrostatic, shape, and hydrophobic field points [4].
- Compound Alignment: Align all training and test set compounds onto the generated pharmacophore template. Use the best-matching low-energy conformations for model building [4].
- Model Development: Employ the Partial Least Squares (PLS) regression method (e.g., SIMPLS algorithm) on the aligned compounds. Use field point-based descriptors calculated at grid points around the molecules. Set the maximum number of components and perform Y-scrambling to validate model robustness [4].
- Model Validation: Validate the model using Leave-One-Out (LOO) cross-validation to obtain the cross-validated correlation coefficient (q²). Further, validate the model's external predictive power using the predetermined test set of compounds that were not used in training [4].
Protocol 2: Virtual Screening and In-silico Benchmarking of Novel Derivatives
Purpose: To generate and prioritize novel maslinic acid derivatives using computational tools.
Materials:
- Software: DerivaPredict (v1.0) [69], molecular docking software (e.g., AutoDock Vina).
- Databases: ZINC database, internal compound libraries.
Methodology:
- Derivative Generation: Input the maslinic acid structure into DerivaPredict. Apply curated chemical, biochemical, and metabolic transformation rules over multiple iterations (e.g., 2-3) to generate a library of novel derivatives [69].
- Structural Diversity Analysis: Evaluate the chemical space coverage of the generated library using molecular fingerprints (e.g., Morgan fingerprints) and dimensionality reduction techniques like UMAP. Calculate similarity indices to the parent maslinic acid structure [69].
- Activity and Drug-Likeness Prediction: Use integrated pretrained deep learning models in DerivaPredict to predict the binding affinity of derivatives against targets of interest (e.g., EGFR, NR3C1). Filter the resulting hits through Lipinski's Rule of Five and an ADMET risk filter [4] [69].
- Docking Studies: For top-ranked compounds, perform molecular docking simulations to understand putative binding modes and interactions with the target protein (e.g., using PDB ID: 1M17 for EGFR) and compare docking scores to the parent compound and known inhibitors [69].
Protocol 3: In vitro Validation of Benchmark Compounds
Purpose: To experimentally validate the anti-cancer potential of top-performing analogs identified in silico.
Materials:
- Cell Lines: MCF-7 (human breast cancer) [4], HL-60 (human promyelocytic leukemia) [62], and a normal cell line for selectivity assessment.
- Reagents: RPMI 1640 medium, Fetal Bovine Serum (FBS), MTT or similar cell viability assay kit, annexin V/PI apoptosis detection kit.
Methodology:
- Cell Culture and Treatment: Maintain cancer cell lines in appropriate media. Plate cells and treat with a concentration range of the benchmark maslinic acid analog and reference compounds for 24-72 hours [4] [62].
- Cytotoxicity Assay: Perform MTT assays to determine cell viability and calculate the IC₅₀ values for each compound.
- Mechanistic Studies: For compounds showing high potency, perform annexin V/PI staining followed by flow cytometry to quantify apoptosis. Further, use Western blotting to analyze the expression of key pathway proteins (e.g., caspase-3, caspase-9, Bcl-2, p53) to elucidate the mechanism of action [62].
- Selectivity Calculation: Determine the IC₅₀ of the compound in a normal cell line and calculate the Selectivity Index (SI = IC₅₀(Normal) / IC₅₀(Cancer)).
Workflow Visualization
Diagram 1: Benchmarking Workflow Overview
Research Reagent Solutions
The following table details essential reagents and computational tools for executing the benchmarking protocols.
Table 2: Essential Research Reagents and Tools for Benchmarking Studies
| Item Name | Function/Application | Example/Supplier |
|---|---|---|
| Forge v10 Software | Field-based 3D-QSAR model development, compound alignment, and activity prediction [4]. | Cresset Inc. |
| DerivaPredict (v1.0) | Generates novel natural product derivatives using reaction rules and predicts their binding affinity & ADMET profiles [69]. | Open-source tool (GitHub) |
| MCF-7 Cell Line | Human breast adenocarcinoma cell line; standard for in vitro anticancer activity testing of maslinic acid analogs [4]. | ATCC HTB-22 |
| HL-60 Cell Line | Human promyelocytic leukemia cell line; used for evaluating anti-leukemic activity [62]. | ATCC CCL-240 |
| RPMI 1640 Medium | Cell culture medium for maintaining and propagating hematopoietic and other mammalian cells [62]. | Himedia, Merck |
| Fetal Bovine Serum (FBS) | Essential supplement for cell culture media, providing growth factors and nutrients [62]. | Himedia |
| AutoDock Vina | Molecular docking software for predicting binding modes and affinities of compounds to target proteins [69]. | The Scripps Research Institute |
| ZINC Database | Publicly available database of commercially available compounds for virtual screening [4]. | zinc.docking.org |
Conclusion
Field-based 3D-QSAR modeling represents a powerful computational strategy for rational drug design, efficiently transforming natural product leads like maslinic acid into optimized anticancer candidates. By integrating the foundational principles, methodological rigor, troubleshooting techniques, and robust validation outlined in this article, researchers can reliably identify critical structural features driving activity—such as specific steric and electrostatic requirements—and generate potent, drug-like analogs. The successful identification of compound P-902 as a top hit against breast cancer cell lines demonstrates the real-world applicability of this approach. Future directions should focus on incorporating advanced machine learning models, expanding to in vivo validation, and adapting this framework for other therapeutic targets and chemical classes to broaden its impact on biomedical and clinical research.
References
- 1. Breast cancer [https://www.who.int/news-room/fact-sheets/detail/breast-cancer]
- 2. Global burden and projections of breast cancer incidence and ... [https://pmc.ncbi.nlm.nih.gov/articles/PMC12611818/]
- 3. 3D-QSAR studies on Maslinic acid analogs for Anticancer ... [https://pubmed.ncbi.nlm.nih.gov/28729623/]
- 4. 3D-QSAR studies on Maslinic acid analogs for Anticancer ... [https://www.nature.com/articles/s41598-017-06131-0]
- 5. Key Advances in Breast Cancer Treatment: First Half of 2025 [https://www.biochempeg.com/article/442.html]
- 6. Breast Cancer Breakthroughs Episode 14: Highlights from ... [https://www.komen.org/blog/bcbt-asco-2025/]
- 7. (PDF) Maslinic as an effective anticancer agent acid [https://www.academia.edu/83933796/Maslinic_acid_as_an_effective_anticancer_agent]
- 8. - 3 studies on D analogs for Anticancer QSAR ... Maslinic acid activity [https://www.nature.com/articles/s41598-017-06131-0?error=cookies_not_supported&code=efbd30bc-29af-49c0-97e4-4d815ad7e7eb]
- 9. 3-D QSAR studies on maslinic acid analogs | PPTX [https://www.slideshare.net/slideshow/3d-qsar-studies-on-maslinic-acid-analogs/130246271]
- 10. | PPTX 3 d qsar [https://www.slideshare.net/slideshow/3d-qsar/96597282]
- 11. - 3 studies on Maslinic acid analogs for Anticancer D ... QSAR activity [https://www.nature.com/articles/s41598-017-06131-0?error=cookies_not_supported&code=40ad9a23-8a0e-41cc-890e-4c49ca9066f6]
- 12. Exploring conformational search protocols for ligand- based virtual... [https://pubmed.ncbi.nlm.nih.gov/25408244/]
- 13. QSAR, Ligand Based Design and Pharmacokinetic Studies ... [https://link.springer.com/article/10.1007/s42250-020-00207-7]
- 14. 3D-QSAR, Docking, ADME/Tox studies on Flavone ... [https://www.nature.com/articles/s41598-019-41984-7]
- 15. Python- based for antioxidant QSAR ... modeling protocol activity [https://link.springer.com/article/10.1007/s44371-025-00290-0]
- 16. — Orion Workflows 3 .2.1 documentation D QSAR Models 2025 [https://docs.eyesopen.com/floe/modules/models_3dqsar/docs/source/releasenotes_2025_2.html]
- 17. Beginner's Guide to 3D-QSAR in Drug Design [https://neovarsity.org/blogs/beginners-guide-3d-qsar-drug-design]
- 18. 3D-QSAR : Principles and Methods [https://drugdesign.org/chapters/3d-qsar/]
- 19. 3D-QSAR studies on Maslinic acid analogs for Anticancer activity ... [https://www.omicsdi.org/dataset/biostudies-literature/S-EPMC5519539]
- 20. 3D QSAR and HQSAR analysis of protein kinase B (PKB/Akt ... [https://arabjchem.org/3d-qsar-and-hqsar-analysis-of-protein-kinase-b-pkb-akt-inhibitors-using-various-alignment-methods/]
- 21. Robust and predictive 3D-QSAR models for ... - RSC Publishing [https://pubs.rsc.org/en/content/articlehtml/2024/ra/d4ra05342g]
- 22. Identification of Molecular Descriptors for Design of Novel ... [https://pubmed.ncbi.nlm.nih.gov/27410776/]
- 23. The Anticancer Potential of Maslinic Acid and Its Derivatives [https://pmc.ncbi.nlm.nih.gov/articles/PMC8437384/]
- 24. COVID-19 Drug Candidate [https://www.mdpi.com/2076-0817/10/5/623]
- 25. Selected Pentacyclic Triterpenoids and Their Derivatives ... [https://www.mdpi.com/1420-3049/30/15/3106]
- 26. The three secrets to great 3D-QSAR: Alignment, alignment ... [https://cresset-group.com/about/news/the-three-secrets-to-great-3d-qsar-alignment-align/]
- 27. 3D-QSAR, design, molecular docking and dynamics ... [https://www.frontiersin.org/journals/pharmacology/articles/10.3389/fphar.2025.1545791/full]
- 28. Alignment-independent technique for 3D QSAR analysis - PMC [https://pmc.ncbi.nlm.nih.gov/articles/PMC4833814/]
- 29. Alignment-independent technique for 3D QSAR analysis [https://pubmed.ncbi.nlm.nih.gov/27026022/]
- 30. Validation metrics (R2 and Q2) for Partial Least Squares (PLS ... [https://stats.stackexchange.com/questions/292673/validation-metrics-r2-and-q2-for-partial-least-squares-pls-regression]
- 31. What Is the Appropriate Range for R2 and Q2 Intercepts in ... [https://www.mtoz-biolabs.com/what-is-the-appropriate-range-for-r2-and-q2-intercepts-in-pls-da.html]
- 32. 3D-QSAR, design, molecular docking and dynamics ... [https://pmc.ncbi.nlm.nih.gov/articles/PMC11841475/]
- 33. BIOVIA Discovery Studio Visualizer [https://www.3ds.com/products/biovia/discovery-studio/visualization]
- 34. Virtual Screening of Acetylcholinesterase Inhibitors Using the Lipinski's Rule of Five and ZINC Databank - PMC [https://pmc.ncbi.nlm.nih.gov/articles/PMC4317581/]
- 35. Lipinski's rule of five - Wikipedia [https://en.wikipedia.org/wiki/Lipinski's_rule_of_five]
- 36. Lipinski's Rule of Five - an overview | ScienceDirect Topics [https://www.sciencedirect.com/topics/nursing-and-health-professions/lipinskis-rule-of-five]
- 37. Field-based 3D-QSAR for tyrosine protein kinase JAK-2 ... [https://pubmed.ncbi.nlm.nih.gov/37409931]
- 38. Automatic generation of alignments for 3D QSAR analyses [https://www.sciencedirect.com/science/article/abs/pii/S1093326301001103]
- 39. 3.3. Field-Based QSAR Model [https://bio-protocol.org/exchange/minidetail?id=9349298&type=30]
- 40. - 3 , Docking, ADME/Tox studies on Flavone analogs reveal... D QSAR [https://www.nature.com/articles/s41598-019-41984-7?error=cookies_not_supported]
- 41. Tackling descriptor intercorrelation in QSAR models | Cresset [https://cresset-group.com/science/science-resources/qsar-models-tackling-descriptor-intercorrelation/]
- 42. Selected Pentacyclic Triterpenoids and Their Derivatives ... [https://pmc.ncbi.nlm.nih.gov/articles/PMC12348783/]
- 43. Comparison of various methods for validity evaluation of ... [https://bmcchem.biomedcentral.com/articles/10.1186/s13065-022-00856-4]
- 44. A Beginner's Guide to QSAR Modeling in Cheminformatics ... [https://neovarsity.org/blogs/cheminformatics-qsar-beginner-guides]
- 45. Improved QSAR methods for predicting drug properties ... [https://link.springer.com/article/10.1140/epje/s10189-025-00491-6]
- 46. 3D-QSAR model development [https://bio-protocol.org/exchange/minidetail?id=3309422&type=30]
- 47. Comprehensive strategies of machine-learning-based ... [https://pmc.ncbi.nlm.nih.gov/articles/PMC8441174/]
- 48. Why is QSAR so far behind other forms of machine ... [https://variational.ai/blog/why-is-qsar-so-far-behind-other-forms-of-machine-learning-and-what-can-be-done-to-close-the-gap/]
- 49. Advanced ADMET Modeling Using Deep Learning and AI [https://www.technologynetworks.com/drug-discovery/blog/beyond-black-box-models-advances-in-data-driven-admet-modeling-403114]
- 50. Non-parametric and 3D-QSAR modeling of 17-picolyl and ... [https://www.sciencedirect.com/science/article/abs/pii/S1093326318307174]
- 51. Time For a New Adventure - Practical Cheminformatics [https://patwalters.github.io/Time-For-a-New-Adventure/]
- 52. Federated Learning for ADMET Prediction [https://www.apheris.com/resources/blog/federated-learning-for-admet-prediction-expanding-model-applicability]
- 53. 3.5. ADMET Prediction [https://bio-protocol.org/exchange/minidetail?id=3751773&type=30]
- 54. From Patterns to Pills: How Informatics Is Shaping Medicinal ... [https://pmc.ncbi.nlm.nih.gov/articles/PMC12114992/]
- 55. ADME Optimisation 2025 | Accelerate Drug Development [https://www.pharmaron.com/pharmaron-stories/adme-optimisation-2025/]
- 56. Convenient and chromatography-free partial syntheses of ... [https://www.sciencedirect.com/science/article/abs/pii/S0040403914012386]
- 57. Integrating Synthetic Accessibility Scoring and AI-Based ... [https://www.mdpi.com/2813-2998/4/2/26]
- 58. Derivatization Design of Synthetically Accessible Space for ... [https://pmc.ncbi.nlm.nih.gov/articles/PMC7883369/]
- 59. 3D-QSAR studies on Maslinic acid analogs for Anticancer ... [https://pmc.ncbi.nlm.nih.gov/articles/PMC5519539/]
- 60. Virtual screening, Docking, ADMET and System ... [https://www.nature.com/articles/s41598-018-23768-7]
- 61. The combination of multi-approach studies to explore ... [https://www.frontiersin.org/journals/chemistry/articles/10.3389/fchem.2023.1197665/full]
- 62. Self-assembled renewable nano-sized pentacyclic ... [https://www.sciencedirect.com/science/article/abs/pii/S0141813023023103]
- 63. Comparative molecular field analysis (CoMFA), topomer ... [https://pubmed.ncbi.nlm.nih.gov/27933723/]
- 64. Rethinking 3D-QSAR - PMC [https://pmc.ncbi.nlm.nih.gov/articles/PMC3051061/]
- 65. Hologram quantitative structure–activity relationship and ... [https://www.sciencedirect.com/science/article/abs/pii/S0143720817325433]
- 66. Molecular Docking and Pharmacological In Silico Evaluation ... [https://pmc.ncbi.nlm.nih.gov/articles/PMC11941075/]
- 67. Discovery of natural scaffolds as HER2 inhibitors for breast ... [https://www.nature.com/articles/s41598-025-11177-6]
- 68. potential therapeutics for breast cancer - PMC [https://pmc.ncbi.nlm.nih.gov/articles/PMC12170477/]
- 69. DerivaPredict: A User-Friendly Tool for Predicting and ... [https://pmc.ncbi.nlm.nih.gov/articles/PMC12029811/]
- 70. Revitalizing natural products for sustainable drug Discovery [https://www.sciencedirect.com/science/article/abs/pii/S2352554125001809]