Activity Atlas Models in Oncology: A Guide to 3D SAR Analysis for Cancer Drug Discovery
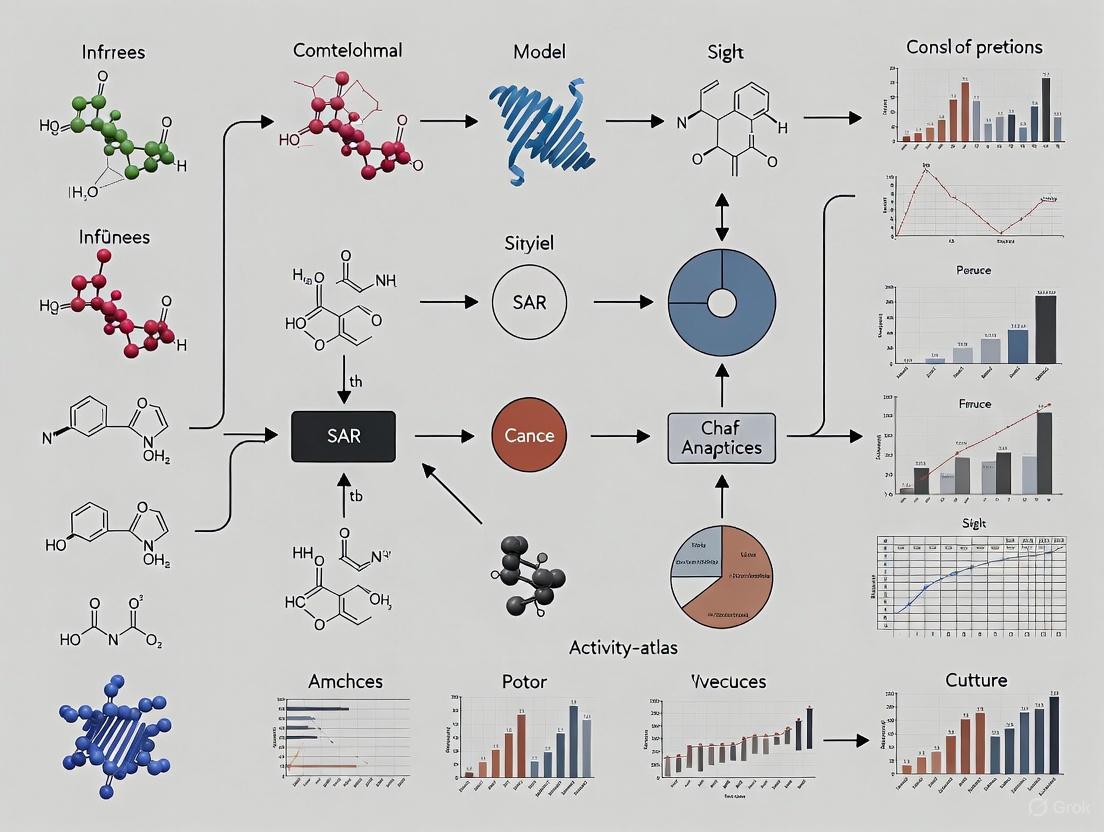
This article provides a comprehensive guide for researchers and drug development professionals on generating and applying Activity Atlas models for Structure-Activity Relationship (SAR) analysis in oncology.
Activity Atlas Models in Oncology: A Guide to 3D SAR Analysis for Cancer Drug Discovery
Abstract
This article provides a comprehensive guide for researchers and drug development professionals on generating and applying Activity Atlas models for Structure-Activity Relationship (SAR) analysis in oncology. Covering foundational principles, methodological workflows, and advanced optimization strategies, it details how these 3D pharmacophore models can decipher complex biological activity data to inform the design of novel anticancer agents. The content further explores validation techniques and comparative analyses with other computational methods, highlighting the role of Activity Atlas in accelerating the discovery of targeted therapies, including for historically challenging targets, within the modern oncology drug discovery pipeline.
Understanding Activity Atlas: Foundational Concepts for 3D SAR in Oncology
The Activity Atlas model represents a significant advancement in the field of ligand-based drug design, offering a powerful, probabilistic alternative to traditional Quantitative Structure-Activity Relationship (QSAR) methods. This approach is particularly valuable for extracting meaningful insights from complex, noisy bioassay data where conventional QSAR models often fail to establish robust linear relationships [1] [2]. At its core, Activity Atlas utilizes a Bayesian framework to analyze three-dimensional molecular alignments, enabling researchers to visualize and interpret the key steric and electronic features that correlate with biological activity [2]. This methodology has proven especially beneficial for challenging targets in oncology research, such as ion channels and dynamic protein interfaces, where structural information may be limited and ligand-based approaches become essential [1] [2].
Unlike traditional QSAR that correlates a fixed set of molecular descriptors with activity, Activity Atlas focuses on identifying and visualizing activity cliffs—regions where small structural changes result in significant activity differences [1]. By providing a global 3D view of activity trends across a compound set, it portrays which molecular features have been well-explored and highlights potential avenues for ligand optimization [2]. This capability is crucial in oncology drug discovery, where understanding subtle structure-activity relationships can accelerate the optimization of chemotherapeutic agents and targeted therapies. The model's strength lies in its ability to handle the dynamic nature of many cancer-related targets and provide qualitative insights that guide medicinal chemistry design when quantitative models prove insufficient [1] [2].
Theoretical Foundations: Connecting 3D Pharmacophores to Probabilistic SAR
The Pharmacophore Concept and 3D-QSAR
The foundation of the Activity Atlas model rests upon the well-established concept of the pharmacophore, defined by IUPAC as "the ensemble of steric and electronic features that is necessary to ensure the optimal supramolecular interactions with a specific biological target structure and to trigger (or to block) its biological response" [3]. In practical terms, a pharmacophore consists of several pharmacophoric features—including hydrogen bond donors/acceptors, hydrophobic/aromatic interactions, and charged groups—arranged in a specific three-dimensional configuration [3]. Traditional 3D-QSAR methods align molecules based on electrostatic and shape similarity and analyze these alignments to extract information about features required for activity [2]. However, these methods often struggle with complex or noisy assay data, creating the need for more robust information extraction techniques like Activity Atlas [2].
From Deterministic to Probabilistic SAR Analysis
Activity Atlas advances beyond deterministic QSAR by implementing a probabilistic framework that evaluates pairwise 3D comparisons across a dataset [2]. When similar compounds (in terms of shape and electrostatics) display different activities—creating a "3D activity cliff"—the technique qualitatively visualizes where in 3D space those differences manifest [1]. Repeated across the entire molecular alignment set, this approach generates a composite picture that summarizes favorable electrostatics and steric constraints across the chemical space explored [2]. This probabilistic interpretation is particularly valuable for understanding the behavior of compounds against complex oncology targets, where multiple binding modes or protein conformations may influence ligand potency and selectivity.
Table 1: Comparison Between Traditional 3D-QSAR and Activity Atlas Approaches
| Feature | Traditional 3D-QSAR | Activity Atlas |
|---|---|---|
| Theoretical Basis | Deterministic correlation of molecular fields with activity | Probabilistic, Bayesian analysis of molecular similarities and differences |
| Data Handling | Requires consistent, high-quality data for model building | Robust to noisy or complex assay data |
| Activity Cliffs | Often problematic for model performance | Explicitly identified and visualized |
| Output | Quantitative prediction of activity for new compounds | Qualitative visualization of key features driving activity |
| Application Scope | Best for congeneric series with clear structure-activity trends | Suitable for diverse chemotypes and complex activity patterns |
Activity Atlas Methodology: Workflow and Technical Implementation
Core Workflow for Activity Atlas Analysis
The Activity Atlas methodology follows a structured workflow that transforms raw compound and activity data into actionable insights for drug design. The process begins with compound preparation and proceeds through molecular alignment, feature analysis, and probabilistic modeling to generate the final Activity Atlas model.
Computational Protocols and Implementation
Molecular Alignment and Pharmacophore Feature Definition
The initial critical step involves generating biologically relevant conformations and aligning molecules in 3D space. For targets with known ligand-bound structures (e.g., from oncology targets like kinase inhibitors), a structure-based alignment can be performed using the protein binding site as a reference [3]. When structural data is limited, as with many ion channels important in cancer biology, ligand-based alignment using molecular field similarity or pharmacophore matching is employed [2]. Following alignment, pharmacophore features are identified for each molecule, including:
- Hydrogen bond donors and acceptors: Represented as vectors indicating directionality
- Hydrophobic regions: Represented as points in space
- Charged groups: Positive and negative ionizable features
- Aromatic rings: Representing π-π stacking capabilities [3]
These features are extracted using software tools such as RDKit or specialized packages like LigandScout, which can automatically identify pharmacophoric features from molecular structures [3].
Bayesian Analysis and Activity Cliff Detection
The core of the Activity Atlas methodology involves a Bayesian analysis of the aligned molecular features and their relationship to biological activity [1] [2]. The process involves:
- Pairwise similarity calculation: Each molecule is compared to every other molecule in the dataset based on their 3D steric and electrostatic properties
- Activity cliff identification: Pairs of molecules with high similarity but significant activity differences are flagged as activity cliffs
- Feature importance weighting: The Bayesian model assigns probabilities to different molecular regions, indicating their likely contribution to activity changes
- Composite map generation: The results are aggregated into probabilistic maps that show regions where specific molecular properties correlate with high activity
This approach is particularly powerful for identifying subtle structure-activity relationships that might be missed by traditional QSAR, especially for complex oncology targets where multiple binding modes or allosteric effects may be present [2].
Research Reagents and Computational Tools
Successful implementation of Activity Atlas modeling requires specific computational tools and resources. The table below outlines essential components of the "scientist's toolkit" for conducting Activity Atlas studies in oncology research.
Table 2: Essential Research Reagents and Computational Tools for Activity Atlas Modeling
| Tool Category | Specific Examples | Function in Activity Atlas Workflow |
|---|---|---|
| Compound Management | Chemoinformatics databases (ChEMBL, PubChem), corporate compound libraries | Sources of chemical structures and associated bioactivity data for analysis |
| Molecular Modeling | RDKit, OpenBabel, CORINA, CONCORD | Compound preparation, conformation generation, and basic pharmacophore feature detection |
| Structure-Based Alignment | PDB structures of target proteins, molecular docking software (AutoDock Vina) | Reference structures for alignment when protein structural information is available |
| Ligand-Based Alignment | Field-based alignment tools, molecular superposition algorithms | Alignment of compounds based on shape and electrostatic similarity when structural data is limited |
| Pharmacophore Modeling | LigandScout, Phase (Schrödinger), PharmaCore | Definition and visualization of pharmacophore features and their relationships |
| Activity Atlas Implementation | Cresset's Forge software with Activity Atlas module | Bayesian analysis, activity cliff detection, and generation of probabilistic activity maps |
| Visualization & Interpretation | NGLView, PyMOL, custom Python scripts | Visualization of results and communication of insights to medicinal chemistry teams |
Application in Oncology Research: Case Example and Protocol
Case Study: TRPV1 Antagonists in Cancer Pain Management
While not exclusively an oncology target, the TRPV1 ion channel provides an excellent case example relevant to cancer supportive care. A published study applied Activity Atlas analysis to 91 TRPV1 antagonists tested in two different functional assays: inhibition of capsaicin-induced activation and pH-induced activation [2]. Despite attempts, classic quantitative models failed to effectively explain the structure-activity relationships across both assays. The Activity Atlas analysis, however, revealed important steric constraints that differentially affected activity in the two assay formats [2].
Specifically, the analysis identified that steric hindrance near the piperidine moiety was more critical for pH-induced inhibition than for capsaicin-induced inhibition [2]. This suggested conformational differences in TRPV1 during various activation states that influence ligand binding—an insight that could guide the design of targeted modulators for cancer pain management with potentially reduced side effects. The method provided a global 3D view of activity trends across the compound set, showing which molecular features had been well-explored and highlighting avenues for further optimization [2].
Detailed Protocol for Activity Atlas in Oncology Target Analysis
Compound Preparation and Conformational Analysis
- Data Curation: Collect chemical structures and biological activity data (IC₅₀, Ki, or percentage inhibition values) for compounds tested against the oncology target of interest. Ensure consistent experimental conditions for compared activities.
- Structure Standardization: Standardize molecular structures using tools like RDKit or OpenBabel, including normalization of tautomers, ionization states, and stereochemistry.
- Conformation Generation: Generate biologically relevant 3D conformations using distance geometry or molecular mechanics approaches. For flexible molecules, generate multiple low-energy conformers to account for possible binding modes.
Molecular Alignment and Pharmacophore Definition
- Reference Selection: Choose an appropriate reference compound for alignment, typically a high-affinity ligand with well-characterized activity. For structure-based alignment, use a known ligand-protein complex if available.
- Field-Based Alignment: Align molecules using electrostatic and steric field similarity. Software tools like Cresset's Forge implement field-based alignment that considers molecular interaction fields rather than just atom positions.
- Pharmacophore Feature Extraction: For each aligned molecule, identify key pharmacophore features including:
- Hydrogen bond donors and acceptors
- Hydrophobic and aromatic regions
- Charged groups
- Exclusion volumes (if structure-based information is available)
Activity Atlas Model Generation
- Bayesian Probability Calculation: Implement the Bayesian analysis to calculate probabilities of feature importance across the aligned molecular set.
- Activity Cliff Detection: Identify and tag molecular pairs with high similarity but significant activity differences for focused analysis.
- Composite Map Generation: Generate the composite Activity Atlas maps showing:
- Regions where electrostatic potential correlates with high activity
- Steric constraints that enhance or diminish activity
- Molecular features that have been well-explored or under-explored in the current dataset
Model Interpretation and Hypothesis Generation
- Feature Importance Ranking: Identify the molecular features with strongest correlation to biological activity.
- Design Hypothesis Generation: Formulate specific structural modifications likely to enhance potency or selectivity.
- Virtual Compound Prioritization: Apply the insights to prioritize proposed compounds for synthesis or acquisition.
The analytical process and decision pathway for interpreting Activity Atlas results can be visualized as follows:
Integration with Modern Drug Discovery Paradigms
The Activity Atlas approach integrates effectively with contemporary computational drug discovery methods, creating powerful synergies for oncology research. Recent advances in pharmacophore-guided molecular generation demonstrate how Activity Atlas insights can directly fuel AI-driven drug design [4] [5]. Methods like PhoreGen and DiffPharm use pharmacophore constraints—potentially derived from Activity Atlas studies—to generate novel molecular structures with optimized properties [4] [5]. This creates a virtuous cycle where Activity Atlas analysis extracts insights from existing data, which then guides the generation of novel chemotypes for further evaluation.
Furthermore, the integration of Activity Atlas with structure-based approaches like PharmaCore enables a more comprehensive understanding of difficult oncology targets [6]. PharmaCore automatically generates 3D structure-based pharmacophore models from protein-ligand complexes, which can be compared with ligand-based Activity Atlas models to validate findings and identify consensus features critical for binding [6]. This combined approach is particularly valuable for targets with both structural information and substantial historical screening data, allowing researchers to leverage all available information for compound optimization.
For the efficient screening of large compound databases against Activity Atlas-derived pharmacophores, newer computational approaches like PharmacoMatch offer significant advantages [7]. This method uses neural subgraph matching to rapidly identify molecules that match 3D pharmacophore queries, enabling high-throughput virtual screening based on Activity Atlas insights [7]. Such technological advances make the Activity Atlas approach increasingly scalable and applicable to the large chemical spaces explored in modern oncology drug discovery programs.
The Activity Atlas model represents a sophisticated evolution in structure-activity relationship analysis, moving beyond traditional QSAR to provide a probabilistic, three-dimensional understanding of molecular features driving biological activity. Its implementation in oncology research offers particular promise for tackling challenging targets where structural information may be limited and ligand-based approaches are essential. By explicitly identifying and visualizing activity cliffs and providing a global view of explored chemical space, Activity Atlas guides medicinal chemists toward more informed molecular design decisions. As computational methods continue to advance, the integration of Activity Atlas with AI-driven molecular generation and high-throughput screening technologies will further enhance its impact on oncology drug discovery, potentially accelerating the development of more effective and selective cancer therapeutics.
The Role of Activity Atlas in Modern Oncology Drug Discovery
Structure-activity relationship (SAR) analysis is fundamental to oncology drug discovery, yet traditional methods often struggle with the complex data and elusive structural information associated with many cancer targets. Activity Atlas, a component of Cresset's Flare software, addresses these challenges by applying a Bayesian framework to generate qualitative 3D models from aligned ligand sets [2] [8]. This methodology transforms complex SAR data into visually intuitive maps, revealing critical electrostatic, hydrophobic, and steric features governing biological activity. This application note details the protocols for Activity Atlas model generation and demonstrates its utility through a case study on Receptor-Interacting Serine/Threonine-Protein Kinase 1 (RIPK1), a promising target for inflammatory cancers and oncogenic diseases [9]. By condensing large SAR tables into a single picture, Activity Atlas enables researchers to validate new molecule designs, identify unexplored chemical regions, and accelerate the development of novel oncology therapeutics [8].
The pursuit of effective oncology drugs is often hindered by the dynamic nature of therapeutic targets, such as ion channels and protein kinases, and a frequent lack of solved ligand-bound structures. In this landscape, ligand-based computational approaches are indispensable [2] [1]. Traditional quantitative structure-activity relationship (QSAR) models can fail to produce robust models from noisy or complex assay data, creating a need for more reliable qualitative insight-extraction tools [2].
Activity Atlas meets this need by providing a probabilistic method for analyzing the SAR of a set of aligned compounds [9]. It works by conducting pairwise 3D comparisons across a dataset to identify and analyze "activity cliffs"—instances where small structural changes result in significant activity differences [2] [8]. The results are synthesized into highly visual 3D maps that summarize the SAR landscape and inform the design and optimization of new compounds [8]. This approach is particularly valuable for oncology research, where understanding subtle ligand-target interactions can unlock new opportunities for treating complex cancers.
Activity Atlas Methodology and Workflow
Activity Atlas uses a Bayesian approach to ascertain which steric and electronic properties of ligands correlate with higher activity, providing a global qualitative view of the data [2] [9]. The core of its methodology involves comparing each pair of ligands in a 3D-aligned set to understand what changed and how it affected activity.
Key Analytical Components
Activity Atlas provides three primary types of analysis, each offering a distinct perspective on the SAR landscape [8]:
- Activity Cliff Summary: This analysis identifies the most acute regions of SAR by combining data from all pairwise molecular comparisons into a single 3D model. It highlights where in 3D space small structural changes lead to large activity differences, summarizing the most critical SAR trends for electrostatics, shape, and hydrophobics [2] [8].
- Average of Actives: This analysis synthesizes the features of all active molecules into a single representation. It distills the information to a higher level, down-weighting less important features and providing a composite picture of the characteristics common to active compounds [8].
- Regions Explored: This model assesses which spatial regions around the aligned molecules have been thoroughly explored by the chemical series, irrespective of biological activity. It helps identify unexplored areas to target with new designs and can calculate a novelty score for proposed molecules [8].
Experimental Protocol: Generating an Activity Atlas Model
The following protocol outlines the key steps for conducting an Activity Atlas analysis, from data preparation to map interpretation.
Table 1: Key Research Reagent Solutions for Activity Atlas Analysis
| Item | Function in Analysis |
|---|---|
| Cresset Flare/Forge Software | Provides the computational environment for Activity Atlas, Activity Miner, and molecular alignment [8] [9]. |
| Dataset of Aligned Ligands | A set of compounds with known biological activities (e.g., IC50, Ki) and 3D alignments is the primary input for SAR analysis [9]. |
| Protein Data Bank (PDB) Structure | A solved protein structure (e.g., PDB: 5HX6 for RIPK1) serves as a template for structure-based alignment and analysis [9]. |
| Protein Preparation Tools | Software utilities used to add hydrogen atoms, assign protonation states, and optimize the protein structure for analysis [9]. |
Step 1: Compound and Protein Preparation
- Curate Dataset: Collect a dataset of compounds with reliable biological activity data. A range of activities spanning several orders of magnitude (e.g., pIC50 4.9 to 10.3) is ideal for capturing meaningful SAR [9].
- Prepare Protein: If a protein structure is available, download it from the PDB and prepare it using standard protocols within Flare. This includes adding hydrogen atoms, assigning protonation states, and optimizing the structure [9].
- Define Ligand States: Check all small molecules for correct tautomerism and protonation states at physiological pH, adjusting them appropriately [9].
Step 2: Molecular Alignment
- Align to Template: Align the dataset of molecules to a common reference. This can be a crystallographic pose from a known inhibitor (e.g., GSK'481 for RIPK1) using the Maximum Common Substructure (MCS) method [9].
- Validate Alignment: Visually inspect all generated alignments to ensure no anomalies are present. Sub-optimal alignments can be manually adjusted to improve consistency across the dataset. For example, in the RIPK1 study, the alignment of a thiazole compound was manually adjusted by flipping its ring system to match the rest of the series [9].
Step 3: Activity Atlas Model Calculation
- Configure Settings: In Flare, select the 'Activity Atlas' experiment type. Use 'Normal' model building conditions for a standard analysis [9].
- Run Calculation: Execute the Activity Atlas calculation. The software will perform all-by-all pairwise comparisons of the 3D-aligned molecules based on their shape and electrostatic similarity, identifying activity cliffs and generating the summary maps [2] [9].
Step 4: Interpretation and Design
- Interpret Maps: Analyze the generated 3D maps overlaid on the aligned ligands.
- Shape Maps: Green areas indicate regions where bulk favors activity; magenta shows where it is detrimental [9].
- Electrostatics Maps: Red/blue areas show where positive/negative electrostatic potential increases activity [9].
- Hydrophobics Maps: Green/magenta areas show where hydrophobicity favors/disfavors activity [9].
- Generate Hypotheses: Use the maps to form design hypotheses. For example, a favorable green steric area may suggest introducing a small substituent, while an unfavorable magenta steric zone indicates a region to avoid [8] [9].
The following workflow diagram summarizes the key stages of this protocol.
Application in Oncology: A Case Study on RIPK1 Inhibitors
Receptor-Interacting Serine/Threonine-Protein Kinase 1 (RIPK1) is a key mediator of inflammation and cell death and has emerged as a promising therapeutic target for autoimmune, inflammatory, and oncogenic diseases [9]. This case study analyzes a public dataset of 46 benzoxazepinone RIPK1 inhibitors using Activity Atlas to elucidate key SAR trends and guide design.
Experimental Results and Atlas Interpretation
The dataset, with activities spanning pIC50 4.9 to 10.3, was aligned to the crystallographic structure of GSK'481 bound to RIPK1 (PDB: 5HX6). Activity Atlas was applied to generate activity cliff summaries for shape, hydrophobics, and electrostatics [9].
Table 2: Key SAR Findings from RIPK1 Activity Atlas Analysis
| Map Type | Observation | Structural Implication | Impact on pIC50 |
|---|---|---|---|
| Shape | Small favorable (green) area enclosed within larger unfavorable (magenta) area on lactam amide [9]. | Small substituents (e.g., NMe) are tolerated; larger groups (e.g., NEt, N-cPr) clash with protein. | NMe (8.8) > NH (7.49) >> NEt (5.5) [9]. |
| Hydrophobics | Unfavorable (magenta) area around the isoxazole ring of GSK'481 [9]. | Hydrophobicity in this region is detrimental; the group should point toward a hydrophilic protein region. | Correlates with reduced activity for hydrophobic variants [9]. |
| Electrostatics | Favorable negative (blue) region beneath ligands; large favorable positive/negative regions above linker [9]. | Negative potential H-bonds with Asp156 backbone NH; field complementarity with protein active site is key. | Oxazole with strong positive/negative fields shows high activity (10.3) [9]. |
Protocol for Detailed SAR Interrogation with Activity Miner
For deeper investigation into specific activity cliffs, the Activity Miner component of Flare is used.
- Step 1: Identify Key Pairs. Within Activity Miner, review the 'top pairs' table, which lists molecule pairs with the highest activity disparity [9].
- Step 2: Analyze Field Differences. For a selected pair, visualize the ligand field differences. These show where the electrostatic field in one molecule is more positive or negative than the other [9].
- Step 3: Correlate with Activity. Consistently observe that higher RIPK1 activity is associated with heterocycles exhibiting a more negative electrostatic field on one side and a more positive field on the other, in agreement with the global Activity Atlas maps and Protein Interaction Potentials (PIPs) of the RIPK1 active site [9].
The strategic integration of Activity Atlas with structure-based analysis is a powerful synergy, as shown in the following logic diagram.
Activity Atlas represents a significant advancement in SAR analysis for oncology drug discovery. Its Bayesian, qualitative approach excels where traditional QSAR fails, extracting non-intuitive insights from complex, noisy datasets typical in early-stage projects for challenging targets like ion channels and protein kinases [2] [1]. The RIPK1 case study demonstrates its power to condense extensive SAR data into clear, visual directives, revealing critical steric constraints and electrostatic requirements that directly inform molecular design [9].
The method's true power is realized when used synergistically with other computational techniques. As shown, its models can be directly validated and enriched by structure-based methods like Protein Interaction Potentials (PIPs) and Electrostatic Complementarity (EC) maps [9]. This integrated approach provides a more comprehensive understanding of ligand-binding interactions. Furthermore, by highlighting both critical SAR regions and underexplored chemical space, Activity Atlas guides researchers toward novel compound designs that maximize the potential for activity while expanding the project's understanding of the SAR landscape [8].
In conclusion, Activity Atlas is a powerful, user-friendly tool that enables medicinal chemists and researchers to visualize and understand complex SAR in a single picture. Its application in oncology drug discovery facilitates deeper understanding of ligand-target interactions, helps rationalize differential assay activities, and ultimately guides the design of more effective and selective cancer therapeutics, accelerating the journey from hit identification to lead optimization.
In modern oncology drug discovery, understanding the intricate relationship between a compound's three-dimensional molecular structure and its biological activity is paramount. Three-dimensional quantitative structure-activity relationship (3D-QSAR) analyses have emerged as powerful computational approaches that quantify this relationship by analyzing the electrostatic, hydrophobic, and shape/steric fields surrounding molecules. These field analyses form the cornerstone of Activity Atlas models, which provide predictive frameworks for understanding how specific molecular features influence potency against cancer targets. The fundamental premise is that ligands with similar biological activities will exhibit complementary three-dimensional field patterns, even when their underlying chemical scaffolds differ substantially. By mapping these patterns, researchers can identify the critical molecular determinants of activity and rationally design novel compounds with optimized therapeutic profiles.
The application of these methods in oncology is particularly valuable given the complexity of cancer targets and the urgent need to develop inhibitors with high selectivity and potency. For example, in triple-negative breast cancer (TNBC)—an aggressive subtype accounting for 10-15% of all breast cancers with limited treatment options—3D-QSAR analyses based on thieno-pyrimidine derivatives have successfully identified key structural features governing inhibitory activity against VEGFR3, a primary factor in tumor lymphatic angiogenesis [10]. The established models demonstrated exceptional statistical reliability with cross-validated correlation coefficients (q²) exceeding 0.8, highlighting the predictive power of these approaches [10].
Theoretical Foundations of Molecular Field Analysis
Electrostatic Fields
Electrostatic fields represent the three-dimensional distribution of positive and negative electrostatic potentials around a molecule. These fields are critical for understanding molecular interactions such as hydrogen bonding, ion-dipole interactions, and charge-charge complementarity with biological targets. In SAR analysis, regions of favorable positive (red) and negative (blue) electrostatics indicate where complementary charges on the target protein enhance binding affinity. For instance, in the analysis of RIPK1 inhibitors, the 'activity cliff summary of electrostatics' map revealed well-defined areas where negative electrostatics beneath the aligned ligands were associated with a carbonyl group forming a crucial hydrogen bond with the backbone NH of Asp156 in the RIPK1 active site [11].
Hydrophobic Fields
Hydrophobic fields represent the propensity of molecular regions to participate in hydrophobic interactions, which are driven by the displacement of ordered water molecules from binding interfaces. These fields are visualized as favorable hydrophobic (yellow) and unfavorable hydrophilic (white) regions that correspond to areas where hydrophobic interactions with the protein target either enhance or diminish binding affinity. In the RIPK1 inhibitor study, the activity cliff summary of hydrophobics showed distinct areas where hydrophobic substituents favored activity, while other regions demonstrated that hydrophobicity had a detrimental effect, guiding optimal substituent placement [11].
Shape/Steric Fields
Shape or steric fields define the three-dimensional volume and van der Waals surfaces of molecules, representing physical constraints and complementarity with the binding pocket. These fields identify regions where bulky substituents either enhance activity through improved van der Waals contacts or diminish activity through steric clashes. Favorable steric regions (green) indicate areas where molecular bulk increases potency, while unfavorable steric regions (magenta) highlight areas where bulk decreases activity. For example, in the SAR analysis of benzoxazepinone RIPK1 inhibitors, shape field analysis revealed that activity increased with small substituents on the lactam amide but decreased dramatically with larger substituents that clashed with the protein [11].
Table 1: Key Molecular Fields in 3D-QSAR Analysis
| Field Type | Physical Basis | Molecular Interactions Represented | Visualization Color Code |
|---|---|---|---|
| Electrostatic | Distribution of positive and negative charges | Hydrogen bonding, charge-charge, ion-dipole, dipole-dipole | Positive (red), Negative (blue) |
| Hydrophobic | Propensity for hydrophobic interactions | Hydrophobic effect, desolvation, π-π stacking | Hydrophobic (yellow), Hydrophilic (white) |
| Shape/Steric | van der Waals volume and surface | Steric complementarity, van der Waals interactions, steric hindrance | Favorable (green), Unfavorable (magenta) |
Computational Methodologies for Field Analysis
Comparative Molecular Field Analysis (CoMFA)
CoMFA is a pioneering 3D-QSAR method that calculates steric and electrostatic interaction energies between a probe atom and aligned molecules at regularly spaced grid points. The resulting data matrices are analyzed using Partial Least Squares (PLS) regression to generate predictive models and contour maps that highlight regions where specific field properties correlate with biological activity. In a study on thieno-pyrimidine derivatives as VEGFR3 inhibitors for TNBC, the established CoMFA model demonstrated exceptional predictive capability with a leave-one-out cross-validated correlation coefficient (q²) of 0.818 and a determination coefficient (r²) of 0.917 [10]. The model revealed that steric fields contributed 67.7% to the activity while electrostatic fields contributed 32.3%, providing quantitative guidance for molecular optimization [10].
Comparative Molecular Similarity Indices Analysis (CoMSIA)
CoMSIA extends beyond CoMFA by incorporating additional molecular fields including hydrophobic, hydrogen bond donor, and hydrogen bond acceptor fields. Rather than using potentially problematic Coulomb and Lennard-Jones potentials, CoMSIA employs a Gaussian function to calculate similarity indices, resulting in smoother contour maps that are less sensitive to molecular orientation. In the TNBC study, the CoMSIA model exhibited a q² of 0.801 and an r² of 0.897 with more balanced field contributions: steric (29.5%), electrostatic (29.8%), hydrophobic (29.8%), hydrogen bond donor (6.5%), and hydrogen bond acceptor (4.4%) [10].
Activity Atlas Modeling
Activity Atlas represents an advanced Bayesian approach that extracts key insights from SAR data by comprehensively analyzing activity cliffs—pairs of structurally similar compounds with significant differences in potency. This method generates highly visual 3D maps that summarize the SAR landscape by identifying regions where specific field properties correlate with enhanced activity. Activity Atlas is particularly valuable for analyzing complex SAR data sets and extracting non-intuitive design rules [2]. The approach was successfully applied to a set of TRPV1 antagonists, where it identified differential steric constraints between two assay types that suggested conformational differences in the protein binding site [2].
SAR Analysis Workflow and 3D-QSAR Components
Experimental Protocols for Activity Atlas Generation
Compound Selection and Data Preparation
The initial step involves curating a structurally diverse set of compounds with reliably measured biological activities, typically expressed as IC₅₀, Ki, or EC₅₀ values. For optimal model performance, the activity range should span at least 3-4 orders of magnitude. The dataset is divided into training and test sets using activity stratification to ensure representative distribution. In a study on maslinic acid analogs for breast cancer, researchers collected 74 compounds with known IC₅₀ values against MCF-7 cells, dividing them into a training set (47 compounds) and test set (27 compounds) [12]. All structures must be converted to 3D formats, with proper attention to tautomerism, protonation states, and stereochemistry, using tools like ChemBio3D or Forge software [12].
Molecular Alignment and Conformational Analysis
Proper molecular alignment is critical for meaningful 3D-QSAR models. The most common approaches include:
- Ligand-based alignment: Using maximum common substructure (MCS) or field-based similarity to align compounds.
- Structure-based alignment: Aligning compounds based on a common protein binding site when structural information is available.
- FieldTemplater: Using field points and shape similarity to determine bioactive conformations and generate pharmacophore hypotheses.
In the RIPK1 inhibitor study, researchers aligned 46 compounds to the crystallographic structure of GSK'481 (PDB: 5HX6) using the "very accurate but slow" conformation hunt with "Permissive" substructure alignment mode, followed by visual inspection and manual adjustment of misaligned compounds [11].
Field Calculation and Model Generation
Molecular fields are calculated using approaches such as:
- CoMFA: Calculating steric (Lennard-Jones) and electrostatic (Coulombic) potentials using a sp³ carbon probe with +1 charge.
- CoMSIA: Calculating similarity indices for steric, electrostatic, hydrophobic, hydrogen bond donor, and hydrogen bond acceptor fields using a Gaussian function.
- FieldTemplater: Generating field points using the XED (eXtended Electron Distribution) force field to represent shape, electrostatics, and hydrophobicity [12].
PLS regression is then employed to generate quantitative models correlating field descriptors with biological activity. The optimal number of components is determined through cross-validation, and model quality is assessed using q², r², standard error of estimate, and F-value.
Model Validation and Activity Atlas Generation
Rigorous validation is essential for reliable models. Key validation methods include:
- Internal validation: Leave-one-out (LOO) or leave-many-out cross-validation.
- External validation: Predicting activities of test set compounds not included in model building.
- Progressive scrambling: Assessing model robustness by randomly shuffling activities and rebuilding models [10].
Once validated, Activity Atlas models are generated using Bayesian approaches to create comprehensive 3D visualizations of SAR landscapes, including:
- Average of actives: Showing common features of highly active compounds.
- Activity cliff summary: Highlighting regions where small structural changes cause large activity differences.
- Regions explored: Identifying chemical space covered by the current dataset.
Table 2: Statistical Parameters for Validated 3D-QSAR Models in Oncology Research
| Model Type | q² Value | r² Value | Standard Error of Estimate | Field Contributions | Application |
|---|---|---|---|---|---|
| CoMFA | 0.818 | 0.917 | 8.142 | Steric: 67.7%, Electrostatic: 32.3% | TNBC VEGFR3 inhibitors [10] |
| CoMSIA | 0.801 | 0.897 | 9.057 | Steric: 29.5%, Electrostatic: 29.8%, Hydrophobic: 29.8%, HBD: 6.5%, HBA: 4.4% | TNBC VEGFR3 inhibitors [10] |
| Field-based 3D-QSAR | 0.75 | 0.92 | N/R | Shape, Hydrophobic, Electrostatic | Breast cancer MCF-7 inhibitors [12] |
Case Studies in Oncology Drug Discovery
Targeting Triple-Negative Breast Cancer (TNBC)
TNBC presents significant therapeutic challenges due to its lack of estrogen receptors, progesterone receptors, and HER2 amplification. Researchers performed 3D-QSAR analyses on a series of forty-seven thieno-pyrimidine derivatives as VEGFR3 inhibitors to combat this aggressive cancer subtype. The most active compound (42) exhibited high selectivity (>100-fold) for VEGFR3 over VEGFR1 and VEGFR2, with binding interactions involving key residues Asn934, Arg940, and Arg984 [10]. The urea NH formed hydrogen bonds with Leu851, while the urea oxygen interacted with Asn934. Hydrophobic interactions with Phe929, Ala983, and Leu1044, along with π-cation interactions with Arg940, were identified as critical for activity [10]. The generated CoMFA and CoMSIA models demonstrated exceptional predictive capability, providing valuable guidance for optimizing novel TNBC inhibitors.
RIPK1 Inhibitors for Inflammatory Diseases and Cancer
Receptor-interacting serine/threonine-protein kinase 1 (RIPK1) has emerged as a promising therapeutic target for autoimmune, inflammatory, and oncogenic diseases. Researchers analyzed a series of benzoxazepinone RIPK1 inhibitors using Activity Atlas and Activity Miner tools, revealing nuanced SAR insights [11]. The activity cliff summary of shape indicated that RIPK1 activity increased with small substituents on the lactam amide but decreased with larger substituents. Replacement of the benzoxazepinone oxygen in GSK'481 with sulfur or NH was tolerated, while substitution on the aryl benzoxazepinone ring was only allowed at the 7-position [11]. Hydrophobic analysis revealed that hydrophobic substituents in certain regions enhanced activity, while hydrophobicity around the heterocyclic ring diminished activity, correlating with the hydrophilic nature of the corresponding protein surface.
DPP-4 Inhibitors from Natural Products
Dipeptidyl peptidase-4 (DPP-4) inhibition represents an important approach for managing diabetes, obesity, and cancer. Researchers developed a field template and field-based qualitative SAR model to identify novel DPP-4 inhibitors from natural sources [13]. Using thirteen polyphenols with known DPP-4 inhibitory activities, they generated an Activity Atlas model that identified positive electrostatic field regions as key regulators of inhibitory activity [13]. This model successfully screened 501 polyphenols from the Phenol-Explorer database, identifying 153 compounds with high novelty scores. Subsequent molecular docking studies and experimental validation confirmed chrysin as a novel DPP-4 inhibitor, demonstrating the utility of field-based approaches in natural product drug discovery.
Research Reagent Solutions for SAR Analysis
Table 3: Essential Computational Tools for Field-Based SAR Analysis
| Tool/Software | Provider | Primary Function | Application in SAR Analysis |
|---|---|---|---|
| Forge | Cresset | Field-based molecular design | Activity Atlas generation, field template creation, 3D-QSAR [11] |
| FieldTemplater | Cresset | Pharmacophore hypothesis generation | Bioactive conformation determination using field points [12] |
| Activity Miner | Cresset | SAR navigation and activity cliff analysis | Identification of key molecular changes affecting potency [2] [11] |
| ChemBio3D | PerkinElmer | 3D structure generation and visualization | 2D to 3D structure conversion, preliminary molecular modeling [12] |
| GOLD | CCDC | Molecular docking | Protein-ligand interaction analysis, binding mode prediction [14] |
| FlexX | BioSolveIT | Molecular docking | Protein-ligand interaction studies for virtual screening [13] |
Electrostatic, hydrophobic, and shape field analyses represent fundamental components of modern SAR analysis in oncology drug discovery. The integration of these complementary field perspectives through CoMFA, CoMSIA, and Activity Atlas modeling provides researchers with powerful frameworks for understanding complex structure-activity relationships and rationally designing optimized therapeutic compounds. As computational methods continue to advance, we anticipate increased integration of field-based SAR analysis with structural biology, machine learning, and free energy calculations, further enhancing predictive accuracy and accelerating the discovery of novel oncology therapeutics. The case studies presented demonstrate the tangible impact of these approaches across diverse target classes and chemical series, highlighting their enduring value in the challenging landscape of cancer drug development.
Molecular Field Applications in Oncology Drug Discovery
In the field of oncology drug discovery, the systematic interpretation of Structure-Activity Relationships (SAR) is paramount for optimizing lead compounds. The "Activity Atlas" model represents a powerful, ligand-based computational approach that enables researchers to extract critical three-dimensional pharmacophoric insights from complex biological data. This methodology is particularly valuable for oncology targets where structural information may be limited, such as with various kinases, nuclear receptors, and ion channels implicated in cancer progression. By applying a Bayesian framework to analyze molecular alignments, the Activity Atlas approach qualitatively visualizes activity cliffs—regions where structurally similar compounds exhibit significant differences in biological activity—thus revealing subtle steric and electronic features that govern ligand-receptor interactions [2] [1]. This Application Note details protocols for identifying critical SAR regions through activity cliff summary and averaging of actives, specifically framed within oncology research contexts involving targets like MCF-7 breast cancer cell lines and TRPV1 ion channels.
Theoretical Framework and Key Concepts
The Activity Atlas Bayesian Foundation
The Activity Atlas methodology employs a Bayesian probabilistic framework to ascertain which steric and electronic properties of aligned ligands correlate with higher biological activity. Unlike traditional 3D-QSAR methods that often fail to deliver robust predictive models from noisy assay data, this approach utilizes pairwise 3D comparisons across a dataset to extract meaningful information [2]. Where compound pairs demonstrate similar shape and electrostatic characteristics but divergent activity (creating a 3D activity cliff), the technique visually maps these differences in three-dimensional space. Repeated across the entire molecular alignment set, this process generates a composite picture that summarizes favorable electrostatic and steric requirements across the common scaffold [1]. The output provides researchers with a global view of activity trends, highlighting which molecular regions have been sufficiently explored and which present opportunities for further optimization.
Critical SAR Components in Oncology
- Activity Cliffs: These occur when small structural modifications result in significant potency changes, revealing critical interaction points with the biological target. In oncology contexts, these cliffs highlight molecular features essential for inhibiting cancer-relevant targets [1].
- Averaging of Actives: This process creates a composite profile of high-performing compounds to identify conserved features necessary for activity, filtering out noise from individual compound idiosyncrasies [2].
- Molecular Fields: The analysis incorporates electrostatic potential and molecular shape characteristics that influence binding affinity and specificity toward oncology targets [2].
Computational Protocols and Workflows
Data Preparation and Compound Alignment
Objective: Prepare a curated dataset of oncology compounds with associated bioactivity data and generate optimal 3D alignments for Activity Atlas analysis.
Protocol Steps:
- Compound Collection: Assemble a dataset of compounds with reported activity against the oncology target of interest (e.g., 84 imidazole derivatives with anti-breast cancer activity against MCF-7 cells) [15].
- Structure Preparation: Draw 2D structures in ChemDraw Professional and convert to 3D structures using Chem3D Ultra (PerkinElmer) with energy minimization.
- Activity Data Conversion: Convert experimental activity values (IC₅₀) to pIC₅₀ using the formula: pIC₅₀ = -log₁₀(IC₅₀) [15].
- Reference-based Alignment: Select a reference compound (e.g., an FDA-approved drug like Fulvestrant for breast cancer) and align all compounds to this reference based on electrostatic and shape similarity [2] [15].
- Conformational Analysis: For flexible molecules, generate multiple conformations and select the biologically relevant conformation(s) using channel-bound conformations from X-ray data as starting points when available [2].
Activity Atlas Model Generation
Objective: Implement the Bayesian analysis to generate 3D activity maps and identify critical SAR regions.
Protocol Steps:
- Software Setup: Launch Forge V6.0 or comparable computational chemistry platform with Activity Atlas capabilities [15].
- Field Calculation: Compute molecular field properties (electrostatics, van der Waals, donor/acceptor) for all aligned compounds.
- Bayesian Analysis: Apply the Bayesian framework to ascertain which field properties correlate with higher activity across the dataset.
- Activity Cliff Detection: Identify and flag compound pairs exhibiting significant activity differences despite high 3D similarity.
- Map Generation: Create composite Activity Atlas maps showing:
- Model Validation: Validate the model using internal statistical measures (e.g., r² = 0.81, q² = 0.51 as reported in imidazole derivative studies) [15].
Activity Miner Analysis for SAR Decoding
Objective: Extract individual activity and selectivity cliffs to pinpoint critical molecular modifications.
Protocol Steps:
- Matrix Generation: Create an all-by-all similarity matrix comparing all compounds in the aligned dataset.
- Cliff Visualization: Display the matrix with cells colored green for activity-increasing changes and red for activity-decreasing changes.
- Selectivity Analysis: For compounds tested in multiple assays (e.g., capsaicin-induced vs. pH-induced TRPV1 activation), identify structural changes that differentially affect activity across assays [2].
- Key SAR Extraction: Select the most informative compound pairs showing the largest activity changes with minimal structural modifications for further analysis.
Experimental Validation in Oncology Targets
Case Study: TRPV1 Antagonists in Cancer Pain
Background: TRPV1 ion channels represent important targets for cancer pain management, with 91 documented antagonists tested in two different functional assays [2].
Experimental Implementation:
- Assay Conditions: Compounds evaluated for Ki (inhibition of capsaicin-induced activation) and IC₅₀ (pH-induced activation) [2].
- Activity Atlas Findings: Revealed a steric constraint near the piperidine moiety that differentially impacted activity in the two assay formats, suggesting TRPV1 conformational differences during various activation states [2] [1].
- Therapeutic Implications: Identification of this structural determinant enabled design of ligands with tuned activity profiles for specific cancer pain applications.
Table 1: Quantitative Validation Metrics for Activity Atlas Models in Oncology Research
| Target | Dataset Size | Model Statistics | Key Identified Features | Biological Validation |
|---|---|---|---|---|
| TRPV1 Antagonists [2] | 91 compounds | Bayesian probability maps | Steric constraint near piperidine moiety | Differential activity in capsaicin vs. pH assays |
| MCF-7 Inhibitors [15] | 84 imidazole derivatives | PLS regression: r²=0.81, q²=0.51 | Electronic features and hydrophobic pockets | Compound C10 identified as best hit |
| Kinase Targets * | 50-100 compounds | Typical q² > 0.5 | H-bond donors/acceptors at specific positions | IC₅₀ correlation with predicted values |
*Typical range based on established QSAR practice
Case Study: Imidazole Derivatives for MCF-7 Breast Cancer
Background: Imidazole derivatives represent promising scaffolds for breast cancer therapeutics, targeting MCF-7 hormone-responsive cell lines [15].
Experimental Implementation:
- Assay Conditions: Compounds evaluated for IC₅₀ against MCF-7 breast cancer cell lines.
- Activity Atlas Findings: The model identified key electronic and steric features responsible for activity, leading to the identification of compound C10 as the best-hit candidate [15].
- Multi-target Profiling: Active molecules were further analyzed against six potential oncology targets (TTK, HER2, GR, NUDT5, MTHFS, and NQO2) through molecular docking [15].
Research Reagent Solutions
Table 2: Essential Research Materials and Computational Tools for SAR Analysis
| Category | Specific Tool/Reagent | Function in SAR Analysis | Application Context |
|---|---|---|---|
| Computational Software | Forge (V6.0+) [15] | 3D-QSAR modeling and Activity Atlas generation | Small molecule oncology drug discovery |
| Flare [15] | Machine learning-based 3D-QSAR and activity atlas modeling | Exploration of dataset computational properties | |
| SNAP [16] | SAR data processing and analysis | Geospatial SAR (alternative context) | |
| Compound Databases | QSAR Toolbox [17] | Database of 155K+ chemicals with 3.3M+ data points | Chemical hazard assessment and read-across |
| Experimental Assays | TRPV1 Functional Assays [2] | Measure inhibition of capsaicin and pH-induced activation | Ion channel targeted cancer pain therapeutics |
| MCF-7 Cell Proliferation [15] | Determine anti-breast cancer activity (IC₅₀) | Oncology lead optimization | |
| Structural Templates | TRPV1 X-ray (RTX-bound) [2] | Reference structure for antagonist conformation | Ion channel drug discovery |
Advanced Interpretation and Decision Support
Activity Atlas Visualization Outputs
The Activity Atlas methodology generates three primary visualization types that guide decision-making in oncology drug discovery:
- Favorable Properties Maps: Display regions where specific molecular properties (electrostatics, sterics) enhance activity, directing synthetic efforts toward incorporating these features [2].
- Activity Cliff Summary: Highlights molecular regions where small modifications cause dramatic activity changes, indicating critical target interactions [1].
- SAR Exploration Maps: Depict which molecular regions have been sufficiently explored and which remain underexplored, guiding library design and compound acquisition [2].
Integration with Structural Biology
While Activity Atlas is primarily ligand-based, integration with available structural biology data enhances interpretation:
- Hypothesis Generation: For targets with limited structural data (e.g., many ion channels), Activity Atlas findings propose binding mode hypotheses [2].
- Conformational Selection: When multiple protein conformations exist, differential Activity Atlas findings across assay formats may suggest distinct binding modes [2] [1].
- Structure-Based Design Integration: For targets with known structures (e.g., kinases), Activity Atlas findings can be mapped to structural features to rationalize observations and guide design [15].
Concluding Remarks
The Activity Atlas approach for identifying critical SAR regions through activity cliff summary and averaging of actives provides oncology researchers with a powerful framework for extracting maximum insight from complex structure-activity data. The methodology is particularly valuable for challenging oncology targets where structural information remains limited, enabling visualization of non-intuitive molecular determinants of activity that might escape conventional 2D-QSAR analysis. By implementing the protocols described in this Application Note, research teams can systematically decode complex SAR patterns, prioritize synthetic directions, and accelerate the development of optimized oncology therapeutics. The integration of these ligand-based insights with emerging structural information on cancer targets creates a powerful synergy that advances drug discovery for these challenging diseases.
Within oncology drug discovery, the generation of robust Activity-Atlas models is pivotal for elucidating Structure-Activity Relationships (SAR). These models provide a qualitative, three-dimensional depiction of the SAR landscape, enabling researchers to identify critical regions that modulate biological activity [8]. The fidelity of these models is not a function of computational power alone but is fundamentally dependent on the quality and structure of the underlying chemical data set. Rigorous data set curation and the strategic inclusion of reference compounds are therefore non-negotiable prerequisites for deriving meaningful, actionable SAR insights that can guide the optimization of oncologic therapeutics.
Data Set Curation: Foundational Principles
Data curation is the process of preparing a well-formatted, clean, and meaningful data set for analysis. The structure and granularity of the data directly determine the kinds of insights that can be extracted [18].
Key Curation Criteria for SAR Analysis
The following criteria are essential for constructing a data set suitable for Activity-Atlas modeling in oncology.
- Data Granularity and Unique Identifiers: Each row in the data set must represent a single, unique compound. A best practice is to include a Unique Identifier (UID) for each record, which unambiguously identifies each compound and its associated data [18].
- Structural Integrity and Standardization: All molecular structures must be represented in a consistent, standardized format. This often involves generating high-quality 3D structures, ensuring correct stereochemistry, and using a consistent protonation state for relevant ionizable groups.
- Biological Activity Data: Activity data (e.g., IC₅₀, Ki) should be derived from consistent, orthogonal assays. It is critical that the data is converted to a uniform scale (e.g., pIC₅₀) and that the experimental uncertainty of the measurements is understood and documented.
- Structural Diversity and Representativeness: The data set should comprehensively explore the chemical space around the lead series. This includes not only highly active compounds but also intermediate and inactive analogs, which are crucial for defining the boundaries of the SAR [8].
Quantitative Data Curation Checklist
The table below summarizes the essential data points and checks required for curating a high-quality oncology SAR data set.
Table 1: Data Set Curation Checklist for Activity-Atlas Modeling
| Data Category | Specific Data Points & Checks | Purpose in SAR Analysis |
|---|---|---|
| Compound Identity | Compound ID (UID), Systematic Name, SMILES/InChI, Molecular Weight, Formula | Unique identification and structural tracking. |
| Structural Data | 3D Molecular Structure (SDF/MOL2), Tautomeric Form, Stereochemistry, Major Microspecies at pH 7.4 | Ensures consistent 3D alignment and field calculation in Activity-Atlas [8]. |
| Biological Activity | Assay Type (e.g., Cell Viability, Binding), Target (e.g., Kinase X), Activity Value (IC₅₀, % Inhibition), pX (e.g., pIC₅₀), Standard Error/Deviation | Provides the activity values for SAR trend analysis and model validation. |
| Data Quality Control | Purity (e.g., >95%), Solubility at assay concentration, Cytotoxicity (counter-screen data) | Flags potentially unreliable data points that could skew the SAR model. |
The Role of the Reference Compound
A reference compound serves as a fixed benchmark against which all other compounds in the data set are compared, providing a constant frame of reference for the SAR.
Functions of a Reference Compound
- SAR Landscape Orientation: In Activity-Atlas models, the reference compound anchors the "average of actives" and "activity cliff summary" views, allowing scientists to interpret electrostatic and steric changes relative to a known point [8].
- Model Validation and Transfer: A well-characterized reference compound allows for the validation of new model predictions and facilitates the transfer of SAR knowledge across different projects or chemical series within an oncology portfolio.
- Assay Performance Monitoring: Its inclusion in every experimental run acts as an internal control, verifying the consistency and performance of the biological assay over time.
Selection Criteria for an Optimal Reference Compound
The ideal reference compound is typically a lead molecule from the series with the following characteristics:
- High Potency and Selectivity: Demonstrates robust activity against the oncology target.
- Favorable Drug-like Properties: Possesses acceptable solubility, metabolic stability, and permeability profiles.
- Central Chemical Features: Embodies the core scaffold and key functional groups common to the chemical series.
- Comprehensive Profiling: Has extensive in vitro and in vivo data available, providing a rich context for comparison.
Experimental Protocol: Data Curation for Activity-Atlas Generation
This protocol details the steps for curating an oncology-focused data set preparatory to Activity-Atlas modeling in software platforms like Flare [8].
Materials and Reagents
- Chemical Data: A library of chemical structures (e.g., as SMILES strings or SDF files) for all compounds to be included.
- Biological Data: A spreadsheet containing biological activity data matched to compound identifiers.
- Software: Access to chemoinformatics software (e.g., Flare [8], KNIME, or RDKit) for structure standardization and a data visualization tool (e.g., Tableau Desktop [18]) for initial data assessment.
Step-by-Step Procedure
- Data Collation: Merge all chemical and biological data sources into a single, master spreadsheet. Ensure each compound has a unique row with its associated data [18].
- Structure Standardization: a. Standardize tautomeric and protonation states to a consistent rule set (e.g., major microspecies at physiological pH). b. Generate and energy-minimize 3D structures for all compounds. c. Validate structures to remove duplicates and correct errors.
- Activity Data Harmonization: a. Convert all activity metrics to a consistent, molar scale (e.g., nM, µM). b. Calculate negative logarithmic values (e.g., pIC₅₀ = -log₁₀(IC₅₀)). c. Flag any data points with high experimental variability or that fall outside the assay's validated dynamic range.
- 3D Alignment: a. Perform a common substructure-based or field-based alignment of all compounds onto the designated reference compound. This is a critical step for subsequent comparative analysis in Activity-Atlas [8].
- Final Data Set Assembly: a. Create a final, curated table containing, at a minimum: Compound UID, Standardized SMILES, 3D Structure File Path, pX Activity Value, and Reference Compound Flag. b. Export this table in a format compatible with your SAR visualization software.
Workflow Visualization
The following diagram illustrates the logical workflow and decision points in the data curation process.
The Scientist's Toolkit: Research Reagent Solutions
The following table details key materials and tools essential for the experimental and computational workflows described.
Table 2: Essential Research Reagents and Tools for Oncology SAR Data Curation
| Item Name | Function/Application | Specifications/Notes |
|---|---|---|
| Reference Compound | Serves as the internal benchmark for biological activity and structural alignment. | High-purity (>95%) solid or DMSO stock solution. Characterized by NMR and LC-MS. Stored at -20°C. |
| Flare Software | Platform for performing 3D molecular alignment, Activity-Atlas generation, and activity cliff analysis [8]. | Used to create "Activity Cliff Summary" and "Average of Actives" models for qualitative SAR insight. |
| BRICS Fragmentation Kit | Algorithm for decomposing molecules into chemically meaningful, retrosynthetically feasible substructures [19]. | Supports fragmentation for SAR analysis and interpretation of graph neural network models. |
| Curated Oncology Assay Data | Validated biological screening data for the target of interest (e.g., kinase inhibition, cell proliferation). | Data includes IC₅₀, standard deviation, and n of replicates. Sourced from consistent, orthogonal assays. |
| Tableau Desktop | Data visualization tool for assessing the distribution, aggregation, and granularity of the curated data set [18]. | Used for initial QC to identify outliers and trends in the raw biological and chemical data before SAR modeling. |
Building and Applying Activity Atlas Models: A Step-by-Step Methodology
In modern oncology drug discovery, the ability to visualize and understand the Structure-Activity Relationship (SAR) landscape is crucial for designing effective therapeutic compounds. Activity-Atlas modeling represents a transformative approach that provides qualitative SAR insights through novel computational methods, working from 3D-aligned molecular structures to compare ligand pairs and understand how structural changes affect biological activity [8]. This methodology generates a 3D qualitative model of the SAR landscape that enables researchers to focus on critical SAR signals and identify unexplored regions to solve key problems in drug development projects [8]. Within oncology research, where molecular targets are often complex and multifaceted, these models have become indispensable tools for accelerating the development of targeted therapies.
The value of Activity-Atlas models lies in their multiple readouts that inform and guide project progression. These include the 'Activity Cliff Summary' which reveals what activity cliffs indicate about SAR, the 'Average of Actives' analysis that identifies common features among active molecules, and the 'Regions Explored' analysis that maps chemical space coverage [8]. For oncology researchers facing the challenges of drug resistance and the need for selective targeted therapies, these insights provide a strategic advantage in compound optimization. The integration of these computational approaches with experimental validation has become a cornerstone of efficient oncology drug discovery programs, particularly as artificial intelligence continues to revolutionize the landscape of oncological research and personalized clinical interventions [20].
Theoretical Foundations of Conformation Hunting and Molecular Alignment
Conformational Analysis Principles
Conformation hunting represents the critical first step in building reliable Activity-Atlas models, as it seeks to identify the bioactive conformation of molecules under investigation. This process involves exploring the rotational bonds and spatial arrangements of a molecule to determine its three-dimensional low-energy states that are most likely to interact with biological targets. In the context of oncology drug discovery, where molecular interactions often determine therapeutic efficacy and selectivity, accurate conformational analysis is paramount. When structural information for a target-bound state is unavailable, researchers employ molecular field-based similarity methods for conformational searching to design a pharmacophore template that resembles the bioactive conformation [12].
The FieldTemplater module, implemented in software such as Forge, uses field and shape information from known active compounds to determine a hypothesis for the 3D conformation [12]. This approach generates field points using the XED (eXtended Electron Distribution) force field, which calculates four different molecular fields: positive electrostatic, negative electrostatic, shape (van der Waals), and hydrophobic (a density function correlated with steric bulk and hydrophobicity) [12]. The resulting field point pattern provides a condensed representation of the compound's shape, electrostatics, and hydrophobicity, forming the foundation for subsequent molecular alignment and model generation. This rigorous approach to conformational analysis ensures that the resulting SAR models accurately reflect the true binding interactions relevant to oncology targets.
Molecular Alignment Techniques
Molecular alignment establishes a common frame of reference for comparing the steric and electronic features of compounds within a dataset. Proper alignment is essential for generating meaningful 3D-QSAR models, as misaligned molecules can lead to incorrect SAR interpretations and flawed predictive models. The pharmacophore template obtained from conformational analysis is directly transferred into molecular modeling software, where compounds are aligned with the identified template [12].
In practice, molecular alignment can be achieved through several approaches. Ligand-based alignment relies on the field points and molecular structures of the ligands themselves, using algorithms that maximize similarity in spatial and electronic properties [21]. For the alignment process, software such as FLARE utilizes distance-dependent dielectric (DDD) calculations with aligned field points on ligands rather than random field points [21]. The alignment of field points is crucial for calculating similarity scores and generating accurate 3D-QSAR field-based models. The overlays with the best matching low-energy conformations to the template are selected for building the 3D-QSAR model, ensuring that the molecular alignment reflects biologically relevant orientations [12].
Table 1: Key Molecular Fields Used in Conformation Hunting and Alignment
| Field Type | Physical Property Represented | Role in Molecular Interaction |
|---|---|---|
| Positive Electrostatic | Areas of electron deficiency | Attracts electron-rich groups on protein targets |
| Negative Electrostatic | Areas of electron density | Attracts electron-deficient groups on protein targets |
| Shape (van der Waals) | Molecular volume and steric bulk | Determines steric complementarity with binding site |
| Hydrophobic | Non-polar surface areas | Drives hydrophobic interactions and desolvation |
Computational Methodologies for 3D-QSAR Model Generation
Data Preparation and Conformation Hunting
The foundation of any robust Activity-Atlas model begins with careful data collection and preparation. Researchers typically gather a training dataset of compounds with known biological activities from prior literature or experimental results. The two-dimensional (2D) chemical structures are transformed into three-dimensional (3D) structures using converter modules in software such as ChemBio3D Ultra [12]. For oncology-focused studies, such as those involving breast cancer cell line MCF-7, the experimental activity (often IC50 values) of dataset compounds are converted to their positive-logarithmic scale using the formula: pIC50 = -log(IC50), which is defined as the dependent variable in the QSAR model [12].
The conformation hunting process employs the XED force field with a gradient cut-off value typically set at 0.1 for energy minimization of all generated conformers [12]. The FieldTemplater approach uses a subset of representative compounds (for example, M-159, M-254, M-286, M-543, and M-659 in the maslinic acid study) to determine a hypothesis for the 3D conformation [12]. The resulting field point pattern provides a condensed representation essential for capturing the key molecular features responsible for biological activity. This step is particularly crucial in oncology research, where small structural changes can significantly impact anticancer activity and selectivity.
Statistical Modeling and Validation
With properly aligned molecules, the next step involves generating the 3D-QSAR model using field point-based descriptors that calculate molecular properties at the intersection points of a 3D grid encompassing the entire volume of the aligned training set compounds [12]. The Partial Least Squares (PLS) regression method is commonly employed through field QSAR modules, specifically utilizing the SIMPLS algorithm during QSAR modeling [12]. Model parameters typically include setting the maximum number of components to 20, the sample point maximum distance to 1.0 Å, and Y scrambles to 50, while using both electrostatic and volume fields for comprehensive analysis [12].
Validation is a critical step in ensuring model reliability. The initial training set of compounds is typically partitioned into a training set (approximately 76% of compounds) and a test set (approximately 24% of compounds) using an activity-stratified method to maintain representative distribution of activity values [21]. The derived QSAR model is assessed using the leave-one-out (LOO) cross-validation technique, where training is performed with a dataset of (N-1) compounds and tested on the remaining one, repeating this process N times until each data point has been through the testing process [12]. A robust model should demonstrate acceptable statistical values, such as a regression coefficient (r²) > 0.6 and a cross-validated correlation coefficient (q²) > 0.5 [21], with higher values indicating better predictive power, such as the r² of 0.92 and q² of 0.75 achieved in the maslinic acid study [12].
Table 2: Statistical Parameters for 3D-QSAR Model Validation
| Parameter | Symbol | Acceptable Value | Excellent Value | Interpretation |
|---|---|---|---|---|
| Regression Coefficient | r² | > 0.6 | > 0.8 | Goodness of fit for the training set |
| Cross-validated Correlation Coefficient | q² | > 0.5 | > 0.7 | Internal predictive ability of the model |
| Root Mean Square Error | RMSE | Lower is better | Dependent on activity range | Average magnitude of prediction errors |
| Similarity Score | Sim | Higher is better | Dependent on alignment quality | Measure of conformer similarity to pivot |
Activity-Atlas Model Implementation and Interpretation
The Activity Cliff Summary represents one of the most insightful components of the Activity-Atlas methodology, highlighting the most acute regions of SAR within a dataset. Activity cliffs occur when small structural changes between similar compounds result in significant differences in biological activity [8]. In oncology drug discovery, identifying these regions is particularly valuable for understanding which molecular modifications dramatically impact anticancer efficacy. Activity Atlas combines the activity cliffs from all pairwise comparisons of molecules in a dataset into a 3D model that highlights and summarizes the SAR [8].
The visualization of SAR for both small and large datasets in a single picture enables medicinal chemists to make informed decisions about molecular design. The activity cliff summary helps identify hidden SAR trends using electrostatics, which might not be apparent through traditional 2D analysis methods [8]. Furthermore, this analysis allows researchers to validate new molecule designs against existing SAR, ensuring that proposed compounds leverage known activity cliffs to maximize therapeutic potential. In the context of oncology, where compound optimization cycles are time-sensitive and costly, these insights dramatically accelerate the lead optimization process.
Average of Actives Analysis
The 'Average of Actives' analysis provides a powerful approach to understanding the common features shared by biologically active molecules. This method brings all the features of active molecules into a single representation, creating a higher-level distillation of the information while down-weighting features that are less important to activity [8]. Where a single active molecule displays a very detailed electrostatic pattern, the average of actives provides a composite profile that emphasizes conserved features across multiple active compounds.
The primary application of the average of actives analysis is in the design of new molecules to ensure that critical SAR information is incorporated and that each new molecule possesses as many of the important features as possible [8]. For oncology researchers, this approach is invaluable when working with complex natural products or multi-target therapeutics, where identifying the essential pharmacophoric elements can be challenging. By focusing design efforts on incorporating features common to active compounds, researchers can increase the likelihood of maintaining or improving anticancer activity while exploring novel chemical space.
Regions Explored Analysis
The 'Regions Explored' analysis completes the Activity-Atlas triad by providing an assessment of what regions of the aligned molecules have been thoroughly investigated, essentially mapping where a research project has already explored [8]. Unlike the other Activity-Atlas models, this analysis disregards biological activity completely, focusing solely on the chemical space coverage of the existing compound collection [8]. This perspective is crucial for identifying unexplored territories that might harbor novel bioactive compounds.
The regions explored analysis has predictive applications in oncology drug discovery. Researchers can map proposed molecules against the model to determine whether new compounds venture into novel regions or revisit previously explored chemical space [8]. This capability is particularly valuable for prioritizing synthetic targets and allocating research resources efficiently. Additionally, the analysis calculates a novelty score for each molecule, providing a quantitative measure of how much a new compound expands the existing SAR understanding [8]. In fast-moving areas of oncology research, such as the development of KRAS inhibitors or selective kinase modulators, this guidance helps teams focus on truly innovative chemical matter rather than revisiting established SAR territories.
Advanced Integration with AI and Machine Learning
The field of Activity-Atlas modeling and SAR analysis is being transformed through integration with artificial intelligence (AI) and machine learning (ML) approaches. Modern drug discovery increasingly employs generative models (GMs) that can design molecules with specific properties, addressing challenges such as target engagement, synthetic accessibility, and generalization beyond training data [22]. These AI approaches are particularly relevant in oncology, where the ability to rapidly explore novel chemical spaces for challenging targets like KRAS or selectively target specific cancer pathways is paramount.
Innovative workflows now combine variational autoencoders (VAEs) with nested active learning (AL) cycles that iteratively refine molecular generation using chemoinformatics and molecular modeling predictors [22]. In this paradigm, the VAE is initially trained on a general training set to learn how to generate viable chemical molecules, then fine-tuned on a target-specific training set to enhance target engagement [22]. The nested AL cycles include inner cycles that evaluate generated molecules for druggability, synthetic accessibility, and similarity thresholds, and outer cycles that perform docking simulations as an affinity oracle [22]. This sophisticated integration of generative AI with physics-based modeling represents the cutting edge of SAR analysis in oncology drug discovery.
The application of these AI-enhanced methods has demonstrated remarkable success in real-world scenarios. For molecular targets like CDK2 and KRAS, such workflows have successfully generated diverse, drug-like molecules with high predicted affinity and synthesis accessibility, including novel scaffolds distinct from those known for each target [22]. In the case of CDK2, the approach yielded 9 synthesized molecules with 8 showing in vitro activity, including one with nanomolar potency [22]. These results highlight the powerful synergy between traditional Activity-Atlas approaches and modern AI methodologies for addressing the complex challenges of oncology drug discovery.
Experimental Protocols and Workflow Integration
Step-by-Step Protocol for Activity-Atlas Model Generation
Data Collection and Curation: Collect 2D chemical structures and biological activity data (e.g., IC50 values) from literature or experimental results. Convert 2D structures to 3D using software such as ChemBio3D Ultra and minimize structures using appropriate force fields [12].
Conformational Analysis and Template Generation: Select a representative subset of active compounds for field template generation. Use the FieldTemplater module (or equivalent) with the XED force field to generate a pharmacophore hypothesis based on molecular fields and shape similarity [12].
Molecular Alignment: Align all compounds in the dataset to the generated pharmacophore template using field point similarity. Ensure optimal alignment by selecting conformations that maximize similarity to the template while maintaining reasonable energetics [12].
3D-QSAR Model Development: Set up the QSAR calculation using field point-based descriptors with a 3D grid that encompasses the aligned molecules. Use PLS regression with appropriate parameters (e.g., maximum components: 20, sample point maximum distance: 1.0 Å) to generate the initial model [12].
Model Validation: Partition the dataset into training and test sets (typically 76:24 ratio) using activity stratification. Perform leave-one-out cross-validation to determine q² value and validate against the test set to assess external predictive ability [12] [21].
Activity-Atlas Generation: Generate the three Activity-Atlas models (Activity Cliff Summary, Average of Actives, and Regions Explored) using validated software implementations. Interpret the results in the context of the specific oncology target and research objectives [8].
Virtual Screening and Compound Design: Apply the validated model to screen virtual compound libraries or design novel compounds that incorporate favorable molecular features while exploring new chemical space [12].
Research Reagent Solutions
Table 3: Essential Computational Tools for Activity-Atlas Modeling
| Software/Tool | Application in Workflow | Key Features |
|---|---|---|
| ChemBio3D Ultra | 3D structure generation and minimization | Converts 2D structures to 3D; performs energy minimization |
| Forge/FieldTemplater | Conformation hunting and pharmacophore generation | Uses XED force field; generates field points for molecular similarity |
| FLARE V5 | 3D-QSAR model generation and Activity-Atlas implementation | Implements field-based QSAR; generates Activity-Atlas models |
| PLS Regression | Statistical modeling | SIMPLS algorithm for QSAR model development |
| Docking Software (Various) | Binding mode prediction and validation | Assesses binding interactions; validates QSAR predictions |
Workflow Visualization
Activity-Atlas Model Generation Workflow
Activity-Atlas Model Components and Applications
Data Set Preparation and Selection of a Bioactive Reference Conformation
Within oncology drug discovery, the generation of robust activity-atlas models is pivotal for elucidating the complex Structure-Activity Relationships (SAR) that govern compound efficacy and selectivity. Such models are indispensable for the rational design of novel therapeutics, enabling the optimization of lead compounds against cancer-relevant targets. The foundational steps of this process—data set preparation and the selection of a bioactive reference conformation—critically determine the predictive power and reliability of subsequent SAR analyses. This protocol details a standardized framework for these initial stages, contextualized within the development of inhibitors for oncology targets such as RIPK1 and dipeptidyl peptidase-4 (DPP-4) [11] [13]. By establishing a rigorous workflow for curating structural and activity data and for defining the bioactive conformation, this guide aims to enhance the quality of 3D quantitative SAR (3D-QSAR) and activity-atlas models, thereby accelerating the identification of promising anticancer agents.
Data Set Curation and Preparation
A high-quality, well-curated data set is the cornerstone of any meaningful SAR analysis. The process involves the systematic collection, standardization, and alignment of chemical structures and their associated biological activities.
Data Collection and Standardization
The initial step involves gathering a suite of compounds with known biological activities against the target of interest, typically expressed as IC₅₀ or Ki values. For instance, in a study on DPP-4 inhibitors, a data set of 13 polyphenols with IC₅₀ values spanning from nanomolar to micromolar ranges was assembled from the literature [13]. Similarly, a data set of 46 benzoxazepinone compounds with activity (pIC₅₀) ranging from 4.9 to 10.3 was used to investigate RIPK1 inhibitors [11].
Key activities during this phase include:
- Activity Conversion: Convert concentration-based activity values (e.g., IC₅₀) to a negative logarithmic scale (pIC₅₀) to linearize the relationship for modeling [11] [12].
- Structure Preparation: Generate three-dimensional (3D) structures from two-dimensional (2D) inputs using tools like ChemBio3D [12]. Crucially, check and adjust the protonation states and tautomeric forms of all molecules to reflect physiological conditions [11].
- Data Set Division: Partition the data set into training and test sets using an activity-stratified method to ensure a representative distribution of activity ranges across both sets for model development and validation [12].
Table 1: Example Data Set Composition for SAR Analysis
| Target | Total Compounds | Activity Range | Training Set | Test Set | Source |
|---|---|---|---|---|---|
| RIPK1 Inhibitors | 46 | pIC₅₀ 4.9 - 10.3 | Not Specified | Not Specified | BindingDB, Literature [11] |
| DPP-4 Inhibitors | 13 | IC₅₀ 0.0006 - 2.5 µM | Not Specified | Not Specified | Literature [13] |
| Maslinic Acid Analogs (MCF-7) | 74 | IC₅₀ Not Shown | 47 | 27 | Literature [12] |
Molecular Alignment
To extract meaningful 3D-SAR, all molecules must be aligned to a common frame of reference. The most reliable approach involves aligning the data set to a ligand extracted from a protein-ligand crystal structure (e.g., PDB: 5HX6 for RIPK1) [11]. When a crystal structure is unavailable, a field-based pharmacophore template can be generated from highly active and diverse compounds to guide alignment [12].
Protocol: Structure-Based Alignment
- Obtain Crystal Structure: Download the relevant protein-ligand complex from the Protein Data Bank (PDB).
- Prepare the Protein-Ligand Complex: Use molecular modeling software (e.g., Flare) to prepare the structure, adding hydrogen atoms and correcting any structural issues.
- Align by Maximum Common Substructure (MCS): Align all data set molecules to the co-crystallized ligand using an MCS algorithm. Employ a 'very accurate but slow' conformation hunt and a 'Permissive' substructure alignment mode to allow for ring rotations [11].
- Manual Refinement: Visually inspect the alignments and manually adjust any sub-optimal conformations or orientations to ensure consistency with the overall data set alignment and to avoid steric clashes with the protein [11].
Selection of a Bioactive Reference Conformation
The "bioactive conformation" is the 3D structure a molecule adopts when bound to its biological target. Accurately defining this conformation is critical for the success of activity-atlas modeling.
Defining the Bioactive Conformation
Two primary methods are employed to define the bioactive conformation, with the choice dependent on data availability.
1. Direct Use of Crystallographic Data:
- When available, the conformation of a ligand bound within a protein's active site (e.g., from a PDB structure) provides an unambiguous and experimentally determined bioactive conformation for alignment and modeling [11].
2. Generation via a Field-Based Pharmacophore Model:
- In the absence of structural data, a field-based pharmacophore can be generated to represent the essential molecular interactions. This method uses the shape, electrostatics, and hydrophobicity of known active compounds to infer the bioactive conformation [12].
- Protocol: Field Template Generation
- Select Template Compounds: Choose a set of diverse, highly active compounds from the data set (e.g., 4-5 compounds) [13] [12].
- Generate Bioactive Conformers: Use software like FieldTemplater (in Forge) or the Bioactive Conformational Ensemble (BCE) platform. The BCE employs a multilevel strategy combining conformational sampling with high-level ab-initio calculations to predict stable bioactive conformers [23].
- Create Field Template: The software calculates molecular fields (positive/negative electrostatic, shape, hydrophobic) and generates a consensus 3D field point pattern that represents the shared pharmacophore [13] [12].
- Align Data Set: Align all molecules in the data set to this generated field template to establish a common orientation for analysis [12].
Diagram 1: Workflow for selecting a bioactive reference conformation, prioritizing experimental data when available.
Workflow for SAR Model Generation
Once the data set is prepared and aligned, the subsequent steps involve building and validating the computational models that will form the activity-atlas.
Diagram 2: The core workflow for generating an activity-atlas and 3D-QSAR model from an aligned data set.
Table 2: Key Research Reagent Solutions for SAR Analysis
| Item / Resource | Function / Description | Example Use in Protocol |
|---|---|---|
| Crystallographic Database | Repository of 3D protein-ligand structures. | Source of bioactive conformation (e.g., PDB ID 5HX6 for RIPK1) [11]. |
| Bioactive Conformational Ensemble (BCE) | A platform for predicting bioactive conformers using multilevel computational strategies [23]. | Generating conformers when experimental structures are unavailable. |
| Flare / Forge Software (Cresset) | Software suites for SAR analysis, including Activity Atlas, Activity Miner, and FieldTemplater modules [11] [12]. | Aligning molecules, generating field templates, building 3D-QSAR models, and creating activity-atlas maps. |
| PEPCONF Database | A diverse benchmark data set of peptide conformational energies for method development and testing [24]. | Benchmarking computational methods used in conformational analysis. |
| BindingDB | A public database of measured binding affinities for drug targets [11]. | Sourcing quantitative activity data (e.g., pIC₅₀) for data set curation. |
| Phenol-Explorer | A database dedicated to polyphenols in food [13]. | Sourcing natural product structures for virtual screening. |
| Amber ff14SB Force Field | A molecular mechanics model for simulating biomolecules [24]. | Energy minimization and conformational search during structure preparation. |
Experimental Protocol: SAR Analysis of RIPK1 Inhibitors
The following is a detailed methodology for conducting an SAR analysis, as applied to a series of RIPK1 inhibitors [11].
Objective: To understand the electrostatic, hydrophobic, and shape requirements for RIPK1 inhibition using Activity Atlas models.
Materials & Software:
- Data Set: 46 compounds with known RIPK1 pIC₅₀ values [11].
- Software: Flare (Cresset Group).
- Reference Structure: PDB ID 5HX6 (RIPK1 in complex with GSK'481).
Procedure:
- Data Preparation:
- Download the RIPK1 data set from BindingDB and literature.
- Prepare the 3D structures of all compounds, checking and adjusting for correct tautomerism and protonation states.
- Prepare the protein-ligand complex from 5HX6 within Flare.
- Molecular Alignment:
- Align all 46 compounds to the crystallographic pose of GSK'481 from 5HX6 using the Maximum Common Substructure (MCS) method with 'Permissive' mode.
- Manually inspect the alignment. For example, flip/rotate the thiazole and benzyl rings of compound 1 to align its benzyl ring consistently with the rest of the data set.
- Activity Atlas Model Generation:
- Within Flare, use the Activity Atlas module with 'Normal' model building conditions.
- Generate the following activity cliff summary maps:
- Shape Map: Identifies regions where molecular bulk increases or decreases activity.
- Hydrophobics Map: Identifies regions where hydrophobic character is favorable or unfavorable for activity.
- Electrostatics Map: Identifies regions where positive or negative electrostatic character is crucial for activity.
- Data Interpretation:
- Interpret Shape Map: Note that a small green area around the lactam amide indicates that small substituents (e.g., N-Me) increase activity, while larger magenta areas show that bulkier groups (e.g., N-Et, N-cPr) cause steric clashes and decrease activity [11].
- Interpret Hydrophobics Map: Correlate unfavorable hydrophobic areas (magenta) around the heterocyclic ring with the hydrophilic nature (blue) of the corresponding protein surface in RIPK1.
- Interpret Electrostatics Map: Relate favorable negative electrostatic (blue) areas to key hydrogen-bonding interactions, such as the one between the amide carbonyl and the backbone NH of Asp156 [11].
- Model Validation (Using Activity Miner):
- Use the Activity Miner component to drill down into the Activity Atlas maps.
- Analyze the 'top pairs' table to identify molecular pairs with the largest activity disparities.
- Examine the ligand field differences for these pairs to confirm that higher RIPK1 activity is consistently associated with specific electrostatic patterns that complement the protein's interaction potentials (PIPs).
Expected Outcomes: The analysis will yield highly visual 3D maps that summarize the SAR landscape. These maps provide a design guide, indicating where specific chemical modifications are likely to enhance or diminish inhibitory activity against RIPK1, a promising target in inflammatory diseases and oncology [11].
Molecular alignment, the process of superimposing three-dimensional structures of chemical compounds, is a foundational technique in modern computer-aided drug discovery. It enables critical applications in oncology research, including pharmacophore modeling, 3D quantitative structure-activity relationship (QSAR) studies, and similarity-based docking to predict protein-bound ligand conformations [25] [26]. By aligning molecules based on their maximum common substructure or 3D shape and electrostatic properties, researchers can decipher crucial structure-activity relationships to guide the optimization of anticancer agents.
The core challenge lies in accurately predicting the bioactive conformation of a target molecule, which is determined not only by low-energy ligand conformations but also by protein conformational accessibility [26]. This review details two complementary computational strategies—maximum common substructure and 3D property-based alignment—providing application notes and standardized protocols to support activity-atlas model generation for SAR analysis in oncology.
Strategic Approaches to Molecular Alignment
Maximum Common Substructure (MCS) Based Alignment
MCS-based algorithms identify the largest set of atoms shared between two molecular graphs that preserve connectivity, providing an intuitive approach for aligning structurally similar compounds. The fkcombu flexible alignment program utilizes atomic correspondences obtained from 2D chemical structure MCS searches performed by the kcombu program [25]. This method is particularly effective for similarity-based docking, where a protein-bound reference molecule is used to predict the bound conformation of a target molecule.
Table 1: Performance Metrics of MCS-Based Alignment (fkcombu)
| Target-Reference Similarity | Average Prediction RMSD (Å) | Key Alignment Determinant |
|---|---|---|
| >70% similarity | <2.0 Å | TD-MCS with simple element-based atomic classification |
| 50-70% similarity | 2.0-3.0 Å (estimated) | Atomic correspondence quality |
| <50% similarity | >3.0 Å (estimated) | Limited common substructure |
Key performance insights include:
- Topologically constrained disconnected MCS (TD-MCS) with simple element-based atomic classification delivers optimal prediction accuracy [25].
- Incorporation of crashing potential energy with the receptor protein further enhances performance in binding pose prediction [25].
- MCS-based flexible alignment consistently outperforms rigid-body alignment programs like ShaEP, especially when target and reference molecules share sufficient chemical similarity [25].
3D Property-Based Flexible Alignment
Property-based methods align molecules using physicochemical and shape properties rather than relying solely on atomic correspondence. BCL::MolAlign implements a sophisticated three-tiered Monte Carlo Metropolis (MCM) sampling protocol that combines pregenerated conformers with on-the-fly bond rotation to navigate the complex conformational space [26]. The algorithm employs a weighted linear combination of chemical properties in its scoring function, summing property-distance between nearest-neighbor atoms, which allows atoms without correspondence partners to be excluded from scoring [26].
Table 2: Comparison of Molecular Alignment Software Tools
| Software | Algorithm | Flexibility Handling | Key Advantage | Reported Performance |
|---|---|---|---|---|
| fkcombu | MCS-based | Predefined conformers | Optimal for similar compounds (>70% similarity) | Better than rigid-body alignment for similar compounds [25] |
| BCL::MolAlign | Property-based MCM | Conformer library + bond rotation | Recovers more native binding poses than MCS-based alignment [26] | Outperforms MOE, ROCS, FLEXS across diverse ligand sets [26] |
| MCPhd | Descriptor-based | Graph reduction | Incorporates electrostatic and steric properties | Improves similarity quantification vs. SMSD, OBabel_FP2 [27] |
The MCPhd (Maximum Common Property) method represents a hybrid approach, using the electrotopographic state index for atoms to quantify similarity based on both structural and electrostatic properties [27]. This method applies graph reduction to identify descriptor centers, rings, clusters, and terminal groups, assigning each the summed electrotopographic value of its constituent atoms [27].
Application Notes for Oncology Research
Aligning Diverse Chemotypes in Scaffold Hopping
Scaffold hopping—identifying structurally different compounds with similar biological activity—is crucial in oncology drug discovery to overcome patent limitations and improve drug properties [28]. Traditional MCS approaches struggle with this task, while modern AI-driven molecular representations using graph neural networks and transformers enable alignment of structurally diverse compounds with conserved anticancer activity [28].
For natural product-derived anticancer agents, which often present challenges like chemical instability, toxicity, or complex chiral centers, property-based alignment facilitates the identification of common interaction features despite structural differences [29]. This approach has proven valuable in optimizing compounds such as tubulin polymerization inhibitors and kinase-targeted agents inspired by natural product scaffolds [29].
Enhancing SAR Analysis through Activity-Atlas Modeling
Molecular alignment enables the construction of activity-atlas models that visualize 3D pharmacophores and activity cliffs across compound series. In benzimidazole derivatives for oncology applications, alignment based on common heterocyclic cores reveals how substitutions modulate anticancer activity through DNA interaction, enzyme inhibition, and cellular pathway modulation [30] [31].
For kinase targets critical in cancer signaling pathways, alignment of ATP-mimetic inhibitors establishes correlations between steric/electrostatic features and inhibitory potency [29]. The BCL::MolAlign scoring function, which emphasizes chemical complementarity over exact atomic overlap, is particularly suited for this application [26].
Experimental Protocols
Protocol 1: MCS-Based Flexible Alignment with fkcombu
Purpose: Predict protein-bound conformation of a target molecule using a reference ligand from a crystallized complex.
Workflow:
- Input Preparation:
- Obtain 3D structures of reference (protein-bound) and target molecules.
- Ensure proper protonation states for physiological conditions.
MCS Identification:
- Execute kcombu to compute maximum common substructure.
- Apply topologically constrained disconnected MCS (TD-MCS) with element-based atomic classification [25].
- Establish atomic correspondences between reference and target.
Flexible Alignment:
- Run fkcombu using atomic correspondences as constraints.
- Incorporate crashing potential energy with receptor protein if structure is available [25].
- Generate multiple alignment poses ranked by similarity score.
Validation:
- Compare predicted vs. experimental pose using RMSD when possible.
- For targets >70% similar to reference, expect RMSD <2.0 Å [25].
MCS-Based Alignment Workflow
Protocol 2: Property-Based Alignment with BCL::MolAlign
Purpose: Align structurally diverse compounds with conserved biological activity for scaffold hopping in anticancer agent development.
Workflow:
- Conformer Generation:
- Use BCL::Conf to generate ensemble of conformers (default: 100 unique conformations per molecule) [26].
- Apply CSD-derived rotamer library with clash scoring to ensure physically realistic conformations.
Monte Carlo Metropolis Sampling:
- Execute multiple independent trajectories (default: 1 per alignment).
- Implement three-tiered optimization:
- Tier 1: Screen conformer pairs, removing lowest-scoring 25%.
- Tier 2: Iteratively refine best alignments, removing low-scoring fraction each cycle.
- Tier 3: Final optimization of top N pairs from tier 2 [26].
Move Sampling:
- Apply combination of moves including BondAlign, BondRotate, ConformerSwap, and RotateSmall [26].
- Accept/reject moves based on Metropolis criterion with adaptive temperature control.
Scoring & Selection:
- Calculate scores using weighted property-distance between nearest-neighbor atoms.
- Select top poses for activity-atlas modeling and SAR analysis.
Three-Tiered Monte Carlo Alignment
The Scientist's Toolkit
Table 3: Essential Research Reagent Solutions for Molecular Alignment Studies
| Tool/Category | Specific Examples | Function in Molecular Alignment |
|---|---|---|
| Alignment Software | fkcombu, BCL::MolAlign, ROCS, MOE | Core algorithms for flexible molecular superposition and pose prediction |
| Conformer Generators | BCL::Conf, OMEGA, CONFGEN | Generate physically realistic 3D conformer libraries for flexibility handling |
| MCS Search Tools | kcombu, SMSD Toolkit, ChemAxon | Identify maximum common substructures for atomic correspondence |
| Descriptor Calculators | electrotopographic state index, ECFP, alvaDesc | Compute physicochemical properties for property-based alignment |
| Benchmark Datasets | PDBbind, DUD-E, DEKOIS | Provide validated protein-ligand complexes for method evaluation |
| Similarity Metrics | Tanimoto coefficient, Tversky index, ROCS combo score | Quantify alignment quality and molecular similarity |
Molecular alignment strategies based on maximum common substructure and 3D similarity provide complementary approaches for SAR analysis in oncology research. MCS-based methods offer intuitive alignment of structurally similar compounds, while property-based approaches enable scaffold hopping and activity prediction across diverse chemotypes. The experimental protocols and application notes presented here establish a framework for generating robust activity-atlas models to guide anticancer drug optimization. As AI-driven representation methods advance, integration of deep learning with physical simulation promises further improvements in alignment accuracy and predictive power for complex oncology targets.
The generation of an Activity Atlas model represents a paradigm shift in oncology research, integrating multifaceted data to map the complex biological landscape of cancer. In the context of Structure-Activity Relationship (SAR) analysis, these models move beyond traditional approaches to create a comprehensive, multi-dimensional view of compound activity against biological targets. The core innovation lies in applying Bayesian analytical frameworks to compute robust feature weights, enabling researchers to prioritize molecular descriptors and biological features that most significantly drive oncological outcomes. This methodology is particularly valuable in precision oncology, where understanding the complex interplay between compound structures, genomic biomarkers, and phenotypic responses is critical for developing targeted therapies [20] [32].
Activity Atlas models address several persistent challenges in oncological drug development, including data incompleteness, feature subjectivity, and interpretability limitations that have plagued previous approaches. By implementing Bayesian statistical methods, these models provide a mathematically rigorous framework for handling the inherent uncertainty in biological data while leveraging prior knowledge to strengthen conclusions from often limited sample sizes. This is especially crucial in oncology research, where patient populations may be small, and the consequences of false leads are significant [33] [34]. The integration of multi-omics data within this framework creates a more holistic understanding of cancer biology, facilitating the identification of prognostic biomarkers that capture both genomic and phenotypic heterogeneity [32].
Theoretical Foundation: Bayesian Analysis in Oncology
Core Principles of Bayesian Methodology
Bayesian analysis provides the mathematical foundation for Activity Atlas models through its fundamental principle of updating prior beliefs with new evidence. This approach is formally expressed through Bayes' theorem: P(θ|X) = [P(X|θ) × P(θ)] / P(X), where θ represents the model parameters (e.g., feature weights) and X represents the observed data. In oncology research, this translates to starting with informed prior distributions based on existing biological knowledge, then systematically updating these priors with experimental data to obtain posterior distributions that reflect the current state of knowledge [34].
The Bayesian framework offers distinct advantages for oncology applications, particularly through its ability to formally quantify uncertainty via credible intervals and directly compute probabilities of clinical hypotheses. Unlike frequentist methods that provide binary conclusions, Bayesian approaches yield more clinically intuitive interpretations, such as "there is an 85% probability that Treatment A increases response rates by at least 15% compared to Treatment B." This probabilistic output aligns more naturally with clinical decision-making processes [33]. Furthermore, Bayesian methods enable adaptive trial designs that can modify study parameters as data accumulate, enhancing trial efficiency and minimizing unnecessary patient exposure to suboptimal interventions—a critical ethical consideration in oncology research [33].
Current Adoption in Oncology Research
Despite these advantages, the adoption of Bayesian methods in oncology remains limited but growing. A comprehensive cross-sectional analysis of clinical trials registered between 2004 and 2024 revealed that of 84,850 oncology trials, only 640 (0.75%) implemented Bayesian approaches. The majority of these were in early-phase studies, with 41.1% in phase 1 trials and 33.6% in phase 2 trials. This distribution reflects the particular value of Bayesian methods in settings with smaller sample sizes and greater uncertainty [33]. The analysis also identified a significant increase in Bayesian trial adoption after 2011, though this has paralleled the overall increase in oncology research rather than representing an increased proportion of Bayesian methods.
Table 1: Adoption of Bayesian Methods in Oncology Clinical Trials (2004-2024)
| Trial Characteristic | Number of Trials | Percentage |
|---|---|---|
| Total Oncology Trials | 84,850 | 100% |
| Bayesian Trials | 640 | 0.75% |
| Phase 1 Bayesian Trials | 263 | 41.1% |
| Phase 2 Bayesian Trials | 215 | 33.6% |
| Phase 2/3 Bayesian Trials | 9 | 1.4% |
| Phase 3 Bayesian Trials | 14 | 2.2% |
Computational Framework for Activity Atlas Generation
Bayesian Tensor Factorization for Multi-Omic Integration
A cornerstone of Activity Atlas generation is the application of Bayesian tensor factorization (BTF) to integrate diverse data modalities. Tensors, as multi-dimensional arrays, provide a natural mathematical structure for representing the complex interactions between compounds, genomic features, and phenotypic outcomes. The BTF approach decomposes a high-dimensional tensor (e.g., compound × genomic feature × imaging phenotype) into latent factors that capture the underlying patterns driving oncological responses [32].
The mathematical formulation of BTF can be represented as: T ≈ Σᵣ (Uᵣ ∘ Vᵣ ∘ Wᵣ), where T is the original tensor, U, V, and W are factor matrices for each dimension, and ∘ denotes the vector outer product. In the Bayesian implementation, prior distributions are placed on the factor matrices, typically using sparse priors to automatically identify the most relevant latent dimensions. This approach effectively addresses the "unpaired data problem" common in radiogenomics, where complete sets of imaging, genomic, and clinical outcome data may not be available for all patients [32].
Deep Learning for Feature Extraction
Convolutional neural networks (CNNs) and other deep learning architectures serve as powerful tools for automated feature extraction from high-dimensional oncology data, particularly medical images. Unlike traditional radiomics approaches that rely on hand-crafted features, deep learning models can learn hierarchical representations directly from raw imaging data, capturing subtle patterns that may be imperceptible to human observers [20]. These extracted features then serve as inputs to the Bayesian weighting framework, providing a rich set of descriptors for the Activity Atlas.
The integration of deep learning with Bayesian methods creates a particularly powerful synergy—the deep learning components handle the complexity of high-dimensional data, while the Bayesian framework provides uncertainty quantification and robust feature weighting. This combination addresses both the feature subjectivity and interpretability challenges that have limited previous radiogenomic approaches [32].
Experimental Protocols
Protocol 1: Bayesian Tensor Factorization for Multi-Omic Data Integration
Purpose: To integrate heterogeneous multi-omics data (genomic, transcriptomic, proteomic) and extract meaningful latent factors for Activity Atlas construction.
Materials:
- Multi-omics datasets (e.g., RNA-seq, whole-exome sequencing, proteomics)
- High-performance computing cluster with minimum 64GB RAM
- Python environment with TensorLy, PyTorch, and PyMC3 libraries
Procedure:
- Data Preprocessing: Normalize each omics dataset separately using quantile normalization for genomic data and variance stabilizing transformation for proteomic data.
- Tensor Construction: Organize preprocessed data into a three-mode tensor with dimensions: samples × molecular features × omics platforms.
- Prior Specification: Define weakly informative Gaussian priors for factor matrices and Half-Cauchy priors for noise parameters.
- Model Inference: Implement Markov Chain Monte Carlo (MCMC) sampling with No-U-Turn Sampler (NUTS) for 2000 iterations, discarding first 1000 as burn-in.
- Factor Selection: Apply automatic relevance determination (ARD) to identify the most biologically relevant latent dimensions.
- Validation: Perform posterior predictive checks to assess model fit and stability.
Quality Control:
- Monitor MCMC convergence using Gelman-Rubin statistics (R̂ < 1.05)
- Verify biological relevance of factors through enrichment analysis against known pathways
Protocol 2: Feature Weight Calculation Using Bayesian Regression
Purpose: To compute robust feature weights for molecular descriptors within the Activity Atlas framework.
Materials:
- Compound activity data (IC50, EC50, etc.)
- Molecular descriptor sets (e.g., MOE, RDKit, Dragon)
- R environment with brms, rstan, and bayesplot packages
Procedure:
- Data Preparation: Standardize molecular descriptors to zero mean and unit variance to improve MCMC sampling efficiency.
- Model Specification: Implement hierarchical Bayesian regression with horseshoe priors for feature coefficients to induce sparsity.
- Posterior Sampling: Run Hamiltonian Monte Carlo sampling for 4000 iterations across 4 chains.
- Weight Calculation: Compute posterior means and 95% credible intervals for each feature coefficient.
- Significance Assessment: Calculate posterior inclusion probabilities (PIP) for each feature.
- Model Checking: Perform leave-one-out cross-validation to assess predictive performance.
Interpretation Guidelines:
- Features with PIP > 0.75 are considered strongly associated with activity
- Features with 95% credible intervals excluding zero are statistically significant
Signaling Pathways and Workflow Visualization
Activity Atlas Generation Workflow
Bayesian Feature Weight Calculation
Research Reagent Solutions
Table 2: Essential Research Reagents and Computational Tools for Activity Atlas Generation
| Reagent/Tool | Function | Application Notes |
|---|---|---|
| Bayesian Tensor Factorization Framework | Integrates multi-omics data and extracts latent factors | Critical for handling unpaired imaging-genomics data [32] |
| Convolutional Neural Networks (CNNs) | Automated feature extraction from medical images | Reduces feature subjectivity in radiogenomic analysis [20] [32] |
| Markov Chain Monte Carlo (MCMC) Samplers | Posterior distribution estimation for Bayesian models | Enables robust uncertainty quantification for feature weights |
| Horseshoe Priors | Regularization and feature selection in high dimensions | Induces sparsity while preserving strong signals [34] |
| Multi-Omic Data Normalization Pipelines | Standardizes heterogeneous data sources | Essential for integrating genomic, transcriptomic, and proteomic data |
| Posterior Predictive Check Tools | Validates model fit and assumptions | Ensures biological plausibility of Activity Atlas models |
Data Presentation and Performance Metrics
Performance Comparison with Traditional Methods
Table 3: Performance Comparison of Bayesian Activity Atlas vs. Traditional SAR Models
| Model Characteristic | Traditional SAR Models | Bayesian Activity Atlas |
|---|---|---|
| Handling of Missing Data | Complete case analysis or imputation | Explicit modeling through Bayesian hierarchical framework |
| Uncertainty Quantification | Confidence intervals based on asymptotic approximations | Direct posterior probability statements |
| Feature Selection | Stepwise selection or LASSO | Automatic via sparsity-inducing priors (e.g., horseshoe) |
| Multi-Modal Data Integration | Limited or separate analyses | Native integration through tensor factorization |
| Interpretability | Coefficient estimates with p-values | Posterior inclusion probabilities and credible intervals |
| Computational Demand | Lower | Higher, but scalable with modern computing resources |
Quantitative Performance in Cancer Prognosis
Recent implementations of Bayesian frameworks in oncology have demonstrated superior performance compared to traditional approaches. In breast cancer radiogenomics, a novel integrative computational framework identified 23 biomarkers that performed better in indicating patients' survival outcomes compared to traditional radiogenomic biomarkers [32]. The framework successfully addressed key limitations including data incompleteness and feature subjectivity through its Bayesian formulation.
In clinical trial settings, Bayesian approaches have shown particular value in small randomized oncology trials, where they facilitate more efficient decision-making while properly accounting for uncertainty. These methods provide a formal mechanism for incorporating prior information, which is especially valuable when sample sizes are limited due to rare cancers or targeted therapies [34]. The ability to compute posterior probabilities for treatment success enables more nuanced go/no-go decisions compared to traditional binary hypothesis testing.
Implementation Considerations and Future Directions
The implementation of Activity Atlas models requires careful consideration of several practical factors. Computational resources represent a significant consideration, as Bayesian methods with MCMC sampling can be computationally intensive, particularly for high-dimensional oncology data. However, recent advances in variational inference and hardware acceleration have made these approaches more accessible. Prior specification also demands careful attention, as the choice of priors can significantly influence results, especially in small sample settings. While weakly informative priors are often recommended for initial applications, domain knowledge should be incorporated when available to strengthen inferences [34].
Future developments in Activity Atlas models will likely focus on several key areas. Dynamic updating capabilities will enable models to incorporate new data continuously, creating living atlases that evolve with the scientific knowledge base. This approach aligns with initiatives like the Cancer and Organ Degradome Atlas (CODA) project, which aims to create comprehensive maps of enzyme activity across different cancer types [35]. Additionally, automated Bayesian workflow tools will make these methods more accessible to non-specialists, potentially increasing adoption across oncology research domains. As these frameworks mature, their integration with electronic health records and real-world evidence will create unprecedented opportunities for validating and refining activity predictions in diverse patient populations.
The continued development and application of Activity Atlas models represents a promising frontier in oncology drug development, offering a mathematically rigorous framework for navigating the complex landscape of cancer biology and therapeutic intervention.
Structure-Activity Relationship (SAR) analysis represents a fundamental pillar in modern oncology drug discovery, enabling researchers to understand how chemical modifications influence biological activity against specific cancer targets. The process systematically investigates how alterations in a molecule's structure affect its potency, selectivity, and pharmacological properties. In the context of oncology, where targets often include kinases and ion channels, SAR analysis provides critical insights for optimizing lead compounds into viable therapeutic candidates. The emergence of Activity-Atlas models has revolutionized this field by providing a comprehensive, three-dimensional framework for analyzing and predicting the biological activity of compound series. These models utilize advanced computational methods to transform complex structural and activity data into visually interpretable maps that guide molecular design. By integrating electrostatic, hydrophobic, and shape properties with biological activity data, Activity-Atlas models offer a probabilistic approach to SAR analysis that condenses large data tables into single, actionable pictures [11].
The importance of robust SAR analysis is particularly evident in oncology, where drug resistance and off-target toxicity present significant challenges. For example, the benzoxazepinone class of RIPK1 inhibitors demonstrates how subtle structural changes can dramatically impact inhibitory potency, with activity ranges spanning from pIC50 4.9 to 10.3 [11]. Similarly, ion channels such as VDAC1 (Voltage-Dependent Anion Channel 1) show distinct expression patterns in cancer cells compared to healthy tissues, making them attractive targets for therapeutic intervention [36]. This case study will explore the application of Activity-Atlas models for SAR analysis of both kinase and ion channel targets, providing detailed protocols and frameworks that can be implemented in oncology drug discovery programs.
Case Study 1: SAR Analysis of RIPK1 Kinase Inhibitors
Target Background and Therapeutic Relevance
Receptor-interacting serine/threonine-protein kinase 1 (RIPK1) has emerged as a promising therapeutic target for treating autoimmune, inflammatory, and oncogenic diseases. As a key mediator of inflammation and cell death pathways, RIPK1 regulates critical cellular processes that contribute to disease pathology. Its unique structural characteristics have enabled the development of highly selective small-molecule inhibitors, with several drug candidates currently progressing through clinical trials for conditions including psoriasis, rheumatoid arthritis, ulcerative colitis, ALS, Alzheimer's disease, and pancreatic cancer [11]. The benzoxazepinone-based inhibitors, first identified by GlaxoSmithKline (GSK) through screening against DNA-encoded libraries, demonstrate complete specificity for RIPK1, making them an excellent case study for SAR analysis using Activity-Atlas methodologies [11].
The therapeutic significance of RIPK1 inhibition stems from its position at the crossroads of multiple cell death and inflammatory pathways. By modulating RIPK1 activity, researchers can potentially intervene in pathological processes that drive both degenerative and proliferative diseases. In the context of cancer, RIPK1 influences tumor microenvironment composition and cancer cell survival mechanisms, making it a valuable target for oncology drug discovery programs. The high selectivity exhibited by benzoxazepinone inhibitors for RIPK1 over other kinases addresses a critical challenge in kinase drug development – achieving sufficient target specificity to minimize off- effects [11].
Experimental Dataset Preparation and Compound Alignment
The foundation of any robust SAR analysis is a carefully curated dataset of compounds with reliable activity measurements. For the RIPK1 case study, researchers assembled a dataset of 46 compounds with activity values (pIC50) ranging from 4.9 to 10.3, sourced from BindingDB and supporting information from GSK literature publications [11]. The experimental protocol for dataset preparation involves several critical steps:
- Protein-Ligand Complex Preparation: The crystallographic structure of GSK'481 bound to RIPK1 (PDB: 5HX6) was obtained from the Protein Data Bank and carefully prepared using molecular modeling software. This structure provides the spatial framework for understanding ligand-binding interactions [11].
- Compound Processing: Each molecule in the dataset was checked for tautomerism and protonation states, with appropriate adjustments made to ensure accurate representation of physiological conditions. Proper protonation is essential for correct electrostatic calculations in subsequent modeling steps [11].
- Molecular Alignment: All compounds were aligned to the published X-ray crystal structure of GSK'481 using a Maximum Common Substructure approach. The alignment employed the 'very accurate but slow' configuration for conformation hunting and 'Permissive' mode for substructure alignment, allowing rotation of heterocyclic rings while using a 'hard' protein excluded volume to maintain physiologically relevant orientations [11].
- Alignment Validation: Visual inspection of alignments is recommended to identify and correct anomalies. In this study, the alignment of thiazole compound 1 required manual adjustment by flipping/rotating the thiazole and benzyl rings to achieve consistency with the overall dataset [11].
Table 1: Key Experimental Resources for RIPK1 SAR Analysis
| Resource | Source/Identifier | Application in SAR Analysis |
|---|---|---|
| RIPK1 Crystal Structure | PDB: 5HX6 | Reference structure for molecular alignment and binding site analysis |
| Compound Dataset | 46 compounds from BindingDB and GSK publications | Training and validation set for Activity-Atlas model generation |
| Computational Software | Flare (Cresset) | Platform for Activity Atlas and Activity Miner analyses |
| Activity Data | pIC50 values (4.9-10.3) | Quantitative activity measurements for correlation with structural features |
Activity-Atlas Model Generation and SAR Interpretation
The Activity-Atlas methodology employs a Bayesian approach to analyze the structure-activity relationships of aligned compounds as a function of their electrostatic, hydrophobic, and shape properties. This probabilistic method generates highly visual 3D maps that summarize SAR data and inform the design of new compounds [11]. The protocol for model generation and interpretation includes:
- Shape and Hydrophobicity Analysis: Activity cliff summary maps for shape revealed that RIPK1 activity increases with small substituents on the lactam amide of the benzoxazepinone moiety, while larger substituents decrease activity. This is visualized as small favorable (green) areas enclosed within larger unfavorable (magenta) regions. Minimal variation is tolerated at the cyclic ether moiety, as indicated by a favorable green area around this group [11].
- Electrostatic Potential Mapping: The activity cliff summary of electrostatics identified well-defined areas where negative (blue) and positive (red) electrostatics are crucial for RIPK1 activity. A region of favorable negative electrostatics beneath the aligned ligands corresponds to the carbonyl of the amide linker, which forms a hydrogen bond with the backbone NH of Asp156 in the RIPK1 binding site [11].
- SAR Interpretation: Analysis of high-activity compounds (pIC50 10.3-9) revealed tight alignment with limited tolerance for structural variation. Replacement of the benzoxazepinone oxygen with sulfur or NH is permitted, and substitution on the aryl benzoxazepinone ring is only allowed at the 7-position. Low-activity compounds (pIC50 6.7-4.9) showed steric clashes with the protein, explaining their reduced potency [11].
The impact of N-substitution on the lactam amide provides a clear example of SAR trends identified through Activity-Atlas modeling. Replacing the NH moiety in compound 2 (pIC50 7.49) with NMe (GSK'481, pIC50 8.8) increases activity, while larger substituents like NEt (compound 3, pIC50 5.5) or N-cPr (compound 4, pIC50 5) clash with the protein and are not tolerated [11].
Table 2: Key SAR Insights for RIPK1 Benzoxazepinone Inhibitors
| Structural Feature | Optimal Characteristic | Impact on Activity (pIC50) | Structural Basis |
|---|---|---|---|
| Lactam Amide Substituent | N-Methyl (in GSK'481) | 8.8 | Small substituent avoids steric clash with protein |
| Lactam Amide Substituent | N-Ethyl (Compound 3) | 5.5 (Δ -3.3) | Larger group clashes with protein binding site |
| Benzoxazepinone Oxygen | Replaceable with S or NH | Maintained activity ~8-10.3 | Conservative modifications tolerated at this position |
| Aryl Ring Substitution | Position 7 only | Maintained high activity | Other positions cause steric hindrance |
| Heterocyclic Ring (Isoxazole) | Specific electrostatic requirements | Critical for high activity | Must complement electrostatic environment of binding site |
Detailed SAR Exploration with Activity Miner
Activity Miner provides a complementary approach to Activity Atlas by enabling detailed investigation of specific activity changes between compound pairs. This tool helps identify "activity cliffs" – regions in the SAR landscape where small structural changes generate large activity differences [11]. The application of Activity Miner to RIPK1 inhibitors involved:
- Disparity Analysis: Examination of the 'top pairs' table in Activity Miner revealed molecular pairs with the highest disparity, highlighting structural changes with the largest influence on RIPK1 pIC50. This analysis focused on a subset of 17 molecules where the isoxazole ring moiety of GSK'481 was replaced with alternative heterocycles [11].
- Ligand Field Differences: Exploration of ligand field differences for top pairs showed that higher RIPK1 pIC50 consistently correlated with heterocycles displaying a more negative electrostatic field on the left side (typically associated with an aromatic nitrogen) and a more positive field on the right side. These observations aligned with both the Activity Atlas maps and Protein Interaction Potentials (PIPs) for RIPK1 [11].
- Electrostatic Complementarity: The electrostatic complementarity between oxazole 5 (the most active compound in the series, pIC50 10.3) and the RIPK1 active site was confirmed through EC mapping. The positive field on the right of the oxazole mapped to negative PIPs of RIPK1, while the negative field of the ligand occupied an area of positive electrostatics in the active site [11].
Case Study 2: SAR Analysis of VDAC1 Ion Channel in Oncology
Target Background and Oncological Significance
Voltage-Dependent Anion Channel 1 (VDAC1) represents a compelling ion channel target in oncology, with demonstrated roles in cancer cell metabolism and apoptosis resistance. Located primarily in the outer mitochondrial membrane, VDAC1 serves as the main interface between mitochondrial and cellular metabolism, mediating the exchange of metabolites including pyruvate, malate, succinate, ADP, NADH, and newly synthesized ATP [36]. In cancer cells, VDAC1 overexpression provides a metabolic advantage by presenting binding sites for hexokinase, enabling direct transport of mitochondrial ATP for glucose phosphorylation and enhancing the glycolytic rate characteristic of cancer cells (the Warburg effect) [36].
The oncogenic significance of VDAC1 extends beyond metabolism to include apoptosis regulation. VDAC1 facilitates the release of cytochrome c and other pro-apoptotic factors from the mitochondrial intermembrane space, representing a "point of no return" in mitochondrial apoptosis [37]. Cancer cells frequently exhibit apoptosis resistance through dysregulation of this process. VDAC1 also binds to anti-apoptotic Bcl-2 family proteins (Bcl-2 and Bcl-xL), which are overexpressed in many cancers, further enhancing cell survival [36]. VDAC1 is overexpressed in numerous cancer types, including hepatoma, sarcomatous alterations, non-small-cell lung cancer (NSCLC), gastric cancer, thyroid, lung, cervix, ovary, pancreas, melanoma, and glioblastoma [36]. Importantly, VDAC1 expression levels correlate with tumor progression and sensitivity to chemotherapy, making it a potential biomarker for cancer development and treatment efficacy [36].
Experimental Framework for Ion Channel SAR Analysis
SAR analysis for ion channels presents unique challenges compared to kinases, requiring specialized approaches to assess channel function and modulation. The experimental framework for VDAC1 SAR analysis includes:
- Expression Analysis: Investigation of VDAC1 expression patterns in cancer versus normal tissues using techniques such as immunofluorescence, flow cytometry, and EM immunogold labeling. These methods have identified VDAC1 overexpression in multiple cancer types and revealed its presence in various cellular compartments beyond the outer mitochondrial membrane, including the plasma membrane, sarcoplasmic reticulum, endoplasmic reticulum, and caveolae [36].
- Functional Assessment: Evaluation of VDAC1 channel activity using electrophysiological techniques such as planar lipid bilayer reconstitution and patch clamping on mitochondria. These approaches measure ion conductance and channel properties, with recombinant VDAC1 demonstrating a conductance of 4 nS in 1 M KCl [36].
- Modulation Studies: Testing of compounds that interact with VDAC1 and affect its ability to bind hexokinase and Bcl-2 family member proteins. Several drugs, including erastin and oblimersen (G3139), have shown potential in modulating VDAC1 function [36].
- Genetic Manipulation: Downregulation of VDAC1 expression via RNA interference to validate its functional role in cancer cells. Studies demonstrate that VDAC1 knockdown reduces metabolite exchange between mitochondria and cytosol, inhibits cell growth, and prevents cell death induced by cisplatin and endostatin [36].
Table 3: Research Reagent Solutions for Ion Channel SAR Studies
| Reagent/Resource | Application | Experimental Function |
|---|---|---|
| VDAC Isoform-Specific Antibodies | Expression Profiling | Immunodetection of VDAC1, VDAC2, VDAC3 in cancer vs. normal tissues |
| Planar Lipid Bilayer System | Functional Characterization | Electrophysiological assessment of VDAC channel properties and conductance |
| Hexokinase Binding Assays | Interaction Studies | Evaluation of VDAC1-hexokinase complex formation in cancer metabolism |
| Bcl-2/Bcl-xL Binding Assays | Apoptosis Regulation Studies | Measurement of VDAC1 interactions with anti-apoptotic Bcl-2 family proteins |
| VDAC1 Knockdown Models | Target Validation | RNAi-mediated silencing to confirm VDAC1 role in cancer cell survival |
| Mitochondrial Isolation Kits | Subcellular Fractionation | Purification of mitochondrial fractions for channel activity measurements |
SAR Insights for VDAC-Targeted Cancer Therapeutics
While the search results provide less specific structural information for VDAC1 inhibitors compared to the well-characterized RIPK1 kinase inhibitors, several important SAR principles emerge for ion channel targets in oncology:
- Isoform Specificity: Mammals express three VDAC isoforms (VDAC1, VDAC2, and VDAC3) with approximately 70% sequence identity but distinct functions. VDAC3, for instance, acts as a redox sensor with channel activity dependent on the redox state of critical cysteine residues [36]. Effective therapeutic agents must demonstrate selectivity for the target isoform to minimize off-target effects.
- Binding Site Characterization: VDAC1 contains specific binding sites for hexokinase and Bcl-2 family proteins that are crucial for its oncogenic functions. Compounds that disrupt these protein-protein interactions represent promising therapeutic strategies, with SAR analysis focusing on optimization of binding affinity and specificity [36].
- Metabolic Impact: SAR analysis for VDAC1 modulators must consider effects on mitochondrial metabolism, as VDAC1 controls the flux of metabolic intermediates between mitochondria and cytosol. Effective compounds should disrupt the metabolic advantages provided by VDAC1 overexpression in cancer cells without severely compromising normal cellular metabolism [36].
- Apoptosis Restoration: The therapeutic goal for VDAC1-targeted agents is restoration of apoptotic sensitivity in cancer cells. SAR analysis should therefore correlate structural features with ability to promote cytochrome c release and overcome apoptosis resistance [37].
Comparative Analysis of Kinase vs. Ion Channel SAR Methodologies
The SAR analysis approaches for kinase and ion channel targets exhibit distinct methodological considerations, reflecting differences in target structure, biological function, and therapeutic modulation strategies.
Table 4: Comparison of SAR Approaches for Kinase vs. Ion Channel Targets
| Analysis Aspect | Kinase Targets (RIPK1 Example) | Ion Channel Targets (VDAC1 Example) |
|---|---|---|
| Primary Screening Assay | Biochemical kinase activity assays | Electrophysiological channel function measurements |
| Structural Basis | Well-defined ATP-binding pocket with adjacent allosteric sites | Complex transmembrane architecture with multiple regulatory sites |
| Key SAR Parameters | Inhibitory potency (IC50/pIC50), kinase selectivity, cellular permeability | Channel conductance modulation, ion selectivity, gating properties |
| Computational Approaches | Activity Atlas modeling, ligand-based design, structure-based drug design | Molecular dynamics simulations, homology modeling, electrostatics calculations |
| Therapeutic Modulation | Competitive ATP inhibition, allosteric regulation, covalent inhibition | Pore blockade, gating modification, protein-protein interaction disruption |
| Selectivity Challenges | High conservation of ATP-binding site across kinome | Tissue-specific expression and functional redundancy of channel isoforms |
For kinase targets like RIPK1, SAR analysis benefits from well-established screening methodologies and abundant structural data from crystallographic studies. The conserved ATP-binding pocket across the kinome presents selectivity challenges that can be addressed through allosteric targeting, as demonstrated by the type II, III, and IV kinase inhibitors documented in the Kinase Atlas [38]. This resource systematically catalogs binding hot spots across 4910 structures of 376 distinct kinases, identifying ten potential allosteric sites that could be targeted for improved selectivity [38].
In contrast, ion channel SAR analysis must account for complex regulation mechanisms, including voltage-dependence, ligand-gating, and metabolic modulation. The subcellular localization of channels like VDAC1 in mitochondrial membranes introduces additional complexity for compound delivery and activity assessment. Furthermore, ion channels often function as part of larger macromolecular complexes, requiring SAR analysis to consider protein-protein interactions in addition to direct channel modulation [37].
Advanced Applications: Integrating Activity-Atlas with Multi-Omics Approaches in Oncology
Modern oncology drug discovery increasingly integrates SAR analysis with multi-omics technologies to develop comprehensive understanding of target biology and therapeutic modulation. The Comprehensive Oncological Biomarker Framework exemplifies this approach by unifying diverse biomarker categories – including genetic and molecular profiling, imaging, histopathology, multi-omics, and liquid biopsy – to generate molecular fingerprints for individual patients [39]. Activity-Atlas models can be enhanced through integration with several advanced technologies:
- Phosphoproteomics Integration: Kinase substrate specificity atlases, such as the comprehensive resource profiling 303 Ser/Thr kinases covering 84% of the predicted active kinome in humans, enable annotation of phosphorylation sites identified through mass spectrometry-based phosphoproteomics [40]. This integration helps "deorphanize" phosphosites with unknown upstream kinases, facilitating target identification and validation.
- Transcriptomic Correlation: Weighted Gene Co-expression Network Analysis (WGCNA) of ion channel expression patterns in cancer tissues identifies clusters of co-expressed channels and correlates their expression with epithelial-mesenchymal transition (EMT) scores and clinical outcomes [41]. For example, studies have identified 32 ion channels interacting with 26 hub EMT-related genes in breast cancer, with CACNA1B, ANO6, TRPV3, VDAC1, and VDAC2 expression potentially associated with poor survival [41].
- Single-Cell Technologies: Advanced methods like ATLAS-seq (Aptamer-based T Lymphocyte Activity Screening and SEQuencing) combine single-cell technology with aptamer-based fluorescent molecular sensors to identify antigen-reactive T cells, enabling more effective identification of TCRs with high functional activity for cancer immunotherapy [39].
- Microbiome Profiling: Emerging evidence suggests that gut microbiome profiles can serve as biomarkers for immunotherapy response, refining patient stratification and treatment optimization within comprehensive oncological frameworks [39].
The integration of Activity-Atlas models with these multi-omics approaches creates a powerful framework for oncology target assessment, enabling researchers to contextualize SAR findings within broader biological networks and disease pathways. This systems pharmacology perspective accelerates the identification of promising therapeutic targets and optimization of lead compounds with improved efficacy and safety profiles.
Activity-Atlas modeling represents a sophisticated computational framework for SAR analysis that transforms complex structural and activity data into visually interpretable, actionable insights for drug discovery. The case studies of RIPK1 kinase and VDAC1 ion channel targets demonstrate the broad applicability of this approach across different target classes in oncology. For RIPK1 inhibitors, Activity-Atlas models successfully identified critical structural determinants of potency and selectivity, guiding optimization of the benzoxazepinone chemotype. For VDAC1 ion channel modulators, SAR analysis must account for unique challenges including mitochondrial localization, metabolic functions, and complex regulation of apoptosis.
The continuing evolution of Activity-Atlas methodologies, particularly through integration with multi-omics technologies and advanced computational approaches, promises to further enhance their utility in oncology drug discovery. As these models incorporate increasingly diverse data types – from phosphoproteomic atlases of kinase specificity to co-expression networks of ion channels in cancer tissues – they will provide more comprehensive frameworks for understanding and exploiting structure-activity relationships across the expanding landscape of oncology targets.
Within oncology drug discovery, Activity Atlas models provide a powerful, three-dimensional framework for understanding the structure-activity relationships (SAR) of lead compounds. These models map the key steric, electrostatic, and hydrophobic features that govern biological activity [2] [12]. However, their true potential is unlocked when integrated with other computational and experimental methods. This synergy creates a powerful pipeline that accelerates the identification and optimization of novel anticancer therapeutics [42].
This application note details protocols for combining Activity Atlas models with virtual screening (VS) and lead optimization techniques. We provide a structured guide for oncology researchers to efficiently traverse the critical early stages of drug discovery, from identifying novel chemical equity from vast libraries to systematically refining leads into promising preclinical candidates.
Quantitative Performance of Integrated Screening Strategies
The integration of multiple screening strategies significantly enhances the probability of successfully identifying leads. The table below summarizes the performance of various methods, highlighting the value of a complementary toolbox [42] [43].
Table 1: Performance Metrics of Different Screening and Optimization Methods
| Method | Typical Hit Rate | Key Strengths | Reported Performance/Outcome |
|---|---|---|---|
| AI-Accelerated Virtual Screening [43] | Variable, high enrichment | Rapid screening of ultra-large libraries (>1 billion compounds) | EF1% = 16.72 on CASF2016 benchmark; Docking completed in <7 days for some targets. |
| Traditional Virtual Screening [44] | ~1-5% | Well-established, accessible | Majority of hits have low-to-mid micromolar activity (1-25 μM). |
| Activity Atlas 3D-QSAR [12] | N/A (Predictive Model) | Provides qualitative and quantitative SAR insights; guides optimization. | Model quality: r² = 0.92, q² = 0.75 for a maslinic acid model. |
| Integrated VS + Activity Atlas [13] | Highly Improved | Leverages ligand-based insights to focus structure-based efforts. | Successfully identified novel DPP-4 inhibitor (Chrysin) from a natural product database. |
Integrated Experimental Protocols
Protocol 1: Virtual Screening Guided by an Activity Atlas Model
This protocol uses a pre-generated Activity Atlas model to efficiently prioritize compounds from a large virtual library for experimental testing [13] [12].
1. Activity Atlas Model Generation
- Input: A set of 10-20 known active compounds with reliable bioactivity data (e.g., IC50 against a specific oncology target) [12].
- Software: Use applications like Forge (Cresset) or similar platforms capable of field-based analysis [2] [45].
- Method: a. Conformational Analysis: Generate representative, low-energy 3D conformations for each input compound. b. Field Templater: Use a subset of the most active and diverse compounds to generate a pharmacophore hypothesis (field template). This template represents the consensus 3D arrangement of electrostatic and hydrophobic features required for activity [13]. c. Activity Atlas: Align all training compounds to the template. The software will generate 3D maps showing: * The Average of Actives: The common shape and field patterns of active compounds. * Activity Cliff Summary: Regions where small structural changes cause significant activity changes. * Regions Explored: The chemical space explored by the training set [2] [13].
2. Virtual Library Screening
- Input: A database of purchasable or in-house compounds (e.g., ZINC, PubChem, Enamine).
- Method: a. Alignment and Scoring: Align each compound from the virtual library to the Activity Atlas field template. b. Novelty Score: Assign a "novelty score" (e.g., Low, Medium, High, Very High) based on how well the compound's fields match the template and its dissimilarity to the training set [13]. c. Prioritization: Create a shortlist of compounds that have high novelty scores and are predicted to be active by the model's 3D-QSAR equation [12].
3. In Silico Filtering and Docking
- Input: The shortlist of compounds from the previous step.
- Method: a. Drug-Likeness: Apply filters like Lipinski's Rule of Five and ADMET risk predictions to remove compounds with poor predicted pharmacokinetics [12]. b. Molecular Docking: Perform docking simulations (e.g., using FlexX, RosettaVS, or similar) of the remaining compounds into a protein structure of the oncology target. c. Final Selection: Select 20-50 compounds for experimental testing based on a consensus of high novelty score, favorable ADMET properties, good docking score, and formation of key protein-ligand interactions [13].
Protocol 2: Lead Optimization via Activity Miner and Automated Design
This protocol begins with initial hit compounds and uses integrated tools to systematically guide chemical optimization for improved potency and properties [2] [46].
1. SAR Analysis with Activity Miner
- Input: A set of aligned compounds (the initial hits and newly synthesized analogs) with measured activity data.
- Software: Forge's Activity Miner module [2].
- Method: a. Activity Cliff Matrix: Generate an all-by-all pairwise comparison matrix of the compounds. The software automatically identifies and colors "activity cliffs"—pairs of structurally similar compounds with large differences in potency. b. Analysis: Interrogate these cliffs in 3D. Visualizing the structural difference between the two compounds directly reveals the specific chemical group and its location in 3D space that is responsible for the potency change. This provides immediate, actionable SAR insights [2].
2. Automated Lead Optimization with RACHEL
- Input: A protein-ligand complex structure of the lead compound.
- Software: RACHEL module in the SYBYL package [46].
- Method: a. Define Derivatization Sites: Specify the atoms or R-groups on the lead compound that are available for chemical modification. b. Combinatorial Library Generation: RACHEL automatically generates a virtual library of derivatives by systematically attaching functional groups from a built-in library to the defined sites. c. Evaluation and Selection: Each derivative is conformationally searched within the protein's active site, scored based on predicted binding affinity, and filtered for drug-like properties. The highest-ranking compounds are proposed for synthesis in the next design cycle [46].
The following workflow diagram illustrates the integrated pathway from virtual screening to optimized lead compounds, incorporating the protocols described above.
The Scientist's Toolkit: Essential Research Reagents & Software
The following table details key software solutions and their roles in the integrated virtual screening and lead optimization workflow.
Table 2: Key Software Tools for Integrated Activity Atlas Workflows
| Tool / Solution | Provider / Reference | Primary Function in Workflow |
|---|---|---|
| Forge / Flare | Cresset Group [2] [45] | Core platform for generating Activity Atlas models, Activity Miner analysis, and field-based 3D-QSAR. |
| RosettaVS / OpenVS | Nature Commun. 2024 [43] | Open-source, AI-accelerated virtual screening platform for high-performance docking of ultra-large libraries. |
| RACHEL | UF Health Drug Design Core [46] | Automated combinatorial optimization of lead compounds by systematically derivatizing user-defined sites. |
| FieldTemplater | Cresset Group [12] | Module for generating 3D pharmacophore hypotheses from a set of active compounds, used as input for Activity Atlas. |
| AI/ML Generative Models | npj Drug Discovery 2025 [47] | Deep learning models (e.g., VAEs, GANs) for de novo design of novel compounds with optimized properties. |
The integration of Activity Atlas models with virtual screening and lead optimization represents a robust and efficient strategy for oncology drug discovery. By following the detailed protocols outlined in this document, researchers can leverage 3D SAR insights to focus costly synthetic efforts on the most promising chemical series and transformations. This synergistic approach, powered by advanced computational tools, significantly de-risks the early discovery pipeline and accelerates the delivery of novel therapeutic candidates for cancer patients.
Optimizing Activity Atlas Models: Overcoming Common Challenges and Pitfalls
Addressing Alignment Noise and Conformational Flexibility
Within oncology drug discovery, the generation of robust activity-atlas models for Structure-Activity Relationship (SAR) analysis is paramount. These models are critical for understanding the interaction between chemical structures and their biological activity against cancer targets. However, two significant challenges often impede the accuracy of these models: alignment noise and conformational flexibility. Alignment noise arises from errors in the spatial superposition of ligand structures during comparative analysis, leading to incorrect interpretation of pharmacophoric elements. Concurrently, conformational flexibility—the ability of small molecules and macromolecular targets to adopt multiple three-dimensional shapes—can obscure the true binding mode and complicate SAR analysis. This application note provides detailed protocols to address these challenges, ensuring the reliability of activity-atlas models in oncology research.
The systematic application of artificial intelligence (AI) is transforming the management of complex biological data in oncology drug development. A recent systematic review analyzing studies from 2015 to 2025 provides quantitative insight into current methodologies and their application focus [48].
Table 1: Distribution of AI Methods in Drug Discovery and Development (2015-2025)
| AI Methodology | Percentage of Studies | Primary Application in Drug Discovery |
|---|---|---|
| Machine Learning (ML) | 40.9% | Predictive model building for activity and toxicity |
| Molecular Modeling and Simulation (MMS) | 20.7% | Analyzing molecular interactions and conformations |
| Deep Learning (DL) | 10.3% | Pattern recognition in high-dimensional data |
Table 2: Focus of AI Applications in Therapeutic Areas
| Therapeutic Area | Percentage of Studies | Relevance to Conformational Analysis |
|---|---|---|
| Oncology | 72.8% | High relevance due to diverse protein targets and mutational profiles |
| Neurology | 5.2% | Important for GPCR and ion channel flexibility |
| Dermatology | 5.8% | Variable relevance to conformational flexibility |
The data underscores a dominant focus on oncology, where understanding conformational flexibility of both drug candidates and their protein targets (e.g., kinases, nuclear receptors) is critical for designing selective and potent therapies.
Experimental Protocols
Protocol: Managing Alignment Noise in SAR Series
Objective: To align a series of congeneric compounds while minimizing positional noise that can corrupt 3D activity-atlas generation.
Materials:
- Software: Molecular docking software (e.g., Schrödinger), pFlexAna server [49].
- Input: 3D structures of small molecules in the SAR series (SDF or MOL2 format).
Procedure:
- Initial Structure Preparation:
- Generate plausible 3D conformations for all ligands in the series using a tool like LigPrep.
- Ensure consistent protonation states at physiological pH (7.4 ± 0.5).
- Core Fragment Identification:
- Identify a common, rigid scaffold present across all molecules in the series.
- Use this core as the initial template for alignment.
- Multi-Conformer Alignment:
- For each compound, generate an ensemble of low-energy conformers.
- Perform a sequence-independent structural alignment using the core fragment as a fixed reference point. Tools like pFlexAna are designed for such tasks, as they detect structurally similar core fragments without relying on sequence homology, thus reducing noise [49].
- Consensus Alignment Validation:
- Superimpose all aligned structures and calculate Root Mean Square Deviation (RMSD) values for the core atoms.
- Manually inspect alignments, paying special attention to the spatial orientation of variable substituents. Exclude outliers from the final activity-atlas model.
Protocol: Analyzing Conformational Flexibility in Protein Targets
Objective: To detect and analyze dominant conformational changes in a protein target of interest (e.g., an oncology-related kinase) to inform structure-based drug design.
Materials:
- Software: pFlexAna web server [49], visualization tool (e.g., PyMol).
- Input: Two Protein Data Bank (PDB) structures of the same protein in different conformational states.
Procedure:
- Data Input:
- Access the pFlexAna server.
- Input the two PDB structures either by uploading files or specifying their 4-character PDB codes. Chain identifiers or residue ranges can be specified for focused analysis.
- Parameter Configuration:
- Set the noise parameter (σ). A value between 0.2 and 0.4 is recommended for proteins with reasonable homology, forcing stricter similarity matching and reducing alignment noise. For more distantly related conformers, a σ-value up to 0.8 can be used, albeit with an increased risk of false positives [49].
- Define the number of clusters (k) for grouping fragment pairs. Start with a low number (k=2-3) to identify major conformational shifts.
- Execution and Output Analysis:
- Run the analysis. pFlexAna will perform an all-against-all comparison of contiguous protein fragments, cluster them based on the geometric transformations required for alignment, and identify rigid cores and flexible regions [49].
- Review the output table and superimposed structures. Dominant conformational changes (e.g., domain movements) will be evident between clusters.
- Integration with SAR:
- Map the residues located in identified flexible regions (e.g., hinge regions of kinases) onto your activity-atlas model.
- Correlate ligand activity data with the ability to stabilize specific, therapeutically relevant conformations.
Protocol: Generating a QSAR Model Accounting for Conformational Dynamics
Objective: To create a predictive Quantitative SAR (QSAR) model for an oncology target that incorporates ligand flexibility.
Materials:
- Software: GUSAR software [50].
- Input: A dataset of chemical structures with associated experimental IC50 or Ki values against the target of interest.
Procedure:
- Data Set Curation:
- Curate a data set from public databases like ChEMBL. For a robust model, a minimum of 100 compounds is recommended [50].
- Convert IC50/Ki values to pIC50/pKi (pKi = -log10(Ki(M))).
- Define activity thresholds (e.g., 1 µM for active/inactive classification).
- Descriptor Calculation and Model Training:
- Use GUSAR software to calculate descriptors, including Multilevel Neighborhoods of Atoms (MNA) descriptors, which can capture information about molecular symmetry and topology relevant to conformation [50].
- Employ a self-consistent regression or classification algorithm within the software.
- Validate the model using a five-fold cross-validation procedure to ensure predictive power and avoid overfitting.
- Model Interpretation:
- Analyze the model to identify which conformational or structural descriptors are most heavily weighted.
- Use these insights to guide the design of new compounds with optimized flexibility and rigidity to enhance potency and selectivity.
Visualizing Workflows and Signaling Pathways
Diagram of Conformational Analysis and SAR Integration Workflow
Diagram of Ligand Flexibility in Binding Pocket
The Scientist's Toolkit: Research Reagent Solutions
Table 3: Essential Computational Tools for Addressing Alignment and Flexibility
| Research Reagent / Tool | Function / Application | Key Feature |
|---|---|---|
| pFlexAna Server [49] | Detects conformational changes in remotely related proteins without relying on sequence homology. | Clusters aligned fragment pairs to highlight dominant conformational changes between clusters. |
| GUSAR Software [50] | Creates (Q)SAR models for predicting activity and toxicity using MNA and QNA descriptors. | Capable of generating both classification (SAR) and regression (QSAR) models from the same data set. |
| ChEMBL Database [50] | Public repository of bioactive molecules with drug-like properties and associated experimental data. | Provides curated Ki and IC50 values for model training and validation against specific targets (e.g., antitargets). |
| Schrödinger Suite [48] | Integrated platform for molecular modeling and simulation, combining physics-based and AI methods. | Enables accurate prediction of molecular interactions and virtual screening with high hit rates. |
| Cryo-EM Continuous-State Methods [51] | Computational methods (e.g., HEMNMA) for analyzing continuous conformational changes from cryo-EM images. | Moves beyond discrete state classification to model a continuum of conformational states in macromolecular complexes. |
Strategies for Working with Limited or Noisy SAR Data
In oncology research, the exploration of structure-activity relationships (SAR) is fundamental for guiding the optimization of lead compounds. However, this process is frequently hampered by limited datasets or data compromised by assay noise and biological variability. Such data constraints can stem from the complex nature of biological targets, the high cost of synthesizing novel compounds, or the challenges associated with running consistent, high-fidelity assays in complex biological systems like cancer cell lines. Traditional quantitative SAR (QSAR) methods often fail to find robust linear models from such imperfect data, creating a need for more resilient information extraction techniques [2]. This application note details strategic methodologies, underpinned by Activity Atlas model generation, to extract meaningful insights from these challenging datasets, thereby accelerating oncology drug discovery.
Methodological Framework
Core Computational Strategy: Activity Atlas
The Activity Atlas approach provides a powerful solution for analyzing SAR under uncertainty. It employs a Bayesian probabilistic method to ascertain which steric, hydrophobic, and electronic properties of aligned ligands correlate with higher biological activity, even in the presence of noisy data [2] [9]. This method qualitatively summarizes complex SAR data into highly visual 3D maps, offering a global view that is more robust to noise and data sparsity than traditional regression models.
- Bayesian Foundation: The model uses Bayesian inference to account for the probability that each molecule in the dataset is correctly aligned, thereby reducing the impact of alignment noise and uncertainty on the final analysis [9].
- Three-Component Output: The analysis generates three key visual summaries:
- Average of Actives: Shows the common electrostatic and hydrophobic features of the most active compounds.
- Activity Cliff Summary: Identifies regions in the 3D molecular space where small structural changes lead to significant activity changes.
- Regions Explored: Maps the chemical space that has been sampled by the current dataset, highlighting areas for potential future exploration [13].
Supporting Workflow: Activity Miner
For a more granular view, Activity Miner is used in tandem with Activity Atlas. It drills down into the maps to dissect individual activity cliffs, providing a clear rationale for dramatic changes in activity between closely related compound pairs. This is particularly valuable for identifying critical structural features in noisy datasets and for inspiring new design hypotheses [2] [9].
Table 1: Key Software Tools for SAR Analysis of Noisy Data
| Tool Name | Primary Function | Application in Noisy/Limited Data Context |
|---|---|---|
| Activity Atlas | Bayesian 3D-SAR analysis and visualization | Identifies robust activity trends and critical molecular fields from noisy assay data [2]. |
| Activity Miner | Activity cliff identification and pairwise comparison | Pinpoints specific structural changes causing large activity shifts, highlighting key SAR [9]. |
| Forge/Flare | Molecular modeling and alignment platform | Host environment for Activity Atlas and Activity Miner; provides protein interaction potentials (PIPs) and electrostatic complementarity maps [9]. |
| Molecular Docking (e.g., FlexX) | Structure-based virtual screening | Validates hypotheses from ligand-based models and explores binding interactions when structural data is available [13]. |
Experimental Protocols
Protocol 1: Activity Atlas Model Generation for an Oncology Target
This protocol outlines the steps to build an Activity Atlas model for a kinase target in oncology, such as RIPK1, using a dataset of 46 benzoxazepinone inhibitors with activity (pIC50) ranging from 4.9 to 10.3 [9].
Step 1: Data Curation and Preparation
- Gather all compounds and associated biological activity data (e.g., IC50 values from cell-based or enzymatic assays).
- Carefully check and adjust the protonation states and tautomeric forms of all molecules to reflect physiological conditions. Use software like Flare or Forge for this preparation.
- For the benchmark case, a dataset was curated from BindingDB and literature, ensuring a wide activity range to capture the full SAR [9].
Step 2: Molecular Alignment
- Select a high-resolution crystal structure of a potent inhibitor bound to the target (e.g., PDB: 5HX6 for RIPK1) as a structural reference.
- Align all molecules to the reference conformation using a Maximum Common Substructure (MCS) algorithm. Use a 'very accurate but slow' conformation hunt setting and a 'Permissive' alignment mode to allow for sensible heterocycle rotations.
- Critically: Perform a visual inspection of all alignments. Manually correct any sub-optimal alignments, such as flipped rings, to ensure consistency across the dataset. This step is crucial for reducing noise in the subsequent 3D similarity calculations [9].
Step 3: Activity Atlas Calculation and Interpretation
- Within Forge or Flare, initiate the Activity Atlas module. Use 'Normal' model building conditions.
- Analyze the generated 3D maps:
- Shape Summary (Figure 2A): Identifies steric tolerances. For example, the RIPK1 analysis revealed that a small substituent (N-Me) on the lactam amide boosted activity, while larger groups (N-Et, N-cPr) caused steric clashes and decreased activity [9].
- Hydrophobics Summary (Figure 4A): Highlights areas where hydrophobic groups favor or disfavor activity. Compare these maps to a hydrophobicity-colored protein surface to validate findings.
- Electrostatics Summary (Figure 5): Reveals regions where positive or negative electrostatic potentials are crucial for activity. Correlate these findings with protein interaction potentials (PIPs) to understand the underlying driver of affinity, such as complementarity with a specific positive or negative patch in the binding site [9].
Protocol 2: Field-Based Virtual Screening with a Noisy Template
This protocol uses a field-based qualitative SAR model to screen for novel inhibitors when the initial dataset is small or noisy, as demonstrated for Dipeptidyl Peptidase-4 (DPP-4) inhibitors, a relevant target in cancer metabolism [13].
Step 1: Field Template Generation
- Select a small, diverse set of known active compounds (e.g., resveratrol, sitagliptin, flavone, luteolin for DPP-4).
- Use software like Forge to generate a 3D field template (pharmacophore hypothesis) that represents the consensus alignment and bioactive conformation of the input molecules as a function of their electrostatic and hydrophobic fields. The top template is selected based on general, field, and shape similarity scores [13].
Step 2: Activity Atlas Model Building and Database Screening
- Align a larger, albeit potentially noisy, set of known active compounds (e.g., 13 polyphenols with DPP-4 IC50 values) to the generated field template.
- Build the Activity Atlas model to understand the key features for inhibition. This model will highlight positive field regions (red) associated with higher inhibitory activity [13].
- Use this model as a query to screen a virtual database (e.g., the Phenol-Explorer database of food polyphenols). The screening is based on 3D similarity to the field template.
Step 3: Triage and Validation of Hits
- Assign a "novelty score" (low, medium, high, very high) to each database compound. Select compounds with "high" or "very high" scores for further study.
- Validate the top virtual hits using molecular docking (e.g., with FlexX) into the target's crystal structure to analyze predicted binding modes and interactions with key residues.
- As a final step, select the most promising candidate for experimental validation to confirm inhibitory activity, as was done with the natural compound chrysin for DPP-4 [13].
Table 2: Key Research Reagents and Computational Solutions
| Reagent/Solution | Function/Description | Application in SAR Analysis |
|---|---|---|
| Aligned Compound Dataset | A set of molecules with known activity, aligned in 3D space. | The fundamental input for building Activity Atlas and Activity Miner models [9]. |
| Protein Crystal Structure | A high-resolution 3D structure of the target protein, often with a ligand bound. | Serves as a reference for alignment and for interpreting SAR via PIPs and EC maps [9]. |
| Field Template | A 3D pharmacophore hypothesis representing key electrostatic and hydrophobic fields of active compounds. | Enables field-based virtual screening to find new chemotypes from noisy or limited starting data [13]. |
| Virtual Compound Database | A curated digital library of purchasable or synthesizable compounds (e.g., Phenol-Explorer). | A source for new leads via virtual screening using the field template and Activity Atlas model [13]. |
Data Presentation and Analysis
Effective summarization of quantitative data is critical for clear communication of SAR trends, especially when dealing with underlying noise.
- Frequency Tables and Histograms: For datasets with a wide range of activity values, summarizing the data into a frequency table and presenting it as a histogram provides a clear visual of the distribution of active vs. inactive compounds, helping to contextualize the dataset's quality [52] [53].
- Structured Activity Tables: Presenting key activity cliffs in a structured table allows for easy comparison of the most informative SAR pairs.
Table 3: Example Analysis of Activity Cliffs from a Noisy RIPK1 Dataset
| Compound Pair | Structural Change | Activity Change (ΔpIC50) | Rationale from Activity Miner Field Difference |
|---|---|---|---|
| Oxazole 5 vs. Thiazole 1 | Replacement of oxazole with thiazole | Significant Increase | Higher activity linked to a more negative electrostatic field (from aromatic N) and a more positive field on the opposite side of the heterocycle, better complementing the protein's PIPs [9]. |
| Compound 2 vs. GSK'481 | NH → N-Me on lactam amide | Increase (~1.3) | Small methyl group is tolerated and improves activity, as per favorable shape (green) map region [9]. |
| GSK'481 vs. Compound 3 | N-Me → N-Et on lactam amide | Decrease (~3.3) | Larger ethyl group clashes with protein (unfavorable magenta region in shape map), severely reducing activity [9]. |
In modern oncology drug discovery, the generation of robust Activity-Atlas models for Structure-Activity Relationship (SAR) analysis is paramount for elucidating complex bioactivity patterns and guiding molecular optimization. These models enable researchers to visualize and interpret the three-dimensional electrostatic and steric features that correlate with biological activity, particularly for challenging oncology targets where structural data may be limited [8] [2]. A critical yet often overlooked aspect of constructing reliable Activity-Atlas models is the strategic selection of similarity thresholds and confidence levels during the compound alignment and analysis phase. Similarity-centric computational approaches have demonstrated that the strategic application of similarity thresholds can significantly enhance prediction confidence by filtering intrinsic background noise, thereby improving the identification of true positive targets [54]. This application note provides detailed protocols and frameworks for establishing these optimal parameters specifically within the context of oncology-focused SAR analysis, enabling researchers to maximize the reliability of their Activity-Atlas models for critical decision-making in drug development projects.
Theoretical Framework: Similarity Thresholds in SAR Analysis
The Role of Molecular Similarity in Activity-Atlas Models
Activity-Atlas methodology employs a Bayesian framework to analyze 3D molecular alignments based on electrostatic and steric properties, allowing qualitative visualization of activity cliffs—regions where similar molecules show differing biological activities [1] [2]. The foundation of this analysis rests upon the accurate quantification of molecular similarity, which directly influences the quality of the resulting SAR interpretations. Similarity thresholds serve as critical filtering parameters that distinguish meaningful structural relationships from random molecular alignments, thereby enhancing the signal-to-noise ratio in SAR visualizations [54].
Evidence from computational target fishing studies indicates that similarity between a query molecule and reference ligands that bind to a target can serve as a quantitative measure of target reliability [54]. The distribution of effective similarity scores for target identification is fingerprint-dependent, necessitating customized threshold approaches for different molecular representation methods. In oncology research, where targets often include kinases, ion channels, and nuclear receptors, establishing appropriate similarity thresholds becomes particularly important for accurate bioactivity prediction and SAR interpretation [55] [2].
Confidence Level Quantification in SAR Predictions
Confidence levels in Activity-Atlas models reflect the statistical reliability of the observed SAR trends and activity cliff predictions. These confidence metrics can be derived from multiple factors, including the consistency of molecular field contributions, the robustness of pairwise comparisons, and the concordance across different fingerprint representations [54] [2]. Research demonstrates that integrating different models and considering target-ligand interaction profiles can significantly enhance prediction confidence, providing oncology researchers with more reliable guidance for compound optimization [54].
Table 1: Key Factors Influencing Confidence Levels in Activity-Atlas Models
| Factor | Impact on Confidence | Application in Oncology SAR |
|---|---|---|
| Similarity Threshold Selection | Directly affects true positive identification rates | Optimizes identification of meaningful structural patterns for cancer targets |
| Fingerprint Diversity | Multiple representations provide consensus validation | Enhances reliability for diverse chemotypes in oncology programs |
| Target-Ligand Interaction Profile | Incorporates biological context into confidence assessment | Critical for understanding polypharmacology in cancer therapeutics |
| Query Molecule Promiscuity | Accounts for inherent compound multitarget behavior | Essential for designing selective kinase inhibitors and PROTACs |
| Data Quality and Coverage | Determines statistical robustness of Bayesian analysis | Ensures reliable models despite noisy oncology screening data |
Experimental Protocols
Protocol 1: Establishing Fingerprint-Specific Similarity Thresholds
Purpose: To determine optimal similarity thresholds for different molecular fingerprint types used in Activity-Atlas model generation for oncology targets.
Materials and Reagents:
- Curated bioactivity dataset for oncology target of interest (minimum 50 compounds with measured IC50/Ki values)
- Computational chemistry software (RDKit, OpenEye, or Cresset Flare)
- High-performance computing cluster or workstation
Methodology:
- Library Preparation: Compile a reference library of known active compounds for your oncology target. Ensure data quality by maintaining only ligand-target pairs with strong bioactivity (IC50, Ki, Kd, or EC50 < 1 μM) and consistent measurements [54].
Fingerprint Generation: Calculate eight distinct molecular fingerprints for each compound using RDKit or equivalent package:
- AtomPair (encoding molecular shape based on atom pairs)
- Avalon (hashing algorithm-based fingerprint)
- ECFP4 (extended-connectivity fingerprint with diameter = 4)
- FCFP4 (functional-class fingerprint with diameter = 4)
- RDKit (topological fingerprint)
- Layered (combining multiple bond environments)
- MACCS (keyed fingerprint based on SMARTS patterns)
- Torsion (flexibility-focused fingerprint) [54]
Similarity Calculation: Perform all-by-all similarity comparisons within the dataset using Tanimoto coefficient or equivalent similarity metric for each fingerprint type.
Threshold Determination: Calculate fingerprint-specific similarity thresholds using leave-one-out cross-validation. Identify the threshold that maximizes both precision and recall for activity prediction, balancing the identification of true positives with filtering of background noise [54].
Validation: Validate established thresholds using an external test set of compounds with known activities. Measure performance using ROC-AUC analysis and precision-recall curves.
Expected Outcomes: Fingerprint-specific similarity thresholds that optimize activity cliff detection and SAR interpretation for your specific oncology target. Research indicates these thresholds vary significantly by fingerprint type and must be determined empirically rather than using universal values [54].
Protocol 2: Confidence Level Assessment for Activity-Atlas Models
Purpose: To quantify confidence levels in Activity-Atlas SAR predictions for oncology drug discovery applications.
Materials and Reagents:
- Aligned compound set with associated bioactivity data
- Cresset Forge software with Activity-Atlas module
- Python/R environment for statistical analysis
Methodology:
- Model Generation: Develop baseline Activity-Atlas models using the standard protocol, incorporating 'Activity Cliff Summary', 'Average of Actives', and 'Regions Explored' analyses [8].
Ensemble Modeling: Create multiple Activity-Atlas models using different fingerprint representations and similarity thresholds established in Protocol 1.
Consensus Analysis: Identify regions of concordance and discordance across the ensemble models. Calculate confidence scores based on the level of agreement between different models for specific molecular features and activity cliffs [54].
Cooperativity Assessment: For PROTACs and molecular degraders, quantify ternary complex stability using cooperativity factor (α), defined as the ratio of binary (POI/PROTAC or E3 ligase/PROTAC) and ternary (POI/PROTAC/E3 ligase) dissociation constants. Values α > 1 indicate positive cooperativity and higher confidence in degradation predictions [55].
Performance Validation: Correlate confidence scores with prediction accuracy using known test compounds. Establish confidence tiers (high, medium, low) based on empirical performance data.
Expected Outcomes: Quantified confidence metrics for Activity-Atlas predictions that enable oncology researchers to prioritize molecular designs and experimental validation efforts.
Table 2: Experimental Parameters for Similarity Threshold Determination
| Fingerprint Type | Bit Length | Recommended Initial Threshold | Key Applications in Oncology |
|---|---|---|---|
| ECFP4 | 1,024 | 0.45-0.55 | Kinase inhibitor profiling, general SAR analysis |
| FCFP4 | 1,024 | 0.40-0.50 | Functional group-centric SAR, scaffold hopping |
| AtomPair | 1,024 | 0.50-0.60 | Shape-based screening, conformational analysis |
| Avalon | 1,024 | 0.45-0.55 | Large database screening, virtual library design |
| MACCS | 166 | 0.85-0.95 | Rapid similarity searching, key feature identification |
| RDKit | 2,048 | 0.60-0.70 | General-purpose SAR, molecular property prediction |
| Layered | 1,024 | 0.55-0.65 | Detailed bond environment analysis |
| Torsion | 1,024 | 0.35-0.45 | Flexible molecule alignment, PROTAC linker optimization |
Computational Workflows and Visualization
Integrated Workflow for Parameter Optimization
The following diagram illustrates the comprehensive workflow for establishing optimal similarity thresholds and confidence levels in Activity-Atlas model generation:
Activity-Atlas Confidence Assessment Workflow
This diagram details the specific process for confidence level evaluation in Activity-Atlas models:
The Scientist's Toolkit: Research Reagent Solutions
Table 3: Essential Computational Tools for Similarity Threshold Optimization
| Tool/Resource | Type | Primary Function | Application in Parameter Selection |
|---|---|---|---|
| RDKit | Open-source Cheminformatics | Molecular fingerprint generation | Provides multiple fingerprint types for threshold determination |
| Cresset Flare | Commercial Software | 3D molecular alignment & field analysis | Activity-Atlas model generation with Bayesian analysis |
| ChEMBL Database | Bioactivity Repository | Curated compound-target interactions | Reference library construction for threshold optimization |
| BindingDB | Bioactivity Database | Protein-ligand binding affinities | High-quality reference data for similarity calculations |
| SCENIC | Computational Tool | Gene regulatory network reconstruction | Context for target-specific threshold adjustment [56] |
| Python Scikit-learn | Machine Learning Library | Performance metric calculation | ROC-AUC and precision-recall analysis for threshold validation |
| TCGA-BRCA | Cancer Genomics Database | Multi-omics cancer data | Oncology-specific context for model validation [56] |
Application in Oncology Drug Discovery
Case Study: TRPV1 Antagonist Analysis Using Activity Atlas
In a study analyzing 91 TRPV1 antagonists tested in two different assays (capsaicin-induced activation and pH-induced activation), traditional QSAR methods failed to generate robust predictive models due to complex data patterns [2]. However, the application of Activity-Atlas with optimized similarity thresholds enabled researchers to extract critical SAR insights through pairwise 3D comparisons across the dataset. The analysis revealed differential steric constraints that explained the disparate activities in the two assay formats, identifying that steric hindrance near the piperidine moiety was more critical for pH-induced inhibition [2]. This case demonstrates how appropriate parameter selection can uncover non-intuitive SAR patterns that would be missed by conventional approaches.
Integration with Multi-Omics Data in Breast Cancer Research
Recent advances in oncology research highlight the value of integrating computational SAR analysis with multi-omics data for enhanced predictive accuracy. In CDK4/6 inhibitor-treated breast cancer, studies have combined single-cell regulatory atlas data with multi-omics profiles to identify resistance-specific regulons and establish predictive indices for treatment response [56]. Such integrated approaches demonstrate how similarity thresholds and confidence measures from Activity-Atlas models can be contextualized within broader biological frameworks to improve their predictive power and clinical relevance in oncology applications.
The strategic selection of similarity thresholds and confidence levels represents a critical success factor in generating meaningful Activity-Atlas models for oncology-focused SAR analysis. By implementing the protocols and frameworks outlined in this application note, researchers can establish fingerprint-specific similarity thresholds that maximize the identification of true SAR patterns while filtering background noise, ultimately leading to more reliable activity predictions. The integration of confidence metrics based on model consensus and biological context provides an additional layer of interpretability, enabling more informed decision-making in oncology drug discovery programs. As AI technologies continue to advance their applications in cancer research [20], the principles of rigorous parameter optimization outlined here will remain fundamental to extracting maximum value from SAR data through Activity-Atlas methodologies.
Activity-atlas models are powerful computational tools that generate three-dimensional quantitative structure-activity relationship (3D-QSAR) maps to visualize and interpret the molecular features governing biological activity. In oncology research, these models are crucial for understanding the complex relationship between compound structure and anticancer efficacy, thereby guiding lead optimization in drug discovery campaigns. The generation of these models relies on aligning compounds with known biological activity to a common pharmacophore template and calculating molecular property fields across a defined 3D grid. These fields encapsulate steric, electrostatic, and hydrophobic characteristics that influence drug-target interactions and cellular responses. However, the process of creating and interpreting these complex 3D maps introduces two significant challenges: statistical overfitting, which occurs when models memorize training data noise rather than learning generalizable patterns, and spatial misassignment, where molecular features are incorrectly correlated with biological activity due to improper alignment or conformational sampling. These pitfalls can severely compromise model predictability and lead to costly misdirection in experimental follow-up, making their avoidance fundamental to reliable SAR analysis.
Quantitative Foundations of Activity-Atlas Modeling
The development of robust activity-atlas models requires careful management of dataset composition and validation metrics. The following table summarizes key quantitative parameters essential for maintaining model integrity.
Table 1: Key Quantitative Parameters for Robust 3D-QSAR Model Development
| Parameter | Recommended Value/Range | Purpose in Model Validation | Consequence of Deviation |
|---|---|---|---|
| Training Set Size | 40-70 compounds (stratified by activity) [12] | Ensures sufficient data for pattern learning | High risk of overfitting with smaller sets; computationally expensive with larger sets |
| Test Set Size | ~20-30% of total dataset [12] | Provides unbiased evaluation of predictive performance | Optimistic performance estimation if too small; reduced training data if too large |
| Regression Coefficient (r²) | ≥ 0.9 [12] | Measures goodness-of-fit of the model to training data | Poor explanatory power of the model, potential underfitting |
| Cross-Validated Coefficient (q²) | ≥ 0.5-0.6 [12] | Estimates model predictability via Leave-One-Out (LOO) cross-validation | Poor generalizability, high risk of overfitting |
| Number of PLS Components | Optimized to avoid overfitting [12] | Balances model complexity with predictive power | Increased components can lead to overfitting the training set noise |
| Field Grid Spacing | 1.0 Å [12] | Defines resolution for molecular field calculations | Coarser spacing loses structural nuances; finer spacing increases noise and overfitting risk |
Adherence to these quantitative benchmarks provides a foundational safeguard against overfitting. For instance, in a 3D-QSAR study on Maslinic acid analogs for activity against the MCF-7 breast cancer cell line, a model with an r² of 0.92 and a q² of 0.75 demonstrated acceptable predictive capability, successfully balancing fit with generalizability [12]. The leave-one-out (LOO) cross-validation technique is particularly vital in this context, as it involves iterative training on all data points except one, which is then used for testing, thereby offering a robust estimate of how the model will perform on novel compounds [12].
Core Challenges: Overfitting and Misassignment
The Problem of Overfitting
Overfitting represents a fundamental statistical peril in 3D-QSAR modeling. It arises when a model learns the intricate noise and random fluctuations unique to the training dataset instead of the underlying relationship between molecular structure and biological activity. Such an overfitted model will exhibit excellent performance on its training data but will fail catastrophically when predicting new, unseen compounds, providing a false sense of confidence to researchers [57]. The risk is exacerbated in bioinformatics and multi-omics data analysis, where the number of features (e.g., molecular descriptors, omics measurements) is often vastly greater than the number of samples (e.g., patients, compounds), a scenario directly applicable to the high-dimensional field points generated in activity-atlas modeling [58]. Furthermore, the presence of intermodality and intramodality correlations within the data can further increase the likelihood of models overfitting [58].
The Problem of Misassignment
Misassignment, or the incorrect attribution of a molecular feature to a region of biological importance, undermines the interpretive value of activity-atlas models. This error often stems from two sources: conformational misassignment and alignment misassignment. Conformational misassignment occurs when the model is built using a non-bioactive conformation of the molecule, leading to an inaccurate representation of its true interaction with the biological target. Alignment misassignment happens when molecules within the training set are incorrectly superimposed onto the pharmacophore template, causing their critical functional groups to be placed in wrong spatial regions of the 3D map. The consequence is a flawed activity-atlas that highlights irrelevant molecular regions and obscures the true determinants of activity, ultimately misguiding medicinal chemistry efforts.
Experimental Protocol for Robust Activity-Atlas Generation
This protocol outlines a standardized workflow for generating and validating 3D activity-atlas models for SAR analysis in oncology, with integrated steps to mitigate overfitting and misassignment.
Phase I: Data Curation and Conformational Analysis
- Dataset Compilation: Assemble a minimum of 50 structurally diverse analogs with consistent, quantitative biological data (e.g., IC₅₀, Ki) from a single assay. The activity range should span at least three orders of magnitude.
- Chemical Structure Preparation:
- Bioactive Conformation Hunt:
- Use a field-based molecular similarity method (e.g., via FieldTemplater or analogous software) to identify a common pharmacophore from a subset of highly active and rigid compounds [12].
- This step is critical to avoid conformational misassignment. The derived hypothesis, annotated with its calculated field points (positive/negative electrostatic, shape, hydrophobic), serves as the bioactive template [12].
Phase II: Model Training and Validation
- Compound Alignment and Field Calculation:
- Data Splitting:
- Partition the dataset into a training set (≈70-80%) and a test set (≈20-30%) using an activity-stratified sampling method to ensure both sets represent the entire activity range [12]. This is a primary defense against overfitting.
- Model Construction:
- Use the Partial Least Squares (PLS) regression algorithm to build the QSAR model, with the molecular field descriptors as independent variables and the pIC₅₀ (-logIC₅₀) values as the dependent variable [12].
- Determine the optimal number of PLS components by monitoring the cross-validated correlation coefficient (q²) to prevent overfitting.
- Model Validation:
- Internal Validation: Perform Leave-One-Out (LOO) cross-validation on the training set to calculate the q² value. A q² > 0.5 is considered predictive [12].
- External Validation: Use the held-out test set to evaluate the model's predictive power. The predictive r² (r²ₚᵣₑ𝒹) should be > 0.5 [12].
- Y-Scrambling: Perform Y-scrambling (e.g., 50 iterations) to ensure the model is not the result of a chance correlation [12].
Phase III: Atlas Interpretation and Visualization
- Activity-Atlas Generation: Use the validated model to generate 3D contour maps visualizing regions where specific molecular properties (steric bulk, electropositive/negativity, hydrophobicity) favorably or unfavorably influence biological activity.
- SAR Interpretation: Correlate the contours with specific chemical substructures of lead compounds to derive actionable SAR insights for lead optimization.
Diagram Title: Activity-Atlas Generation & Validation Workflow
The Scientist's Toolkit: Essential Research Reagents and Solutions
Successful execution of the experimental protocol requires a suite of specialized computational tools and data resources. The following table details key components of the research toolkit.
Table 2: Essential Research Reagents and Computational Solutions for 3D-QSAR
| Tool/Reagent Category | Specific Examples | Function in Protocol |
|---|---|---|
| Structure Modeling & Optimization | ChemBio3D [12], XED Force Field [12] | Converts 2D chemical structures to 3D and performs energy minimization to achieve low-energy, stable conformations. |
| Pharmacophore Generation & Alignment | FieldTemplater [12], Forge [12] | Identifies common 3D pharmacophores from active compounds and aligns the entire dataset to this template to prevent misassignment. |
| Molecular Field Calculator | Forge QSAR Module [12] | Calculates steric, electrostatic, and hydrophobic interaction fields around the aligned molecules on a 3D grid. |
| Statistical Modeling & Validation | Partial Least Squares (PLS) [12], LOO Cross-Validation [12] | Builds the regression model linking molecular fields to activity and rigorously tests its internal and external predictability. |
| Reference Biological Datasets | The Cancer Genome Atlas (TCGA) [58], ZINC Database [12] | Provides clinical, genomic, and transcriptomic data for context (TCGA) and source compounds for virtual screening (ZINC). |
| 3D Visualization Software | Forge, PyMOL, MOE | Generates and interprets the final 3D contour maps of the activity-atlas, allowing visual inspection of SAR. |
Advanced Strategies for Multimodal Data Integration
The principles of avoiding overfitting and misassignment extend beyond traditional 3D-QSAR into modern multimodal oncology research. Initiatives like the Human Tumor Atlas Network (HTAN) are generating rich, multi-dimensional datasets that include spatial transcriptomics, proteomics, and clinical information to map tumor evolution and microenvironment interactions in 3D space [59] [60]. Integrating such diverse data types poses challenges analogous to combining multiple molecular fields in QSAR.
In these high-dimensional, low-sample-size settings, late fusion—where models are built on each data modality separately and their predictions are combined—has been shown to consistently outperform single-modality approaches and be more robust against overfitting compared to early fusion (raw data concatenation) [58]. This is because late fusion naturally weighs each modality based on its informativeness without being affected by the highly imbalanced dimensionalities across different data types [58]. Furthermore, the use of ensemble survival models like gradient boosting or random forests, which have inherent regularization properties, can outperform deep neural networks on such structured, tabular multi-omics data, thereby reducing overfitting risk [58].
Diagram Title: Late Fusion Architecture for Robust Integration
The generation and interpretation of complex 3D maps for SAR analysis demand rigorous methodological discipline to avoid the twin pitfalls of overfitting and misassignment. By adhering to standardized protocols that emphasize rigorous validation through data splitting and cross-validation, employing careful conformational analysis and alignment, and leveraging robust data fusion strategies, researchers can build predictive and interpretable models. These disciplined computational approaches are foundational for translating complex 3D spatial and structural data into reliable, actionable insights for oncology drug discovery.
Leveraging Machine Learning to Enhance Prediction Speed and Accuracy
In modern oncology drug discovery, the integration of machine learning (ML) with Structure-Activity Relationship (SAR) analysis is revolutionizing how researchers identify and optimize novel therapeutic compounds. Activity-atlas model generation represents a powerful approach for extracting critical, non-intuitive insights from complex and noisy biological data, particularly for challenging oncology targets where structural information may be limited. By applying advanced ML algorithms to multi-dimensional data, researchers can significantly accelerate the prediction of compound activity while improving model accuracy, thereby streamlining the entire drug discovery pipeline from initial screening to lead optimization. This protocol details the methodology for constructing and validating these ML-driven activity-atlas models, with specific applications in oncology research.
Key Concepts and Background
Activity-Atlas for SAR Analysis: Activity-atlas modeling is a ligand-based computational approach that uses a Bayesian framework to analyze 3D molecular alignments, creating a qualitative visualization of activity cliffs—regions where structurally similar molecules exhibit significant differences in biological activity [2] [1]. This method is particularly valuable for ion channel targets in oncology, such as TRPV1, which are dynamic proteins with few solved ligand-bound structures [2]. By mapping electrostatic, hydrophobic, and shape features of active compounds, activity-atlas models identify key molecular regions that correlate with higher anticancer activity, providing medicinal chemists with actionable insights for compound optimization [61].
Machine Learning Paradigms in Drug Discovery: The application of ML in drug discovery spans multiple paradigms, each offering distinct advantages:
- Supervised Learning: Currently dominates the market (~40% share) with applications in predicting drug activity and properties using labeled datasets to identify patterns between molecular characteristics and favorable outcomes [62].
- Deep Learning: Emerging as the fastest-growing segment, enabling structure-based predictions, protein modeling (e.g., AlphaFold), and de novo design of novel drug candidates with desired features [62].
- Real-time ML: Represents an advanced approach where models analyze data on-the-fly, with applications ranging from online prediction with batch features to continual learning systems that adapt incrementally to new data [63].
Table 1: Machine Learning Approaches in Drug Discovery
| Algorithm Type | Market Share (2024) | Primary Applications in Oncology | Key Advantages |
|---|---|---|---|
| Supervised Learning | 40% | Drug-target interaction prediction, Activity classification | Works well with labeled datasets, Clear pattern recognition |
| Deep Learning | Fastest growing | Protein structure prediction, De novo drug design | Handles complex unstructured data, Enables molecular generation |
| Unsupervised Learning | Not specified | Molecular clustering, Subtype identification | Discovers hidden patterns without labeled data |
| Real-time ML | Emerging | Adaptive clinical trials, Dynamic treatment optimization | Instant predictions, Adapts to new data continuously |
ML-Driven Activity-Atlas Generation for Oncology Targets
Data Collection and Curation
Oncology Multi-Omics Data Integration: Modern activity-atlas models benefit tremendously from integrating multiple data modalities. The MLOmics database provides a valuable resource containing 8,314 patient samples across 32 cancer types with four omics types: mRNA expression, microRNA expression, DNA methylation, and copy number variations [64]. For SAR analysis, molecular data should be supplemented with compound activity data (e.g., IC50 values from anticancer assays) and structural descriptors.
Compound Datasets for SAR Analysis: Collect a training dataset of compounds with known anticancer activity from literature and experimental sources. For example, in developing a 3D-QSAR model for maslinic acid analogs against breast cancer, researchers collected 74 compounds with known MCF7 cell line IC50 values [61]. The activity data should be converted to pIC50 values [-log(IC50)] for modeling. Divide compounds into training (e.g., 47 compounds) and test sets (e.g., 27 compounds) using activity stratification to ensure representative distribution [61].
Molecular Featurization and Conformational Analysis
3D Molecular Field Calculation: Generate three-dimensional structures from 2D chemical representations using tools like ChemBio3D [61]. Calculate molecular fields using the eXtended Electron Distribution (XED) force field in software such as Forge, which generates four critical field types: positive electrostatic, negative electrostatic, shape (van der Waals), and hydrophobic fields [61]. These fields capture the essential electronic and steric properties governing molecular interactions.
Pharmacophore Generation and Molecular Alignment: Use the FieldTemplater module to identify bioactive conformations and create a pharmacophore hypothesis from a subset of highly active compounds [61]. Align all training set compounds to this template based on field and shape similarity. This alignment creates a consistent reference frame for comparing molecular features across the entire dataset, which is fundamental for building predictive activity-atlas models.
Machine Learning Model Development
Bayesian Activity-Atlas Modeling: Implement a Bayesian approach to identify which steric and electronic properties correlate with higher activity [2] [1]. This method analyzes pairwise 3D comparisons across the dataset to detect activity cliffs—situations where similar compounds exhibit significant activity differences. The output is a composite picture showing favorable electrostatic and steric regions across the molecular alignment [2].
3D-QSAR Model Construction: Using the aligned compounds and their field point descriptors, develop a 3D-QSAR model with Partial Least Squares (PLS) regression, employing the SIMPLS algorithm [61]. Set the maximum number of components to 20 and use both electrostatic and volume fields as descriptors. Validate the model using leave-one-out (LOO) cross-validation, which is particularly effective with small datasets [61].
Table 2: Performance Metrics for ML Models in Cancer Research
| Model Type | Application | Key Metrics | Performance |
|---|---|---|---|
| 3D-QSAR PLS | Maslinic acid analogs for breast cancer | r², q² (LOO cross-validated) | r² = 0.92, q² = 0.75 [61] |
| Deep Learning Encoder-Decoder | SAR prediction for hyperthermia treatment | RMSE, MAE, SSIM | RMSE: 3.3 W/kg (whole brain), 4.8 W/kg (target regions); SSIM: 0.90 [65] |
| Multimodal Late Fusion | Cancer survival prediction | C-index | Outperformed single-modality approaches [58] |
| Transcriptome Classifier | Pediatric cancer atlas | Diagnostic accuracy | Refined or matched diagnosis for 85% of patients [66] |
Diagram 1: Activity-Atlas Modeling Workflow. This workflow illustrates the integrated process from multi-omics data collection to actionable SAR insights.
Experimental Protocols
Protocol: Building a 3D-QSAR Activity-Atlas Model
Materials and Software Requirements:
- Chemical Compounds: A set of 50-100 compounds with known anticancer activity values (e.g., IC50 against specific cancer cell lines)
- Computational Software: Forge V10 (Cresset) or equivalent 3D-QSAR software package
- Hardware: Workstation with sufficient processing power for molecular field calculations (multi-core CPU, 16+ GB RAM)
- Data Sources: Access to cancer multi-omics databases such as MLOmics or TCGA for complementary biological context [64]
Step-by-Step Procedure:
- Data Preparation and Conformation Hunting:
- Convert 2D compound structures to 3D using ChemBio3D or similar tools
- For each compound, generate multiple low-energy conformations using the XED force field with a gradient cut-off of 0.1 [61]
- Select the most active compounds (typically 3-5) as potential templates for alignment
Pharmacophore Template Generation:
- Use the FieldTemplater module to create a hypothesis based on field and shape information from selected template compounds
- Annotate the resulting hypothesis with calculated field points to generate a 3D field point pattern
- This pattern provides a condensed representation of the shape, electrostatics, and hydrophobicity of active compounds
Molecular Alignment:
- Align all training set compounds to the pharmacophore template using Forge's alignment capabilities
- Use 50% field similarity and 50% Dice volume similarity for optimal overlay [61]
- Select the best-matching low-energy conformations for each compound for QSAR modeling
3D-QSAR Model Development:
- Use field point-based descriptors to build the QSAR model after alignment
- Set the maximum number of PLS components to 20 and sample point maximum distance to 1.0 Å
- Include both electrostatic and volume fields in the model
- Convert experimental activity (IC50) to pIC50 [-log(IC50)] as the dependent variable
Model Validation and Activity-Atlas Generation:
- Perform leave-one-out cross-validation with 50 Y-scrambles to validate model robustness [61]
- Generate activity-atlas models using the Bayesian approach to visualize:
- Average of actives (common features in active compounds)
- Activity cliff summary (positive/negative electrostatics, favorable/unfavorable hydrophobicity)
- Regions explored analysis (molecular space covered by the dataset)
Protocol: Multimodal Data Integration for Enhanced Predictions
Materials and Software Requirements:
- Multi-omics Data: Processed datasets from MLOmics or similar resources containing genomic, transcriptomic, epigenomic, and clinical data [64]
- Programming Environment: Python with scikit-learn, PyTorch/TensorFlow, and specialized libraries like the AZ-AI multimodal pipeline [58]
- Computational Resources: Cloud-based or high-performance computing infrastructure for processing large datasets
Step-by-Step Procedure:
- Data Preprocessing and Feature Selection:
- For each modality (e.g., mRNA, miRNA, methylation, CNV), perform modality-specific preprocessing:
- Apply supervised feature selection methods (Pearson/Spearman correlation) to reduce dimensionality while accounting for right-censoring in survival data [58]
Late Fusion Model Implementation:
- Train separate models for each data modality using gradient boosting or random forest algorithms, which typically outperform deep neural networks on tabular omics data [58]
- Implement late fusion by combining predictions from individual modality-specific models rather than concatenating features at the input level
- Weight each modality's contribution based on its informativeness, overcoming challenges of highly imbalanced dimensionalities across modalities [58]
Model Validation and Interpretation:
- Evaluate models using multiple random train-test splits rather than single splits to account for uncertainty [58]
- Report C-indices with confidence intervals for survival predictions
- Compare multimodal performance against unimodal benchmarks to verify that integration actually improves predictions
- Utilize model interpretation techniques to identify influential features across modalities and generate biological insights
Diagram 2: Multimodal Late Fusion Architecture. This approach combines predictions from modality-specific models to enhance accuracy and robustness.
Table 3: Essential Research Reagents and Computational Tools
| Resource Category | Specific Tools/Platforms | Key Functionality | Application in Oncology SAR |
|---|---|---|---|
| 3D-QSAR Software | Forge (Cresset) | Field-based molecular alignment, Bayesian activity-atlas generation, 3D-QSAR modeling | Identify key electrostatic and steric features driving anticancer activity [2] [61] |
| Multi-omics Databases | MLOmics, TCGA via GDC Data Portal | Unified multi-omics data (mRNA, miRNA, methylation, CNV) across cancer types | Provide biological context for compound activity; enable multimodal prediction models [64] |
| Machine Learning Pipelines | AZ-AI Multimodal Pipeline (Python) | Preprocessing, feature reduction, multimodal fusion, survival modeling | Integrate diverse data types for improved survival predictions [58] |
| Molecular Databases | ZINC Database, PubChem | Source of compound structures for virtual screening and lead optimization | Identify potential inhibitors through similarity searching and virtual screening [61] |
| Cloud Computing Platforms | Cloud-based ML solutions (70% market share) | Handle large datasets, facilitate collaboration, scale computational resources | Manage resource-intensive ML training and molecular simulations [62] |
The integration of machine learning with activity-atlas modeling represents a paradigm shift in oncology drug discovery, enabling researchers to extract meaningful insights from complex SAR data that traditional methods might miss. The protocols outlined herein provide a comprehensive framework for developing predictive models that enhance both the speed and accuracy of compound optimization. As ML methodologies continue to advance—particularly in deep learning and real-time adaptive systems—their impact on oncology research will only intensify. By adopting these sophisticated computational approaches, research teams can accelerate the identification of novel therapeutic candidates, optimize lead compounds with greater precision, and ultimately contribute to more effective personalized cancer treatments. The future of oncology drug discovery lies in the seamless integration of multimodal data with advanced ML-driven SAR analysis, creating a more efficient and targeted approach to addressing the complexity of cancer.
Validating and Benchmarking Activity Atlas Against Experimental and Computational Methods
Within oncology drug discovery, robust model validation is the cornerstone that bridges computational predictions and biological efficacy. The generation of activity-atlas models for Structure-Activity Relationship (SAR) analysis provides a powerful, visual framework for understanding the key molecular features governing anticancer activity. However, the predictive power of these computational models hinges entirely on rigorous experimental validation using techniques ranging from reporter gene assays, which illuminate cellular signaling pathways, to more complex in vitro testing that better recapitulates the tumor microenvironment [67] [12]. This application note provides detailed protocols for validating activity-atlas models, focusing on practical methodologies for researchers and drug development professionals. We frame these techniques within a unified workflow, emphasizing how each validation step feeds back into the refinement of SAR models, thereby creating an iterative cycle for lead optimization in oncology.
Reporter Gene Assays for Signaling Pathway Validation
Reporter gene systems serve as molecular sensors, allowing researchers to track specific signaling pathway activity in near real-time. They are particularly valuable for validating targets identified by activity-atlas models, such as those involved in IL-6 trans-signaling or stemness pathways, which are critical in cancer progression and therapy resistance [68] [69].
Protocol: Development and Application of a Stable Reporter Cell Line for IL-6 Trans-Signaling Inhibition
This protocol details the establishment of a CHO/SIE-Luc reporter cell line to measure the potency of an sgp130-Fc biomolecule, an inhibitor of IL-6 trans-signaling, a pathway implicated in chronic inflammation and cancer [68].
Key Research Reagent Solutions Table 1: Essential reagents for the CHO/SIE-Luc reporter assay.
| Reagent/Material | Function/Description | Optimal Working Concentration/Details |
|---|---|---|
| CHO-K1 Cells | Host cell line; lacks IL-6Rα, making it specific for IL-6 trans-signaling. | N/A |
| pGL4.47 [luc2p/SIE/Hygro] Plasmid | Reporter construct; SIE element drives luciferase expression. | Purified, endotoxin-free |
| IL-6/sIL-6Rα Complex | Activator; induces IL-6 trans-signaling and luciferase production. | 0.5 μg/mL IL-6 + 0.25 μg/mL sIL-6Rα |
| sgp130-Fc (Test Article) | Inhibitor; specifically blocks IL-6 trans-signaling. | Serial dilution (40-5000 ng/mL range) |
| Hygromycin B | Selective antibiotic for stable cell line maintenance. | Concentration to be determined for the cell line |
| Luciferase Assay Kit | Detection; provides substrate for luminescence measurement. | Compatible with cell culture format |
Methodology:
- Cell Line Development: Transfect CHO-K1 cells with the pGL4.47 [luc2p/SIE/Hygro] plasmid using a standard method (e.g., lipofection). Select stable clones under hygromycin B pressure.
- Clone Selection: Screen positive clones for a high signal-to-background ratio. Stimulate with the IL-6/sIL-6Rα complex (0.5 μg/mL IL-6 + 0.25 μg/mL sIL-6Rα) and measure luciferase activity. Select clones that show strong induction and are effectively inhibited by sgp130-Fc. The D23 (CHO/SIE-Luc) clone was selected for its balanced dose-response and stability [68].
- Assay Execution:
- Plate CHO/SIE-Luc cells in a 96-well plate at a density of 30,000 cells per well in an assay medium containing 10% FBS.
- Pre-incubate serial dilutions of the sgp130-Fc test article with the IL-6/sIL-6Rα complex for 1 hour at 37°C.
- Add the pre-incubated mixture to the plated cells.
- Incubate the assay plate for 7 hours at 37°C, 5% CO₂.
- Develop the luciferase signal according to the manufacturer's instructions and measure luminescence.
- Data Analysis: Plot the luminescence signal against the log concentration of sgp130-Fc. Fit the data to a four-parameter logistic model to determine the IC₅₀ value (typically ~500 ng/mL for sgp130-Fc). The assay demonstrates a linear range from 40 to 5000 ng/mL [68].
Reporter genes under the control of promoters for stemness factors (e.g., NANOG, SOX2, OCT4) or markers like ALDH1A1 are used to identify, track, and isolate CSCs, a subpopulation critical for tumor initiation and drug resistance [69].
Methodology:
- Construct Design: Clone the promoter region of a CSC-associated gene (e.g., NANOG, SOX2, ALDH1A1) upstream of a reporter gene like GFP or luciferase in a lentiviral vector.
- Cell Transduction: Transduce the target cancer cell line (e.g., MCF-7) with the reporter construct.
- CSC Monitoring: Use Fluorescence-Activated Cell Sorting (FACS) to isolate the GFP+ population or bioluminescence imaging to track CSC dynamics in response to drug treatment in vitro and in vivo.
- Validation: Correlate reporter activity with established CSC functional assays, such as spheroid formation and in vivo tumor initiation capacity [69].
AdvancedIn VitroModel Systems for Phenotypic Validation
While 2D monolayers are useful for initial screening, 3D culture models offer a more physiologically relevant context for validating compound efficacy predicted by activity-atlas models, as they better mimic the tumor architecture, cell-cell interactions, and drug penetration barriers [70].
Protocol: Establishing 3D Tumor Spheroid Co-Culture Models
This protocol outlines methods for generating 3D spheroids of breast cancer cells (e.g., MCF-7) with stromal co-cultures to assess the cytotoxic effects of predicted active compounds [70].
Key Research Reagent Solutions Table 2: Essential reagents for establishing 3D in vitro models.
| Reagent/Material | Function/Description | Application Notes |
|---|---|---|
| MCF-7 Cells (GFP-tagged) | ER+ breast cancer cell line. | Maintains ER expression during treatment. |
| Human Dermal Fibroblasts (HDFs, RFP-tagged) | Stromal component; produces collagen. | Surrogate for cancer-associated fibroblasts (CAFs). |
| Ultra-Low Attachment (ULA) Plates | Prevents cell adhesion, forcing spheroid formation. | U-bottom 96- or 384-well plates. |
| Matrigel / Collagen I | Extracellular matrix (ECM) substitutes. | Provides a scaffold for embedded 3D culture. |
| Alginate Hydrogel | Inert polymer for microencapsulation. | Used in stirred-tank bioreactor cultures. |
Methodology:
- 3D Model Setup (Floater Method):
- Prepare a single-cell suspension of MCF-7 cells, with or without HDFs (e.g., 1:1 ratio).
- Seed the cell suspension into U-bottom 96-well plates (e.g., 100-200 μL per well).
- Centrifuge the plate at a low speed (e.g., 500 x g for 5 minutes) to aggregate cells at the well bottom.
- Incubate at 37°C, 5% CO₂ for 3-5 days, allowing spheroid formation.
- 3D Model Setup (ECM-Embedded Method):
- Suspend cells in a chilled Matrigel/Collagen I mixture (e.g., 4 mg/mL Matrigel, 1.5 mg/mL Collagen I, pH 7.1-7.4).
- Plate the cell-ECM suspension into a culture plate and polymerize at 37°C for 30-60 minutes.
- Overlay with complete culture medium.
- Compound Treatment & Analysis:
- After spheroids are formed (day 3-5), add serial dilutions of the test compound.
- Refresh the medium and compound every 2-3 days.
- Monitor growth and viability over time using fluorescence-based methods (if cells are tagged) or ATP-based assays (e.g., CellTiter-Glo 3D).
- At endpoint, fix spheroids and process for immunohistochemistry (IHC) analysis of proliferation (Ki-67), apoptosis (cleaved caspase-3), or other relevant biomarkers [70].
Integrating Validation Data into Activity-Atlas Models
The ultimate goal of experimental validation is to refine the computational models, creating a predictive feedback loop. Quantitative data from the above protocols are used to validate and improve the 3D-QSAR models.
Protocol: 3D-QSAR Model Building and Validation Using Experimental IC₅₀ Data
This protocol describes the construction of a field-based 3D-QSAR model, a type of activity-atlas model, using a dataset of compounds with experimentally determined IC₅₀ values against a target like the MCF-7 cell line [67] [12].
Methodology:
- Data Collection and Preparation:
- Curate a training set of compounds (e.g., 74 maslinic acid analogs) with reliable experimental pIC₅₀ (pIC₅₀ = -logIC₅₀) values from in vitro assays [12].
- Convert 2D chemical structures into 3D conformations using software like ChemBio3D.
- Pharmacophore Generation and Alignment:
- Use software such as Forge's FieldTemplater to identify a common pharmacophore from the most active compounds. This generates a 3D field point pattern representing key steric, electrostatic, and hydrophobic features [12].
- Align all training set compounds to this pharmacophore template.
- Model Development:
- Use the Partial Least Squares (PLS) regression method on the field point-based descriptors to build the QSAR model.
- Partition the data into a training set (e.g., ~70-80% of compounds) and a test set (e.g., ~20-30%) to validate predictive ability.
- Model Validation:
- Internal Validation: Perform Leave-One-Out (LOO) cross-validation on the training set to calculate the cross-validated regression coefficient (q²). A value > 0.5 is generally acceptable [67] [12].
- External Validation: Use the test set to calculate the predictive regression coefficient (r²pred), demonstrating the model's ability to predict new compounds.
- Activity-Atlas Visualization: Generate 3D activity-atlas maps that visualize the average molecular fields of active compounds, highlighting regions where specific electrostatic or hydrophobic features correlate with high activity. This provides a visual guide for medicinal chemists to design new analogs [12].
Table 3: Summary of 3D-QSAR model validation metrics from literature examples.
| Study Compound Series | Biological Endpoint | Model Statistics (r² / q²) | Key Validated Experimental Assay |
|---|---|---|---|
| Maslinic Acid Analogs [12] | Anticancer activity vs. MCF-7 | 0.92 / 0.75 | MCF-7 cell viability (2D/3D) |
| Imidazole Derivatives [67] | Anticancer activity vs. MCF-7 | 0.81 / 0.51 | MCF-7 cell viability, Target-specific docking |
In modern oncology drug discovery, computational methods are indispensable for elucidating Structure-Activity Relationships (SAR) and prioritizing compounds for synthesis and testing [71] [72]. Among these methods, Activity Atlas, molecular docking, and Quantitative Structure-Activity Relationship (QSAR) modeling represent distinct yet complementary approaches. Activity Atlas provides a ligand-based, qualitative visualization of SAR, molecular docking offers a structure-based prediction of binding modes, and QSAR delivers a quantitative predictive model of activity [2] [72]. This application note benchmarks these methodologies within the context of oncology research, providing detailed protocols and a comparative analysis to guide researchers in selecting and implementing the appropriate tool for their SAR challenges.
Comparative Performance Analysis
The table below summarizes the core characteristics, strengths, and limitations of each method, providing a framework for selection based on research objectives.
Table 1: Benchmarking Activity Atlas, Molecular Docking, and QSAR
| Feature | Activity Atlas | Molecular Docking | QSAR (3D) |
|---|---|---|---|
| Primary Approach | Ligand-based, 3D-SAR visualization [2] | Structure-based, protein-ligand interaction simulation [71] [72] | Ligand-based, quantitative statistical model [61] [73] |
| Data Requirement | Set of ligands with biological activities [2] [1] | 3D Structure of the target protein [71] [72] | Set of ligands with biological activities for training [72] [73] |
| Key Output | 3D maps of favorable/unfavorable electrostatic, hydrophobic, and steric features [2] [61] | Predicted binding pose, orientation, and affinity score [71] [72] | Mathematical model (equation) predicting activity from molecular descriptors [61] [73] |
| Strengths | Identifies "activity cliffs"; provides intuitive visual guidance for chemists [2] [1] | Does not require a training set of ligands; provides atomic-level binding insights [72] | Strong predictive power for structurally related compounds; quantifies contribution of molecular features [72] [73] |
| Limitations | Qualitative in nature; dependent on the quality and alignment of the input ligand set [2] | Scoring functions may not correlate well with experimental affinity; requires a protein structure [72] | Predictive power limited to compounds similar to the training set; sensitive to molecular alignment (3D-QSAR) [72] [73] |
| Ideal Use Case in Oncology | Understanding complex SAR for targets with limited structural data (e.g., ion channels) or optimizing a lead series [2] [1] | Virtual screening of large compound libraries against a known oncology target (e.g., kinase, protease) [74] [75] [72] | Predicting and optimizing the potency of a congeneric series of oncology drug candidates (e.g., tankyrase or protease inhibitors) [74] [61] [75] |
The following diagram illustrates the logical decision-making process for selecting the most appropriate computational method based on the research context and available data.
Experimental Protocols
Protocol for Activity Atlas Model Generation
This protocol is adapted from studies analyzing SARS-CoV-2 main protease inhibitors and TRPV1 antagonists, which are directly applicable to oncology targets like kinases and proteases [74] [2].
1. Data Curation:
- Compound Selection: Assemble a congeneric series of 20-100 compounds with reliably measured biological activity (e.g., IC₅₀, Ki) from the literature [74] [61]. The activity range should cover at least 3 orders of magnitude.
- Structure Preparation: Convert 2D compound structures (e.g., SDF files) into 3D models. Generate multiple low-energy conformers for each compound using software like Forge and the XED (eXtended Electron Distribution) force field [74] [61].
2. Molecular Alignment:
- Template Generation: Use the FieldTemplater module (Cresset) to identify a common pharmacophore from a subset of highly active and diverse compounds. This template encodes key electrostatic, hydrophobic, and shape features [74] [61].
- 3D Superimposition: Align all compounds in the dataset to the generated field template, ensuring they are in a putative bioactive conformation [74].
3. Activity Atlas Calculation:
- Field Calculation: For each aligned molecule, calculate molecular interaction fields (positive/negative electrostatic, hydrophobic, shape) [74] [2].
- Bayesian Analysis: Execute the Activity Atlas algorithm (e.g., in Forge software). This uses a Bayesian framework to analyze all pairwise 3D comparisons across the dataset, identifying regions where specific molecular properties correlate with high activity [2] [1].
- Output Generation: Generate the three primary Activity Atlas models:
- Average of Actives: Shows the common features shared by the most active compounds.
- Activity Cliff Summary: Maps regions where small structural changes lead to large activity differences, highlighting favorable (green/maroon) and unfavorable (yellow/blue) regions for steric and electrostatic properties, respectively [2] [61].
- Regions Explored: Visualizes the chemical space thoroughly probed by the current dataset, identifying unexplored areas for novel compound design [2].
The workflow for this protocol is summarized in the following diagram.
Protocol for Integrated QSAR and Molecular Docking
This integrated protocol, commonly used in oncology drug discovery for targets like tankyrase and breast cancer-associated enzymes, leverages the strengths of both methods [61] [75].
1. 3D-QSAR Model Development:
- Training Set Alignment: Align a training set of compounds with known activity using a common scaffold (e.g., Bemis-Murcko) or a crystallized reference ligand from the protein target [61] [75] [73].
- Descriptor Calculation & Model Building: Calculate 3D molecular field descriptors (e.g., using CoMFA or CoMSIA) on a grid surrounding the aligned molecules. Use Partial Least Squares (PLS) regression to build a model correlating these descriptors with biological activity [61] [75] [73].
- Model Validation: Validate the model rigorously using Leave-One-Out (LOO) cross-validation (reported as q²) and an external test set of compounds not used in training. A robust model typically has q² > 0.5 and a high correlation coefficient (r²) for the test set [61] [75].
2. Structure-Based Validation with Docking:
- Protein Preparation: Obtain the 3D structure of the target (e.g., from PDB: 6SOU for Tankyrase). Remove native ligands, add hydrogen atoms, and assign correct protonation states in software like Flare or Schrödinger Suite [75].
- Docking Validation: Dock the training set compounds and known active controls into the binding site. Validate the docking protocol by confirming it can reproduce the binding pose of a co-crystallized ligand (typically with a root-mean-square deviation, RMSD, < 2.0 Å) [74] [75].
- Consensus Scoring: Use the QSAR model to predict the activity of newly designed compounds and use molecular docking to validate their binding mode and complementarity with the protein active site, prioritizing compounds that score well in both analyses [75] [72].
The Scientist's Toolkit
The table below lists essential software and resources required to implement the protocols described in this note.
Table 2: Research Reagent Solutions for Computational SAR Analysis
| Tool / Resource | Function | Application Example |
|---|---|---|
| Forge (Cresset) | Software for small-molecule modeling, including FieldTemplater, Activity Atlas, and 3D-QSAR [2] [61]. | Generating field-based pharmacophores and Activity Atlas models for SARS-CoV-2 main protease inhibitors [74]. |
| Flare (Cresset) | Software for structure-based design, enabling ensemble molecular docking and free energy calculations [74]. | Studying protein-ligand interactions and solvation effects for marine drugs against SARS-CoV-2 [74]. |
| Protein Data Bank (PDB) | Repository for 3D structural data of proteins and nucleic acids [75]. | Sourcing the crystal structure of targets like Tankyrase (e.g., PDB 6SOU) for docking studies [75]. |
| ZINC Database | Publicly available database of commercially available compounds for virtual screening [61]. | Sourcing novel maslinic acid analogs for virtual screening against breast cancer targets [61]. |
| PLS Regression | A statistical method used in 3D-QSAR to correlate a large number of correlated descriptors (molecular fields) with biological activity [61] [72] [73]. | Building the predictive QSAR model for flavone analogs as tankyrase inhibitors [75]. |
The pursuit of therapeutics for "undruggable" oncology targets represents a frontier in cancer drug discovery. These targets, often lacking well-defined binding pockets for small molecules, include key transcription factors and oncogenic proteins critical for tumor progression [76]. This application note details a successful strategy combining advanced Activity Atlas modeling for Structure-Activity Relationship (SAR) analysis with a novel peptide-based screening platform to target the cJun transcription factor, a historically challenging oncoprotein [77].
Activity Atlas is a powerful, Bayesian-based method for extracting key steric and electronic insights from noisy or limited assay data, providing a 3D qualitative visualization of SAR [2]. Its application is particularly valuable when structural data is insufficient for predictive quantitative models, allowing researchers to identify critical features correlating with higher biological activity [2]. When integrated with novel screening techniques, this approach enables the rational design of inhibitors against previously intractable targets.
Target Background: The cJun Oncoprotein
cJun is a transcription factor that acts as a master regulator of gene expression. It functions as a homodimer or as a heterodimer with other proteins (e.g., cFos), forming the Activator Protein 1 (AP1) complex. This complex binds to specific DNA sequences, driving the expression of genes involved in cell proliferation and survival [77]. Overactivity of cJun is a known driver in multiple cancers, promoting uncontrolled cell growth. However, its flat, featureless protein-protein interaction surfaces and nuclear localization have made it a classic "undruggable" target for conventional small-molecule drugs [77].
Figure 1: cJun Signaling and Inhibition Pathway. The cJun transcription factor drives cancer progression by promoting cell proliferation and survival. The designed peptide inhibitor blocks the critical dimerization step.
Experimental Workflow & Protocol
The following section outlines the integrated protocol combining cellular screening with computational SAR analysis to identify and optimize irreversible cJun inhibitors.
Protocol: Transcription Block Survival (TBS) Assay for Primary Screening
The TBS assay is a positive survival screen designed to identify inhibitors of specific transcription factors within a cellular environment [77].
3.1.1 Key Materials and Reagents
Table 1: Essential Research Reagents for TBS Assay
| Reagent/Material | Function/Description |
|---|---|
| cJun-dependent Cell Line | Engineered cells with cJun binding sites inserted into an essential gene. |
| Peptide Library | A vast library of peptides for screening potential cJun inhibitors. |
| Cell Culture Media | Standard media for maintaining cell viability and proliferation. |
| Selection Antibiotic | (e.g., Puromycin) Selective pressure to maintain engineered genetic construct. |
| Cell Viability Assay Kit | (e.g., MTT, Resazurin) To quantitatively measure cell survival post-screening. |
3.1.2 Step-by-Step Procedure
- Cell Line Engineering: Generate a stable cell line by integrating binding sites for the cJun transcription factor into the promoter region of a gene essential for cell survival (e.g., a housekeeping gene).
- Cell Seeding: Plate the engineered cells in multi-well plates at a density optimized for growth and treatment.
- Peptide Library Transfection/Treatment: Introduce the diverse peptide library into the cells using a suitable transfection reagent or cell-penetrating peptide tag.
- Incubation and Selection: Allow cells to incubate for a predetermined period (e.g., 24-72 hours) to enable peptide-cJun interaction and subsequent effects on the essential gene.
- Survival Outcome Analysis:
- If cJun is active and not blocked, it binds to the essential gene and inhibits its expression, leading to cell death.
- If a peptide successfully blocks cJun, the essential gene is expressed, and the cell survives.
- Hit Identification: Identify "hit" peptides by selecting wells that show significant cell survival compared to negative controls. These surviving cells harbor the potential cJun inhibitors.
Protocol: SAR Analysis & Irreversible Inhibitor Design
Following the identification of initial reversible peptide hits from the TBS assay, this protocol details the optimization process using Activity Atlas models.
3.2.1 Key Materials and Software
Table 2: Key Resources for Computational SAR Analysis
| Resource | Function/Description |
|---|---|
| Forge Software (V6.0 or higher) | Platform for 3D-QSAR, Activity Atlas, and Activity Miner analyses [2] [67]. |
| Structural Data of cJun | PDB file of cJun (or homologous structure) for binding site analysis. |
| Dataset of Analogues | Structures and activity data (e.g., IC50, survival %) of initial hits and synthesized analogues. |
| Molecular Modeling Suite | (e.g., Chem3D) For structure preparation, energy minimization, and conformation hunting [67]. |
3.2.2 Step-by-Step Procedure
- Data Set Curation and Conformation Generation:
- Collect structures and experimental activity data (from TBS assay) for all active and inactive peptide analogues.
- Prepare 3D structures using a molecular modeling suite. Generate a multi-conformer set for each molecule to represent flexible states [67].
- Molecular Alignment:
- Align all molecules in the dataset to a common template, such as the most active peptide or a pharmacophore hypothesis derived from the active compounds. This creates a consistent 3D frame of reference [67].
- Activity Atlas Model Generation:
- Input the aligned dataset into the Activity Atlas module in Forge.
- The software uses a Bayesian approach to analyze pairwise 3D molecular field comparisons (electrostatics and sterics) across the dataset [2].
- It identifies "activity cliffs" – regions in 3D space where small structural changes between similar molecules lead to large activity differences.
- Interpretation and Hypothesis Generation:
- The model outputs 3D maps visualizing regions where specific steric bulk or electrostatic properties are favorable or unfavorable for activity.
- Analyze these maps to understand the key interactions required for binding to cJun and inhibiting its function [2].
- Design of Irreversible Inhibitors:
- Based on the SAR insights, select a high-affinity reversible peptide hit for optimization.
- Identify a specific amino acid residue on the peptide that is predicted to be in close proximity to a nucleophilic amino acid (e.g., Cysteine) on the cJun protein surface.
- Chemically modify this residue to incorporate an electrophilic "warhead" (e.g., an acrylamide) capable of forming a permanent covalent bond with the target on cJun [77].
- Validation: Synthesize the designed irreversible inhibitor and test it in the TBS assay and secondary assays to confirm enhanced, irreversible activity and selectivity.
Figure 2: Integrated Drug Discovery Workflow. The process begins with cellular screening, moves through computational SAR analysis, and culminates in the rational design and validation of an irreversible therapeutic.
Key Findings and Data Analysis
Application of the above protocols led to the successful identification and optimization of a novel cJun inhibitor.
Primary Screening Outcome
The TBS assay successfully screened a large peptide library and identified initial hits that allowed cell survival by blocking cJun activity, demonstrating direct in-cell activity and low toxicity [77].
SAR Analysis and Irreversible Inhibitor Profile
The Activity Atlas model revealed critical steric and electrostatic constraints for binding. The designed irreversible peptide inhibitor, derived from the primary hit, exhibited the following optimized properties:
Table 3: Profile of Optimized Irreversible cJun Inhibitor
| Parameter | Result/Value | Notes/Method |
|---|---|---|
| Mechanism of Action | Irreversible covalent binding | Binds to one half of cJun, preventing dimerization and DNA binding [77]. |
| Cell Permeability | Demonstrated | Confirmed by intracellular activity in TBS assay [77]. |
| Target Selectivity | Selective for cJun | Validated in counter-screens against related transcription factors [77]. |
| In-cell Efficacy | High | Restored activity of the essential gene, leading to cell survival in the TBS assay [77]. |
| Cellular Toxicity | Low (in vitro) | The screening platform inherently checks for toxicity; survival indicates low off-target effects [77]. |
This case study demonstrates a viable pipeline for targeting "undruggable" oncology targets like cJun. The key to success was the integration of a functional cellular screen (TBS assay) with advanced 3D-SAR analysis via Activity Atlas models.
The TBS assay provided the critical initial dataset of active peptides directly within a relevant cellular context, overcoming challenges of cell permeability and off-target toxicity early in the discovery process [77]. Subsequent analysis using Activity Atlas allowed researchers to move beyond simple structure-activity tables [78] and visualize the 3D chemical features essential for activity, guiding the rational design of a highly effective irreversible inhibitor [2].
The resulting peptide inhibitor acts as a "harpoon," binding cJun tightly and permanently, a significant advancement over previous reversible inhibitors [77]. This workflow, combining phenotypic screening with robust computational SAR, provides a powerful blueprint for the drug discovery community to expand the scope of druggable targets in oncology and beyond. Future work will focus on validating efficacy in preclinical cancer models.
In oncology drug discovery, the transition from a computational model to a validated therapeutic hypothesis hinges on a critical step: establishing a statistically robust correlation between predicted and experimental activity. For Activity-Atlas models used in Structure-Activity Relationship (SAR) analysis, validation against binding affinity measurements—most commonly the inhibition constant (Ki) and half-maximal inhibitory concentration (IC50)—is paramount. Quantitative validation ensures that the model's insights into electrostatic, hydrophobic, and steric drivers of activity are not only interpretable but also predictive of real-world biological effects [9] [1]. This application note details the protocols and analytical frameworks for correlating Activity-Atlas model outputs with experimental Ki and IC50 values, providing a rigorous methodology for oncology researchers to benchmark their computational findings.
Quantitative Correlation of Model Predictions with Experimental Data
The ultimate test of an Activity-Atlas model's utility in lead optimization is its ability to accurately predict quantitative binding affinities. Validating this predictive power requires a direct comparison of computational outputs with experimental potency data.
Table 1: Performance Metrics for Validated (Q)SAR Models
| Model Type | Endpoint | Balanced Accuracy | R² | RMSE | Key Application |
|---|---|---|---|---|---|
| Qualitative SAR Model [50] | Ki | 0.80 | - | - | Classification of active/inactive compounds |
| Qualitative SAR Model [50] | IC50 | 0.81 | - | - | Classification of active/inactive compounds |
| Quantitative QSAR Model [50] | Ki | 0.73 | 0.64 | 0.77 | Prediction of continuous affinity values |
| Quantitative QSAR Model [50] | IC50 | 0.73 | 0.59 | 0.73 | Prediction of continuous affinity values |
| 3D-QSAR Model (PLS) [12] | IC50 (MCF-7) | - | 0.92 (r²), 0.75 (q²) | - | Anticancer activity of Maslinic acid analogs |
A study creating models for 30 antitargets demonstrated that while qualitative SAR models showed high balanced accuracy in classifying actives versus inactives, quantitative QSAR models provided direct, though slightly less accurate, predictions of affinity values [50]. This underscores the importance of selecting the right model type based on the research objective—classification for triaging compounds versus regression for predicting precise potency.
For covalent inhibitors, a specialized understanding of IC50 is required. Unlike reversible inhibitors, the IC50 value for a covalent inhibitor is time-dependent, as it reflects the rate of enzyme inactivation [79]. Under carefully controlled conditions with long incubation times (>1 hour) and physiological substrate concentrations, a strong correlation can be established between the time-dependent IC50 and the time-independent second-order rate constant kinact/Ki, which is the true measure of covalent inhibitor potency [79]. This relationship allows medicinal chemists to use IC50 values for efficient SAR optimization in covalent inhibitor programs.
Figure 1: Workflow for correlating Activity-Atlas models with experimental binding data. This protocol ensures systematic validation of computational predictions.
Experimental Protocols for Key Assays
Protocol A: Determining IC50 Values in a Cell-Based Assay
Principle: This protocol measures the concentration of a test compound that reduces a specific cellular response (e.g., cell viability or a pathway readout) by 50% under defined conditions. It is widely used for functional characterization of anticancer compounds [12].
Workflow:
- Cell Seeding: Plate oncology-relevant cell lines (e.g., MCF-7 for breast cancer) in 96-well or 384-well plates at a density that ensures exponential growth throughout the assay period. Incubate for 24 hours.
- Compound Treatment: Prepare a serial dilution of the test compound (typically a 3-fold or 10-fold dilution series across 8-12 concentrations). Add the compound to the cells. Include a negative control (vehicle only) and a positive control (a known cytotoxic agent).
- Incubation: Incubate the compound with the cells for a fixed period, typically 48-72 hours, at 37°C and 5% CO₂. For covalent inhibitors, the incubation time must be carefully controlled and reported, as IC50 is time-dependent [79].
- Viability Measurement: a. Add a cell viability reagent like MTT or PrestoBlue to each well. b. Incubate for 1-4 hours as per manufacturer's instructions. c. Measure the absorbance or fluorescence using a plate reader.
- Data Analysis:
a. Calculate the percentage viability for each well relative to the negative control.
b. Fit the dose-response data to a four-parameter logistic (4PL) model using software like GraphPad Prism:
Y = Bottom + (Top - Bottom) / (1 + 10^((LogIC50 - X) * HillSlope))c. The IC50 is the X value when Y is halfway between Bottom and Top.
Protocol B: Determining Ki Values in an Enzyme Inhibition Assay
Principle: This protocol determines the equilibrium dissociation constant for an enzyme-inhibitor complex (Ki), providing a direct measure of binding affinity that is, for reversible inhibitors, independent of assay time and substrate concentration.
Workflow:
- Reaction Setup: Prepare a master mix containing the enzyme (e.g., a purified kinase) in an appropriate reaction buffer.
- Inhibitor Pre-incubation: Distribute the master mix into tubes containing a range of inhibitor concentrations (including a zero-inhibitor control) and pre-incubate for a fixed time (e.g., 15 minutes) to allow equilibrium binding.
- Reaction Initiation: Start the enzymatic reaction by adding the substrate. The substrate concentration is critical and should be around its Km value for most accurate Ki determination.
- Initial Rate Measurement: Monitor the formation of product or consumption of substrate continuously (e.g., via spectrophotometry or fluorescence) for a short period to determine the initial velocity (v) of the reaction at each inhibitor concentration.
- Data Analysis:
a. Plot the initial velocity (v) versus substrate concentration ([S]) for each inhibitor concentration ([I]).
b. Fit the data globally to the Michaelis-Menten equation for competitive inhibition:
v = (Vmax * [S]) / (K_m * (1 + [I]/K_i) + [S])c. The analysis yields the apparent Km, which increases with [I], allowing for the calculation of the Ki value.
The Scientist's Toolkit: Essential Research Reagents and Materials
Table 2: Key Research Reagent Solutions for Correlation Studies
| Item | Function/Description | Example Application in Protocol |
|---|---|---|
| Forge/Flare Software [9] [1] | Platform for Activity-Atlas model generation, 3D-QSAR, and SAR analysis using field point descriptors. | Generating predictive models and activity cliff summaries for oncology targets. |
| Caliper LabChip System [79] | Technology used for rapid, precise IC50 determination in enzyme assays via mobility shift assays. | End-point enzyme assays for covalent inhibitor programs (e.g., JAK3). |
| pIC50/pKi Values [50] [12] | The negative logarithm of IC50 or Ki; used as the dependent variable in QSAR models to normalize data. | Creating reliable and predictive 3D-QSAR and other statistical models. |
| ZINC Database [12] | A free public repository of commercially available compounds for virtual screening. | Sourcing potential inhibitor analogs based on Tanimoto similarity for experimental testing. |
| ChEMBL Database [50] | A manually curated database of bioactive molecules with drug-like properties and associated assay data. | Extracting structures and experimental Ki/IC50 values to build training and test sets for model development. |
Establishing a rigorous correlation between Activity-Atlas model predictions and experimental Ki and IC50 data is a non-negotiable step in de-risking oncology drug discovery. By adhering to the standardized protocols for experimental validation outlined here—including the critical distinctions for covalent inhibitors—researchers can transform their computational models from insightful visualizations into powerful, predictive tools. This integrated approach ensures that SAR analysis is grounded in experimental reality, thereby accelerating the rational design of potent and selective oncology therapeutics.
The pursuit of effective oncology therapeutics relies heavily on a deep understanding of the molecular interactions between drug candidates and their protein targets. X-ray crystallography has long served as a cornerstone technique in structural biology, providing atomic-resolution snapshots of these interactions [80]. However, when applied in isolation to drug discovery, this structural information often lacks the explicit chemical context needed to guide efficient lead optimization in medicinal chemistry.
This application note details a robust methodology for integrating X-ray crystallographic data with Activity Atlas modeling, a advanced three-dimensional quantitative structure-activity relationship (3D-QSAR) approach. This integration creates a powerful synergy, where structural data provides a reliable biological framework and ligand-based modeling extracts critical electrostatic and steric determinants of biological activity from existing structure-activity relationship (SAR) data [2] [9]. When framed within oncology research, this combined protocol enables researchers to generate testable hypotheses for improving compound potency and selectivity against challenging cancer targets, particularly those with limited structural information or complex assay profiles.
Scientific Background and Rationale
The Role of X-ray Crystallography in Drug Discovery
X-ray macromolecular crystallography (MX) is an indispensable technique that yields atomic-resolution structures of biological macromolecules, including protein-ligand complexes [80]. In oncology drug discovery, determining the structure of a therapeutic target (e.g., a kinase, protease, or nuclear receptor) in complex with a small-molecule inhibitor provides invaluable insights. These structures:
- Define binding pocket architecture and key molecular interactions
- Reveal ligand binding modes and conformational changes in the protein
- Identify water-mediated interactions and structural water molecules
- Guide rational drug design by highlighting regions for chemical modification
Modern structural biology leverages synchrotron sources and advanced detectors to rapidly generate high-quality structural data, often as part of iterative drug design cycles [81] [80]. However, structural data alone cannot fully explain subtle SAR trends, especially for structurally similar compounds with significantly different biological activities.
Activity Atlas Modeling for SAR Analysis
Activity Atlas is a Bayesian probabilistic method that extracts key insights from SAR data by analyzing molecular fields—electrostatics, shape, and hydrophobics—of aligned compound sets [2] [1]. This approach is particularly valuable for:
- Visualizing activity cliffs where small structural changes cause significant activity differences
- Mapping favorable/unfavorable regions for steric bulk and specific electrostatic properties
- Identifying non-intuitive molecular features that correlate with high activity [9]
- Generating qualitative models even from noisy or complex assay data [2]
In oncology research, where targets often involve complex signaling pathways and resistance mechanisms, Activity Atlas provides a means to interpret SAR against multiple endpoints or in different cellular contexts [82].
Synergistic Integration for Oncology Targets
The integration of these approaches addresses limitations of either method in isolation. X-ray crystallography provides the structural validation for ligand alignments used in Activity Atlas, while the molecular field analysis offers chemical insights that extend beyond a single static structure [9]. This is particularly relevant for:
- Ion channel targets with few ligand-bound structures [2]
- Conformational flexibility and allosteric binding sites
- Differential activity across related cancer cell lines or assay conditions [67] [12]
- Targets with limited structural data, where ligand-based approaches complement homology models
This protocol outlines how to formally integrate these complementary methodologies to accelerate oncology drug discovery.
Experimental Protocol
Prerequisites and Software Requirements
| Category | Specific Tools/Requirements |
|---|---|
| Structural Biology | X-ray crystallography system (e.g., synchrotron access), CCP4 suite, Coot, PDB structure of target |
| Molecular Modeling | Forge/Flare software (Cresset), chemoinformatics toolkit |
| Compound Data | Curated SAR dataset with biological activities (IC50, Ki, etc.), compound structures |
| Computational Resources | Workstation with GPU acceleration, 16+ GB RAM |
Step 1: Protein Structure Preparation and Validation
Objective: Prepare a high-quality protein structure for use as a reference in molecular alignment and analysis.
Retrieve X-ray Crystal Structure
- Source the target protein structure from the Protein Data Bank (PDB)
- Prioritize structures with:
- High resolution (preferably <2.5 Å)
- Relevant ligands (inhibitors, substrates, or co-factors)
- Complete residues in the binding site region
- For oncology targets, consider structures with oncology-relevant ligands or mutant forms relevant to cancer [82]
Structure Preparation and Optimization
- Add missing hydrogen atoms and correct protonation states at physiological pH
- Address missing side chains or loops using modeling software
- Optimize hydrogen bonding networks and remove structural clashes
- Retain critical crystallographic water molecules that mediate ligand interactions
Binding Site Analysis
- Define the binding pocket based on the co-crystallized ligand location
- Characterize key hydrophobic regions, hydrogen bond donors/acceptors, and charged residues
- Document relevant protein-ligand interactions for later correlation with SAR
Step 2: Compound Dataset Curation and Alignment
Objective: Prepare and align a diverse set of compounds with known biological activities to the crystallographically determined binding mode.
SAR Data Collection
- Compile compounds with consistent biological data (e.g., IC50 values against a specific cancer cell line or target)
- Include structural diversity while maintaining a common core scaffold
- Convert activity values to pIC50 (-logIC50) for QSAR analysis
- Divide compounds into training and test sets using activity-stratified selection [12]
Compound Structure Preparation
- Generate realistic tautomers and protonation states at physiological pH
- Perform conformational analysis to identify low-energy conformers
- Ensure stereochemistry is correctly specified for all chiral centers
3D Alignment to Template
Step 3: Activity Atlas Model Generation
*Objective: * Create 3D models that visualize the SAR as molecular fields to guide design.
Molecular Field Calculation
- Calculate electrostatic fields using extended electron distribution (XED) force field
- Compute shape and hydrophobic fields for all aligned compounds
- Set appropriate field sampling resolution (typically 0.5-1.0 Å grid spacing)
Bayesian Model Building
- Apply Bayesian approach to identify field features correlating with high activity
- Generate activity cliff summary maps highlighting regions where small changes cause large activity differences
- Create average of actives maps showing common features of highly active compounds
Model Validation
- Assess model quality using cross-validation (e.g., leave-one-out q²)
- Validate predictions using the test set compounds not included in model building
- Ensure model robustness through y-scrambling or other validation techniques [12]
Step 4: Integration and Interpretation
Objective: Correlate Activity Atlas results with structural features from crystallography to generate design hypotheses.
Structural Correlation Analysis
- Map Activity Atlas fields onto the protein binding site surface
- Identify complementarity between ligand fields and protein interaction potentials
- Explain activity cliffs through steric clashes or electrostatic mismatches with the protein
Design Hypothesis Generation
- Propose specific structural modifications based on combined analysis
- Prioritize R-group explorations indicated by favorable Activity Atlas regions
- Identify synthetic targets that address both activity and physicochemical properties
Case Study: Application to RIPK1 Inhibitors for Oncology
Background and Objectives
Receptor-interacting serine/threonine-protein kinase 1 (RIPK1) has emerged as a promising therapeutic target for inflammatory diseases and certain cancers [9]. This case study demonstrates the integration of X-ray crystallography and Activity Atlas to understand the SAR of benzoxazepinone RIPK1 inhibitors and guide optimization efforts.
Experimental Setup
| Parameter | Details |
|---|---|
| X-ray Structure | PDB ID: 5HX6 (RIPK1 with GSK'481 inhibitor) |
| SAR Dataset | 46 compounds with pIC50 values ranging from 4.9 to 10.3 |
| Alignment Method | Maximum Common Substructure using crystallographic pose |
| Activity Atlas Settings | Normal model building conditions, shape and electrostatic fields |
Results and Key Insights
Steric Constraints Analysis
- Activity Atlas shape maps revealed that small substituents on the lactam amide increased activity, while larger groups caused dramatic activity loss [9]
- This correlated perfectly with the tight binding pocket observed in the crystal structure, explaining the steep steric SAR
Electrostatic Complementarity
- Activity Atlas electrostatics maps showed well-defined regions favoring negative electrostatics near the amide carbonyl and positive electrostatics around the heteroaromatic ring
- Protein Interaction Potentials (PIPs) analysis confirmed complementarity between these ligand fields and the RIPK1 active site electrostatics [9]
Hydrophobic Mappings
- Activity Atlas hydrophobics maps indicated detrimental effects of hydrophobic character around the heterocyclic ring system
- This aligned with the hydrophilic nature of the corresponding protein region, as confirmed by the protein surface analysis [9]
Impact on Design Strategy
The integrated analysis enabled:
- Rationalization of heterocycle SAR based on electrostatic complementarity
- Targeted exploration of limited substituents on the lactam nitrogen
- Identification of favorable regions for introducing solubilizing groups without potency loss
Research Reagent Solutions
| Reagent/Resource | Function/Application | Example Sources/Platforms |
|---|---|---|
| Forge/Flare Software | Activity Atlas model generation, molecular field calculations, 3D-QSAR | Cresset |
| CCP4 Suite | X-ray crystallography data processing, structure solution, refinement | Collaborative Computational Project No. 4 |
| Coot | Protein model building, validation, and ligand fitting | Paul Emsley Group (MRC LMB) |
| Protein Data Bank | Repository for 3D structural data of proteins and nucleic acids | Worldwide PDB (wwPDB) |
| ZINC Database | Source of commercially available compounds for virtual screening | Irwin and Shoichet Laboratory, UCSF |
| Synchrotron Beamlines | High-intensity X-ray sources for macromolecular crystallography | Advanced Light Source, Advanced Photon Source, NSLS-II |
Visualizing the Integrated Workflow
The following diagram illustrates the synergistic relationship between X-ray crystallography and Activity Atlas modeling in the drug optimization cycle:
Integrated Workflow for Drug Optimization
This workflow demonstrates the iterative cycle where structural biology and computational modeling inform each other to accelerate compound optimization.
Troubleshooting and Optimization
Common Challenges and Solutions
| Challenge | Potential Cause | Solution |
|---|---|---|
| Poor Model Statistics (low q²) | Incorrect compound alignment or noisy biological data | Manually inspect and correct alignments; curate SAR data for consistency |
| Inconsistent Predictions | Inadequate representation of chemical space in training set | Expand training set to cover key regions of chemical space; ensure activity range representation |
| Structural Mismatches | Protein flexibility or induced fit not captured in single structure | Use multiple crystal structures if available; consider ensemble docking approaches |
| Activity Cliffs Not Captured | Insufficient field resolution or inadequate cliff examples | Increase sampling density; ensure activity cliffs are represented in dataset |
Best Practices for Optimal Results
Data Quality Assurance
- Use consistent biological assays for SAR data generation
- Verify compound purity and identity for all assayed compounds
- Employ appropriate positive controls in biological assays
Computational Parameters
- Use systematic conformational sampling for flexible compounds
- Apply consistent partial charge methods across all compounds
- Validate alignment quality through visual inspection and statistical measures
Model Interpretation
- Consider both statistical significance and chemical intuition when interpreting models
- Use multiple visualization angles to fully understand 3D field maps
- Correlate field features with specific chemical groups in representative compounds
The integration of X-ray crystallography with Activity Atlas modeling represents a powerful paradigm for oncology drug discovery. This approach combines the structural precision of crystallography with the chemical intelligence derived from SAR analysis, providing a more comprehensive framework for lead optimization than either method alone.
The protocol outlined in this application note enables researchers to:
- Leverage structural biology investments more effectively for chemical design
- Extract maximum information from existing SAR data
- Generate testable hypotheses for compound optimization
- Accelerate the design-make-test cycle for oncology drug candidates
As structural biology continues to evolve with advances in cryo-EM, XFELs, and computational prediction tools like AlphaFold [81], the integration of high-quality structural data with sophisticated SAR analysis methods will become increasingly important for addressing the challenging targets in oncology. The methodology described here provides a robust foundation for this integrated approach, with specific relevance to the development of targeted therapies in precision oncology [82].
Conclusion
Activity Atlas models represent a powerful and versatile tool for translating complex oncology SAR data into actionable, visual 3D insights. By systematically understanding their foundations, meticulously applying methodological best practices, proactively troubleshooting common issues, and rigorously validating outcomes, researchers can significantly accelerate the design of novel, potent, and selective anticancer agents. Future directions will likely involve deeper integration with AI and machine learning for automated model refinement, expanded application in drug combination studies, and broader use in personalizing cancer therapies by predicting patient-specific drug responses. The continued evolution of this methodology promises to play a critical role in overcoming the challenges of drug resistance and targeting the undruggable in oncology.
References
- 1. "Activity Atlas: A New Tool for Ion Channel Drug Discovery" [https://www.linkedin.com/posts/zastrain_activityatlas-3dsar-ionchannels-activity-7364147138689163266-dswC]
- 2. Activity Atlas: A highly efficient method to extract key insights ... [https://cresset-group.com/about/news/activity-atlas-a-highly-efficient-method-to-extract-key-insights-from-sar/]
- 3. T009 · Ligand-based pharmacophores — TeachOpenCADD... [https://projects.volkamerlab.org/teachopencadd/talktorials/T009_compound_ensemble_pharmacophores.html]
- 4. Pharmacophore-oriented 3D molecular generation toward ... [https://www.nature.com/articles/s43588-025-00850-5]
- 5. Pharmacophore model guided 3D molecular generation ... [https://chemrxiv.org/engage/chemrxiv/article-details/68d9f3723e708a7649ba89ba]
- 6. PharmaCore: The Automatic Generation of 3D Structure ... [https://pubmed.ncbi.nlm.nih.gov/38728062/]
- 7. [2409.06316] PharmacoMatch: Efficient 3 ... D Pharmacophore [https://arxiv.org/abs/2409.06316]
- 8. Flare Activity Atlas™ | Cresset [https://cresset-group.com/software/activityatlas/]
- 9. Investigating the SAR of RIPK1 inhibitors [https://www.massbio.org/news/member-news/investigating-the-sar-of-ripk1-inhibitors/]
- 10. Structure-Activity Relationship Studies Based on 3D-QSAR ... [https://pmc.ncbi.nlm.nih.gov/articles/PMC9698756/]
- 11. Investigating the SAR of RIPK1 inhibitors - Cresset Group [https://cresset-group.com/science/science-resources/sar-ripk1-inhibitors/]
- 12. 3D-QSAR studies on Maslinic acid analogs for Anticancer ... [https://www.nature.com/articles/s41598-017-06131-0]
- 13. Structure–Activity Relationship and Molecular Docking of ... [https://pmc.ncbi.nlm.nih.gov/articles/PMC6100528/]
- 14. Molecular Shape Analysis-Guided Virtual Screening Platform ... [https://pmc.ncbi.nlm.nih.gov/articles/PMC4954751/]
- 15. The combination of multi-approach studies to explore ... [https://www.frontiersin.org/journals/chemistry/articles/10.3389/fchem.2023.1197665/full]
- 16. Synthetic Aperture Radar (SAR) [https://www.earthdata.nasa.gov/learn/earth-observation-data-basics/sar]
- 17. QSAR Toolbox [https://qsartoolbox.org/]
- 18. Structure Data for Analysis [https://help.tableau.com/current/pro/desktop/en-us/data_structure_for_analysis.htm]
- 19. Chemistry-intuitive explanation of graph neural networks ... [https://www.nature.com/articles/s41467-023-38192-3]
- 20. Artificial intelligence in cancer: applications, challenges, and ... [https://pmc.ncbi.nlm.nih.gov/articles/PMC12574039/]
- 21. Unveiling Calotropis procera's promising wound healing ... [https://www.nature.com/articles/s41598-025-06822-z]
- 22. Optimizing drug design by merging generative AI with a ... [https://www.nature.com/articles/s42004-025-01635-7]
- 23. Homepage - Bioactive Conformational Ensemble [https://mmb.irbbarcelona.org/BCE/]
- 24. PEPCONF, a diverse data set of peptide conformational ... [https://www.nature.com/articles/sdata2018310]
- 25. 3D flexible alignment using 2D maximum common ... [https://pubmed.ncbi.nlm.nih.gov/24895842/]
- 26. BCL::MolAlign: Three-Dimensional Small Molecule Alignment ... [https://pmc.ncbi.nlm.nih.gov/articles/PMC6598199/]
- 27. Maximum common property: a new approach for molecular ... [https://jcheminf.biomedcentral.com/articles/10.1186/s13321-020-00462-3]
- 28. Recent advances in molecular representation methods and ... [https://www.nature.com/articles/s44386-025-00017-2]
- 29. Natural-product-inspired potent anticancer congeners ... [https://www.sciencedirect.com/science/article/abs/pii/S0968089625003335]
- 30. recent developments in synthesis, activity, and SAR analysis [https://pubs.rsc.org/en/content/articlelanding/2025/ra/d5ra01077b]
- 31. recent developments in synthesis, activity, and SAR analysis [https://pubmed.ncbi.nlm.nih.gov/40463335/]
- 32. A novel integrative computational framework for breast ... [https://www.sciencedirect.com/science/article/pii/S2001037022001878]
- 33. Use of Bayesian approaches in oncology clinical trials [https://www.frontiersin.org/journals/pharmacology/articles/10.3389/fphar.2025.1548997/full]
- 34. Practical Bayesian Guidelines for Small Randomized ... [https://www.mdpi.com/2072-6694/17/12/1902]
- 35. Cancer Atlas Offers a Roadmap to Detecting Tumors Earlier ... [https://coe.gatech.edu/news/2025/10/cancer-atlas-offers-roadmap-detecting-tumors-earlier-ever]
- 36. Impact of intracellular ion channels on cancer development ... [https://pmc.ncbi.nlm.nih.gov/articles/PMC5045486/]
- 37. Contribution of Mitochondrial Ion Channels to Chemo- ... [https://www.mdpi.com/2072-6694/11/6/761]
- 38. Kinase Atlas: Druggability Analysis of Potential Allosteric ... [https://pmc.ncbi.nlm.nih.gov/articles/PMC7019049/]
- 39. A Comprehensive Oncological Biomarker Framework Guiding ... [https://pmc.ncbi.nlm.nih.gov/articles/PMC12466961/]
- 40. An atlas of substrate specificities for the human serine ... [https://www.nature.com/articles/s41586-022-05575-3]
- 41. In Silico Analysis of Ion Channels and Their Correlation with ... [https://pmc.ncbi.nlm.nih.gov/articles/PMC8946083/]
- 42. Integration of Lead Discovery Tactics and the Evolution ... [https://www.sciencedirect.com/science/article/pii/S2472555222069143]
- 43. An artificial intelligence accelerated virtual screening ... [https://www.nature.com/articles/s41467-024-52061-7]
- 44. Hit Identification and Optimization in Virtual Screening [https://pmc.ncbi.nlm.nih.gov/articles/PMC3772997/]
- 45. Drug Design Software Flare - Cresset Group [https://cresset-group.com/software/flare/]
- 46. Lead Optimization - UF Health Cancer Center [https://cancer.ufl.edu/research/supported-shared-resources/other-supported-resources/drug-design-core/lead-optimization/]
- 47. Integrating artificial intelligence into small molecule ... [https://www.nature.com/articles/s44386-025-00029-y]
- 48. From Lab to Clinic: How Artificial Intelligence (AI) Is ... [https://pmc.ncbi.nlm.nih.gov/articles/PMC12298131/]
- 49. pFlexAna: detecting conformational changes in remotely ... [https://pmc.ncbi.nlm.nih.gov/articles/PMC2447781/]
- 50. Comparison of Quantitative and Qualitative (Q)SAR Models ... [https://pmc.ncbi.nlm.nih.gov/articles/PMC6192375/]
- 51. Computational methods for analyzing conformational ... [https://www.sciencedirect.com/science/article/abs/pii/S0959440X16302445]
- 52. Presenting Quantitative Data Graphically [https://courses.lumenlearning.com/waymakermath4libarts/chapter/presenting-quantitative-data-graphically/]
- 53. Presentation of Quantitative Data [https://ihatepsm.com/blog/presentation-quantitative-data]
- 54. Enhancing the confidence of potential targets enriched by ... [https://pmc.ncbi.nlm.nih.gov/articles/PMC12370643/]
- 55. Advancing Design Strategy of PROTACs for Cancer Therapy [https://pmc.ncbi.nlm.nih.gov/articles/PMC12188103/]
- 56. Integrating single-cell regulatory atlas and multi-omics data ... [https://www.frontiersin.org/journals/oncology/articles/10.3389/fonc.2025.1585574/full]
- 57. 8 Simple Techniques to Prevent Overfitting [https://towardsdatascience.com/8-simple-techniques-to-prevent-overfitting-4d443da2ef7d/]
- 58. A machine learning approach for multimodal data fusion ... [https://www.nature.com/articles/s41698-025-00917-6]
- 59. Mapping how cancers form and spread [https://www.nih.gov/news-events/nih-research-matters/mapping-how-cancers-form-spread]
- 60. Ultra-precise 3D maps of cancer cells unlock secrets ... [https://www.nature.com/articles/d41586-024-03539-3]
- 61. 3D-QSAR studies on Maslinic acid analogs for Anticancer ... [https://pmc.ncbi.nlm.nih.gov/articles/PMC5519539/]
- 62. Machine Learning in Drug Discovery Market 2025 Trends [https://www.towardshealthcare.com/insights/machine-learning-in-drug-discovery-market-sizing]
- 63. The fundamentals of real-time machine learning [https://quix.io/blog/fundamentals-real-time-machine-learning]
- 64. Cancer Multi-Omics Database for Machine Learning [https://www.nature.com/articles/s41597-025-05235-x]
- 65. Automatic specific absorption rate (SAR) prediction for ... [https://pubmed.ncbi.nlm.nih.gov/40922671/]
- 66. Novel machine-learning algorithm creates atlas of cancer ... [https://www.sickkids.ca/en/news/archive/2023/novel-machine-learning-algorithm-creates-atlas-of-cancer-with-potential-as-universal-diagnostic-platform/]
- 67. The combination of multi-approach studies to explore ... [https://pmc.ncbi.nlm.nih.gov/articles/PMC10335751/]
- 68. Development and Validation of a Reporter-Cell-Line-Based ... [https://pmc.ncbi.nlm.nih.gov/articles/PMC6864625/]
- 69. Reporter gene systems for the identification and ... [https://pmc.ncbi.nlm.nih.gov/articles/PMC8316869/]
- 70. Comparative analysis of 2D and 3D tumor models for drug ... [https://www.nature.com/articles/srep28951]
- 71. Computational transformation in drug discovery: A ... [https://www.sciencedirect.com/science/article/pii/S2949866X24000340]
- 72. Predicting Biological Activities through QSAR Analysis and ... [https://pmc.ncbi.nlm.nih.gov/articles/PMC3445294/]
- 73. Beginner's Guide to 3D-QSAR in Drug Design [https://neovarsity.org/blogs/beginners-guide-3d-qsar-drug-design]
- 74. Field-Template, QSAR, Ensemble Molecular Docking, and ... [https://pmc.ncbi.nlm.nih.gov/articles/PMC7916619/]
- 75. 3D-QSAR, Docking, ADME/Tox studies on Flavone ... [https://www.nature.com/articles/s41598-019-41984-7]
- 76. MYC as a Target for Cancer Treatment: from Undruggable ... [https://pubmed.ncbi.nlm.nih.gov/40815489/]
- 77. Promising drug candidates for previously 'undruggable' target [https://www.ddw-online.com/promising-drug-candidates-for-previously-undruggable-cancer-target-34106-202503/]
- 78. SAR | Structure Activity Relationships [https://www.collaborativedrug.com/cdd-blog/what-is-sar]
- 79. The advantages of describing covalent inhibitor in vitro ... [https://www.sciencedirect.com/science/article/abs/pii/S0968089620306957]
- 80. X-Ray Macromolecular Crystallography [https://www.berstructuralbioportal.org/x-ray-macromolecular-crystallography/]
- 81. Making the most of an abundance of data - IUCr Journals [https://journals.iucr.org/d/issues/2025/01/00/me6309/]
- 82. Precision Oncology Comes of Age: Designing Best-in-Class ... [https://pmc.ncbi.nlm.nih.gov/articles/PMC10551669/]